
Archived: Air Pollutant Emission Inventory report: chapter 2.6
2.6 Ammonia (NH3)
In 2016, approximately 492 kt of NH3 were released in Canada (Table 2-8). NH3 emissions originated primarily from agriculture, which accounted for 94% (460 kt) of total emissions. All other sectors combined accounted for only 6% of emissions.
From 1990 to 2016, Canada’s NH3 emissions increased by 20% (82 kt) (Figure 2-6). This trend is driven by emissions from animal production and fertilizer application within the agriculture sector. Animal production, which dominates the emissions throughout the time series, experienced a steady increase in emissions from 1990 to 2005, followed by a decrease from 2006 to 2016. Emissions from crop production, however, have been steadily increasing since 2006 due to an increase in sales and use of synthetic nitrogen fertilizers.
The most significant changes in NH3 emissions from 1990 to 2016 include:
- agriculture: increase of 24% (90 kt)
- crop production: increase of 97% (77 kt)
- animal production: increase of 5% (13 kt)
- other emissions, dominated by manufacturing, incineration and waste, and transportation and mobile equipment sources: decrease of 31% (7.0 kt)
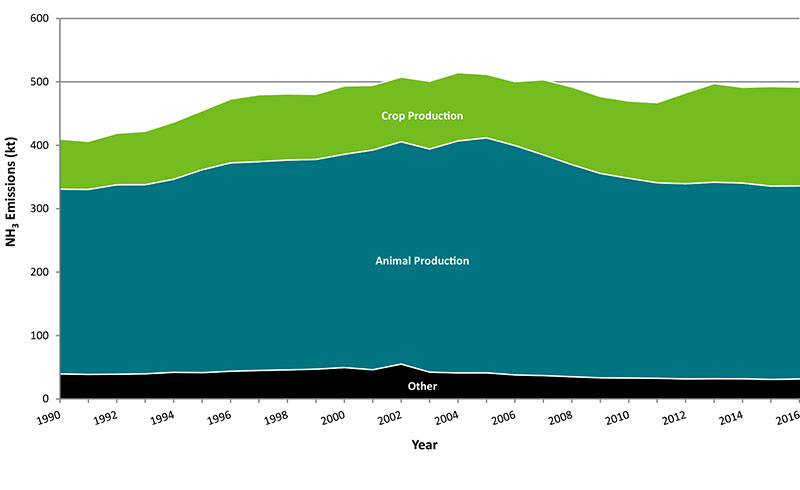
Long description for figure 2-6
Figure 2-6 displays the three major sections that contribute to national NH3 trends. The following table displays the contributions (kt) for the years 1990 to 2016.
| Sector | 1990 | 1991 | 1992 | 1993 | 1994 | 1995 | 1996 | 1997 | 1998 | 1999 | 2000 | 2001 | 2002 | 2003 | 2004 | 2005 | 2006 | 2007 | 2008 | 2009 | 2010 | 2011 | 2012 | 2013 | 2014 | 2015 | 2016 |
|---|---|---|---|---|---|---|---|---|---|---|---|---|---|---|---|---|---|---|---|---|---|---|---|---|---|---|---|
| Sector 1 - Crop Production | 78.91531 | 75.7925 | 81.2449 | 84.18742 | 89.94079 | 92.9898 | 100.5192 | 105.579 | 104.1589 | 102.5805 | 107.4828 | 101.9373 | 101.9788 | 106.74 | 107.6537 | 100.0525 | 100.7142 | 118.3956 | 122.3342 | 121.2405 | 121.7807 | 126.2779 | 143.1106 | 155.4623 | 150.8996 | 156.9687 | 155.5665 |
| Sector 2 - Animal Production | 291.2966 | 291.6623 | 298.6711 | 298.1895 | 304.4018 | 319.8265 | 328.5151 | 329.257 | 330.8386 | 330.6501 | 336.2792 | 346.3932 | 350.5344 | 351.7754 | 365.7771 | 370.5334 | 361.6644 | 347.9702 | 334.4402 | 322.2801 | 314.9956 | 308.2106 | 307.7892 | 309.8042 | 308.6187 | 304.845 | 304.4297 |
| Sector 3 - Other | 39.5382 | 38.76153 | 39.02399 | 39.71643 | 42.09308 | 41.55785 | 43.74444 | 44.96046 | 45.9277 | 47.07744 | 49.60069 | 46.13546 | 55.05588 | 42.37344 | 41.1216 | 41.24715 | 37.96465 | 36.96521 | 35.09702 | 33.42172 | 33.0387 | 32.70684 | 31.64986 | 31.97714 | 31.87857 | 30.82059 | 31.6154 |
| Source | Sector | 1990 | 2000 | 2005 | 2011 | 2012 | 2013 | 2014 | 2015 | 2016 |
|---|---|---|---|---|---|---|---|---|---|---|
| Ore and Mineral Industries | nil | 1 800 | 2 100 | 1 100 | 1 600 | 1 100 | 1 400 | 1 300 | 1 200 | 1 200 |
| Ore and Mineral Industries | Aluminium Industry | 29 | 34 | 13 | no emissions (-) | - | - | - | - | - |
| Ore and Mineral Industries | Asphalt Paving Industry | 0.6 | 1.3 | 1.2 | - | - | - | - | - | - |
| Ore and Mineral Industries | Cement and Concrete Industry | 600 | 630 | 380 | 320 | 330 | 430 | 440 | 480 | 360 |
| Ore and Mineral Industries | Foundries | 12 | 13 | 8.5 | - | - | - | - | - | - |
| Ore and Mineral Industries | Iron and Steel Industries | 180 | 230 | 83 | 96 | 91 | 78 | 89 | 59 | 56 |
| Ore and Mineral Industries | Iron Ore Industry | 160 | 160 | 23 | - | - | - | - | - | - |
| Ore and Mineral Industries | Mineral Products Industry | 83 | 110 | 94 | 290 | 230 | 420 | 440 | 340 | 410 |
| Ore and Mineral Industries | Mining and Rock Quarrying | 510 | 530 | 82 | 410 | 67 | 93 | 67 | 52 | 97 |
| Ore and Mineral Industries | Non-Ferrous Mining and Smelting Industry | 210 | 440 | 380 | 460 | 420 | 350 | 300 | 280 | 320 |
| Oil and Gas Industry | nil | 650 | 1 800 | 3 700 | 2 000 | 2 200 | 2 600 | 2 700 | 2 200 | 2 400 |
| Oil and Gas Industry | Downstream Oil and Gas Industry | 360 | 250 | 110 | 73 | 75 | 180 | 78 | 68 | 55 |
| Oil and Gas Industry | Upstream Oil and Gas Industry | 290 | 1 500 | 3 600 | 1 900 | 2 100 | 2 400 | 2 600 | 2 100 | 2 300 |
| Electric Power Generation (Utilities) | nil | 740 | 1 400 | 970 | 760 | 340 | 780 | 760 | 380 | 350 |
| Electric Power Generation (Utilities) | Coal | 62 | 110 | 540 | 62 | 37 | 580 | 610 | 170 | 170 |
| Electric Power Generation (Utilities) | Diesel | 3.7 | 6.0 | 2.8 | - | - | - | - | - | - |
| Electric Power Generation (Utilities) | Natural Gas | 270 | 680 | 180 | 590 | 200 | 110 | 95 | 130 | 100 |
| Electric Power Generation (Utilities) | Waste Materials | 23 | 26 | - | - | - | - | - | 5.3 | 11 |
| Electric Power Generation (Utilities) | Other Electric Power Generation | 380 | 620 | 250 | 99 | 95 | 82 | 62 | 70 | 62 |
| Manufacturing | nil | 20 000 | 23 000 | 17 000 | 12 000 | 12 000 | 11 000 | 11 000 | 12 000 | 12 000 |
| Manufacturing | Abrasives Manufacture | 0.76 | 0.76 | 0.12 | - | - | - | - | - | - |
| Manufacturing | Bakeries | 0.11 | 0.11 | - | - | - | - | - | 0.34 | - |
| Manufacturing | Biofuel Production | - | - | - | - | - | - | - | - | - |
| Manufacturing | Chemicals Industry | 9 800 | 14 000 | 11 000 | 9 100 | 9 100 | 8 500 | 8 500 | 8 800 | 9 200 |
| Manufacturing | Electronics | 31 | 55 | 54 | 25 | 18 | 17 | 17 | 19 | 18 |
| Manufacturing | Food Preparation | 180 | 310 | 290 | 230 | 380 | 410 | 380 | 360 | 340 |
| Manufacturing | Glass Manufacture | 88 | 110 | 120 | - | - | - | - | - | - |
| Manufacturing | Grain Industries | 6.2 | 6.7 | 1.5 | 13 | 15 | 7.5 | 7.6 | 5.0 | 5.7 |
| Manufacturing | Metal Fabrication | 93 | 200 | 40 | 18 | 2.8 | 2.1 | 2.4 | 25 | 25 |
| Manufacturing | Plastics Manufacture | 31 | 32 | 4.9 | - | - | - | - | - | - |
| Manufacturing | Pulp and Paper Industry | 4 400 | 3 200 | 2 300 | 1 700 | 1 700 | 1 700 | 1 600 | 1 600 | 1 700 |
| Manufacturing | Textiles | 13 | 28 | 16 | - | - | - | - | - | - |
| Manufacturing | Vehicle Manufacture (Engines, Parts, Assembly, Painting) | 73 | 160 | 47 | 15 | 0.11 | 0.77 | - | 2.3 | 2.2 |
| Manufacturing | Wood Products | 4 800 | 4 800 | 2 700 | 690 | 730 | 750 | 800 | 820 | 830 |
| Manufacturing | Other Manufacturing Industries | 500 | 360 | 170 | 9.2 | 25 | 21 | 22 | 32 | 30 |
| Transportation and Mobile Equipment | nil | 5 400 | 11 000 | 11 000 | 8 800 | 8 300 | 8 300 | 7 800 | 7 700 | 7 800 |
| Transportation and Mobile Equipment | Air Transportation | 29 | 35 | 37 | 32 | 37 | 38 | 37 | 38 | 39 |
| Transportation and Mobile Equipment | Heavy-duty Diesel Vehicles | 210 | 390 | 560 | 740 | 750 | 770 | 770 | 750 | 730 |
| Transportation and Mobile Equipment | Heavy-duty Gasoline Vehicles | 160 | 240 | 270 | 300 | 320 | 340 | 310 | 300 | 320 |
| Transportation and Mobile Equipment | Heavy-duty LPG/NG Vehicles | 55 | 170 | 21 | 2.6 | 2.5 | 1.2 | 0.88 | 1.1 | 1.3 |
| Transportation and Mobile Equipment | Light-duty Diesel Trucks | 2.4 | 4.4 | 4.3 | 6.4 | 6.6 | 7.9 | 10 | 13 | 15 |
| Transportation and Mobile Equipment | Light-duty Diesel Vehicles | 10 | 11 | 11 | 15 | 15 | 17 | 17 | 18 | 17 |
| Transportation and Mobile Equipment | Light-duty Gasoline Trucks | 1 100 | 3 600 | 3 700 | 3 100 | 3 000 | 3 000 | 2 900 | 2 900 | 3 100 |
| Transportation and Mobile Equipment | Light-duty Gasoline Vehicles | 3 200 | 6 200 | 5 600 | 3 900 | 3 600 | 3 500 | 3 100 | 3 000 | 3 000 |
| Transportation and Mobile Equipment | Light-duty LPG/NG Trucks | 14 | 21 | 14 | 0.29 | 0.14 | 0.059 | 0.046 | 0.041 | 0.051 |
| Transportation and Mobile Equipment | Light-duty LPG/NG Vehicles | 77 | 110 | 83 | 4.0 | 2.5 | 1.3 | 0.97 | 0.86 | 0.95 |
| Transportation and Mobile Equipment | Marine Transportation | 160 | 220 | 250 | 260 | 270 | 280 | 290 | 290 | 300 |
| Transportation and Mobile Equipment | Motorcycles | 4.3 | 6.9 | 12 | 30 | 32 | 34 | 34 | 37 | 39 |
| Transportation and Mobile Equipment | Off-road Diesel Vehicles and Equipment | 170 | 210 | 190 | 200 | 180 | 190 | 190 | 200 | 170 |
| Transportation and Mobile Equipment | Off-road Gasoline/LPG/CNG Vehicles and Equipment | 200 | 150 | 100 | 100 | 95 | 96 | 100 | 100 | 100 |
| Transportation and Mobile Equipment | Rail Transportation | 51 | 48 | 48 | 56 | 57 | 55 | 56 | 53 | 49 |
| Transportation and Mobile Equipment | Tire Wear and Brake Lining | - | - | - | - | - | - | - | - | - |
| Agriculture | nil | 370 000 | 440 000 | 470 000 | 430 000 | 450 000 | 470 000 | 460 000 | 460 000 | 460 000 |
| Agriculture | Animal Production | 290 000 | 340 000 | 370 000 | 310 000 | 310 000 | 310 000 | 310 000 | 300 000 | 300 000 |
| Agriculture | Crop Production | 79 000 | 110 000 | 100 000 | 130 000 | 140 000 | 160 000 | 150 000 | 160 000 | 160 000 |
| Agriculture | Fuel Use | 44 | 41 | 28 | 52 | 47 | 47 | 52 | 45 | 45 |
| Commercial / Residential / Institutional | nil | 3 900 | 3 600 | 3 300 | 3 200 | 3 200 | 3 100 | 3 100 | 3 100 | 3 000 |
| Commercial / Residential / Institutional | Cigarette Smoking | 110 | 110 | 88 | 88 | 83 | 76 | 77 | 69 | 70 |
| Commercial / Residential / Institutional | Commercial and Institutional Fuel Combustion | 310 | 340 | 320 | 220 | 200 | 200 | 220 | 210 | 190 |
| Commercial / Residential / Institutional | Commercial Cooking | - | - | - | - | - | - | - | - | - |
| Commercial / Residential / Institutional | Construction Fuel Combustion | 70 | 38 | 55 | 57 | 59 | 52 | 52 | 52 | 52 |
| Commercial / Residential / Institutional | Home Firewood Burning | 2 300 | 2 100 | 1 700 | 1 800 | 1 800 | 1 800 | 1 800 | 1 800 | 1 800 |
| Commercial / Residential / Institutional | Human | 490 | 530 | 560 | 600 | 600 | 610 | 620 | 620 | 630 |
| Commercial / Residential / Institutional | Marine Cargo Handling | 0.0010 | - | - | - | - | - | - | - | - |
| Commercial / Residential / Institutional | Residential Fuel Combustion | 690 | 560 | 530 | 460 | 400 | 380 | 380 | 360 | 330 |
| Commercial / Residential / Institutional | Service Stations | - | - | - | - | - | - | - | - | - |
| Commercial / Residential / Institutional | Other Miscellaneous Sources | - | - | - | - | - | - | - | - | - |
| Incineration and Waste | nil | 5 800 | 5 800 | 4 300 | 4 400 | 4 300 | 4 400 | 4 500 | 4 300 | 4 500 |
| Incineration and Waste | Crematoriums | - | - | - | - | - | - | - | - | - |
| Incineration and Waste | Waste Incineration | 210 | 210 | 340 | 230 | 220 | 220 | 220 | 230 | 230 |
| Incineration and Waste | Waste Treatment and Disposal | 5 600 | 5 600 | 3 900 | 4 200 | 4 100 | 4 200 | 4 200 | 4 100 | 4 300 |
| Paints and Solvents | nil | 14 | 14 | 0.88 | - | - | - | - | - | - |
| Paints and Solvents | Dry Cleaning | 0.046 | 0.046 | - | - | - | - | - | - | - |
| Paints and Solvents | General Solvent Use | - | - | - | - | - | - | - | - | - |
| Paints and Solvents | Printing | 14 | 14 | 0.88 | - | - | - | - | - | - |
| Paints and Solvents | Surface Coatings | 0.080 | 0.080 | - | - | - | - | - | - | - |
| Dust | nil | - | - | - | - | - | - | - | - | - |
| Dust | Coal Transportation | - | - | - | - | - | - | - | - | - |
| Dust | Construction Operations | - | - | - | - | - | - | - | - | - |
| Dust | Mine Tailings | - | - | - | - | - | - | - | - | - |
| Dust | Paved Roads | - | - | - | - | - | - | - | - | - |
| Dust | Unpaved Roads | - | - | - | - | - | - | - | - | - |
| Fires | nil | 1 100 | 130 | 100 | 130 | 210 | 68 | 240 | 180 | 160 |
| Fires | Prescribed Forest Burning | 1 100 | 110 | 88 | 110 | 190 | 51 | 230 | 170 | 140 |
| Fires | Structural Fires | 22 | 17 | 16 | 18 | 18 | 18 | 12 | 12 | 23 |
| Grand Total | nil | 410 000 | 490 000 | 510 000 | 470 000 | 480 000 | 500 000 | 490 000 | 490 000 | 490 000 |
Notes:
totals may not add up due to rounding
- denotes no emissions