
Archived: Air Pollutant Emission Inventory report: chapter 2.8
2.8 Cadmium (Cd)
Approximately 7.8 t of Cd were emitted in Canada in 2016 (Table 2–10). Ore and mineral industries accounted for 70% (5.5 t) of national emissions, including the non-ferrous smelting and refining industry at 66% (5.1 t) of the total emissions. Commercial/ residential/ institutional sources contributed 14% (1.1 t) of the total Cd emissions.
From 1990 to 2016, national Cd emissions decreased by 91% (83 t) (Figure 2–8). This trend is almost entirely driven by the non-ferrous mining and smelting industry. Emissions in this sector fluctuated greatly between 1990 and 2006, but decreased steadily from 2007 to 2014, followed by a small increase by 0.5 t by 2016. As with lead emissions, reductions in cadmium emissions from this sector coincide with the closure of outdated smelters and the publication by the Department of a Notice requiring the preparation and implementation of pollution prevention plans (ECCC 2017). Fluctuations in emissions prior to 2010 are almost entirely driven by emissions from a single smelter in Manitoba.
The most significant changes in Cd emissions from 1990 to 2016 include:
- ore and mineral industries: decrease of 93% (75 t)
- non-ferrous mining and smelting industry: decrease of 93% (73 t)
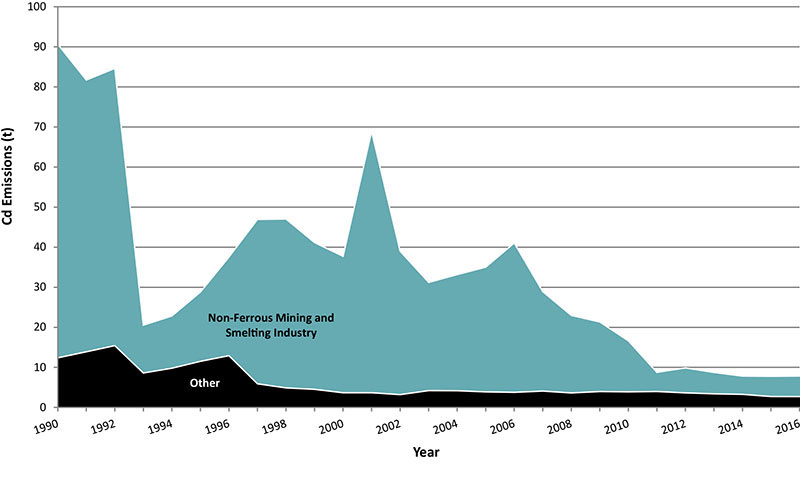
Long description for figure 2-8
Figure 2-8 displays the two major sections that contribute to national Cd trends. The following table displays the contributions (t) for the years 1990 to 2016.
| Sector | 1990 | 1991 | 1992 | 1993 | 1994 | 1995 | 1996 | 1997 | 1998 | 1999 | 2000 | 2001 | 2002 | 2003 | 2004 | 2005 | 2006 | 2007 | 2008 | 2009 | 2010 | 2011 | 2012 | 2013 | 2014 | 2015 | 2016 |
|---|---|---|---|---|---|---|---|---|---|---|---|---|---|---|---|---|---|---|---|---|---|---|---|---|---|---|---|
| Sector 1 - Non-Ferrous Mining and Smelting Industry | 78.2898 | 67.84787 | 69.20193 | 11.949 | 13.046 | 17.296 | 24.61 | 41.034 | 42.155 | 36.639 | 34.077 | 65.218 | 35.81113 | 27.02278 | 28.99369 | 31.13679 | 37.28182 | 24.83021 | 19.35772 | 17.36614 | 12.74715 | 4.787989 | 6.238351 | 5.333336 | 4.571038 | 5.055723 | 5.138302 |
| Sector 2 - Other | 12.37694 | 13.88212 | 15.4271 | 8.59578 | 9.784016 | 11.50156 | 12.92123 | 5.896291 | 4.875336 | 4.520031 | 3.660218 | 3.66447 | 3.194539 | 4.195451 | 4.167572 | 3.877511 | 3.765835 | 4.077461 | 3.617669 | 3.964674 | 3.886546 | 3.972416 | 3.630869 | 3.395419 | 3.259393 | 2.719315 | 2.704468 |
| Source | Sector | 1990 | 2000 | 2005 | 2011 | 2012 | 2013 | 2014 | 2015 | 2016 |
|---|---|---|---|---|---|---|---|---|---|---|
| Ore and Mineral Industries | nil | 81 000 | 35 000 | 32 000 | 5 400 | 6 900 | 6 000 | 5 400 | 5 400 | 5 500 |
| Ore and Mineral Industries | Aluminium Industry | 0.67 | 0.98 | no emissions (-) | - | - | - | - | - | - |
| Ore and Mineral Industries | Asphalt Paving Industry | 26 | 24 | 25 | 26 | 21 | 21 | 22 | 22 | 22 |
| Ore and Mineral Industries | Cement and Concrete Industry | 46 | 46 | 45 | 30 | 28 | 16 | 13 | 14 | 12 |
| Ore and Mineral Industries | Foundries | 1.8 | 1.3 | 26 | 8.0 | 1.9 | 1.7 | 62 | 21 | 0.75 |
| Ore and Mineral Industries | Iron and Steel Industries | 150 | 160 | 310 | 240 | 250 | 230 | 300 | 220 | 210 |
| Ore and Mineral Industries | Iron Ore Industry | - | - | - | 50 | 58 | 69 | 88 | 83 | 82 |
| Ore and Mineral Industries | Mineral Products Industry | - | - | - | - | - | - | - | - | - |
| Ore and Mineral Industries | Mining and Rock Quarrying | 2 200 | 280 | 360 | 290 | 300 | 290 | 320 | 19 | 16 |
| Ore and Mineral Industries | Non-Ferrous Mining and Smelting Industry | 78 000 | 34 000 | 31 000 | 4 800 | 6 200 | 5 300 | 4 600 | 5 100 | 5 100 |
| Oil and Gas Industry | nil | 130 | 190 | 190 | 260 | 270 | 240 | 210 | 220 | 220 |
| Oil and Gas Industry | Downstream Oil and Gas Industry | 110 | 150 | 130 | 120 | 120 | 100 | 110 | 94 | 95 |
| Oil and Gas Industry | Upstream Oil and Gas Industry | 25 | 38 | 60 | 140 | 150 | 140 | 110 | 130 | 120 |
| Electric Power Generation (Utilities) | nil | 130 | 130 | 250 | 750 | 430 | 360 | 160 | 140 | 160 |
| Electric Power Generation (Utilities) | Coal | 87 | 91 | 170 | 520 | 360 | 300 | 93 | 42 | 100 |
| Electric Power Generation (Utilities) | Diesel | - | - | - | - | - | - | - | - | - |
| Electric Power Generation (Utilities) | Natural Gas | 29 | 30 | 56 | 190 | 50 | 47 | 43 | 52 | 35 |
| Electric Power Generation (Utilities) | Waste Materials | - | - | 1.0 | 1.1 | 0.36 | 0.27 | 0.09 | 0.81 | 0.72 |
| Electric Power Generation (Utilities) | Other Electric Power Generation | 14 | 14 | 28 | 40 | 20 | 20 | 27 | 44 | 23 |
| Manufacturing | nil | 1 200 | 1 000 | 940 | 680 | 680 | 650 | 600 | 580 | 610 |
| Manufacturing | Abrasives Manufacture | - | - | - | - | - | - | - | - | - |
| Manufacturing | Bakeries | - | - | - | - | - | - | - | - | - |
| Manufacturing | Biofuel Production | - | - | - | - | - | - | - | - | - |
| Manufacturing | Chemicals Industry | 140 | 130 | 71 | 6.4 | 5.8 | 6.4 | 6.1 | 7.9 | 8.1 |
| Manufacturing | Electronics | - | - | - | - | - | - | - | - | - |
| Manufacturing | Food Preparation | - | - | - | - | - | - | - | - | - |
| Manufacturing | Glass Manufacture | 1.3 | 1.4 | 2.6 | 0.47 | - | - | - | - | - |
| Manufacturing | Grain Industries | - | - | - | - | - | - | - | - | - |
| Manufacturing | Metal Fabrication | 470 | 420 | 290 | 390 | 380 | 340 | 330 | 320 | 310 |
| Manufacturing | Plastics Manufacture | 5.2 | 5.7 | 3.0 | 1.4 | 0.55 | 0.18 | - | - | - |
| Manufacturing | Pulp and Paper Industry | 370 | 150 | 320 | 220 | 210 | 220 | 200 | 200 | 210 |
| Manufacturing | Textiles | - | - | - | - | - | - | - | - | - |
| Manufacturing | Vehicle Manufacture (Engines, Parts, Assembly, Painting) | 1.5 | 88 | 1.0 | - | - | - | - | - | - |
| Manufacturing | Wood Products | 130 | 130 | 110 | 59 | 80 | 83 | 58 | 54 | 71 |
| Manufacturing | Other Manufacturing Industries | 76 | 83 | 140 | 0.089 | 0.076 | 0.19 | 0.68 | 0.063 | 0.06 |
| Transportation and Mobile Equipment | nil | 300 | 370 | 410 | 340 | 300 | 250 | 220 | 170 | 170 |
| Transportation and Mobile Equipment | Air Transportation | - | - | - | - | - | - | - | - | - |
| Transportation and Mobile Equipment | Heavy-duty Diesel Vehicles | - | - | - | - | - | - | - | - | - |
| Transportation and Mobile Equipment | Heavy-duty Gasoline Vehicles | - | - | - | - | - | - | - | - | - |
| Transportation and Mobile Equipment | Heavy-duty LPG/NG Vehicles | - | - | - | - | - | - | - | - | - |
| Transportation and Mobile Equipment | Light-duty Diesel Trucks | - | - | - | - | - | - | - | - | - |
| Transportation and Mobile Equipment | Light-duty Diesel Vehicles | - | - | - | - | - | - | - | - | - |
| Transportation and Mobile Equipment | Light-duty Gasoline Trucks | - | - | - | - | - | - | - | - | - |
| Transportation and Mobile Equipment | Light-duty Gasoline Vehicles | - | - | - | - | - | - | - | - | - |
| Transportation and Mobile Equipment | Light-duty LPG/NG Trucks | - | - | - | - | - | - | - | - | - |
| Transportation and Mobile Equipment | Light-duty LPG/NG Vehicles | - | - | - | - | - | - | - | - | - |
| Transportation and Mobile Equipment | Marine Transportation | 190 | 280 | 320 | 250 | 210 | 170 | 130 | 95 | 98 |
| Transportation and Mobile Equipment | Motorcycles | - | - | - | - | - | - | - | - | - |
| Transportation and Mobile Equipment | Off-road Diesel Vehicles and Equipment | - | - | - | - | - | - | - | - | - |
| Transportation and Mobile Equipment | Off-road Gasoline/LPG/CNG Vehicles and Equipment | - | - | - | - | - | - | - | - | - |
| Transportation and Mobile Equipment | Rail Transportation | 100 | 98 | 95 | 83 | 84 | 81 | 83 | 79 | 73 |
| Transportation and Mobile Equipment | Tire Wear and Brake Lining | - | - | - | - | - | - | - | - | - |
| Agriculture | nil | 51 | 54 | 64 | 86 | 93 | 87 | 85 | 83 | 89 |
| Agriculture | Animal Production | - | - | - | - | - | - | - | - | - |
| Agriculture | Crop Production | - | - | - | - | - | - | - | - | - |
| Agriculture | Fuel Use | 51 | 54 | 64 | 86 | 93 | 87 | 85 | 83 | 89 |
| Commercial / Residential / Institutional | nil | 1 100 | 1 200 | 1 200 | 1 200 | 1 200 | 1 100 | 1 100 | 1 100 | 1 100 |
| Commercial / Residential / Institutional | Cigarette Smoking | 6.0 | 5.1 | 3.9 | 3.6 | 3.5 | 3.0 | 3.0 | 2.7 | 2.7 |
| Commercial / Residential / Institutional | Commercial and Institutional Fuel Combustion | 340 | 510 | 480 | 490 | 500 | 470 | 480 | 470 | 480 |
| Commercial / Residential / Institutional | Commercial Cooking | - | - | - | - | - | - | - | - | - |
| Commercial / Residential / Institutional | Construction Fuel Combustion | 11 | 7.0 | 10 | 9.1 | 9.1 | 8.9 | 8.9 | 8.9 | 9.1 |
| Commercial / Residential / Institutional | Home Firewood Burning | 200 | 180 | 150 | 160 | 160 | 160 | 160 | 150 | 150 |
| Commercial / Residential / Institutional | Human | - | - | - | - | - | - | - | - | - |
| Commercial / Residential / Institutional | Marine Cargo Handling | - | - | 47 | 0.41 | 0.077 | 2.3 | 1.2 | 0.5 | 2.2 |
| Commercial / Residential / Institutional | Residential Fuel Combustion | 540 | 500 | 500 | 520 | 490 | 480 | 490 | 460 | 440 |
| Commercial / Residential / Institutional | Service Stations | - | - | - | - | - | - | - | - | - |
| Commercial / Residential / Institutional | Other Miscellaneous Sources | - | - | - | - | - | - | - | - | - |
| Incineration and Waste | nil | 7 000 | 200 | 64 | 50 | 44 | 53 | 50 | 49 | 39 |
| Incineration and Waste | Crematoriums | 0.34 | 0.48 | 0.61 | 0.77 | 0.79 | 0.83 | 0.87 | 0.93 | 0.91 |
| Incineration and Waste | Waste Incineration | 7 000 | 200 | 44 | 34 | 31 | 31 | 31 | 31 | 31 |
| Incineration and Waste | Waste Treatment and Disposal | - | - | 19 | 16 | 12 | 22 | 18 | 18 | 7.1 |
| Paints and Solvents | nil | 1.0 | 1.0 | - | - | 0.12 | 0.12 | 0.12 | 0.14 | 0.10 |
| Paints and Solvents | Dry Cleaning | - | - | - | - | - | - | - | - | - |
| Paints and Solvents | General Solvent Use | - | - | - | - | - | - | - | - | - |
| Paints and Solvents | Printing | 1.0 | 1.0 | - | - | - | - | - | - | - |
| Paints and Solvents | Surface Coatings | - | - | - | - | 0.12 | 0.12 | 0.12 | 0.14 | 0.10 |
| Dust | nil | - | - | - | - | - | - | - | - | - |
| Dust | Coal Transportation | - | - | - | - | - | - | - | - | - |
| Dust | Construction Operations | - | - | - | - | - | - | - | - | - |
| Dust | Mine Tailings | - | - | - | - | - | - | - | - | - |
| Dust | Paved Roads | - | - | - | - | - | - | - | - | - |
| Dust | Unpaved Roads | - | - | - | - | - | - | - | - | - |
| Fires | nil | - | - | - | - | - | - | - | - | - |
| Fires | Prescribed Forest Burning | - | - | - | - | - | - | - | - | - |
| Fires | Structural Fires | - | - | - | - | - | - | - | - | - |
| Grand Total | nil | 91 000 | 38 000 | 35 000 | 8 800 | 9 900 | 8 700 | 7 800 | 7 800 | 7 800 |
Notes:
totals may not add up due to rounding
- denotes no emissions