
Greenhouse gas emissions performance for 2011 to 2015 light-duty vehicles
Official title: Greenhouse gas emissions performance for the 2011 to 2015 model year light-duty vehicle fleet in relation to the Passenger Automobile and Light Truck Greenhouse Gas Emission Regulations under the Canadian Environmental Protection Act, 1999
Transportation Division
June 2017
Notice
The information contained in this report is compiled from data reported to Environment and Climate Change Canada pursuant to the Passenger Automobile and Light Truck Greenhouse Gas Emission Regulations under the Canadian Environmental Protection Act, 1999. Information presented in this report is subject to ongoing verifications.
Table of contents
List of tables
List of figures
Purpose
This is the second report summarizing overall average greenhouse gas emission performance of the Canadian fleets of passenger automobiles (PA) and light trucks (LT). This report covers the 2011-2015 model years based on data submitted by companies in their end-of-model-year reports pursuant to the Passenger Automobile and Light Truck Greenhouse Emission Regulations.
The regulations
In October 2010, the Government of Canada published the Passenger Automobile and Light Truck Greenhouse Emission RegulationsFootnote1 (Regulations) under the Canadian Environmental Protection Act, 1999 (CEPA). This was the Government of Canada’s first ever GHG regulation and was a major milestone for Environment and Climate Change Canada’s transportation regulatory work.
The Regulations establish progressively more stringent GHG emission standards for new light-duty vehicles of model years 2011-2025, in alignment with the U.S. national standards. The applicable standards for a given model year are based on prescribed CO2 equivalent emission “target values” that are a function of the “footprint” (Figure 1) and quantity of the vehicle models in each company’s fleet of passenger automobiles and light trucks. These standards are performance-based which allow companies to choose the most cost-effective technologies to achieve compliance.
Figure 1. Vehicle footprint

Description of Figure 1
Figure 1 is a graphic showing the front and side profiles of a vehicle. The graphic is used to depict the “track width” as the lateral distance between the centrelines of the front and rear base tires, and the “wheelbase” as the longitudinal distance between the front and rear wheel centrelines.
The Regulations prescribe decreasing target values for a given footprint size over the 2011 through 2025 model years. Figures 2 and figure3 illustrate the target values for passenger automobiles and light trucks for the 2011 - 2025 model years which become increasingly more stringent with each successive model year. The 2011 target values, introduced one year prior to the U.S. Environmental Protection Agency (EPA) program, are based on the U.S. Corporate Average Fuel Economy levels. Accordingly, the Regulations considered the consumption of fuel as the basis to establish reasonable approximations of GHG performance for the 2011 model year. For the 2012 and later model years, the target values are aligned with the U.S. EPA target values.
Figure 2. 2011-2025 targets for passenger automobiles

Description of Figure 2
Figure 2 is a graph depicting the growing stringency of emission target values that apply to passenger automobiles over a range of footprints for the 2011, 2016, and 2025 model years.
The 2011 model year prescribes a target value of 285g/mile for footprints up to approximately 45 ft².
The target gradually increases for vehicles with a footprint greater than approximately 46 ft², and levels off at 370g/mile for footprints greater than approximately 56ft².
The curve for the 2011 model year is given by:
CO2 Target = 8887/T

Where: x is the footprint, a = 31.20, b = 24.00, c = 51.41, d = 1.91
The 2016 model year prescribes a target value of 206g/mile for footprints up to 41 ft².
The target increases linearly for vehicles with a footprint between 41 ft², and 56ft² and levels off at 277 g/mile for footprints greater than 56ft².
The 2025 model year prescribes a target value of 131g/mile for footprints up to 41 ft².
Figure 3. 2011-2025 targets for light trucks
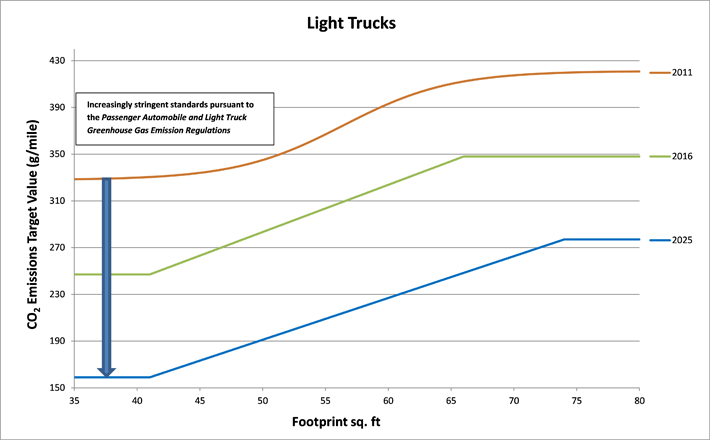
Description of Figure 3
Figure 3 is a graph depicting the growing stringency of emission target values that apply to light trucks over a range of footprints for the 2011, 2016, and 2025 model years.
The 2011 model year prescribes a target value of 329g/mile for footprints up to approximately 46 ft².
The target gradually increases from for vehicles with a footprint greater than approximately 46 ft², and levels off at 370g/mile for footprints greater than approximately 66ft².
The curve for the 2011 model year is given by:
CO2 Target = 8887/T

Where: x is the footprint, a = 27.10, b = 21.10, c = 56.41, d = 4.28
The 2016 model year prescribes a target value of 247g/mile for footprints up to 41 ft².
The target increases linearly for vehicles with a footprint between 41 ft², and 66ft² and off at 348 g/mile for footprints greater than 66ft².
The 2025 model year prescribes a target value of 159g/mile for footprints up to 41 ft².
The overall passenger automobile and light truck fleet average standard that a company must meet is ultimately determined by calculating the sales weighted average with the following formula:
Where
A is the CO2 emission target value for each group of passenger automobiles or light trucks having the same emission target;
B is the number of passenger automobiles or light trucks in the group in question; and
C is the total number of passenger automobiles or light trucks in the fleet.
The Regulations also incorporate certain compliance flexibilities to enable companies to achieve the applicable GHG standards while incentivizing the deployment of new emission reduction technologies. Some of these flexibilities include allowances for making GHG-reducing improvements to vehicle air conditioning systems as well as for innovative technologies for which the emission reduction impacts are not easily measured during standard emissions tests. The Regulations also recognize the GHG reduction potential for vehicles capable of operating on oxygenated fuels (for example, ethanol). Additional flexibilities include incentives for advanced technology vehicles (for example, electric vehicles, plug-in hybrid vehicles or fuel cell vehicles). There are also temporary optional standards available for intermediate volume companies and provisions for low volume companies (that is, manufacture or import less than 750 vehicle per year) to elect to exempt themselves from GHG compliance for the 2012 and later model years.
Under the Regulations, companies are required to submit an annual end of model year report that is used to demonstrate compliance to its applicable standard for both its passenger automobile and for its light truck fleets. Companies with a fleet average below the standard accrue emission credits that can be used to offset an emissions deficit, or traded. Companies with a fleet average exceeding the standards accrue an emissions deficit that must be offset within three years.
In order to recognize early action and good performance prior to the 2011 model year, the Regulations enabled companies to earn “early action” credits for their 2008-2010 model year vehicles. This provision required that companies provide a full report on their 2008-2010 model years, and that the net credit balance be positive. Given that not all companies elected to avail themselves of this option, the performance for the early action years is not discussed in this report.
Greenhouse gas emissions performance for the 2011-2015 model years
For the purposes of this report, the results are being presented at the fleet level based on data from the companies that submitted reports pursuant to the Regulations during 2011-2015 model years as listed in Table 1.
| Company | 2011 model yearsFootnote2 | 2012 model years | 2013 model years | 2014 model years | 2015 model years |
|---|---|---|---|---|---|
| Aston Martin Lagonda Ltd. |
✓
|
LVM
Footnote3
|
LVM
Footnote3
|
LVM
Footnote3
|
LVM
Footnote3
|
| BMW Canada Inc. |
✓
|
✓
|
✓
|
✓
|
✓
|
| FCA Canada Inc. |
✓
|
✓
|
✓
|
✓
|
✓
|
| Ferrari North America Inc. |
✓
|
LVM
Footnote3
|
LVM
Footnote3
|
LVM
Footnote3
|
LVM
Footnote3
|
| Ford Motor Company of Canada Ltd. |
✓
|
✓
|
✓
|
✓
|
✓
|
| General Motors of Canada Ltd. |
✓
|
✓
|
✓
|
✓
|
✓
|
| Honda Canada Inc. |
✓
|
✓
|
✓
|
✓
|
✓
|
| Hyundai Auto Canada Corp. |
✓
|
✓
|
✓
|
✓
|
✓
|
| Jaguar Canada |
✓
|
✓
|
✓
|
✓
|
✓
|
| Land Rover Canada |
✓
|
✓
|
✓
|
✓
|
✓
|
| Kia Canada Inc. |
✓
|
✓
|
✓
|
✓
|
✓
|
| Lotus Cars Ltd. |
✓
|
LVM
Footnote3
|
LVM
Footnote3
|
LVM
Footnote3
|
LVM
Footnote3
|
| Maserati North America Inc. |
✓
|
LVM
Footnote3
|
LVM
Footnote3
|
LVM
Footnote3
|
LVM
Footnote3
|
| Mazda Canada Inc. |
✓
|
✓
|
✓
|
✓
|
✓
|
| Mercedes-Benz Canada Inc. |
✓
|
✓
|
✓
|
✓
|
✓
|
| Mitsubishi Motor Sales of Canada, Inc. |
✓
|
✓
|
✓
|
✓
|
✓
|
| Nissan Canada Inc. |
✓
|
✓
|
✓
|
✓
|
✓
|
| Porsche Cars Canada, Ltd. |
✓
|
✓
|
✓
|
✓
|
✓
|
| Subaru Canada Inc. |
✓
|
✓
|
✓
|
✓
|
✓
|
| Suzuki Canada Inc. |
✓
|
✓
|
✓
|
NA
Footnote4
|
NA
Footnote4
|
| Tesla Motors, Inc. |
✓
|
✓
|
✓
|
✓
|
✓
|
| Toyota Canada, Inc. |
✓
|
✓
|
✓
|
✓
|
✓
|
| Volkswagen Group Canada, Inc. |
✓
|
✓
|
✓
|
✓
|
✓
|
| Volvo Cars of Canada Corp. |
✓
|
✓
|
✓
|
✓
|
✓
|
Because each manufacturer’s fleet is unique, the data presented in the graphs are based on the aggregated values for all companies, and are intended to depict the average results. The graphs below (Figures 4 and figure5) illustrate the year over year performance for both passenger automobile and for light truck fleets. These trend lines depict the average standard applicable to the overall fleet (dotted line) and the compliance value (solid line) for each fleet. The “compliance value” is the final average CO2 equivalent value that is compared to the standard after all available compliance flexibilities have been factored in according to the following equation:
Fleet Average CO2 equivalent value = Average tailpipe GHG emissions - total fleet allowances
Results to date indicate that the overall fleet average CO2 equivalent (that is, compliance value) for both passenger automobiles and for light trucks has been decreasing year over year and continues to decrease.
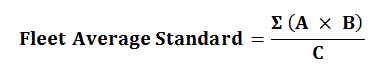
As depicted in Figure 4, as the stringency of the Regulations has increased, the overall passenger automobile fleet has continued to comply with the applicable standard. From 2011 to 2015 the average compliance values from passenger automobiles have decreased from 255 to 229 grams per mile, a reduction of 10.2 percent.
Description of Figure 4
Figure 4 is a graph presenting the trends in average GHG compliance value and average GHG standards for the passenger automobile fleets over the 2011-2015 model years.
The average standard decreases from 291 g/mile in 2011 to 262 in 2012, 256 in 2013, 248 in 2014 and 237 in 2015.
The average compliance value decreases from 255 g/mile in 2011 to 242 in 2012, 238 in 2013, 234 in 2014, and 229 in 2015.
During the 2011-2015 period, compliance values for the light truck fleet have also continued to trend downwards (Figure 5) from 349 to 309 grams per mile, a reduction of 11.5 percent.
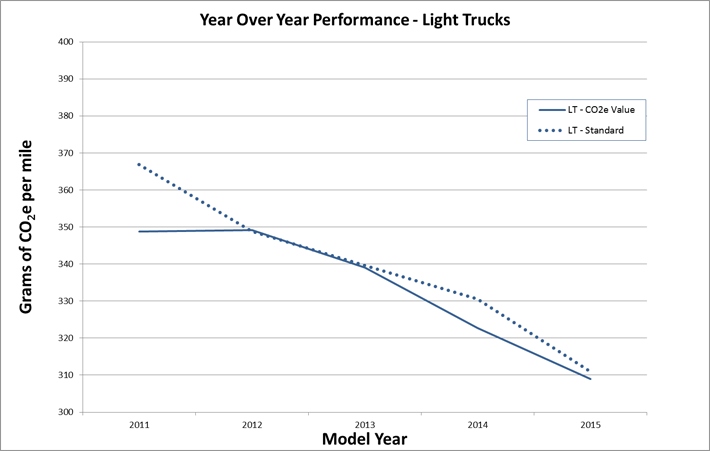
Description of Figure 5
Figure 5 is a graph presenting the trends in average GHG compliance value and average GHG standards for the light truck fleets over the 2011-2015 model years.
The average standard decreases from 367 g/mile in 2011 to 349 in 2012, 340 in 2013, 331 in 2014, and 311 in 2015.
The average compliance value is 349 g/mile in 2011 and 2012, and decreases to 339 in 2013, 323 in 2014, and 309 in 2015.
Technological advancements and penetration
As fleet average emission standards have become more stringent, automobile manufacturers have developed and deployed a variety of advanced technologies to reduce their CO2 emissions.
Some of these advanced technologies used on vehicles powered by conventional engines include more efficient turbocharged engines, cylinder deactivation to reduce engine power when not needed, and continuously variable transmissions which allow engines to operate closer to peak efficiency.
Other advanced technologies seek to reduce or eliminate the use of conventional fuels by introducing electrical powertrain components. Battery electric vehicles (BEV) produce no tailpipe emissions and are completely powered by grid electricity stored in a battery. Plug-in hybrid electric vehicles (PHEV) have both an electrical and a conventional powertrain. PHEVs can be charged by grid electricity to operate solely on electrical power, but also contain a conventional engine to extend the operating range of the vehicle.
Table 2, while not exhaustive, lists some commonly used technology types, along with their corresponding penetration in the Canadian new vehicle fleet in given model years. As is illustrated in the table, during the 2011-2015 period, an increasing proportion of new vehicles were equipped with one or more of the aforementioned advanced technologies.
| Model year | BEV & PHEV | Turbocharger & supercharger | Cylinder deactivation | Continuously variable transmission |
|---|---|---|---|---|
| 2011 |
0.01%
|
9.6%
|
7.5%
|
6.9%
|
| 2012 |
0.18%
|
11.1 %
|
6.9%
|
7.1%
|
| 2013 |
0.13%
|
18.4%
|
6.8%
|
6.8%
|
| 2014 |
0.25%
|
20.9%
|
11.1%
|
12.7%
|
| 2015 |
0.35%
|
21.1%
|
10.0%
|
13.5%
|
CO2 emission credit system
The Regulations include a system of emission credits to help meet overall environmental objectives in a manner that provides the regulated industry with compliance flexibility.
A company must calculate emission credits and deficits in units of megagrams (Mg) of CO2 equivalent for each of its passenger automobile and light truck fleets of a given model year. Using the below provided mathematical formula, if the result of the calculation is positive, the company will generate credits for that model year. If the result of the calculation is negative, the company will incur a deficit. Effectively, credits are obtained by companies whose fleet emission levels fall below the company’s fleet average GHG emission standard, while deficits are incurred by companies whose fleet emissions exceed the applicable standard.
The total credit balance is determined according to the following formula:
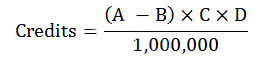
Where
A is the fleet average standard for passenger automobiles or light trucks;
B is the fleet average CO2e value for passenger automobiles or light trucks;
C is the total number of passenger automobiles or light trucks in the fleet; and
D is the is the total assumed mileage of the vehicles in question, namely,
- 195,264 miles for a fleet of passenger automobiles, or
- 225,865 miles for a fleet of light trucks.
The ability to earn and bank credits, including early credits, is an important aspect of the Regulations and is intended to give manufacturers flexibility to meet the 2012-2016 model year standards, as well as assist with the transition to the progressively more stringent standards in the 2017-2025 model years. The credits represent the emission reductions that manufacturers have achieved in excess of those required by the Regulations. The ability to accumulate credits allows manufacturers to plan and implement an orderly phase-in of emissions control technology. For the period covered in this report, companies have generated credits that can be used to offset a deficit up to the 2021 model year. Emission credits that can be used to offset a deficit incurred in the 2022 and later model years can only be generated beginning with the 2017 model year.
Up to the end of the 2015 model year, companies have generated approximately 70.4 million emissions credits of which approximately 3 million have been used to offset a deficit and 32.5 million have expired. There are currently 34.8 million credits available to offset deficits through to the 2021 model year.
Credit transfers are an important factor in some company’s compliance plans. There have been a total of 4 million credits transferred between companies for either immediate use to offset a deficit or in anticipation of a future deficit.
Conclusions
The results from the 2011 to 2015 model year regulatory reports indicate that the aggregated fleet average compliance values for both passenger automobiles and for light trucks are at or below the applicable fleet average standard for each year. During this period, the aggregate compliance values for passenger automobiles have decreased from 255 to 229 grams per mile, a 10.2% reduction and light trucks have decreased from 349 to 309 grams per mile, an 11.5% reduction.
To date, companies have generated approximately 70.4 million emissions credits, of which 34.8 million credits remain available for future use through the 2021 model year.
Appendix
| Model year | Standard | Compliance value |
|---|---|---|
| 2011 |
291
|
255
|
| 2012 |
262
|
242
|
| 2013 |
256
|
238
|
| 2014 |
248
|
234
|
| 2015 |
237
|
229
|
| Model year | Standard | Compliance value |
|---|---|---|
| 2011 |
367
|
349
|
| 2012 |
349
|
349
|
| 2013 |
340
|
339
|
| 2014 |
331
|
323
|
| 2015 |
311
|
309
|