
Substance Identity
Information on the identity of quinoline is presented in Table 1.
Abbreviations: AICS, Australian Inventory of Chemical Substances; ASIA-PAC, Asia-Pacific Substances Lists; CAS RN, Chemical Abstracts Service Registry Number; DSL, Domestic Substances List; ECL, Korean Existing Chemicals List; EINECS, European Inventory of Existing Commercial Chemical Substances; ENCS, Japanese Existing and New Chemical Substances; NCI, National Chemical Inventories; NZIoC, New Zealand Inventory of Chemicals; PICCS, Philippine Inventory of Chemicals and Chemical Substances; SMILES, simplified molecular input line entry specification; SWISS, Swiss Giftliste 1 and Inventory of Notified New Substances; TSCA, Toxic Substances Control Act Chemical Substance Inventory.
Source: NCI 2006
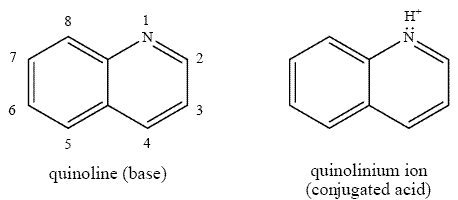
Quinoline is an organic base that belongs to the group of nitrogen heterocycles or aza-arenes. It is a hygroscopic liquid with a penetrating odour (Finley 1996). Table 2 presents selected physical and chemical properties identified for quinoline. Its boiling point, melting point and vapour pressure suggest that quinoline will be semivolatile under atmospheric conditions (2004 email from Air Quality Research Branch, Environment Canada, to Ecological Assessment Division; unreferenced). The pKa value of 4.9 indicates that at ambient pH values (6-9 for most surface waters), nearly all quinoline will be present in the un-ionized form.
Abbreviations: Koc, organic carbon-water partition coefficient; kOH, rate constant for gas-phase reaction with hydroxyl radical; Kow, octanol-water partition coefficient; pKa, acid dissociation constant.
1 Vapour pressure/water solubility.
As a nitrogen-substituted PAH, quinoline can be present to various extent in many PAH mixtures (Environment Canada, 1999; McNeil, 1981). Quinoline is naturally present in coal (Clemo 1973). Coal tar is produced from coal as a by-product of metallurgical coke production in Canada and is recovered and refined as an intermediate for industrial use and as an ingredient in several commercial/consumer products (2010 email from Mining and Processing Division, Environment Canada, to Ecological Assessment Division, Environment Canada; unreferenced). Quinoline remains present in industrially produced coal tar and its distillation products--coal tar oils and coal tar pitch. Coal tar oils are refined to produce creosote in Canada . Use of creosote as a wood preservative in Canada is well documented (2010 email from Chemicals Management Division, Environment Canada, to Ecological Assessment Division, Environment Canada; unreferenced). Coal tar pitch is used in several industrial sectors, including aluminum smelting, and in manufacturing of graphite electrodes, specialty carbon products and asphalt pavement sealers. Aluminum smelters are important consumers of coal tar pitch (McNeil 1981; Sutton 2008).
Pure quinoline is produced commercially from coal tar distillates (HSDB 2009). It can be extracted from bone oil (EOHS 1983), and it can be produced by the Skraup synthesis, in which aniline is heated with glycerol and nitrobenzene in the presence of sulfuric acid (Finley 1996).
Based on a survey conducted under section 71 of CEPA 1999, one or more companies in Canada reported manufacture or import of quinoline in excess of 20 000 kg during the calendar year 2000 as part of mixtures of which quinoline is less than 1% of the composition (Environment Canada 2001a), however more recent data is not available.
Quinoline has been detected in coal tar-based products, such as sealcoats used on parking lots and driveways and creosote used as a preservative in the lumber and wood industries, in Canadian marketplace (Zhu 2007; EHS 2010; HSDB 2009). Quinoline was also identified as being used as a component in fragrance mixtures (RIFM 2003). However, quinoline is not a registered active ingredient or formulant in pesticides in Canada (2009 email from Pest Management Regulatory Agency, Health Canada, to Risk Assessment Bureau, Health Canada; unreferenced).
It is described in public literature that quinoline has been used as a solvent, chemical intermediate and corrosion inhibitor and in the manufacture of dyes and pharmaceuticals, although there is no evidence of these uses in Canada (Finley 1996; HSDB 2009). The primary use of quinoline is as a precursor in the production of 8-quinolinol, a chelation agent used to complex pharmaceuticals and veterinary drugs and added to anti-dandruff shampoo (HSDB 2009). Quinoline is also a precursor in the production of copper-8-hydroxyquinolate (HSDB 2009). Industrial applications of quinoline include the manufacture of methine dyes and terpene production; quinoline is also used as a decarboxylation reagent, as a solvent of PAHs in paint production, and as a chemical intermediate and anti-foaming agent in petrochemical manufacturing (Scorecard 2005; HSDB 2009). It acts as a corrosion inhibitor when included in ethylene glycol-type antifreeze or in cement casings for steel reinforcing wires and rods and is used in extraction and separation and as an additive in plating baths (Finley 1996).
Quinoline is naturally associated with coal and coal-derived compounds and may be formed as a trace pollutant during incomplete combustion of nitrogen-containing substances (HSDB 2009). Natural background levels in Canada are not known; however, measurements of trace quantities of quinoline in pre-industrial sediments suggest low-level natural sources of this substance. Furlong and Carpenter (1982) measured concentrations of quinoline ranging between 120 and 770 ng/g organic carbon in sediments from pre-1870 in Puget Sound, Washington.
Release of quinoline in Canada in 2008 was reported to the National Pollutant Release Inventory by six facilities: a petroleum refiner, a producer of roof coatings and associated chemicals, a coal tar pitch producer, a manufacturer of fabricated metal products, a manufacturer of chemical products, and a waste treatment and disposal facility. On-site releases to air totalled 445 kg, and 58 tonnes were incinerated off-site. No release to water was reported (NPRI 2009).
Reported sources of quinoline releases to the environment include coal tar distillate (creosote) facilities and wood impregnation plants, creosote-impregnated wood used in harbour docks, creosote-impregnated railroad frames used in support walls along lake shorelines (Canada 1993), steel plants equipped with coke ovens (Onuska and Terry 1989; Kauss and Hamdy 1991), aluminum smelters (2009 email from Division Mines et traitement - Québec, Environnement Canada, to Ecological Assessment Division, Environment Canada; unreferenced) and abandoned coal gasification plants (gasworks) (Johansen et al. 1997a). A national inventory performed in 1987 recorded over 150 coal gasification sites across the country. These sites were located in all provinces, with the exception of Prince Edward Island, with greatest site densities found in Montreal, Toronto and Vancouver (RDRC 1987).
It should be noted that environmental protection measures have been implemented in Canada, in particular for steel plants equipped with coke ovens (SLV 1996; EMA 1997, 2000; Environment Canada 2001b) and for wood preservation facilities (Environment Canada 1999). Significant releases of quinoline to the environment have been reduced through actions implemented in the 1990s to reduce releases of creosote (containing quinoline) and PAHs (associated with quinoline) from these sources (2010 email from Chemicals Management Division, Environment Canada, to Ecological Assessment Division, Environment Canada; unreferenced).
In the case of abandoned gasworks, a majority of the sites in Quebec, Ontario and British Columbia have been the object of some form of attention, in the form of assessment, remediation or risk management activities (MENVIQ 1988; 2005 email from Environmental Assessment and Waste Prevention, Environment Canada, to Existing Substances Branch, Environment Canada; unreferenced; 2005 email from Contaminated Sites Remediation, Environment Canada, to Existing Substances Branch, Environment Canada; unreferenced). Remediation activities have been underway at two former gaswork sites owned by the federal government; at the first site (British-Columbia) work started in 2005-06 and has been underway since (2010 e-mail from Environmental Evaluation and Mitigation, Environmental Programs, Transport Canada, to Contaminated Sites Division, Environment Canada; unreferenced); at the second site (Ontario) remediation work started in 1996 and it is expected to be completed in 2010-11 (2010 e-mail from Office of Environmental Coordination, Fisheries and Oceans Canada, to Contaminated Sites Division, Environment Canada; unreferenced). In the Atlantic provinces, there are no indications that any assessment, remediation or risk management activities have taken place for 12 abandoned gasworks (RDRC 1987; 2005 email from Waste Management and Remediation Section, Environment Canada, to Existing Substances Branch, Environment Canada; unreferenced). Although the above initiatives have targeted pollutants such as polycyclic aromatic hydrocarbons (PAHs), benzene, toluene, ethylbenzene and xylenes, they should also be effective in addressing quinoline contamination (e.g., 2004 email from Purifics ES Inc. to Existing Substances Branch, Environment Canada; unreferenced).
As quinoline may be formed during the incomplete combustion of nitrogen-containing substances (e.g., petroleum, coal), it may be emitted to the environment from sources such as automobile exhaust (Dong et al. 1977). Rogge et al. (1993) collected aerosol samples (<2 µm) from the exhausts of gasoline- and diesel-powered vehicles built between the mid-1960s and the late 1980s. The vehicle fleet tested consisted of automobiles without catalytic converters (N = 5), automobiles with catalytic converters (N = 7) and diesel trucks (N = 2). Emission rates of quinoline, in micrograms per kilometre travelled, were as follows: non-catalyst auto, 5.3; catalyst auto, 0.57; and diesel truck, 0.46. More recent investigations have not measured quinoline in automobile, small engine or diesel exhausts. Similarly, it is not known with certainty if quinoline is present in current emissions from coal-fired power plants (Mortazavi 1996; Cianciarelli and Mortazavi 1998; US EPA 2000; SENES Consultants Limited 2002a, b).
Quinoline may also be present in gases emitted from domestic and public waste incinerators (Benestad et al. 1987; Minomo et al. 2009).
Quinoline may be found in coal tar-based products such as sealcoats used on parking lots and driveways (EHS 2010). Leaching tests performed on these materials pointed to the potential for runoff of quinoline through rainfall (Zhu 2007). This result is consistent with the findings of Mahler et al. (2005) showing that parking lot sealcoats can be a source of PAH releases to the environment.
Total nationwide atmospheric emissions of quinoline in the United States for the period 1990-1993 were estimated at 23.6 tonnes per year, with key contributions from chemical and allied product manufacturing (11.3 tonnes), metals processing (8.2 tonnes), petroleum refineries and related industries (4.0 tonnes) and wood, pulp and paper, and publishing products (0.08 tonne) (US EPA 2000).
Environmental fate analysis integrates information on the chemical behaviour of a substance with the properties of the receiving environment. The objective of fate analysis is to determine the multimedia distribution of the substance after its release into the environment. This includes consideration of the persistence and bioaccumulation potential of the substance in the environment.
1 Modelling performed for the non-ionized form at a temperature of 25ºC. Input parameters: molecular mass, 129.16; aqueous solubility, 6110 mg/L; vapour pressure, 8 Pa; log Kow, 2.10; melting point, -15ºC. Details on selected half-lives (water, 552 h; sediments, 552 h; air, 16 h; soil, 4368 h) are given in the section on Persistence and Bioaccumulation Potential.
Simulations for environmental partitioning were performed using Level III (steady-state, non-equilibrium) of the Equilibrium Criterion (EQC) model for Type 1 chemicals (Mackay et al. 1996; EQC 2003). Input parameters for running this model and the results are presented in Table 3. If quinoline is released to the atmosphere, its moderate volatility will cause some quinoline to leave the air to partition into soil and surface water; a mass amount of about 18% will stay in the air. If it is released to surface water, the model predicts that quinoline will remain for the most part in that compartment. Similarly, if it is released to soil, the model predicts that quinoline will remain mainly in this medium.
The TaPL3 model was used to assess the long-range transport potential of quinoline when it is released into air or water. The model calculates the distance--the characteristic travel distance (CTD)--that a substance will travel in a mobile medium until the concentration decreases to 37% (1/e) of its initial value as a consequence of intermedia partitioning and degradation reactions. Advective losses are not included (Beyer et al. 2000; TaPL3 2003). With a modelled CTD of 332 km, quinoline is not subject to atmospheric transport to remote regions, such as the Arctic. The TaPL3 model may underestimate the partitioning of quinoline between the gas phase and atmospheric particles by neglecting to take into account the formation of secondary organic aerosols from the photooxidation of quinoline. However, a sensitivity analysis indicates that ignoring the secondary organic aerosols formed by photooxidation has probably only a slight effect on the distribution of quinoline at steady state in this evaluative environment.
No benchmarks have been proposed by Beyer et al. (2000) for interpreting the CTDs of chemicals in water. The CTD for quinoline in water is well over 1500 km and this may reflect the assumed slow degradation half-life in this medium.
The information below was considered in evaluating whether quinoline meets the criteria for persistence and bioaccumulation potential as defined under the Persistence and Bioaccumulation Regulations of CEPA 1999 (Canada 2000). Persistence criteria are half-lives of ≥2 days in air, ≥182 days in water, ≥365 days in sediment or ≥182 days in soil, or evidence of long-range transport to remote areas. Bioaccumulation criteria are a bioaccumulation factor (BAF) or bioconcentration factor (BCF) of ≥5000 or a log Kow of ≥5.0.
In summer, quinoline is not expected to persist in air or surface water, based on the removal processes of degradation by hydroxyl radicals in air and photooxidation in water; modelled half-lives are 16 hours for air and 14-23 days for surface water (Smith et al. 1978; Kochany and Maguire 1994; Mackay et al. 1999). In winter, the atmospheric half-life is estimated to be as high as 99 hours (Mackay et al. 1999). Conversely, quinoline vapour pressure is expected to decrease in winter but to remain moderate, as shown by a modelled vapour pressure of 0.65 Pa at 0ºC (MPBPWIN 2000). These results are deemed sufficient to conclude that quinoline is persistent in air during winter months.
Quinoline has been shown to be biodegradable in soil under conditions favouring the growth of microorganisms (mineralized in 7-10 days; Thomsen et al. 1999). However, in a laboratory test with less favourable conditions, only 0.2% of quinoline was degraded after a 2-week exposure to microorganisms (MITI 1992). Its elevated water solubility, coupled with a moderate affinity for particulate organic carbon (log Koc of 3.26), supports the moderate to high mobility in soil attributed to the chemical by Fowler et al. (1994); therefore, although quinoline is easily degraded in aerobic soil, it can move easily into deeper, anaerobic regions, where it may persist for long periods. Indeed, these anaerobic media offer poor conditions for biodegradation, such as low oxygen levels, low temperatures and few carbon sources. Absence of significant degradation of quinoline associated with the occurrence of coal tar in soils has been frequently observed (e.g., Lesage and Jackson 1992; Johansen et al. 1997a). The presence of quinoline in sediments dating back a century is evidence of the persistence of the substance in this compartment (Furlong and Carpenter 1982).
Quinoline has a low potential to bioaccumulate; two BCF values have been determined for fish on a wet weight basis. The BCF of 8 obtained by Bean et al. (1985) was calculated for quinoline and its metabolites (the BCF for the non-metabolized quinoline molecule is therefore lower than 8); de Voogt et al. (1991) calculated a BCF value of 158 for fish.
Based on the criteria in the Persistence and Bioaccumulation Regulations (Canada 2000), it is proposed that quinoline meets the persistence criteria for air and soil but does not meet the criteria for bioaccumulation potential.
Only limited data regarding levels of quinoline in the Canadian environment were identified. Some of the available concentrations are at least 15 years old and may not reflect current exposure conditions. No data have been found on levels of quinoline in natural, non-agricultural soils. Table 4 presents environmental concentrations of quinoline in Canada as well as outside Canada .
Abbreviations: LOD, limit of detection; ND, not detected; NS, not specified.
1 The units given in the Chuang et al. (1991) study are inconsistent and possibly erroneous, as values were reported in both µg/m3 and ng/m3. As a worst-case scenario, the units µg/m3 were used for the ecological exposure assessment.
2 In the unit ng/m3 N, N means at normal conditions, i.e., 0°C and atmospheric pressure of 101.3 kPa.
3 ChemSim simulation considering 10th-percentile flow estimate (low flow) at 1000 m from the source (Appendix 1).
4 ChemSim simulation considering 50th-percentile flow estimate at 1000 m from the source (Appendix 1).
Quinoline is a known constituent of coal tar and creosote (McNeil 1981). Contamination of groundwater and soils by these chemical mixtures has been documented at abandoned coal gasification plants, steel plants equipped with coke ovens and wood treatment plants. The presence of coal tar was documented in soil, groundwater and nearby surface water ( Rideau River) in the vicinity of a former gas factory in Ottawa, Ontario. A pure coal tar sample obtained from the bottom of the river in 1986 contained quinoline at a concentration of 0.51 mg/g tar (INTERA 1987b; reported detection limit 0.5 µg/g tar). There is a distinct possibility that quinoline has been leached out from this sample, however. This site has since been remediated (2004 communication between Ontario Ministry of Environment and Existing Substances Branch, Environment Canada; unreferenced). Such an example of contamination by non-aqueous-phase liquids (e.g., coal tar) forms the basis of the exposure scenario presented in the ecological risk characterization below (INTERA 1987a, b; Lesage and Jackson 1992; Raven and Beck 1992; Furimsky 2002). Concentrations of quinoline in groundwater and surface water impacted by coal tar plumes were modelled because of the lack of measured concentrations in Canada . The model estimates quinoline concentrations in a groundwater plume that develops in connection with a pure coal tar pool in soil and is discharged to surface water within 10 m of the pool. It is based on field observations of coal tar plumes made at abandoned gasworks sites and coke oven sites in Canada . This exposure scenario would be relevant to abandoned gasworks and coke ovens and current industrial applications producing tar wastes on-site, including coal tar distillation plants, creosoting plants and roofing felt and tarred paper manufacturing facilities. A simple numerical approach reported in the peer-reviewed literature, Raoult’s law, was used to derive a maximum aqueous concentration of quinoline in contact with a pure coal tar phase (King and Barker 1999). Two quinoline concentrations, 6.9 and 34.5 mg/L, associated with the lower and upper limits for the quinoline content of coal tar (McNeil 1981), represent the range of quinoline concentrations in groundwater in contact with pure coal tar. These two values, divided by 10 to account for dilution, represent the range of quinoline concentrations at sediment-water interfaces affected by groundwater discharge points contaminated by quinoline: 0.69 and 3.45 mg/L. Simulations using the ChemSim model (ChemSim 2003) were used to derive dissolved quinoline concentrations in surface water, assuming a groundwater flow rate of 3 cm/day and an instantaneous dilution. Derivation of the parameters, discussion of simplifying assumptions underlying the present exposure scenario and a brief description of the ChemSim model are provided in Appendix 1. The modelled concentrations in groundwater and surface water are presented in Table 4 and have been selected as the predicted environmental concentrations (PECs) to be used for the risk quotient calculations for water.
Quinoline was not detected in a residential area in Ottawa, Ontario, based on an air quality survey conducted in the winter of 2002 and 2003 (the estimated detection limit was 0.05 µg/m3) (Zhu et al. 2005). In addition, Chuang et al. (1991) obtained statistically significant correlations between quinoline and phenanthrene concentrations in the ambient air of Columbus, Ohio. It has been proposed (2004 email from Air Quality Research Branch, Environment Canada, to Existing Substances Branch, Environment Canada; unreferenced) that the quinoline to phenanthrene ratio calculated by Chuang et al. (1991), an average of 0.106 in outdoor air, and ambient measurements of phenanthrene in air in Canada be used to infer ambient levels of quinoline in air in Canada. As part of the weight of evidence approach, high-quality data sets in the Canadian assessment report on PAHs were taken advantage of to obtain concentrations of phenanthrene measured in the mid-eighties and early nineties in ambient air from diverse locations in Canada ( Canada 1994). Concentrations of quinoline, derived from phenanthrene levels and expressed in nanograms per cubic metre, are as follows:
- near aluminum plants: Kitimat (BC), 6.15; Jonquière (QC), 39.5; Shawinigan (QC), 41.5;
- sectors affected by wood heating: Whitehorse (YT), 28.9; Sept-Iles (QC), 5.36;
- rural sector: Walpole Island (ON), 0.44; and
- urban sector: Winnipeg (MB), 0.56; Windsor (ON), 3.70; Toronto (ON), 1.66; Montreal (QC), 2.09; Sydney (NS), 0.23.
Since the ratio of quinoline to phenanthrene was obtained from the urban area of Columbus, Ohio, it will probably be more representative of urban sources.
Twenty-seven studies relating to the acute and chronic toxicity of quinoline to fish, aquatic invertebrates, soil invertebrates, microalgae and microorganisms provided 96 different toxicity values. Four key studies of toxicity to organisms in different environmental media were selected and are discussed below. These present the most sensitive reliable results selected for each medium and exposure route available. They have been critically reviewed and determined to have a satisfactory degree of reliability for the present risk assessment (Appendix 2). Toxicity studies for soil organisms are not covered because an exposure scenario could not be developed for them due to the limited information available.
Johansen et al. (1997b) used a toxicity test named MINNTOX to examine the inhibition of ammonia oxidation by the bacterial group Nitrosomonas spp. in the presence of quinoline. An inoculum was taken from an activated sludge obtained from a wastewater treatment plant. The experimental treatment consisted of mixing 3 mL of toxicant solution with 3 mL of active nitrifying sludge. Six test concentrations covered the range 0-200 mg/L, and three replicates were run per concentration. The test lasted 2 hours, which corresponds to a chronic exposure for Nitrosomonas spp. The median effective concentration, or EC50 (i.e., the concentration that inhibited nitrification by 50%), of quinoline was determined to be 54 mg/L.
Bleeker et al. (1998) conducted 96-hour aquatic toxicity tests for quinoline using the first instar larvae of the midge Chironomus riparius and obtained a 96-hour median lethal concentration (LC50) of 4.90 mg/L.Other studies with benthic invertebrates, aquatic invertebrates and microalgae reported in the scientific literature have found acute LC50s in the 5-191 mg/L range for quinoline.
The fish toxicity study of Black et al. (1983) was used to derive the Canadian Water Quality Guideline for quinoline for the protection of aquatic life (CCME 1999). Black et al. (1983) studied the survival of embryo-larval stages of the rainbow trout (Oncorhynchus mykiss) exposed to quinoline in water. A continuous-flow system was used in which exposure was initiated at egg fertilization and maintained through 4 days post-hatching (27 days in total). The pH was maintained between 7.4 and 8.1, temperature varied between 13.3°C and 14.2°C and dissolved oxygen ranged between 8.6 and 10.2 mg/L. Five test concentrations were established, using two replicates per test and 100-150 eggs per exposure chamber. Quinoline levels were measured daily. Survival of trout larvae exposed to quinoline was 95% at 13 µg/L, 89% at 90 µg/L and 82% at 370 µg/L.
Milleman et al. (1984) exposed juvenile fathead minnows (Pimephales promelas) to dissolved quinoline in water for 96 hours under static conditions. The pH was maintained at 7.8, the temperature was 20 ± 0.5°C and dissolved oxygen ranged between 8.6 and 4.3 mg/L. An experimental treatment consisted of five specimens placed in a 7.6 L aquarium covered with aluminum foil. Four test concentrations were established, using two replicates per test. Quinoline concentrations were measured at 0, 24, 48, 72 and 96 hours in each test. The acute 96-hour LC50 was 0.44 mg/L(0.12-1.32 mg/L; 95% fiducial limits). Considering all available studies, acute LC50s for freshwater fish ranged from 0.44 to 78 mg/L.
The low bioaccumulative potential of quinoline does not entirely reflect quinoline’s hazard, because the mode of action of the molecule is not based on narcosis. Evidence indicates that quinoline toxicity may be associated with its conversion in organisms, through metabolic activation, to a mutagenic molecule (e.g., Talcott et al. 1976; Eisentraeger et al. 2008; Neuwoehner et al. 2009). Laboratory studies attribute a (low to medium) mutagenic potency to quinoline with regards to bacteria (Talcott et al. 1976). The proposed mode of action is the binding of a metabolic intermediate epoxide to nucleic acids, producing a deoxyribonucleic acid (DNA) adduct. This epoxide metabolite is possibly produced as well during the biotransformation of quinoline by rainbow trout (Bean et al. 1985).
The approach taken in this ecological screening assessment is to examine various supporting information and develop conclusions based on a weight of evidence approach as required under section 76.1 of CEPA 1999. Particular consideration has been given to risk quotient analyses, persistence, inherent toxicity, environmental realism of the exposure scenario used to derive PECs and widespread occurrence in the environment. Endpoint organisms have been selected based on analysis of exposure pathways. For each endpoint organism, a conservative (reasonable worst-case) PEC and a predicted no-effect concentration (PNEC) are determined. The PNEC is arrived at by selecting the lowest critical toxicity value (CTV) for the organism of interest and dividing it by an application factor appropriate for the data point. A risk quotient (PEC/PNEC) is calculated for each of the endpoint organisms in order to contribute to the characterization of ecological risk in Canada .
Selected PECs for this assessment, modelled on the basis of a coal tar pool in soil contaminating groundwater, have been previously discussed and are presented in Table 5.
For the worst-case scenario involving groundwater microorganisms, the PNEC is 5400 µg/L, calculated by dividing the CTV, an EC50 value of 54 mg/L (obtained for inhibition of nitrification by Nitrosomonas spp. in the presence of quinoline), by an application factor of 10.
For the second scenario, exposure of benthic organisms to contaminated water at groundwater recharges, the CTV is 4.90 mg/L,based on a 96-hour acute exposure of Chironomus riparius larvae to quinoline in water.Anapplication factor of 100 was used to extrapolate from acute exposure to chronic exposure and from laboratory species to different species in the field. Dividing the CTV by an overall application factor of 100 produced a PNEC of 49 µg/L for benthic organisms in this scenario.
A third scenario that was developed involved groundwater inputs through seepage areas, which are important for fish spawning, for incubation of eggs and as nurseries for juveniles. For example, these groundwater seepage areas are an important attractant for salmonids seeking spawning grounds (Blanchfield and Ridgway 1997; Bernier-Bourgault and Magnan 2002). To estimate risk to early life stages of fish found on spawning grounds, the study of Black et al. (1983) was considered, in which embryo-larval stages of a salmonid species were exposed to quinoline in water. The CCME (1999) approach for chronic exposure was used to derive the CTV. A CTV value of 34 µg/L was obtained by calculating the geometric mean of the two lowest effect levels, 13 µg/L and 90 µg/L. The geometric mean was assumed to be more environmentally relevant than the lowest effect level (95% survival rate) alone. The CTV was divided by an application factor of 10 to obtain a PNEC of 3.4 µg/L. This PNEC was used for the surface water exposure scenario.
The risk quotients obtained from these PEC and PNEC values are shown in Table 5. Most of the risk quotients are well above 1, with a high of 70. This indicates an important potential for ecological risk from the concentrations of quinoline modelled for surface water and groundwater in contact with coal tar pools in soil.
Abbreviations: CTV, critical toxicity value; PEC, predicted environmental concentration; PNEC, predicted no-effect concentration.
1 The CTV value of 34 µg/L was obtained by calculating the geometric mean of the two lowest effect levels, 13 µg/L and 90 µg/L, from the Black et al. (1983) study.
Quinoline is determined to be persistent in accordance with the Persistence and Bioaccumulation Regulations of CEPA 1999 (Canada 2000), based on observations of its persistence in deep soils, groundwater and air. Available empirical aquatic toxicity data indicate that quinoline may be harmful to aquatic organisms at relatively low concentrations, below 1 mg/L for acute tests and below 0.1 mg/L for chronic tests. In addition, available evidence indicates that quinoline can be biotransformed in fish to an epoxide derivative that can covalently bind to nucleic acids (i.e., form a DNA adduct), resulting in mutagenic effects (Bean et al. 1985).
Quinoline has been detected in a variety of media in Canada . For example, it has been detected in agricultural soils and street sediments in Ontario and in bottom sediments of rivers near industrial areas, although not in concentrations exceeding the calculated PNECs. The receiving environment of the modelled exposure scenario is representative of a high proportion of aquatic systems next to sites impacted by coal tar and creosote in Canada . This observation is supported by information contained in inventories of former coal gasification sites and industrial sites where coal tar was stored and handled which are available for Quebec, Ontario and other provinces (RDRC 1987; MENVIQ 1988; OMEE 1997).
The quantitative exposure estimate was based on modelling predictions. The generic exposure scenario from which the risk quotients are derived is fairly realistic (not overly conservative). Dissolved quinoline concentrations modelled in groundwater are similar to levels of quinoline measured in groundwater elsewhere in the world (Table 4), indicating that they are likely realistic estimates. In addition, the modelled river is not exceptionally small (GRI 1990; OMEE 1997), the groundwater velocity selected is not very large (Freeze and Cherry 1979) and the distance from the tar pool to the river is not exceptionally short (GRI 1990). It is also noted that the number of contaminated sites in Canada that are targeted by this exposure scenario and remain unmanaged is not known with certainty at this time.
Because of paucity of information, exposure scenarios were not developed and characterized for environmental risk for the following potential releases of quinoline to the environment: atmospheric emissions from steel plants equipped with coke ovens and aluminum smelters, and emissions to soil and water from industrial facilities currently handling coal tar or creosote, use of coal tar based asphalt sealants and roofing materials, creosote-impregnated wood used in harbour docks, and creosote-impregnated railroad frames used in support walls along lake shorelines. Therefore the risk to the environment concerning quinoline releases from these sources is currently not known.
As quinoline is a naturally occurring substance, in principle, its background concentration could be considered in the risk characterization. However, no information was found regarding biogeochemical background concentrations of quinoline in groundwater, surface water and subsoil environments. It is expected that natural concentrations of quinoline contribute negligibly to PECs of surface waters, given that quinoline levels in pre-industrial sediments appear to be less than 1 µg/kg (Furlong and Carpenter 1982) and that this substance has greater affinity to particulate organic matter than to water.
Available data on the concentrations of quinoline in ambient air, surface water, groundwater, soil and sediment are summarized in Table 4. Limited data on the indoor air concentrations of quinoline in Canada or in other countries were identified.
In a Canadian indoor air survey conducted in 1991, indoor air samples were collected in 757 randomly selected residences. Quinoline was detected in the pooled indoor air samples at a concentration of 22 µg/m3 (Otson et al. 1992, 1994). More recently, in an air quality survey conducted during the winter of 2002 and 2003 in 75 randomly selected residences in Ottawa, Ontario, quinoline was not detected in the indoor (living room or family room) or outdoor (driveway) air samples (the estimated detection limit was 0.05 µg/m3). Ten percent of the air samples were collected from homes with smokers (Zhu et al. 2005). Although the recent information on concentrations of quinoline in Canadian air is limited due to the lack of measurement of a concurrent quinoline standard sample (Zhu et al. 2005), the estimated limit of detection for quinoline in this study (i.e., 0.05 µg/m3) is comparable with the indoor air concentration of quinoline measured from the homes with non-smokers (i.e., 0.04 µg/m3) in a California survey (Air Resources Board 1993), which was conducted in 280 houses selected from Placerville and Roseville in the winter of 1992. The results of the California survey suggested that tobacco smoking is a major source of quinoline in indoor air; maximum quinoline concentrations of 0.22 and 0.16 µg/m3 were detected in houses with smokers and in houses with smokers and fireplace use, respectively, compared with the maximum of 0.04 µg/m3 detected in houses with fireplace use and no smokers (Air Resources Board 1993). In addition, in a study conducted during the winter heating season of 1987, indoor and outdoor air samples were collected from eight homes in Columbus, Ohio. At each home, indoor air samples were taken in the kitchen and living room over two consecutive 8-hour periods, and a single 16-hour air sample was collected outdoors. The average concentrations of quinoline in the kitchen, living room and outdoors were 140, 240 and 3.3 µg/m3, respectively. The samples were further categorized by the heating and cooking systems used in the house and by the residents’ lifestyles (i.e., with or without tobacco smoking). The highest average concentration of quinoline was 26 µg/m3 in the indoor air of homes with non-smokers and 560 µg/m3 in the indoor air of homes with smokers (Chuang et al., 1991). However, the units given in this study are inconsistently reported in the tables (as µg/m3)and in the text (as ng/m3) and therefore they were possibly erroneous.
No data on the concentrations of quinoline in drinking water were available. In the only available study concerning quinoline concentrations in Canadian surface water, quinoline was not detected in the surface water sampled from Rainy River, Ontario, in 1986, at three water quality monitoring stations and from the final effluents of two bleached kraft pulp and paper mills discharging into the river (the detection limit was 0.001 µg/L) (Merriman 1988).
Quinoline was detected in 3 samples, at a maximum concentration of 60 µg/kg dry weight, among 24 soil samples collected in 1992 from eight agricultural fields in southern Ontario that had received single or multiple sludge applications (Webber 1994). Additionally, quinoline was not detected in soil at two locations in Ontario (the detection limit was 0.02-0.1 mg/kg) (Golder Associates Ltd. 1987).
Data relating to the concentrations of quinoline in food or food packaging were not identified. In a field experiment, Elliptio complanata mussels were exposed in cages for 3 weeks at 14 stations in St. Marys River, Ontario and Michigan, in October 1985. Quinoline was not detected in any of the samples (the detection limit was 1 µg/kg wet weight) (Kauss and Hamdy 1991).
Based on the limited available information on the concentrations of quinoline in ambient air and indoor air (Zhu et al. 2005), surface water (as a surrogate for data on drinking water concentrations) (Merriman 1988) and soil (Webber 1994) in the Canadian environment, the upper-bounding estimate of intake for the general Canadian population ranges from 0.01 µg/kg body weight (kg-bw) per day (for those 60+ years of age) to 0.03 µg/kg-bw per day (for those 6 months to 4 years of age), with indoor air potentially representing the most important source of exposure (see Appendix 3).
Consumer products represent a potential source of exposure. Based on confidential information provided through the survey conducted under section 71 of CEPA 1999 (Environment Canada 2001a), the daily intake of quinoline from consumer products was estimated to be 1.7 × 10⁻³ µg/kg-bw per day for adults (20-59 years of age), which is lower than the estimate of daily intake from environmental media. In addition, coal tar-based driveway sealants, in which quinoline exists as a natural component of coal tar pitch (Zhu 2007; EHS 2010), may be a source of consumer exposure. Coal tar-based pavement sealants are mainly applied outdoors by consumers using rollers; taking into account the physical and chemical properties of quinoline, it is not likely that use of coal tar-based pavement sealants would significantly elevate the quinoline concentration in outdoor air. Accordingly, quinoline was not detected in outdoor (driveway) air samples in Ottawa, Ontario (Zhu et al. 2005). In a laboratory experiment, coal tar-based pavement sealant products were enclosed in vials for 48 hours; quinoline was detected in the headspace air of the vials, with a maximum average concentration of 9 µg/m3 (Zhu 2007). This air concentration of quinoline would be much higher than the actual acute exposure level during use of coal tar-based pavement sealants, as the experimental design does not include dispersion into the outdoor atmosphere.
Confidence in the exposure database is considered to be moderate. Data were available on levels of quinoline in the environmental media that are most relevant to general population exposure (i.e., water and indoor/ambient air). Although no data were available on quinoline levels in food, nor for water in the urban environment, these are not expected to be a significant source of intake, as quinoline is unlikely to bioaccumulate due to a low octanol-water partition coefficient, as discussed in the Persistence and Bioaccumulation Potential section.
Appendix 4 summarizes the available health effects information for quinoline. The US Environmental Protection Agency (US EPA) has published an assessment of quinoline (US EPA 2001). In the studies reviewed in the US EPA (2001) assessment, there were increased incidences of an unusual tumour (i.e., hemangioendotheliomas) in multiple strains of rats and mice exposed orally, hepatic tumours (i.e., adenomas and hepatomas) in mice following single intraperitoneal injections at an early age and skin tumours in mice exposed dermally in an initiation-promotion study. Many of these studies are dated and are limited by the use of only one sex of animals, small dose groups, short durations of exposure and, in some cases, a lack of statistical analyses. The critical study, which was originally selected by the US EPA (2001), for which the exposure-response relationship was best characterized, was a bioassay by Hirao et al. (1976) in which increased incidences of hepatocellular carcinomas and hemangioendotheliomas and/or hemangiosarcomas were observed in the livers of male rats exposed to concentrations of 0%, 0.05%, 0.10% or 0.25% quinoline in the diet (equivalent to 0, 25, 50 and 125 mg/kg-bw per day, respectively) for up to 40 weeks. Based on a relatively extensive in vivo and in vitro genotoxicity database, quinoline is considered to be genotoxic (US EPA 2001). Recent data on the clastogenicity of quinoline further support this conclusion (H. Suzuki et al., 2005, 2009; T. Suzuki et al. 2007).
Non-neoplastic effects, including increased absolute and relative liver weights, fatty changes, bile duct proliferation and oval cell infiltration of the liver, were also observed at all doses (i.e., ≥25 mg/kg-bw per day, the lowest-observed-effect level [LOEL]) in the study by Hirao et al. (1976). Similar non-neoplastic effects on the liver have been observed in other limited investigations of shorter duration or by less relevant routes of exposure in rats, mice, guinea pigs and hamsters. The US EPA (2001) noted that the observed non-neoplastic hepatic changes, body weight loss and early mortalities were considered by the authors of these studies (and by the US EPA in a previous assessment) to be related to the hepatocarcinogenicity of quinoline. The US EPA further indicated that while the relationship of some non-neoplastic effects (e.g., body and liver weight changes, oval cell infiltration, proliferation of bile ducts, and fatty degeneration of parenchymal cells) to tumour formation was not as clear, it is likely that these effects were at least confounded by tumour formation in the liver and were not reported in a manner that would allow a meaningful quantitative characterization of the dose-response relationship.
On the basis of sufficient evidence of carcinogenicity in experimental animals and supporting evidence of genotoxicity, the US EPA (2001) concluded that quinoline is “likely to be carcinogenic in humans.” Recent data do not materially impact upon the selection of the critical study or the conclusions reached by the US EPA (2001).
Confidence in the toxicological database for quinoline is considered to be moderate. Although there is an extensive database of genotoxicity assays, the available carcinogenicity studies are somewhat limited and dated.
A critical effect for the characterization of risk to human health is carcinogenicity, based on the observation of hemangioendotheliomas in multiple strains of rats and mice exposed orally. In addition, quinoline induced hepatoadenomas and carcinomas following intraperitoneal injection and initiated skin tumours following dermal application in mice. Quinoline was also genotoxic and mitogenic in several in vitro and in vivo assays. Therefore, although the mode of induction of tumours has not been fully elucidated, it cannot be precluded that the tumours observed in experimental animals resulted from direct interaction with genetic material, for which there may be a probability of harm at any level of exposure.
Exposure of the general population to quinoline is expected to be mainly from air. Comparison of the critical effect level for non-neoplastic effects (i.e., 25 mg/kg-bw per day) with the upper-bounding estimate of exposure (i.e., 0.03 µg/kg-bw per day) results in a margin of exposure of approximately 5 orders of magnitude (approximately 800 000). If exposure to quinoline through use of consumer products is considered, the margin of exposure would remain in the same range of magnitude. These margins of exposure for non-neoplastic effects are considered adequate.
There is uncertainty in the total daily intake estimates for the general population in Canada owing to the paucity of measured quinoline concentrations in the Canadian environment. Only two Canadian semiquantitative indoor and outdoor air surveys were identified, and no Canadian data on quinoline concentrations in drinking water or food are available, although food is not expected to be a significant source of intake. In addition, the general population may be exposed to quinoline from tobacco smoking and incomplete combustion, which could increase the level of exposure. In light of the low concentrations of quinoline in the consumer products in the Canadian marketplace and the use pattern of coal tar-based pavement sealants, in which quinoline exists as a natural component, general population exposure to quinoline through the use of consumer products is expected to be low.
Although the collective evidence indicates that this substance can directly interact with genetic materials, there is uncertainty regarding the mode of action of quinoline-induced tumorigenesis. The relevance to humans of the tumours observed following intraperitoneal injection is uncertain. Available data are insufficient to assess the intraspecies and interspecies variations in sensitivity and carcinogenicity. In addition, toxicological information dataset is incomplete as inhalation study data are not available. As well, there is uncertainty regarding the potential reproductive toxicity of quinoline, as relevant data were not identified.