
Great Lakes quarterly climate impacts and outlook: September 2016
September 2016
Great Lakes Significant Events - for June-August 2016
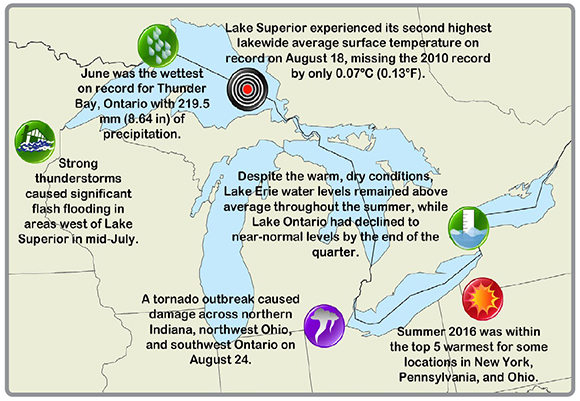
Long description
A map of the Great Lakes displaying key highlights from the significant events section. The highlights are as follows: Lake Superior experienced its second highest lake wide average surface temperature on record on August 18, missing the 2010 record by only 0.07°C (0.13°F). June was the wettest on record for Thunder Bay, Ontario with 219.5 mm (8.64 in.) of precipitation. Strong thunderstorms caused significant flash flooding in areas west of Lake Superior in min-July. Despite the warm, dry conditions, Lake Erie water levels remained above average throughout the summer, while Lake Ontario had declined to near-normal levels by the end of the quarter. A tornado outbreak caused damage across northern Indiana, northwest Ohio, and southwest Ontario on August 24. Summer 2016 was within the top five warmest for some locations in New York, Pennsylvania, and Ohio.
The Great Lakes basin experienced a wide range of extreme weather this summer. Temperatures in the basin this summer were above normal, with the greatest departures from normal occurring in August. Summer 2016 was within the top 5 warmest for Rochester (NY), Buffalo (NY), and Erie (PA) (records began in the 1870s). High minimum temperatures were a large contributor to the warmth this summer. Ohio’s summer minimum temperatures were the warmest on record since records began in 1895.
Precipitation varied from drier-than-normal in the eastern Great Lakes to wetter-than-normal in the western Great Lakes. The dry conditions, which were predominant in the early summer, led to drought development in New York, Pennsylvania, Ohio, Michigan, and portions of Ontario. On the other hand, Thunder Bay, Ontario recorded 219.5 mm (8.64 in) in June, making this their wettest June on record since records began in 1877.
Strong thunderstorms in mid-July caused significant flash flooding in areas west of Lake Superior in Minnesota and Wisconsin. Rainfall amounts totaled 102 to 254 mm (4 to 10 inches) in a 24-hour period, with much actually falling within an 8-hour period. Gurney, Wisconsin recorded 245 mm (9.65 in) on the morning of July 12, making it their highest one-day precipitation total on record since records began in 1952.
A tornado outbreak on August 24 caused substantial damage in portions of Indiana, southwest Ontario, and northwest Ohio, which is unusual for this time of year. The 25-year average for August tornadoes in Indiana and Ohio is only two, but these states had over 21 combined on August 24. In fact, the 21 tornadoes reported in Indiana and Ohio ranks in the top 10 list for the largest number of tornadoes in a single August day across the U.S. (since 1950).
Regional Climate Overview - for June-August 2016
Precipitation
June was dry for all lake basins except Superior, with the Great Lakes basin receiving 83% of normal precipitation. The July storm track brought near- to above-normal precipitation to the upper lakes, while the lower lakes had below-normal precipitation. The overall basin received 91% of normal in July. In August, all lakes received above-normal precipitation, with the overall basin receiving 138% of normal. Summer averaged out to be drier than normal for Lake Ontario, wetter than normal for Lake Superior, and near normal for the other lake basins. Overall, the Great Lakes basin received 104% of normal summer precipitation.
June and August 2016 graphics are shown to display the range in precipitation this summer.
Precipitation normals based on 1981-2010
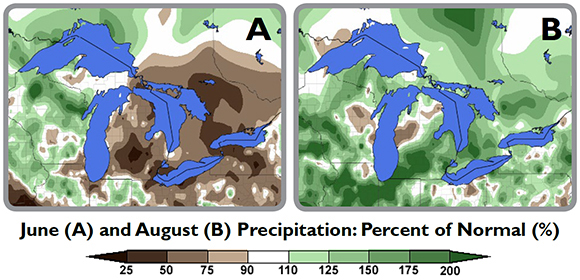
Long description
Maps of the Great Lakes showing precipitation as the percent of normal for June 2016 (A) and August 2016 (B). Shades of brown on left map show that precipitation has been below normal southern Ontario, Michigan, northern Pensylvania and New York State. Elsewhere, precipitations were above normal. Shades of green on right map show that precipitation has been above normal across the basin, except for small areas of Michigan and Wisconsin.
Air temperature
June temperatures ranged from 1°C (2°F) below normal to 2°C (4°F) above normal, while July temperatures ranged from near normal to 3°C (5°F) above normal. The entire region was warmer than normal in August, with temperatures ranging from 1°C (2°F) to 5°C (9°F) above normal. New York and Pennsylvania were record warm, while Ohio had its 3rd warmest August. The eastern Canadian basin observed August mean temperatures that were extremely above normal (90th-98th percentile). Summer temperatures ranged from near normal to 3°C (5°F) above normal.
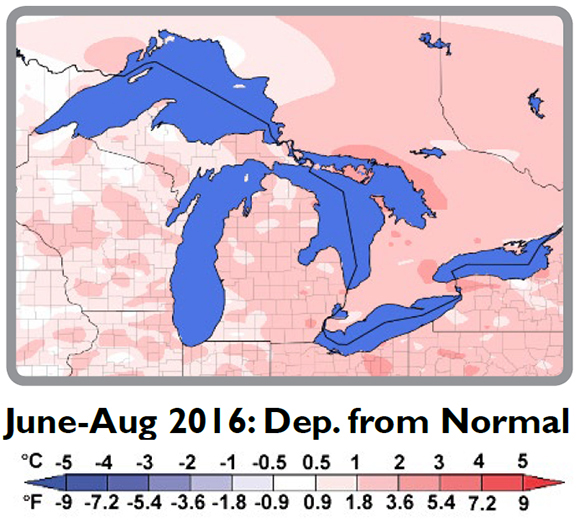
Long description
Maps of the Great Lakes showing the temperature departures from normal in degrees Celsius for June-August 2016. Light to medium-pink shades show that the entire Great Lakes basin experienced temperatures that were up to 2°C (3.6°F) above normal.
Water temperature
All Great Lakes surface water temperatures were above the long-term average for June, July, and August. Some temperatures were as much as 3.5°C (6.3°F) above average for the period.
Air temperature normals based on 1981-2010. Water temperature long-term average is 1995-2015.
Great Lakes water levels
With the exception of Lake Superior, all lakes generally experienced dry conditions during the past three months, yet levels on all but Lake Ontario remained above average throughout the quarter. At the end of August, Lake Superior was 16 cm (6.3 in) above average, Lake Michigan-Huron was 28 cm (11.0 in) above average, and Lake Erie was 24 cm (9.45 in) above normal. The past three months were especially dry on Lake Ontario, and it finished the quarter 2 cm (0.8 in) below average, 20 cm lower than last year.
Regional Impacts - for June-August 2016
Drought
After persistent dry conditions, drought developed in the eastern Great Lakes basin. Several counties in New York experienced extreme drought conditions for the first time since at least 2000, when the U.S. Drought Monitor data began.
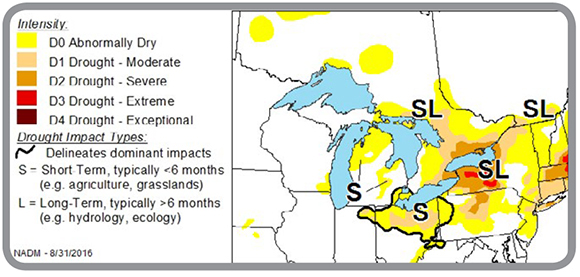
Long description
Maps of the Great Lakes showing drought conditions on August 31 2016. Shades of yellow, orange show abnormally dry and moderate drought conditions for the eastern half of the basin. Severe drought (dark orange) is centered on Lake Ontario with areas of extreme drought (red) south of it.
Agriculture
The yields of corn, soybeans, and hay are expected to be lower than average in some drought areas. Dried up pastures forced farmers in New York to supplement with feed, which is usually saved for the winter. Despite the drought conditions in New York, grape growers indicated berries were ripening faster than usual and may be smaller in size, but higher quality. Areas to the west that were wetter are expecting above-average yields this summer.
Seasonal growing degree day accumulations were above average for much of the basin. This may reduce the risk for fall freeze damage since crops may reach maturity before the first killing freeze.
Water Resources
As a result of drought conditions, streamflow and groundwater levels were at record or near-record low levels in parts of New York, with some private wells going dry. In late July, Ithaca, New York’s water supply was critically low, with an estimated 30 days of water left without significant rain or reduction in use.
Transportation & Infrastructure
The mid-July flash flooding around western Lake Superior resulted in many road closures, including major interstates. In Lake Superior, numerous vessels were affected by downburst winds. Six vessels became adrift and some were overturned. Preliminary damage estimates for eight Wisconsin counties totaled over $28 million to public infrastructure.
Hot and dry weather and aging infrastructure led to a dozen water main breaks in the Buffalo, New York area in July.
Water Quality
The size of the western Lake Erie harmful algal bloom is smaller this year due to developing and persistent drought conditions in the region. However, NOAA scientists have found that toxic algae is still forming as bloom toxin concentrations are significantly higher than last year. The drivers behind changes in toxicity are still under investigation and areas of algal scum could still present risk and should be avoided.
Regional Outlook - October-December 2016
Lake levels
All of the Great Lakes typically begin or continue their seasonal decline at this time of the year, as lake evaporation rates are at their highest due in large part to declining air temperatures and relatively warm lake water. Water levels are expected to remain above average for lakes Superior, Michigan-Huron, and Erie unless exceedingly dry conditions are experienced. Lake Ontario water levels are expected to remain near average unless exceedingly wet or dry conditions are experienced.
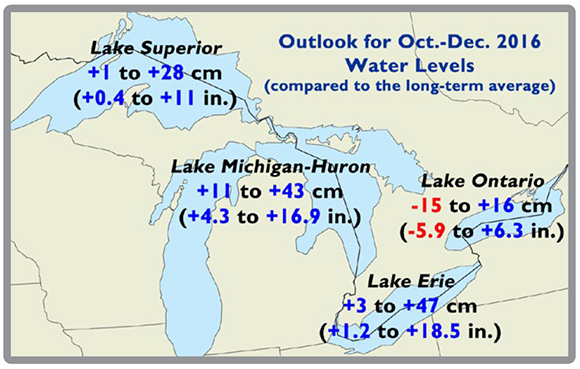
Long description
| Lake | Forecasted high compared to the long-term average in centimetres | Forecasted low compared to the long-term average in centimetres | Forecasted high compared to the long-term average in inches | Forecasted low compared to the long-term average in inches |
|---|---|---|---|---|
| Superior | +28 cm above | +1 cm above | +11 in. above | -0.4 in. below |
| Huron-Michigan | +43 cm above | +11 cm above | +16.9 in. above | +4.3 in. above |
| Erie | +47 cm above | +3 cm above | +18.5 in. above | +1.2 in. above |
| Ontario | +16 cm above | -15 cm below | +6.3 in. above | -5.9 in. below |
Temperature and precipitation outlook
The October-December 2016 period is forecasted to have a greater chance of above-normal temperatures for both the U.S. and Canadian Great Lakes basins by the Climate Prediction Center (CPC) and Environment and Climate Change Canada (ECCC). On the other hand, there is no clear signal on whether precipitation will be above, near, or below normal. The current monthly and seasonal outlooks can be found through CPC and ECCC.
Drought forecast
For the U.S. Great Lakes basin, drought is expected to persist in New York into the October-December 2016 period. In Ohio, drought removal is likely. Agriculture and Agri-Food Canada expects that drought conditions will also continue in the Canadian Great Lakes basin into the October-December 2016 period.
Great Lakes Region Partners
- Environment and Climate Change Canada
- Agriculture and Agri-Food Canada
- Midwestern Regional Climate Center
- Northeast Regional Climate Center
- Great Lakes Region State Climatologists
- National Oceanic and Atmospheric Administration
- Great Lakes Integrated Sciences and Assessments
- US Army Corps of Engineers, Detroit District
- National Integrated Drought Information System
- Great Lakes Water Level Dashboard
Contacts for National Oceanic and Atmospheric Administration:
- Molly Woloszyn: mollyw@illinois.edu
- Samantha Borisoff: samantha.borisoff@cornell.edu
Contacts for Environment and Climate Change Canada: