
Gulf of Maine quarterly climate impacts and outlook: December 2015
Gulf of Maine Region, December 2015
Gulf of Maine Significant Events - September - November 2015
September would have been a dry month for most of the region if not for two storms that brought heavy rainfall. Due to the storms, some areas ended September with nearly three times their normal rainfall. On September 11, a slow-moving low pressure system dropped up to 100 mm (4 in.) of rain, with the greatest amounts in southern New Brunswick. Along the Bay of Fundy coast, local rainfall rates exceeded 35 mm (1.4 in.) per hour. The storm caused flash flooding in Fredericton and Saint John. From September 29 to October 1, tropical moisture fueled a stalled front and low pressure system, which dumped 100 mm (4 in.) to 250 mm (10 in.) of rain on parts of Maine, New Brunswick, and Prince Edward Island. Local rainfall rates were around 35 mm (1.4 in.) per hour. Numerous roads and bridges were washed out or closed. More than 400 New Brunswick locations were damaged, with some roads still closed as of early December. The Department of Transportation and Infrastructure estimated repairs would top $15 million in the province. Coastal flooding was made worse by high tide in Portland, ME, which had its 2nd all-time wettest September day. The heavy rain also caused the Maine coast to be closed to shellfish digging. In addition, wind gusts up to 119 km/h (74 mph) downed trees, leading to tens of thousands of power outages. Several New Brunswick and Maine schools were closed.
A powerful storm associated with the remnants of Hurricane Patricia brought strong winds and heavy rain to the region from October 27 to 29. In Washington County, ME, sustained winds of 64 km/h (40 mph), with gusts to 106 km/h (66 mph), were reported. Downed tree limbs led to power outages for more than 25,000 customers in Maine, New Brunswick, and Nova Scotia. Strong winds, large waves, and high tides resulted in flooding and erosion along the Bay of Fundy coast. A barge flipped over in high waves near Saint John, NB. Rainfall from the event totaled up to 100 mm (4 in.).
On November 23, a storm brought strong winds and up to 100 mm (4 in.) of rain to southern New Brunswick, Nova Scotia, and Prince Edward Island, while up to 13 cm (5 in.) of snow fell in northern New Brunswick. The heavy rain led to shellfish closures for parts of the Northumberland Strait and the north shore of Prince Edward Island.
Eleven high temperature records were set in New Brunswick on September 7, while Boston, MA set record highs on the 8th and 9th. Woodstock, NB and Portland, ME had their warmest Septembers on record. November’s warmth contributed to New Brunswick receiving only 26% of normal snowfall for the month, Caribou, ME seeing only 36% of normal snowfall, and many other U.S. sites receiving no measurable snow.
The 2015 Atlantic hurricane season featured eleven named storms, which was below average. However, four named storms entered the Canadian Hurricane Centre Response Zone, which was near the annual average.
Long description for Significant Events map
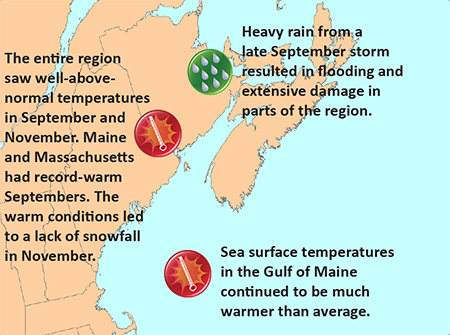
The map of the Gulf of Maine Region, including Massachusetts, New Hampshire, Maine, New Brunswick, Nova Scotia, Prince Edward Island, and the nearby marine areas, highlights significant events that occurred in the autumn of 2015. The following highlights are noted:
- The entire region saw well-above-normal temperatures in September and November. Maine and Massachusetts had record-warm Septembers. The warm conditions led to a lack of snowfall in November.
- Heavy rain from a late September storm resulted in flooding and extensive damage in parts of the region.
- Sea surface temperatures in the Gulf of Maine continued to be much warmer than average.
Regional Climate Overview - September - November 2015
Temperature
Departure from Normal
Long description for Temperature Departure from Normal map
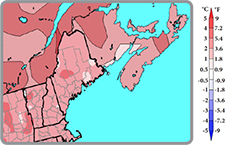
Map of the temperature departure from normal for the Gulf of Maine region averaged over September, October, and November 2015. When averaged over the 3 fall months, temperatures were above normal over the entire region. Most of the region was 1° to 2° C above normal. Parts of eastern mainland Nova Scotia and northern New Brunswick were 2° to 3° C above normal. Parts of eastern Maine and southern sections of New Brunswick along the Bay of Fundy as well as the Cape Chignecto area of Nova Scotia were 0.5° to 1° C above normal, not quite as warm as the rest of the region.
September was a very warm month region-wide, with temperatures 2°C (3.6°F) to 5°C (9°F) above normal. Maine and Massachusetts had their warmest Septembers on record, while New Hampshire had its second warmest. Several Maritimes sites also ranked this September among their top two warmest. October temperatures ranged from 2°C (3.6°F) below normal to near normal for most of the region. The coolest spots were in Maine and New Brunswick, while parts of Nova Scotia were up to 1°C (1.8°F) above normal. November was another warm month, with temperatures 1°C (1.8°F) to 3°C (5.4°F) above normal. With the warm September and November, autumn temperatures were generally 0.5°C (0.9°F) to 3°C (5.4°F) above normal. The three states ranked this autumn among their top three warmest on record.
Temperature and precipitation normals based on 1981-2010. Canada and ocean precipitation data: Canadian Precipitation Analysis. U.S. precipitation data: interpolated station data.
Precipitation
Percent of Normal
Long Description for Precipitation as a Percent of Normal Map
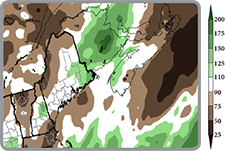
Map of the total precipitation as a percentage of normal precipitation, summed over the months of September, October, and November, for the Gulf of Maine region. Drier-than-normal conditions, depicted in shades of brown, with 50 to 90% of normal precipitation, are shown over several areas including Massachusetts, southeastern and northern New Hampshire, northern and parts of southern Maine, and parts of southern and eastern Nova Scotia and eastern Prince Edward Island. Wetter-than-normal areas are depicted in shades of green. Parts of eastern New Brunswick saw 150 to 200 % of normal precipitation. Downeast Maine and the rest of New Brunswick received 110 to 150% of normal precipitation. Remaining areas were near normal (depicted as white).
September precipitation varied widely, from 25% of normal in northern Nova Scotia to more than 200% in parts of northern Maine and southern New Brunswick. In October, the majority of the region saw 50% to 90% of normal precipitation. The wet exceptions were parts of Maine and Cape Cod, which saw more than 125% of normal. In November, the three states generally saw 25% to 75% of normal precipitation. In the Maritimes, precipitation ranged from 50% of normal to near normal in most areas; however, some sites around the Bay of Fundy saw up to 125% of normal. Fall precipitation varied throughout the region, ranging from 50% to 200% of normal.
Sea Surface Temperatures
Departure from Normal
Long Description for Sea Surface Temperatures Departure from Normal Map
Map of the sea surface temperature departure from normal averaged over the autumn months of September, October, and November, for the Gulf of Maine region, covering the Bay of Fundy, the Gulf of Maine, and waters south of Nova Scotia. The entire region was above normal, depicted in shades of red. Detailed descriptions of the locations of the anomalies are included in the main text.
Autumn sea surface temperature anomalies in the Gulf of Maine were substantially warmer than the autumn long-term average over the entire study area. Temperatures over coastal areas were 0.5°C (0.9°F) to 1.0°C (1.8°F) above normal, strongest in the Massachusetts Bay region and weaker off mid-coast Maine and in the Bay of Fundy. Anomalies were up to 2.0°C (3.6°F) warmer than normal over deeper basins in the central Gulf of Maine and the Scotian Shelf off southern Nova Scotia. The persistent above-normal ocean temperatures have had impacts on several species. More information can be found in the Impacts section on the next page.
Sea surface temperature anomalies based on 1985-2014. Mean SST anomalies from NOAA AVHRR data. Credit: University of Maine School of Marine Sciences and NERACOOS
Regional Impacts - September - November 2015
Dryness and September Warmth
Long Description for the US Drought Monitor Map
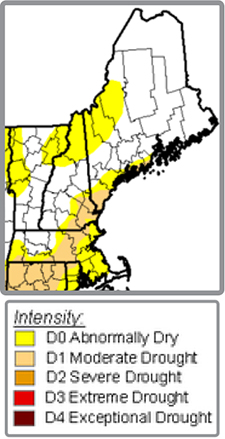
Map showing intensity of drought over the New England states. The map legend shows 5 intensity levels ranging from D0 Abnormally Dry to D4 Exceptional Drought. The map shows D0 (Abnormally Dry) conditions over northern New Hampshire and western Maine. The map shows D0 and D1 (Abnormally Dry and Moderate Drought) conditions over eastern Massachusetts, southeastern New Hampshire, and southern Maine. The other parts of the 3 states, including central New Hampshire and northern and eastern Maine did not show drought or abnormally dry conditions.
Abnormal dryness and moderate drought, which began in spring and continued through summer, lingered through fall in parts of Maine, New Hampshire, and Massachusetts. Falling water levels in wells, reservoirs, lakes, and waterways led to voluntary water restrictions in several New England towns. In late September, two Maine counties were declared natural disaster areas due to damages and losses caused by drought.
Prolonged warmth in September delayed the onset of the fall foliage season by up to two weeks for the entire region and extended the growing season in New Brunswick. Weather conditions were generally good for field work and harvest. The warm temperatures helped pumpkins ripen early in some areas, but delayed color development in cranberries and a few apple varieties. The warmth also delayed the Maine potato harvest by a few days as it was too warm to store potatoes. Many crops, especially pumpkins, apples, and potatoes, were expected to be abundant and of high quality.
The U.S. Drought Monitor from December 10 showed continuing areas of abnormal dryness and moderate drought in the three states.
Impacts of Ocean Warming

Long Description for the Global Sea Surface Trend Map
The map shows sea surface temperature trends over the globe, from 2004-2013. Increasing trends are shown in red, decreasing trends in blue, with a range between +0.25° per year to -0.25° per year. The black box indicates the location of the Gulf of Maine. The Gulf of Maine, coastal areas along the eastern seaboard of the US, and the waters around the Maritimes and the island of Newfoundland all show a strong warming trend. Other areas of strong warming are west of Australia, the Southern Ocean, and parts of the western and central North Pacific. Warming is shown over the Indian Ocean, the western central Pacific, the waters west of Central America, the central Atlantic, the Mediterranean, and some Arctic waters. Cooling trends are shown over the eastern North Pacific, the Bering Sea, parts of the central Pacific, parts of the eastern South Pacific, and the eastern North Atlantic Ocean.
Global sea surface temperature trend from 2004-2013. The black box on the map shows the location of the Gulf of Maine. Credit: Andy Pershing, Gulf of Maine Research Institute
A recent report in Science identified the Gulf of Maine as one of the fastest warming regions of the global oceans and linked the warming to the decline in the region’s cod fishery. The authors found that the Gulf of Maine warmed three times faster than the global average rate since 1982. Between 2004 and 2013, the rate in the Gulf of Maine was faster than 99.9% of the global ocean. The study found that rising water temperatures reduced the productivity of cod stocks, and that not accounting for the productivity change led to fishing quotas that were too high. Gulf of Maine cod are now at record low levels and quotas are so reduced that fishermen must now avoid cod.
The rapid warming in the northwest Atlantic has been linked to changes in the distribution of many ocean species. Over the last several years, scientists have reported seeing fewer critically endangered right whales in their traditional feeding grounds in the Bay of Fundy. Right whales come to the Gulf of Maine to feed on a particular cold-water zooplankton species, leading to speculation that warm waters may have reduced the abundance of the whales’ favorite food. Fishing and shipping regulations in the Gulf of Maine have been designed to protect whales. During summer 2015, scientists searching for right whales outside their traditional feeding grounds found a surprising number of the whales in the Gulf of St. Lawrence.
Regional Outlook - Winter 2015-16
El Niño

Long Description for the Time Series Graph of Sea Surface Temperature Anomalies in the Niño 3.4 region of the central Pacific
The time series shows sea surface temperature anomalies in the Niño 3.4 region of the central Pacific, for the years from 1950 to 2015. The anomalies range from about -2.0 °C to over 2.0° C. Years with strong El Niños (strong positive anomalies, reaching about 1.7° to 2.3° C) are indicated in red. These are the years 1957-58, 1965-66, 1972-73, 1982-83, 1997-98 (the strongest), and 2015-16.
Atmospheric and oceanic observations through November reflect a strong El Niño. The time series above shows warm and cold periods of sea surface temperatures in the Niño 3.4 region of the central Pacific. When comparing these, this El Niño ranks as one of the strongest on record. El Niño conditions will persist into early 2016 before weakening and transitioning to ENSO-neutral conditions by late spring or early summer.
As storms often move up the coast during El Niño winters, the U.S. East Coast generally experiences above-normal precipitation. Typically with strong El Niños, above-normal temperatures are favored in New England. Milder-than-normal winters also tend to occur in Eastern Canada .
Other factors can also affect winter conditions, such as climate variability associated with the Arctic Oscillation and the North Atlantic Oscillation. These patterns are less able to be forecasted far in advance compared to El Niño, meaning that it is uncertain as to how much they will affect the upcoming winter season.
Temperature

Environment Canada map produced on November 30.
Long description for Environment Canada Temperature map
The map shows the probability that the seasonal temperatures averaged over December to February will be above normal over the Maritime provinces. The probability of warmer than average temperatures is very high, over 90%, over most of New Brunswick, Nova Scotia, and Prince Edward Island.
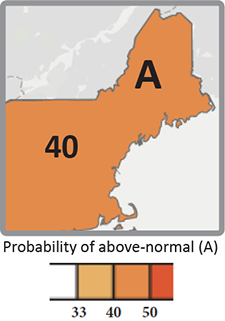
U.S. Climate Prediction Center map produced on November 19.
Long description for U.S. Climate Prediction Center Temperature map
The map shows the probability that the seasonal temperatures averaged over December to February will be above normal over the New England states of Massachusetts, New Hampshire, and Maine. The probability is over 40%.
For December through February, Environment Canada and NOAA’s Climate Prediction Center are both calling for an increased chance of above-normal temperatures for the Gulf of Maine region.
Precipitation
Environment Canada is predicting an increased chance of above-normal precipitation for December through February for New Brunswick, western Prince Edward Island, and portions of Nova Scotia. Equal chances of below-, near-, or above-normal precipitation was forecast for the rest of the Maritimes. NOAA’s Climate Prediction Center is calling for an increased chance of above-normal precipitation for Massachusetts and southeastern New Hampshire for winter. Equal chances were forecast elsewhere.
Gulf of Maine Region Partners
- Environment Canada
- Northeast Regional Climate Center
- National Oceanic and Atmospheric Administration
- Gulf of Maine Research Institute
- State Climatologists
- National Integrated Drought Information System
- Cooperative Institute for the North Atlantic Region
- Gulf of Maine Council on the Marine Environment, Climate Network
- Northeastern Regional Association of Coastal and Ocean Systems
- University of Maine, School of Marine Sciences
Contacts
NOAA:
Ellen Mecray
Samantha Borisoff
Environment Canada:
1-800-668-6767 (in Canada only)
819-997-2800 (long-distance charges apply)
Sign up to receive this publication every quarter.