
Gulf of Maine quarterly climate impacts and outlook: December 2016
Gulf of Maine Region
December 2016
Gulf of Maine Significant Events - September - November 2016
Despite several heavy rain events, long-term precipitation deficits and drought conditions continued in New England and parts of the Maritimes. The drought intensified in September and persisted through October and November, affecting water resources and agriculture (see Impacts section for details).
Severe thunderstorms hit Massachusetts, New Hampshire, Maine, and New Brunswick in mid-September. Strong winds downed dozens of trees and power lines, with more than 22,000 customers in southern New Hampshire losing power. Downpours caused localized flooding in Concord, NH; Ashland, ME; and Juniper, NB.
An intense low pressure system fueled by the remnants of Hurricane Matthew tracked east of New Brunswick from October 9-11. More than a dozen extreme 24-hour precipitation records were broken in the Maritimes, primarily in Nova Scotia. Sydney, NS received 219 mm (8.60 in.) of rain on October 10, making it the site’s wettest day since 1870 and the third wettest day on record for Nova Scotia. Sydney also had its wettest October on record. The heavy rain caused significant flooding (see Impacts section for details). Other parts of the region saw up to 88 mm (3.46 in.) of rain. In addition, wind gusts of up to 137 km/h (85 mph) led to vehicle restrictions on bridges, cancelled ferry crossings, and downed trees and wires. At least 90,000 Maritimes customers lost power, some for more than two days.
From October 21-23, a post-tropical low from the south merged with a trough from the west to produce up to 161 mm (6.34 in.) of rain, with the greatest totals in southern Maine. Several feet of water flooded roadways, stranding cars and closing roads in parts of the three states and Halifax, NS. The storm also produced strong winds, which contributed to power outages and rough seas.
More than 30 high temperature records were broken in the Maritimes on October 7 and 8, with several sites nearing 25°C (77°F). Caribou, ME set a record high of 24°C (76°F). On October 22, temperatures once again approached 25°C (77°F), setting about a dozen new high temperature records in the Maritimes.
Back-to-back storms brought heavy snow to northern Maine and the Maritimes in late November. From November 27-29, up to 38 cm (15 in.) of snow and wind gusts to 110 km/h (68 mph) led to more than 35,000 customers losing power in the Maritimes. Then from November 30-December 1, up to 43 cm (17 in.) of heavy, wet snow fell, with the greatest totals in northern Maine. Downed trees and power lines left nearly 80,000 customers without power in the Maritimes and Maine.
It was the first above-normal Atlantic hurricane season since 2012. There were 15 named storms, including seven hurricanes, three of which were major hurricanes.

Long description
Map of the Gulf of Maine Region, including the eastern half of Massachusetts, New Hampshire, Maine, New Brunswick, Nova Scotia, Prince Edward Island, and the nearby marine areas, highlighting key significant events that occurred in the autumn of 2016 (September, October, and November). The highlights are as follows:
- Drought conditions intensified and persisted in New England, southwestern New Brunswick, and southwestern Nova Scotia during fall.
- An early October storm brought heavy rain and flooding to Cape Breton, NS.
- Gulf of Maine sea surface temperatures have been above average since mid-2009.
Regional Climate Overview - September - November 2016
Temperature
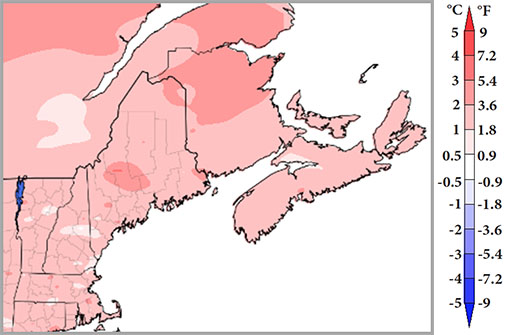
Long description
Map of the Gulf of Maine Region showing the temperature departure from normal averaged over September, October, and November. Temperatures were above normal across the entire region. The northern half of New Brunswick and central parts of Maine were 2°C to 3°C above normal. Elsewhere temperatures generally averaged 1.0°C to 2°C above normal.
Autumn temperatures (averaged over September, October, and November) ranged from 0.5°C (1°F) to 3°C (5°F) above normal.
Temperatures in September ranged from near normal in portions of Nova Scotia and New Brunswick to 3°C (5°F) above normal in portions of Maine and Massachusetts.
In October, temperatures ranged from near normal in southern Maine and parts of Nova Scotia to 3°C (5°F) above normal in central Maine and northeastern New Brunswick.
November average temperatures ranged from near normal in southern Maine to 4°C (7°F) above normal in northeastern New Brunswick.
Precipitation
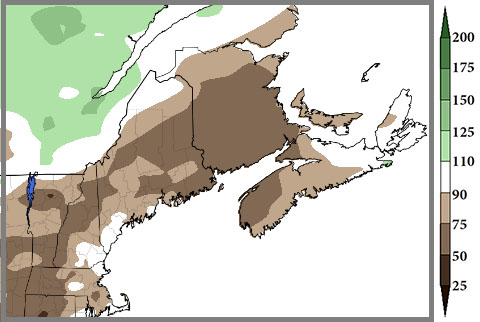
Long description
Map of the Gulf of Maine region showing the total precipitation as a percentage of normal precipitation over the summer of 2016 (averaged over September, October, and November). Most of the region was much drier than normal. Precipitation over most of Massachusetts, New Hampshire, and Maine ranged from 50% to 90% of normal. Some coastal sections had near normal precipitation. Most of New Brunswick and southwestern Nova Scotia reported 50% to 75% of the normal amount of precipitation. Northern New Brunswick, central Nova Scotia, and Prince Edward Island were also dry, receiving 75% to 90% of normal precipitation. Precipitation over northern and eastern Nova Scotia was generally near normal, averaged over the season.
Autumn precipitation (accumulated from September-November) ranged from 25-125% of normal, with most areas seeing 50-90% of normal.
September precipitation ranged from 25-90% of normal for a majority of the region. Northern New Brunswick near the Quebec border and a few spots in northern Nova Scotia were the main exceptions, seeing up to 150% of normal.
October precipitation varied, ranging from 50% of normal in portions of Maine and New Brunswick to 225% of normal in eastern Cape Breton, NS.
In November, precipitation ranged from 25% of normal to near normal for most areas. The driest areas were in southwestern New Brunswick, southern Nova Scotia, and Cape Cod, MA, while portions of Maine saw up to 125% of normal. Temperature and precipitation normals based on 1981-2010.
Sea Surface Temperature
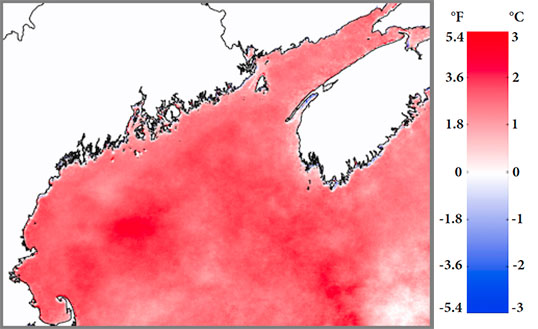
Long description
Map of the departure from normal of sea surface temperatures for the Gulf of Maine region, covering the Bay of Fundy, the Gulf of Maine, and waters south of Nova Scotia, over the autumn (averaged over September, October, and November). Sea surface temperatures were warmer than the long term average over the entire area. The anomalies ranged from near 1°C to greater than 2°C, with the largest anomalies over the deeper basins.
Autumn sea surface temperature (SST) anomalies in the Gulf of Maine ranged from around 1°C (2°F) to greater than 2°C (4°F). The plot below shows monthly SST anomalies for the Gulf from January 1982-October 2016. With the exception of four individual months, anomalies have been positive since mid-2009. Positive anomalies in 2016 have been second only to those of 2012. Peaks in the positive anomalies during this warm period are the largest deviations from the mean in the entire time series.
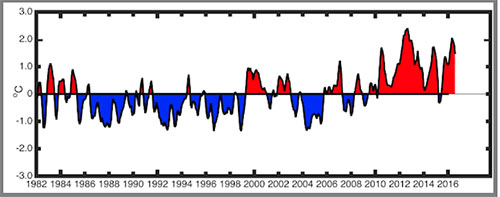
Long description
Time series of monthly sea surface temperature (SST) anomalies for the Gulf from January 1982 to October 2016. The time series plot shows the SST anomalies varied from -1°C to +1°C from 1982 to about mid-2009, with negative anomalies more frequent than positive between 1985 and 1999. From mid-2009 to 2016, the anomalies were nearly all positive. Peaks in the anomalies during this warm period are the largest deviations from the mean in the entire time series. The anomalies reach 2°C or more. The largest anomaly was in 2012, the second largest was in 2016.
Regional Impacts - September - November 2016

Long description
Map of the intensity of drought over the Gulf of Maine region. The legend shows 5 drought intensity levels from abnormally dry (D0) to drought moderate, severe, extreme, or exceptional (D1 to D4). Drought was severe or extreme over parts of Massachusetts and southern New Hampshire. It was severe over southern Maine. The map shows moderate drought over much of the rest of Maine, over southwestern New Brunswick, and over southwestern Nova Scotia. The map shows abnormally dry or moderate drought conditions over central New Brunswick, Prince Edward Island, and central and northern Nova Scotia.

Long description
Left to right, top row:
- US Department of Agriculture
- National Drought Mitigation Center
- Comisión Nacional del Agua (Mexican National Commission of Water)
Left to right, bottom row:
- Department of Commerce, USA
- NOAA: National Oceanic and Atmospheric Administration, US Department of Commerce
- Agriculture and Agri-Food Canada
- Environment and Climate Change Canada
to historical values
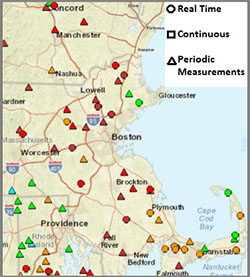
Long description
Map of groundwater (water level data from wells) compared to historical values over southeastern New Hampshire and eastern Massachusetts for September 28, 2016. The marker indicates the location of the measurement.
The colour of the marker indicates the percentile class of the groundwater measurement compared to the historical distribution in one of 8 percentile classes: low, much-below normal (<10th percentile), below normal (10th to 24th percentile), normal (25th to 75th percentile), above normal (76th to 90th percentile), much-above normal (>90th percentile), high, and not-ranked.
The shape of the marker (circle, square, or triangle), indicates real time, continuous, or periodic measurements.
On September 28, 2016, groundwater in these locations generally ranged from much below normal to normal. Most station data from Maine were real-time measurements. Station data from New Hampshire and Massachusetts were generally real-time or periodic measurements.
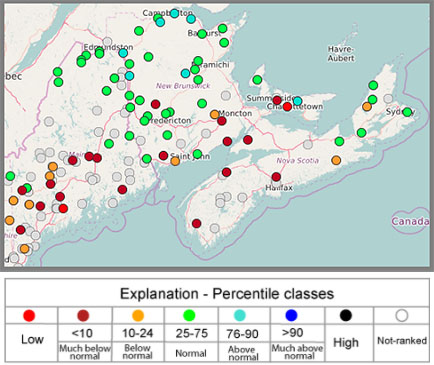
Long description
Dot map of streamflow compared to historical values over the Gulf of Maine region, for September 12, 2016. The dots mark the locations of streamflow measurements. The colour of the dot shows the recent (September 12) streamflow compared to the historical distribution in one of 8 percentile classes: low, much-below normal (<10th percentile), below normal (10th to 24th percentile), normal (25th to 75th percentile), above normal (76th to 90th percentile), much-above normal (>90th percentile), high, and not ranked.
Streamflow was much below normal or below normal over much of the region, including over southern Maine, parts of southern and eastern New Brunswick, and southwestern and central Nova Scotia. Northern Maine and northern and central New Brunswick had above normal or near normal streamflow. Streamflow over Prince Edward Island was varied. Streamflow over eastern mainland Nova Scotia and Cape Breton was below normal or normal.
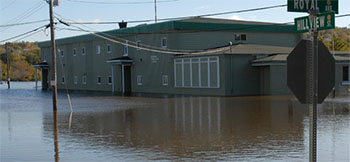
Long description
Photograph of a 2-storey building, the Southend Community Centre in Sydney, Cape Breton, completely surrounded and partially inundated by floodwater. Floodwater reached part way up the ground floor level of the building. The base of a power line and a stop sign in the foreground were also flooded.
Drought
Water levels of rivers, lakes, wells, and reservoirs were well below normal in New England and parts of the Maritimes. Preliminary data indicated more than 20 long-term gauges in the three states had record or near-record low streamflow in late September. During the same period, more than 345 Massachusetts and New Hampshire water suppliers had bans or restrictions. Mandatory water restrictions were also in place in southwestern Nova Scotia. In Massachusetts, fish were stranded along portions of some rivers and there was a higher rate of fish kills. Numerous shallow, private wells ran dry. Residents drilled new wells, hauled in water, or relied on bottled water. In southern Nova Scotia, community centres, parks, and schools were made available for showering. York, ME activated its emergency interconnection with a nearby water district, while Cambridge bought water from the Massachusetts Water Resources Authority for an estimated $1.2 million per month.
Dwindling water supplies challenged growers in New England and southern Nova Scotia, with some farmers hauling in water. Hay yields were below average in many of these areas. Several cranberry growers in Massachusetts had "little or no water for harvest". All crops in Massachusetts showed some loss, with significant losses of hay, cranberries, and potatoes. Several Nova Scotia farmers lost Christmas tree seedlings due to the drought. Poor pasture conditions led some farmers to sell off livestock and others to use supplemental feed, requiring them to buy more to get through winter. Beekeepers in southern Maine reported that honey production was down, with several having no crop at all. In the U.S., farmers in more drought-stricken counties became eligible for federal aid. Due to the dry conditions, officials kept burn restrictions and seasonal fire crews in place a week longer than usual in southwestern Nova Scotia.
Canadian Thanksgiving Day Storm
Significant flooding occurred in Cape Breton, NS from October 9-11. More than 1,800 homes reported water damage, with 38 deemed uninhabitable. The Southend Community Centre, pictured on the bottom left, was severely damaged and is expected to be torn down. Numerous roads, bridges, culverts, and the region’s only railway line were washed out or severely damaged. Seventeen people were rescued from vehicles, and up to a dozen fire service vehicles were damaged. Over 5,000 insurance claims were filed, totaling $85 million in damage. The province is seeking Disaster Financial Assistance.
Regional Outlook - Winter 2016-17
La Niña
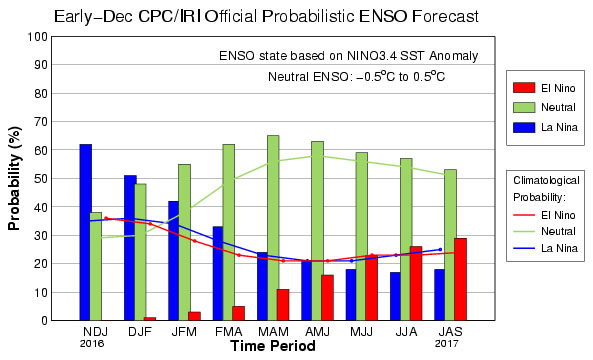
Long description
Graph of the official probabilistic El Niño Southern Oscillation (ENSO) forecast, issued in early December by the US Climate Prediction Center (CPC) and the International Research Institute (IRI) for Climate and Society.
Bar graphs show the probability over 3 month intervals of each EÑSO condition (El Niño, neutral, and La Nina), with bars in red, green, and blue, respectively. The intervals range from late fall/early winter (November 2016 to January 2017) to the following summer (July to September), 2017.
The climatological probabilities of these 3 conditions are shown as line graphs of the corresponding colour.
The bar graphs show that La Nina conditions are the most probable (over 60%) at the beginning of the period in late fall/early winter. That is higher than the climatological probability of about 30%. The probability of La Nina decreases over the winter, while the probability of neutral conditions increases.
Neutral conditions are most probable this spring and summer, at over 60% this spring and 50% this summer. Those are similar to or slightly higher than the climatological probabilities.
The climatological probabilities of El Niño are about 35% in the winter and 20% to 25% in the spring and summer. The climatological probabilities of La Nina are similar to those of El Niño.
In November, cooler-than-normal sea surface temperatures in the equatorial Pacific Ocean and atmospheric patterns indicated weak La Niña conditions. NOAA’s Climate Prediction Center indicates weak La Niña conditions are favoured to persist through winter 2016-17, with a transition to ENSO-neutral conditions expected during January-March 2017.
Drought
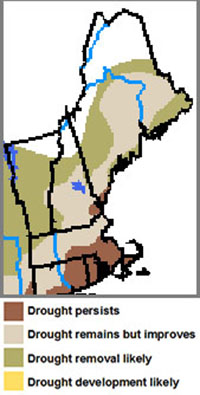
Long description
The U.S. Drought Outlook from NOAA’s Climate Prediction Center for December 15, 2016- March 31, 2017 calls for drought conditions to persist or remain but improve in Massachusetts, southern New Hampshire, and portions of central and southern Maine. Drought conditions are expected to ease in the rest of Maine and New Hampshire.
The U.S. Drought Outlook from NOAA’s Climate Prediction Center for December 15, 2016- March 31, 2017 calls for drought conditions to persist or remain but improve in Massachusetts, southern New Hampshire, and portions of central and southern Maine. Drought conditions are expected to ease in the rest of Maine and New Hampshire.
Temperature and Precipitation
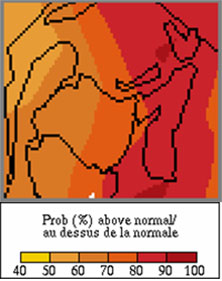
Long description
The map shows that seasonal temperatures, averaged over December 2016 to February 2017, will be above normal for the Canadian Maritimes. The probability of above normal temperatures is more than 60% in northwestern New Brunswick, more than 70% in southeastern New Brunswick and western Prince Edward Island, and more than 80% in Nova Scotia and eastern Prince Edward.
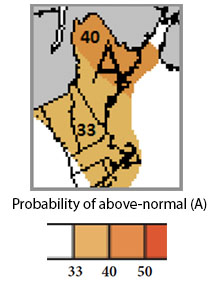
Long description
The map shows that seasonal temperatures, averaged over December 2016 to February 2017, will be above normal over Massachusetts, New Hampshire, and Maine. The probability of above normal temperatures is more than 40% in Eastern Maine, where an “A” on the map indicates above normal. It is more than 33% in the eastern half of Massachusetts, in New Hampshire, and in western Maine.
The U.S. Drought Outlook from NOAA’s Climate Prediction Center for December 15, 2016- March 31, 2017 calls for drought conditions to persist or remain but improve in Massachusetts, southern New Hampshire, and portions of central and southern Maine. Drought conditions are expected to ease in the rest of Maine and New Hampshire.
For precipitation, both groups are calling for equal chances for the region for winter 2016- 17. This means there is a 33.3% chance each of above-, near-, or below-normal precipitation.
La Niña can influence the region’s temperature and precipitation patterns. However, this La Niña is expected to be weak and short-lived, so its impacts may be more variable. Also, other patterns of climate variability such as the Arctic Oscillation or North Atlantic Oscillation may dominate the region’s weather patterns.
Gulf of Maine Region Partners
- Gulf of Maine Council on the Marine Environment, Climate Network
- Environment and Climate Change Canada
- National Oceanic and Atmospheric Administration
- University of Maine, School of Marine Sciences
- Gulf of Maine Research Institute
- State Climatologists
- National Integrated Drought Information System
- Cooperative Institute for the North Atlantic Region
- Northeastern Regional Association of Coastal and Ocean Systems
Contacts
NOAA:
Ellen Mecray
Samantha Borisoff
Environment and Climate Change Canada:
1-800-668-6767 (in Canada only)
819-997-2800 (long-distance charges apply)
ec.enviroinfo.ec@canada.ca
To receive this publication every quarter, sign up