
Gulf of Maine climate quarterly impacts and outlook: March 2015
March 2015
Gulf of Maine Significant Events - for December 2014 - February 2015 Test
Extremely cold air dominated the region in February. Monthly average temperatures were colder than normal by as much as 8°C (14.4°F). Many sites (including Concord, NH; Portland, ME; Saint John, NB; and Yarmouth, NS) ranked the month as the coldest or one of the coldest Februaries on record, and some even cited it as one of their coldest months ever. While Fredericton, NB, normally sees 11 days above freezing in February, this February the site only had one day above freezing. The combination of cold air and strong winds produced some extreme wind chills across the region.
Multiple major storms, including three blizzards, moved through the region in February. On the 15th, a particularly strong nor’easter, with winds of up to 108 km/h (67 mph), caused up to 15 hours of blizzard conditions and coastal flooding. The storm also dropped up to 66 cm (26 in) of snow. Another nor’easter in late February produced snow rates of up to 9 cm (3.5 in) per hour, with snow totals up to 50 cm (20 in). Many areas saw 200% to 600% of normal snowfall in February, with sites such as Halifax, NS, and Saint John, NB, having their snowiest or one of their snowiest Februaries on record. Parts of New Brunswick had up to five times the normal snow on the ground, with Saint John having its greatest February snow depth on record. Boston, MA, received 164.6 cm (64.8 in) of snow during the month, which is more than the city normally gets in an entire snow season. The site set many records including all-time snowiest month, snowiest February, snowiest winter, snowiest year, greatest snow depth, and greatest number of 30+ cm (12+ in) snowfalls.
Several intense storms struck the region in January. From January 26 to 28, a blizzard with hurricane-force wind gusts up to 130 km/h (81 mph) dropped up to 91 cm (36 in) of snow. The storm caused wave heights of 9 to 12 m (30 to 40 ft) in the Gulf of Maine and significant coastal flooding in Massachusetts. By the end of January, some sites had seen more than double their normal snowfall, while the average snow cover for New Brunswick was 32% above normal.
With generally mild conditions in December, most storms featured a mix of precipitation types. On December 3 in New Brunswick, up to 8 hours of freezing rain occurred in Bathurst and slippery conditions caused dozens of accidents across the province. A slow-moving storm from December 9 to 12 brought 102 to 152 mm (4 to 6 in) of rain, up to 57 cm (22 in) of snow, and a coating of ice. Roads were closed in several areas due to flooding. On December 25, many locations had record or near-record warmth as high temperatures rose to 17°C (63°F). Coastal New England, southern New Brunswick, and much of Nova Scotia saw less than 25% of normal December snowfall.

Long description for map
This map shows the Gulf of Maine Region, including Massachusetts, New Hampshire, Maine, New Brunswick, Nova Scotia, and the nearby marine areas. The following highlights are noted:
- February was one of the coldest months on record across the region.
- Storms in February brought excessive snowfall, intense winds, and blizzard conditions to the region. Snow totals and snow on the ground were well above normals.
- In late January, near-hurricane force winds from a Nor’easter created very large waves in the Gulf of Maine and caused significant coastal flooding in Massachusetts.
Regional Climate Overview - for December 2014 - February 2015
Temperature
Departure from Normal
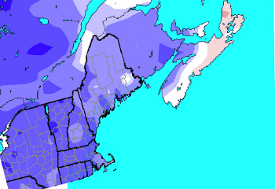
Long decription for map
The Temperature Departure from Normal map of the Gulf of Maine region shows the temperature departure from normal, averaged over December, January, and February). Much of the region was anomalously cold when averaged over the three months. Massachusetts, New Hampshire, New Brunswick, and the Fundy coast parts of Nova Scotia averaged 2 to 3 °C (1.8 to 5.4°F) below normal. The three month average in Maine was 1 to 2 °C (0.9 to 3.6°F) below normal. The rest of Nova Scotia ranged from near normal to 1 °C (1.8°F) above normal in eastern sections.
Winter temperatures (averaged over December, January, and February) ranged from near normal in Nova Scotia to 3°C (5.4°F) below normal in New Hampshire and Massachusetts. December was quite warm, with most areas seeing temperatures 2°C (3.6°F) to 4°C (7.2°F) above normal. The three states ranked this December among their top 11 warmest. Colder conditions returned in January, with temperatures ranging from near normal in Nova Scotia to 3°C (5.4°F) below normal in the states. February was an extremely cold month across the region, with temperatures up to 8°C (14.4°F) below normal. The three states had their second coldest February on record.
Temperature and precipitation normals based on 1981-2010.
Precipitation
Percent of Normal
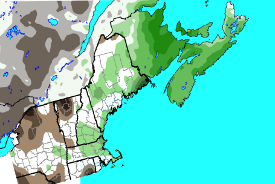
Long description for map
The Precipitation Percent of Normal map for the Gulf of Maine region shows the total precipitation as a percentage of normal precipitation, averaged over December to February. Nova Scotia and most of New Brunswick were wetter than normal, by 125 to 175% with the highest amounts over eastern NB. Extreme southeastern sections of Maine had twice as much precipitation as normal over the three month period. The rest of the region (Massachusetts, New Hampshire, and much of Maine) had near normal to 125% of normal precipitation.
Winter precipitation (accumulated during December, January, and February) ranged from near normal to 200% of normal, with the greatest amounts in eastern New Brunswick. December was a wet month regionwide. Precipitation generally ranged from 125% to 275% of normal, with the wettest areas in eastern New Brunswick. Maine, New Hampshire, and Massachusetts ranked December 2014 among their top 20 wettest. Precipitation varied in January, with amounts ranging from 50% of normal in northern Maine and northern New Brunswick to 150% of normal in Nova Scotia. February precipitation ranged from 25% of normal in northern Maine to 200% of normal in eastern Nova Scotia.
Canada and ocean precip data: Canadian Precipitation Analysis.
U.S. precipitation data: interpolated station data.
Sea Surface Temperatures
Departure from Normal
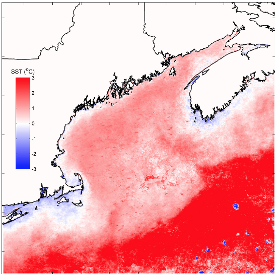
Long description for map
The Sea Surface Temperature Departure from Normal map of the Gulf of Maine region covers the Bay of Fundy, the Gulf of Maine, and waters south of Nova Scotia. It shows the departure from normal sea surface temperature, averaged over December to February. Sea surface temperatures were above normal in much of the area, by about 1 °C (1.8°F). Nearshore waters were near or just below normal. Sea surface temperatures further offshore were 2 to 3 °C (1.8 to 5.4°F) above normal.
Warm sea surface temperature anomalies that were present throughout the region in fall persisted in most areas through winter. Temperatures (averaged over December, January, and February) were up to 1°C (1.8°F) above normal over the entire region except in the shallowest areas near shore. Strong region-wide warm anomalies in December weakened only slightly in January. These warmer than normal sea surface temperatures may have helped intensify storms during winter. The three-month winter average hides the fact that in February, ocean cooling created negative anomalies over shallow coastal areas, the Jordan Basin, the northern Bay of Fundy, and the Scotian Shelf in response to the cold air temperatures.
Sea surface temperature anomalies based on 1985-2014. Mean SST anomalies from NOAA AVHRR data. Credit: University of Maine School of Marine Sciences and NERACOOS
Regional Impacts - for December 2014 - February 2015
Season Snowfall and Cold
Long description for map
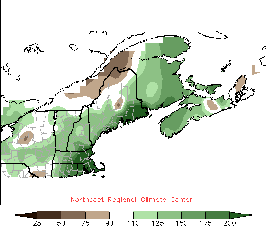
Percent of normal snowfall for winter (accumulated from December to February)
The Snowfall as a Percent of Normal Map shows snowfall totals over December to February as a percentage of normal snowfall for the period. Much of the region was snowier than normal, especially areas along the Gulf of Maine coast which had twice the normal snowfall amount. Eastern New Brunswick and western Nova Scotia had 150 to 175% of the normal amount of snowfall. Northern Maine and extreme northwestern New Brunswick and parts of eastern Nova Scotia had near or less snowfall than normal.
Snow totals varied widely in December, but in late January and February, a persistent trough over eastern North America allowed Arctic air and numerous storms to move through the Gulf of Maine region. With back-to-back storms and persistent cold, snow accumulated quickly (see daily snowfall accumulation chart). Snow removal was difficult, especially for cities such as Boston, MA, and Saint John, NB, which each hauled away at least 20,000 truckloads of snow from their streets. Some municipalities in the U.S. received exemptions to dump snow directly into bodies of water, a practice not normally permitted. The cost of snow removal made this winter the most expensive year ever for some areas.
The snowstorms caused frequent school and business closures, thousands of flight delays and cancellations, and power outages, while the weight of the snow caused roofs to collapse. It was estimated that the snowstorms cost Massachusetts’ economy at least $1 billion. The snow also contributed to many accidents, including one of the largest chain-reaction crashes in Maine’s history on February 25. Frigid temperatures resulted in water main breaks and frozen pipes.
Ice buildup in waterways made navigation difficult, slowed commerce, damaged pilings and docks, forced ferry services to be suspended, and cracked the hull of a Coast Guard cutter. The weather also had significant impacts on the lobster fishing season in Grand Manan, NB, as well as three aquaculture sites in Nova Scotia. Railroad freight deliveries were delayed due to snow-covered side tracks and the need to use shorter trains. The Massachusetts Bay Transportation Authority (MBTA) rail service shut down for several days and experienced delays throughout February. The MBTA estimated that storm-related costs added up to $36.5 million. In Eastern Passage, NS, thousands of vehicles awaiting rail transport became encrusted in ice, making them impossible to move and causing delays for customers.
The start of maple season was delayed by up to a month across the region as cold and snow kept sap from running. Spring planting was also delayed for some Nova Scotia growers due to damaged greenhouses.

Long description for map
Daily snowfall accumulation from December 1, 2014, through February 28, 2015
The Daily Snowfall Accumulation line chart shows the cumulative snowfall amounts from December 1, 2014 to February 28th, 2015, at 4 locations in the Gulf of Maine Region: Boston MA (green line), Machias ME (red line), Greenwood NS (purple line) and Moncton NB (blue line). It gives a sense of how rapidly the snow piled up. At all 4 locations there was very little to only moderate accumulations up to Jan 23rd, less than 80 cm (31.4 in), then the snowfall accumulated rapidly at all locations up to the end of February. By February 28th the snowfall accumulation totaled 252 cm (99.2 in) at Boston, 309 cm (121.6 in) at Greenwood, 333 cm (131.1 in) at Moncton and 344 cm (135.4 in) at Machias. The right side of the chart shows the normal (or average) total snowfall for Dec 1st - Feb 28th. The normal values are Boston 84 cm (33.1 in), Machias 127 cm (50.0 in), Greenwood 195 cm (76.8 in), Moncton 205 cm (80.1 in).
Ski resorts benefited from the cold and snow, though. Sugarloaf, in Carrabassett Valley, ME, anticipated its best season ever with respect to traffic and revenue. As of mid-February, the resort had seen a 10% increase in total skier visits and a 14% increase in revenue since last year.
Regional Outlook - for Spring 2015
Temperature

Long description for map
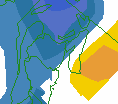
Environment Canada seasonal outlook map for temperature, produced on February 28, 2015, shows the percent probability of above normal and of below normal temperatures in the Maritimes for the three month period March to May 2015. It shows 50 to 60% probabilities of colder than normal temperatures over New Brunswick and northern Nova Scotia in the months to come. It shows only extreme southwestern Nova Scotia with a slight (40 to 50 %) chance of above normal temperatures.
For March through May, Environment Canada is predicting an increased chance of below-normal temperatures for New Brunswick and northern Nova Scotia, an increased chance of above-normal temperatures for a small portion of southern Nova Scotia, and equal chances of above-, near-, or below-normal temperatures elsewhere. Greater than normal snowpack, record ice cover on the Great Lakes, and extensive sea ice in Hudson Bay, the Gulf of St. Lawrence, and waters near Newfoundland and Labrador contributed to the forecast for below-normal temperatures.
NOAA’s Climate Prediction Center is forecasting equal chances of above-, near-, or below-normal temperatures from March through May for Maine, New Hampshire, and Massachusetts.
(Caption: Environment Canada map produced on February 28.)
Precipitation
Environment Canada and NOAA’s Climate Prediction Center are both predicting equal chances of above-, near-, or below-normal precipitation for the Gulf of Maine region.
Spring Flood Potential
Issued: March 19, 2015
Long description for map
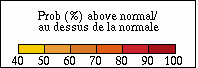
NOAA’s Spring Flood Potential Map issued March 19, 2015, shows that the southern half of Maine, all of New Hampshire, eastern Massachusetts, and just south of Lake Ontario has an above normal potential for spring river flooding, with the possibility that rivers could exceed moderate levels. It shows that minor river flooding is possible across the remaining parts of the Gulf of Maine US states.
The potential for river flooding during spring is near to above normal for Maine, New Hampshire, and Massachusetts, according to NOAA. Across eastern New England, the potential for spring river flooding is above normal. Snow water equivalents are above normal for this time of the year in that area. If the region gets a period of warm weather combined with heavy rainfall events, then the possibility of moderate flooding may occur. In northern New England, extensive river ice increases the risk for ice jam flooding. Minor river flooding is possible across the rest of New England.
Heavy rainfall can cause river flooding at any time, even in areas where the flood potential is considered low. Local river forecasts can be found the Northeast River Forecast Center.
Gulf of Maine Region Partners
Northeast Regional Climate Center
National Oceanic and Atmospheric Administration
National Operational Hydrologic Remote Sensing Center
Northeast River Forecast Center
Gulf of Maine Research Institute
National Integrated Drought Information System
Cooperative Institute for the North Atlantic Region
Gulf of Maine Council on the Marine Environment, Climate Network
Northeastern Regional Association of Coastal and Ocean Systems
Contacts
NOAA:
Ellen Mecray
Samantha Borisoff
Environment Canada:
1-800-668-6767 (in Canada only)
819-997-2800 (long-distance charges apply)
Sign up to receive this publication every quarter.