
Gulf of Maine quarterly climate impacts and outlook: September 2015
Gulf of Maine Region, September 2015
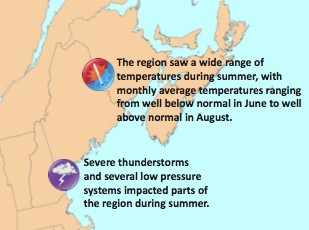
Gulf of Maine Significant Events - June-August 2015
Severe thunderstorms affected parts of the region during summer. Two EF-0 tornadoes touched down in Massachusetts on June 23. A microburst in Albion, ME on July 28 damaged buildings, trees, and crops. Two days later, an EF-0 tornado touched down in Warner, NH. On August 4, a waterspout was reported in Boston Harbor and an unconfirmed EF-0 tornado in Five Islands, NS caused property damage. On the same day, large hail fell in New Brunswick and the three states, including a 6.4 cm (2.5 in.) hailstone near Waterboro, ME. Lightning knocked out power to tens of thousands of customers in Halifax, NS on August 22 and 23. Also on the 22nd, 40.8 mm (1.61 in.) of rain fell in one hour at Cheticamp, NS, leading to flash flooding and the evacuation of a campground in Cape Breton Highlands National Park. For more details, see the Regional Impacts section.
Low pressure systems also brought heavy rain to some areas. On June 21-22, coastal Maine and the southern half of New Brunswick received up to 150 mm (6 in.) of rain due to remnant moisture from Tropical Storm Bill. The heavy rain flooded roads in some communities. Another storm on August 8-9 brought up to 100 mm (4 in.) of rain to Nova Scotia, with the greatest amounts in Cape Breton. From August 26-27, a series of thunderstorms along a trough of low pressure brought up to 170 mm (7 in.) of rain to Charlotte County, NB and up to 216 mm (8.50 in.) of rain to Washington County, ME.
With a high of 9.4°C (49°F) on June 1 and 2, Boston, MA, tied its coolest maximum temperature for any given June day. In July, the region experienced a wide range of above-normal and below-normal temperatures. During a cold stretch from July 19-25, several Maritime communities were more than 5°C (9°F) below normal, with records set for lowest maximum temperature. This was followed by a warm August. Caribou, ME, was record-warm at 2.6°C (4.6°F) above normal. The site set a record for greatest number of consecutive days with a maximum temperature of 27°C (80°F) or higher from August 14-23. During the same time period, New Brunswick experienced a heat wave, with humidex values near 40°C (104°F). See figure below.
Long description for Significant Events map
Map of the Gulf of Maine Region, including Massachusetts, New Hampshire, Maine, New Brunswick, Nova Scotia, Prince Edward Island, and the nearby marine areas, highlighting significant events that occurred in the summer of 2015. The following highlights are noted:
- The region saw a wide range of temperatures during summer, with monthly average temperatures ranging from well below normal in June to well above normal in August.
- Severe thunderstorms and several low pressure systems impacted parts of the region during summer.
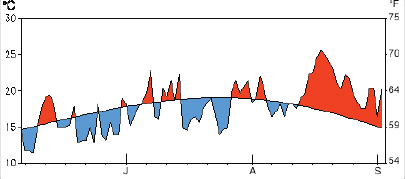
Daily average temperature compared to normal at Caribou, ME. Red indicates above-normal temperatures and blue indicates below-normal temperatures. Credit: U.S. Climate Prediction Center.
Long description for Time Series graph
Time series graph of the daily average temperature over the months June to August, 2015, compared to normal, at Caribou, ME. The area between the daily average and the daily normal average temperatures is shaded red to show positive anomalies, blue to show negative anomalies. The beginning of June was colder than normal, followed by a warm spell of a few days, then there were several cold spells over the rest of the month. July showed an alternation between warmer than average and colder than average days near the beginning of the month, then an extended cool spell mid-month, followed by a warmer than normal end of July. The beginning of August was warmer than normal. Following that there were a few colder than normal days, then the rest of the month was anomalously warm.
Regional Climate Overview - June-August 2015
Temperature
Departure from Normal
Long description for Temperature map
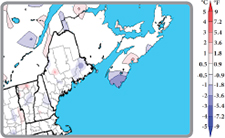
Map of the temperature departure from normal for the Gulf of Maine region averaged over June, July, and August 2015. When averaged over the 3 summery months, temperatures were near normal (depicted in white) over most of the region. The exception was over southwestern Nova Scotia with temperatures 1° to 3° C below normal (depicted in shades of blue).
June was quite cool regionwide, with monthly average temperatures generally 1°C (1.8°F) to 3°C (5.4°F) below normal. Maine had its 15th coolest June on record. July temperatures ranged from near normal to 2°C (3.6°F) below normal. The coolest areas were in parts of Maine and the Maritimes. August was very warm, with temperatures up to 4°C (7.2°F) above normal. The warmest areas were in central New Brunswick and western Prince Edward Island. The three states ranked this August among their top 11 warmest. With a cool June, variable July, and warm August, summer temperatures averaged out to be near normal for most of the Gulf of Maine region.
Temperature and precipitation normals based on 1981-2010. Canada and ocean precip data: Canadian Precipitation Analysis. U.S. precipitation data: interpolated station data.
Precipitation
Percent of Normal
Long description for Precipitation map
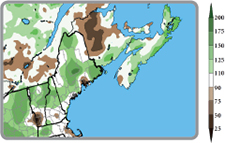
Map of the total precipitation as a percentage of normal precipitation, averaged over the summer months, for the Gulf of Maine region. Many parts of Maine, the northern half of New Hampshire, southern New Brunswick, and many parts of Nova Scotia were wetter than normal (depicted in shades of green). Eastern Massachusetts, southern parts of New Hampshire, much of New Brunswick, western Prince Edward Island, and an area in southwestern Nova Scotia were drier than normal (depicted in shades of brown). Precipitation in some of those locations, including a large area of central New Brunswick, was less the half the normal amount (depicted as dark brown). Precipitation was near normal over the remaining areas (depicted as white).
June precipitation ranged from near normal to more than 200% of normal, with the wettest areas in southern New Brunswick and parts of Nova Scotia. The three states ranked this June among their top 16 wettest. July was generally a dry month, with precipitation ranging from 25% to 90% of normal. Parts of western Maine were the wet exception, with up to 175% of normal. August precipitation ranged widely from 25% up to 200% of normal. The driest areas were in parts of New Brunswick and western Nova Scotia while the wettest areas were in central Maine. Summer precipitation (accumulated during June, July, and August) ranged from 50% of normal in much of New Brunswick to 150% of normal in parts of Maine and Nova Scotia. Maine and New Hampshire ranked this summer among their top 18 wettest.
Sea Surface Temperatures
Departure from Normal
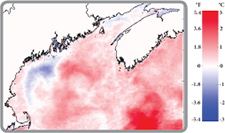
Long description for Sea Surface Temperatures map
Map of the sea surface temperature departure from normal average over the summer period for the Gulf of Maine region, covering the Bay of Fundy, the Gulf of Maine, and waters south of Nova Scotia. Warmer than normal conditions are depicted in shades of red, cooler than normal in shades of blue. Sea surface temperatures were cooler than normal just offshore from Penobscot Bay (Maine) to Cape Cod, as well as somewhat cooler than normal over parts of the Bay of Fundy. Most other locations were warmer than normal, with the strongest positive anomalies offshore and over the Scotian Shelf. More details are provided in the main text.
Summer sea surface temperature anomalies in the Gulf of Maine reflect both summer circulation processes and residual warm water masses from previous time periods. Temperatures over most regions were up to 1°C (1.8°F) above normal, most strongly over the deeper basins offshore and the Scotian Shelf. These reflect continuing warm water masses from the spring and previous summer. A distinct region of cold anomalies (up to 1°C (1.8°F)) from Penobscot Bay to Cape Cod reflects anomalously strong flow of water out of the cold Eastern Maine Coastal Current into the western Gulf. This flow is separated from the coast by warmer temperatures in shallow regions. Cooler anomalies were also present in much of the Bay of Fundy.
Sea surface temperature anomalies based on 1985-2014. Mean SST anomalies from NOAA AVHRR data. Credit: University of Maine School of Marine Sciences and NERACOOS
Regional Impacts - June-August 2015
Summer Severe Weather

Large hail fell in Brighton, MA, on August 4. (Credit: Rachel Rumely)
Long description for figure
Photograph of two large hail stones in someone’s hand, which fell in Brighton, MA, on August 4.

Damage from a microburst on July 28 in Albion, ME. (Credit: John Jensenius)
Long description for figure
Photograph of a farm building with nearly half of the roof covering peeled up or missing, revealing the rafters below. The damage was caused by a microburst on July 28 in Albion, ME.
New Brunswick had nine severe thunderstorm events this summer, compared to the average six events (based on 1989-2006). The province also had six large hail events, which is more than double the average. Severe weather activity varied by location and by month in the rest of the Maritimes. In the three states, overall severe weather activity was below average in June, varied by area in July, and was above average in August. Massachusetts had two tornadoes in June, which was above average, while Maine had none, which was below average. New Hampshire does not usually see any tornadoes in July, but had one this year. The other states saw below average activity. No tornadoes were reported in August, which is normal.
Summer Precipitation
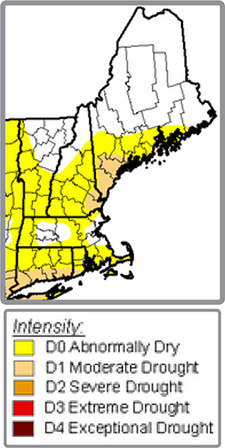
The U.S. Drought Monitor from September 17 shows abnormally dry and moderate drought conditions in parts of Maine, New Hampshire, and Massachusetts.
Long description for Drought Monitor map
Map showing intensity of drought over the New England states. Much of New Hampshire and Massachusetts as well as southwestern areas of Maine were abnormally dry (the lowest of 5 intensity levels on the drought scale). Extreme southeastern sections of New Hampshire and southwestern sections of Maine had moderate drought conditions (the second lowest of 5 intensity levels on the drought scale). The other parts of the 3 states, including northern New Hampshire and central and northern Maine did not show drought conditions.
The three states entered the summer season with areas of abnormal dryness and moderate drought already in place. The region’s precipitation pattern during summer consisted of heavy bursts of rain with extended periods of dryness in between. While the rain in June helped ease dryness for some areas, dry conditions lingered for Cape Cod, southeastern New Hampshire, and parts of southern Maine. With the region receiving spotty rainfall in August, abnormal dryness and moderate drought were expanded in parts of the three states by early September. According to U.S. Department of Agriculture crop reports, farmers had to irrigate crops in areas that received little rainfall.
Sea Surface Temperatures
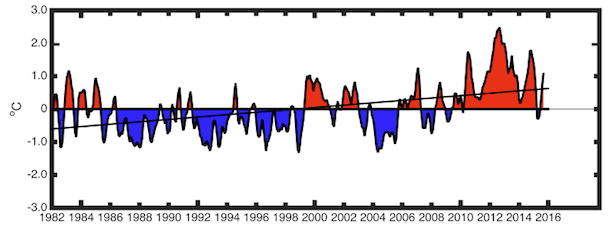
Long description for figure
Time series graph of monthly sea surface temperature anomalies, averaged over the whole Gulf of Maine, for the 34-year period since accurate satellite measurements began in 1982. There were frequent changes from warmer than normal to cooler than normal conditions in the mid 1980s, then a long period of mostly cooler than normal conditions from the late 1980s to the late 1990s. The early 2000s were warmer than normal, followed by cooler than normal conditions in the mid 2000s. Average sea surface temperatures have been warmer than normal for nearly every month for the past 6 years, since about 2009.
Monthly sea surface temperature anomalies, averaged over the whole Gulf of Maine, for the 34-year period since accurate satellite measurements began in 1982. Credit: University of Maine School of Marine Sciences
Data show that since 2009, with the exception of the cold winter of 2015, the region has experienced almost continuous positive monthly anomalies, with a peak in 2012. Anomalies turn positive again in the summer of 2015. The positive peaks in 2010, 2012, and 2014 are the largest departures from average over the 34-year period. The sloped line in the figure above shows the average trend, which is +0.36°C (0.64°F) per decade. The recently released Northwest Atlantic Regional Climatology, which covers the Gulf of Maine, includes long-term annual, seasonal, and monthly mean temperature and salinity fields on different depth levels with three resolution options.
Regional Outlook - for Autumn 2015
Temperature
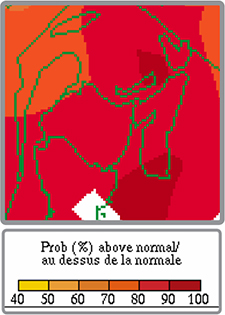
Environment Canada map produced on August 31.
Long description for Environment Canada Temperature map
Map of the seasonal outlook for temperature produced by Environment Canada on August 31, 2015, for the three month period September to November 2015. This shows a high (at least 80%) probability of above normal temperatures over all three Maritime provinces.
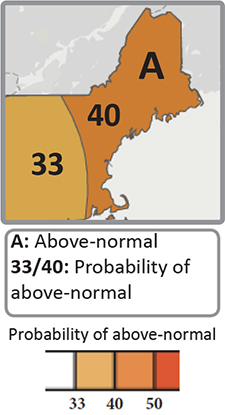
U.S. Climate Prediction Center map produced on August 20.
Long description for Climate Prediction Center Temperature map
Map of the seasonal outlook for temperature produced by NOAA on August 20, 2015, for the three month period September to November 2015. This shows an increased probability of above normal temperatures over all of the 3 Gulf of Maine states.
For September through November, Environment Canada is calling for an increased chance of above-normal temperatures for the Maritimes. With several dynamical climate models in agreement, the U.S. Climate Prediction Center is also predicting an increased chance of above-normal temperatures for the three states for autumn.
Precipitation
Environment Canada is predicting equal chances of above-, near, or below-normal precipitation. The U.S. Climate Prediction Center is calling for an increased chance of below-normal precipitation for September through November for Maine, New Hampshire, and Massachusetts.
El Niño
Issued: September 10, 2015
Atmospheric and oceanic conditions during August reflected a strong El Niño. The Climate Prediction Center said there is a 95% chance of El Niño continuing through winter. Models predict one of the strongest El Niños on record, peaking in late fall or early winter, then gradually weakening through spring 2016. El Niño’s impacts during autumn in the Gulf of Maine region are not strong.
Updated 2015 Atlantic Hurricane Season
According to the Climate Prediction Center’s updated outlook issued in early August, there is a 90% chance of a below-normal 2015 Atlantic hurricane season. The increased confidence level, the highest since hurricane outlooks began in 1998, is based on a strengthening El Niño and cooler-than-average tropical Atlantic sea surface temperatures. The outlook calls for 6-10 named storms, with 1-4 of those becoming hurricanes, and 0-1 of those becoming major hurricanes. In comparison, a normal hurricane season averages 12 named storms, including 6 hurricanes, with 3 of those becoming major hurricanes. As of mid-September, there have been eight named tropical systems in the Atlantic basin. Three of those entered the Canadian Hurricane Centre (CHC) Response Zone, although they remained well east of the Gulf of Maine region. On average, four named tropical systems per year enter the CHC Response Zone.
Gulf of Maine Region Partners
- Environment Canada
- Northeast Regional Climate Center
- National Oceanic and Atmospheric Administration
- Gulf of Maine Research Institute
- State Climatologists
- National Integrated Drought Information System
- Cooperative Institute for the North Atlantic Region
- Gulf of Maine Council on the Marine Environment, Climate Network
- Northeastern Regional Association of Coastal and Ocean Systems
- University of Maine, School of Marine Sciences
Contacts
NOAA:
Ellen Mecray
Samantha Borisoff
Environment Canada:
1-800-668-6767 (in Canada only)
819-997-2800 (long-distance charges apply)
Sign up to receive this publication every quarter.