
Climate Trends and Variations Bulletin - Autumn 2023
Autumn 2023 bulletin (PDF, 746.7 kB)
This bulletin summarizes recent climate data and presents it in a historical context. It first examines the national average temperature for the season and then highlights interesting regional temperature information.
Over the past decade, precipitation monitoring technology has evolved and Environment and Climate Change Canada and its partners implemented a transition from manual observations to using automatic precipitation gauges. Extensive data integration is required to link the current precipitation observations to the long-term historical manual observations. The update and reporting of historical adjusted precipitation trends and variations will be on temporary hiatus pending the extensive data reconciliation, and will resume thereafter. ECCC remains committed to providing credible climate data to inform adaptation decision making, while ensuring the necessary data reconciliation occurs as monitoring technology evolves.
Temperature departures and rankings data table (CSV, 9 kB)
Temperature trends and extremes data table (CSV, 2 kB)
National temperature
The national average temperature for the autumn (September–November) of 2023 was 3.4°C above the baseline average (defined as the mean over the 1961–1990 reference period), based on preliminary data, which makes it the warmest autumn observed since nationwide recording began in 1948. The previous record holder was just 2 years ago in 2021, with a temperature of 3.2°C above the baseline average. The coolest autumn occurred in 1986 when the national average temperature was 1.8°C below the baseline average. The temperature departures map (below) shows all areas across Canada were above the baseline average. Most notably, Northeastern British Columbia, the southwest part of Yukon, northern Alberta, northern Saskatchewan, northern Manitoba and most of eastern Quebec underwent at least 3.0°C above the baseline. Even more extreme, northern Yukon, Northwest Territories and Nunavut experienced temperatures at least 4.0°C above the baseline average. The rest of the country experienced temperatures more than 0.5°C above the baseline.
Temperature departures from the 1961–1990 average – Autumn 2023

Long description
The temperature departures map shows all areas across Canada were above the baseline average. Most notably, Northeastern British Columbia, the southwest part of Yukon, northern Alberta, northern Saskatchewan, northern Manitoba and most of eastern Quebec underwent at least 3.0°C above the baseline. Even more extreme, northern Yukon, Northwest Territories and Nunavut experienced temperatures at least 4.0°C above the baseline average. The rest of the country experienced temperatures more than 0.5°C above the baseline.
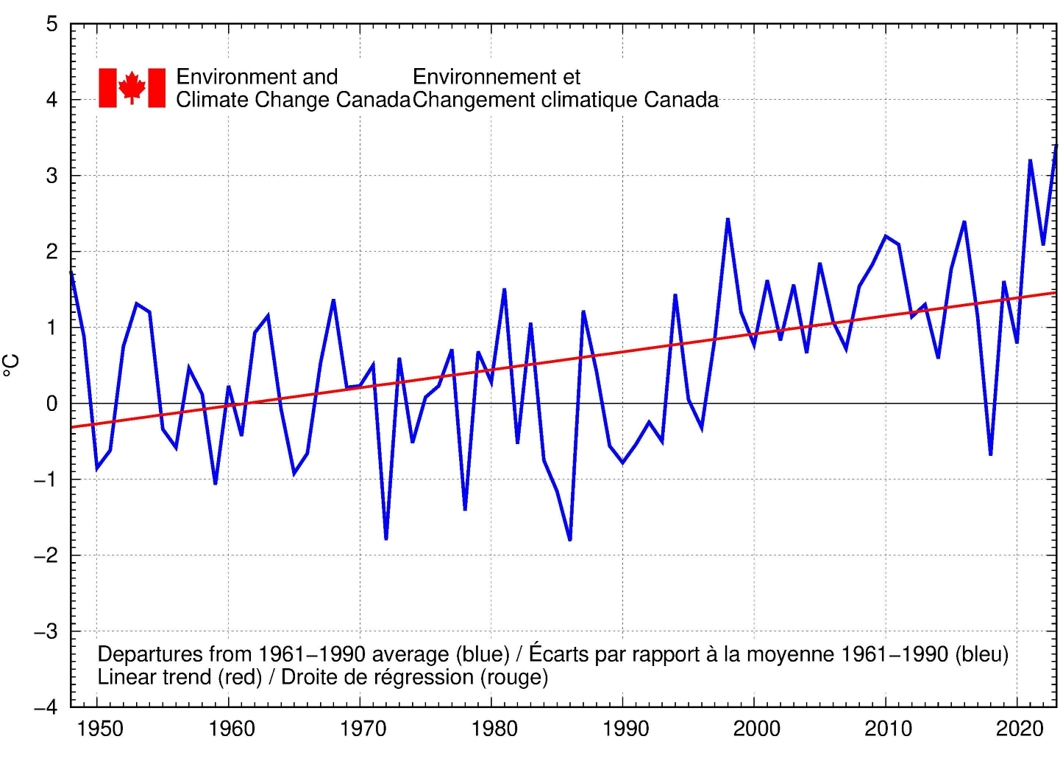
The time series graph (below) shows that autumn temperatures averaged across the country have fluctuated from year to year over the 1948–2023 period. With the exception of 2018, averaged autumn temperatures have remained above the baseline average since 1996. The linear trend indicates that autumn temperatures averaged across the nation, have warmed by 2°C over the past 76 years.
Autumn national temperature departures and long-term trend, 1948–2023
Long description
The time series graph shows that autumn temperatures averaged across the country have fluctuated from year to year over the 1948–2023 period. With the exception of 2018, averaged autumn temperatures have remained above the baseline average since 1996. The linear trend indicates that autumn temperatures averaged across the nation, have warmed by 2°C over the past 76 years.
Regional temperature
When examining on a regional basis, the average autumn temperatures in 2023 were among the 10 warmest on record since 1948 for all eleven climate regions. To be more specific: Arctic Tundra (warmest at 5.4°C above average); Mackenzie District (warmest at 4.8°C above average); Northwestern Forest (warmest at 3.1°C above average); South B.C. Mountain (2nd warmest at 1.6°C above average); Arctic Mountains and Fiords (3rd warmest at 4.4°C above average); Northeastern Forest (4th warmest at 2.4°C above average); Atlantic Canada (6th warmest at 1.7°C above average); Yukon/North B.C. Mountains (6th warmest at 2.9°C above average); Pacific Coast (7th warmest at 1°C above average); Great Lake/ St. Lawrence (8th warmest at 1.8°C above average); and Prairies (8th warmest at 2.1°C above average). All eleven climate regions exhibit positive trends for autumn temperatures over the 76 years of record. The strongest trends were observed in the Arctic Tundra (+3.1°C), while the weakest trends (+0.8°C) was found in the South B.C. Mountain region. Tables listing the Autumn regional and national temperature departures and rankings from 1948 to 2023 (CSV, 9kB) and summarizing the Autumn regional and national trends and extremes (CSV, 2kB) are available through the above links or upon request at btvc-ctvb@ec.gc.ca.
Please note that notifications of the latest publication of the Climate Trends and Variations Bulletin (CTVB) can be sent directly to your inbox when the bulletin is published on our website. For more information, please visit: CTVB – Subscribe. Moreover, the latest generation of CANGRD has now been adopted in the analyses of the CTVB. For more information, please visit: About CTVB.
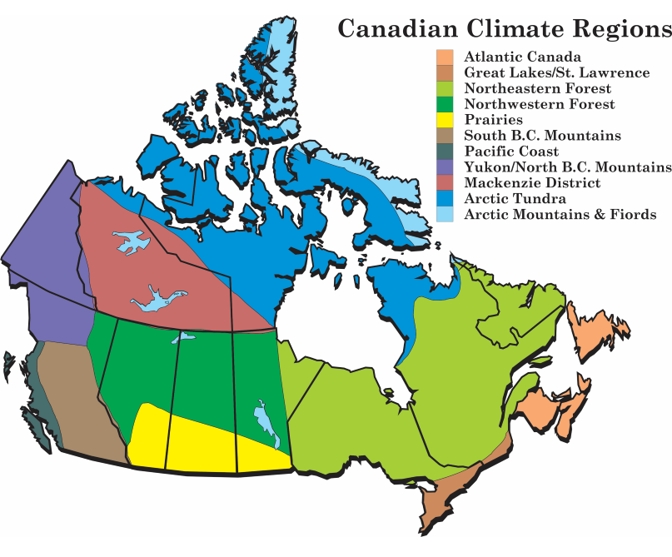
The map of Canadian Climate Regions
Long description
A map that shows the Canadian Climate Regions: Atlantic Canada, Great Lakes/St. Lawrence Lowlands, Northeastern Forest, Northwestern Forest, Prairies, South British Columbia Mountains, Pacific Coast, North British Columbia Mountains/Yukon, Mackenzie District, Arctic Tundra, Arctic Mountains and Fiords.