
Screening assessment certain organic flame retardants substance grouping benzene, 1,1’-(1,2-ethanediyl)bis [2,3,4,5,6-pentabromo- decabromodiphenyl ethane (DBDPE)
Official title: Screening assessment certain organic flame retardants substance grouping benzene, 1,1’-(1,2-ethanediyl)bis [2,3,4,5,6-pentabromo- Decabromodiphenyl ethane (DBDPE)
Chemical Abstracts Service Registry Number 84852-53-9
Environment and Climate Change Canada
Health Canada
May 2019
Cat. No.: En14-370/2019E-PDF
ISBN 978-0-660-30243-0

Synopsis
Pursuant to section 68 of the Canadian Environmental Protection Act, 1999 (CEPA), the Minister of the Environment and the Minister of Health have conducted a screening assessment of benzene, 1,1’-(1,2-ethanediyl)bis[2,3,4,5,6-pentabromo-. This substance, commonly known as decabromodiphenyl ethane, or DBDPE, is identified by the Chemical Abstracts Service Registry Number (CAS RN) 84852-53-9. This substance is included in the Certain Organic Flame Retardants (OFR) Substance Grouping under Canada’s Chemicals Management Plan, which includes ten organic substances having a similar function: the application to materials to slow the ignition and spread of fire. DBDPE was identified as a priority for assessment on the basis of ecological concerns identified through the CEPA New Substances program. While this substance is not on the Domestic Substances List (DSL), it has been in commerce in Canada since the transitional period between the establishment of the DSL and the coming into force of the New Substances Notification Regulations (Chemicals and Polymers) (January 1, 1987 and July 1, 1994).
On the basis of information gathered from a survey conducted under section 71 of CEPA , as well as data from the New Substances program, DBDPE imports to Canada ranged from 1 000 000 to 10 000 000 kg in 2011, including DBDPE in neat form, in formulations, and in commercial products or products available to consumers. DBDPE is used in Canada as an additive flame retardant in many applications, such as plastic and rubber materials, electrical and electronic equipment, adhesives and sealants.
DBDPE does not occur naturally in the environment. Globally, sources of exposure to DBDPE are primarily from waste streams or effluents of manufacturing and processing plants using DBDPE as an additive flame retardant, but also from releases from products available to consumers or commercial products in service. DBDPE has become commercially important since the early 1990s as a flame retardant in its own right, and more recently as an alternative for the structurally similar flame retardant decabromodiphenyl ether (decaBDE).
Generally, DBDPE is characterized by very low water solubility, low vapour pressure, and a very high organic carbon-water partition coefficient and octanol-water partition coefficient. A close structural analogue, decaBDE, was considered for read-across of certain physical-chemical properties, as well as to predict substance behaviour in the environment. DBDPE has been measured in the Canadian environment, as well as internationally, with highest concentrations near urban and/or industrial areas. When released to the environment, DBDPE is expected to predominantly reside in soil and/or sediment. Particle-bound transport may contribute to long range transport and deposition in remote areas.
Experimental and modelled data indicate that aerobic biodegradation (including in the presence of plants) and anaerobic biodegradation of DBDPE is limited and that DBDPE is expected to be persistent in water, soil, and sediment. Limited DBDPE transformation was also identified in high temperature applications and recycling. Studies report that photodegradation of DBDPE may proceed quickly in solvents, but more slowly in other matrices/substrates, and modelled predictions for atmospheric degradation suggest DBDPE is persistent in air (gas phase half-life greater than 4 days). Although degradation of DBDPE is expected to be slow or limited, there is uncertainty with respect to ultimate transformation products in the environment. Potential DBDPE transformation products were evaluated based on predictions from photodegradation studies, biodegradation/metabolism modelling and considering the analogue decaBDE. DBDPE debromination was expected to continue from nona- and octa-bromo diphenyl ethanes (BDPEs) through the formation of hepta-, hexa-, and pentaBDPEs (similar to decaBDE), or lead to a hydroxylated nonaBDPE pathway. As there are no experimental data, QSAR modelling was conducted to assess the characteristics of these potential DBDPE transformation products. Preliminary modelling indicates DBDPE transformation products can be considered analogues to lower brominated polybrominated diphenyl ethers (PBDEs), and would be persistent, would be bioaccumulative in some cases, and potentially highly toxic to aquatic organisms. The Ecological Screening Assessment on PBDEs (June 2006) concluded that lower brominated PBDEs, namely tetraBDE, pentaBDE and hexaBDE, satisfy the criteria outlined in the Persistence and Bioaccumulation Regulations of CEPA.
There is a limited amount of empirical data on DBDPE accumulation in biota, but these data combined with DBDPE physical and chemical properties indicate a lower potential for bioaccumulation in organisms.
Based on soil chronic toxicity testing, DBDPE has the potential to cause reproductive effects at high concentrations to earthworms as well as effects on plant survival and growth. No effects up to the highest tested dose (5000 mg/kg) were observed for sediment organisms in chronic toxicity tests. A water (pelagic) critical toxicity value (CTV) was not determined for DBDPE in this assessment, based on uncertain aquatic test results. It is considered that sediment and soils are more relevant for assessing exposure to DBDPE due to its high hydrophobicity and expected fate in the environment.
It is expected that DBDPE may be released to the Canadian environment as a result of industrial processing activities. Additive use of DBDPE in products suggests diffuse emissions may occur from commercial products or products available to consumers and, although there are uncertainties, the rate is assumed to be low in comparison to industrial point sources during incorporation of the substance into products. Industrial scenarios (which considered available site information), with DBDPE release to water and predicted partitioning to sediment and releases to soil, were used to estimate exposure. Risk quotient analyses, integrating conservative estimates of exposure with toxicity information, were performed for the sediment and terrestrial compartments (soil and wildlife). These analyses showed that current risks posed by the DBDPE, itself, are low.
A risk quotient analysis for DBDPE transformation products was not conducted given the lack of information on transformation products quantity in Canada. However, the findings of this analysis are consistent with the concerns expressed in the 2010 Ecological State of the Science Report on Decabromodiphenyl Ether in that DBDPE is expected to transform to lower brominated products in a manner similar to decaBDE. Transformation products, which are predicted to be harmful to the environment, are expected to represent a minor fraction relative to parent DBDPE; however, they are similar to predicted/measured fractions of analogue decaBDE debromination products, and if DBDPE levels in the environment continue to increase (e.g., owing to its use as a replacement flame retardant), the pool of potential brominated transformation products could become important.
Considering all available lines of evidence presented in this screening assessment for DBDPE and the potential for persistence, bioaccumulation and inherent toxicity of its transformation products, there is risk of harm to the environment from DBDPE. It is concluded that DBDPE meets the criteria under paragraph 64(a) of CEPA as it is entering or may enter the environment in a quantity or concentration or under conditions that have or may have an immediate or long-term harmful effect on the environment or its biological diversity. However, it is concluded that DBDPE does not meet the criteria under paragraph 64(b) of CEPA as it is not entering the environment in a quantity or concentration or under conditions that constitute or may constitute a danger to the environment on which life depends.
No classifications of the health effects of DBDPE by national or international regulatory agencies were identified. No chronic or carcinogenicity studies using DBDPE were identified. On the basis of the available information regarding genotoxicity, DBDPE is not considered genotoxic. No adverse effects were observed in sub-chronic animal studies. In two separate developmental toxicity studies, no treatment-related maternal or developmental effects were observed in experimental animals exposed to DBDPE via the oral route. Limited biomonitoring data in humans are available.
The highest doses tested in experimental animal studies, with no treatment related effects, are six to seven orders of magnitude higher than the estimates of exposure to DBDPE from environmental media or products available to consumers for the Canadian general population. This margin is considered adequate to account for uncertainties in the health effects and exposure databases. Based on this, it is concluded that DBDPE does not meet the criteria under paragraph 64(c) of CEPA.
Overall conclusion
It is concluded that DBDPE meets one or more of the criteria set out in section 64 of CEPA.
It has also been determined that DBDPE meets the persistence criteria, but not the bioaccumulation criteria as set out in the Persistence and Bioaccumulation Regulations of CEPA. However, DBDPE may contribute to the formation of persistent, bioaccumulative, and inherently toxic transformation products, such as lower brominated BDPEs, in the environment.
1. Introduction
Pursuant to sections 68 or 74 of the Canadian Environmental Protection Act, 1999 (CEPA) (Canada 1999), the Minister of the Environment and the Minister of Health conduct screening assessments on one of ten substances, referred to collectively under the Chemicals Management Plan as Organic Flame Retardant Substance Group, to determine whether this one substance present or may present a risk to the environment or to human health.
The Substance Groupings Initiative is a key element of the Government of Canada’s Chemicals Management Plan (CMP). The Organic Flame Retardant (OFR) Substance Grouping consists of ten substances that were identified as priorities for assessment, as they met the categorization criteria under section 73 of CEPA, or were considered as a priority on the basis of ecological or health concerns (Environment Canada and Health Canada 2007). All of these substances have a similar function: the application to materials to slow the ignition and spread of fire. These substances are potential alternatives for other flame retardants which are presently subject to regulatory controls or phase-out in Canada and/or globally. This screening assessment focuses on the substance benzene, 1,1’-(1,2-ethanediyl)bis[2,3,4,5,6-pentabromo-, or decabromodiphenyl ethane (DBDPE) (CAS RN 84852-53-9).
As DBDPE is not present on the Domestic Substances List (DSL), it is subject to the New Substances Notifications Regulations (Chemicals and Polymers) pursuant to CEPA (Canada 2005). Following New Substances ecological and human health risk assessments, the evaluation indicated ecological concerns and this substance was suspected of being “CEPA toxic.” DBDPE has been in commerce in Canada since the transitional period between the establishment of the DSL and the coming into force of the New Substance Notification Regulations (between January 1, 1987 and July 1, 1994). Risk management measures (i.e., Ministerial Conditions) have been imposed on New Substance notifiers to mitigate potential risks to the environment.
This screening assessment includes consideration of information on chemical properties, environmental fate, hazards, uses and exposure, as well as additional information submitted by stakeholders. Relevant data were identified up to January 2017 for the ecological assessment and the human health assessment. Targeted information was added up to April 2019 for the ecological component of this assessment based on a stakeholder submission. Empirical data from key studies, analogue data, as well as some results from models were used to reach proposed conclusions. When available and relevant, information presented in assessments from other jurisdictions was considered.
This screening assessment was prepared by staff in the CEPA Risk Assessment Program at Health Canada and Environment and Climate Change Canada (ECCC) and incorporates input from other programs within these departments. The ecological and human health portions of this assessment have undergone external written peer review and/or consultation. Comments on the technical portions relevant to the environment were received from Jon Arnot (Arnot Research and Consulting), John Biesemier (Chemtura), Adrian Covaci (University of Antwerp), Miriam Diamond (University of Toronto), and Marcia Hardy (Albermarle). Comments on the technical portions relevant to human health were received from Michael Jayjock of the LifeLine group, Paul Rumsby of the U.S. National Centre for Environmental Toxicology, and Pam William of E Risk Sciences. Additionally, the draft of this screening assessment was subjected to a 60 day public comment period. While external comments were taken into consideration, the final content and outcome of the screening assessment remain the responsibility of Health Canada and ECCC.
This screening assessment focuses on information critical to determining whether substances meet the criteria as set out in section 64 of CEPA by examining scientific information and incorporating a weight of evidence approach and precautionFootnote 1 . This screening assessment presents the critical information and considerations on which the conclusion is based.
2. Substance identity
Benzene, 1,1’-(1,2-ethanediyl)bis[2,3,4,5,6-pentabromo- or decabromodiphenyl ethane (DBDPE) is an organic flame retardant, grouped with the OFRs under the Substance Grouping Initiative of the CMP. The structural identity of this substance is presented in Table 2-1. Other names for the substance are presented in Appendix A (Table A-1). For this assessment, decabromodiphenyl ethane will be referred to as DBDPE.
| CAS RN | Chemical structure | Molecular mass (g/mol) | Chemical formula |
|---|---|---|---|
| 84852-53-9 | 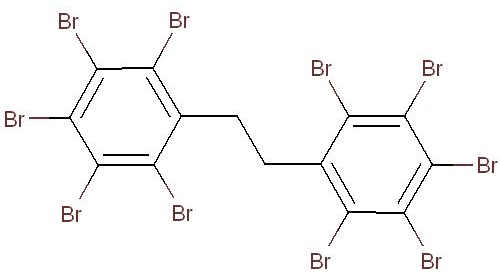 |
971.23 | C14H4Br10 |
2.1 Selection of analogues and use of (Q)SAR models
Guidance on the use of a read-across approach and Quantitative Structure-Activity Relationships or (Q)SAR models for filling data gaps has been prepared by various organizations such as the Organisation for Economic Co-operation and Development (OECD). These methods have been applied in various regulatory programs including the European Union’s (EU) Existing Substances Programme. In this assessment, data from an analogue and the results of (Q)SAR models, where appropriate, have been used to inform the ecological and human health assessments. An analogue was selected that was structurally similar and functionally similar to DBDPE (e.g. on the basis of physical-chemical properties, and fate), and that had relevant empirical data that could be used to read-across to supplement the DBDPE physical–chemical properties dataset. The applicability of (Q)SAR models was determined on a case-by-case basis. Details of the analogue data and (Q)SAR models chosen to inform the ecological and human health assessments of DBDPE are further discussed in the relevant sections of this report.
The analogue used to inform the ecological assessment is presented in Table 2-2. Decabromodiphenyl ether (decaBDE) represents a close structural analogue (e.g. Dice Similarity index= 85.1% (OECD QSAR Toolbox 2012)), and is considered appropriate for analysis of certain physical-chemical properties (e.g. octanol-water partition coefficient (log Kow), water solubility, vapour pressure) alongside measured and estimated DBDPE data (Appendix B). DecaBDE is discussed throughout the assessment in comparisons of substance behaviour with DBDPE (e.g., degradation, long range transport, bioaccumulation potential, and ecotoxicity). However, it is noted that some differences in molecular makeup, dimensions, and configurations exist between DBDPE and decaBDE that may affect the manner in which these molecules interact with their environment (Albermarle 2016, 2014 manufacturer communication to Environment Canada; unreferenced). In comparing the two substances, DBDPE’s ethane bridge between the aromatic rings (rather than the ether bridge in decaBDE) is expected to make it slightly more hydrophobic than decaBDE, and is expected to introduce more conformational flexibility in the molecule (Covaci et al. 2011). DBDPE requires a higher energy for debromination (a degradation pathway) than decaBDE as reported in Albermarle (2016).
| Substance CAS RN | Substance name | Molecular weight (g/mol) | Empirical structure/molecular formula |
|---|---|---|---|
| 1163-19-5 | decabromodiphenyl ether (decaBDE) | 959.171 | 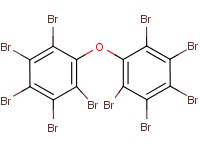 C12Br10O C12Br10O |
3. Physical and chemical properties
Physical and chemical properties determine the overall characteristics of a substance and are used to determine the suitability of different substances for different types of applications. Such properties also play a critical role in determining the environmental fate of substances (including their potential for long-range transport), as well as their toxicity to humans and non-human organisms. A summary of experimental, modelled, and key values for the physical and chemical properties of DBDPE that are relevant to its environmental fate and ecotoxicity can be found in Table 3-1. A detailed table of physical and chemical properties of DBDPE (empirical and modelled) and a summary of analogue physical and chemical properties can be found in Appendix B.
DBDPE was considered amenable to model prediction of physical-chemical properties using (Q)SARs, as it is within the model domain of applicability (i.e., structural and/or property parameter domains are represented in the training set used for the models).
Physical-chemical properties of DBDPE were checked for internal consistency according to the Least-Squares Adjustment Procedure (LSA) (Schenker et al. 2005). Geometric mean or arithmetic mean (for logarithmic variables) values of the most reliable and independent values found from empirical data, modelling, and analogues were used to determine the inputs to the LSA (Appendix B, Table B-1, B-2). Subcooled adjusted values were input for water solubility, vapour pressure, and octanol solubility (Schenker et al. 2005). In determining internal consistency of the properties, the LSA model also produces predicted values. While experimental based estimates for log Kow, water solubility, and vapour pressure exist for DBDPE, there remains uncertainty with these values, in particular, with the experimental log Kow value of 3.55 (e.g. Stieger 2014). For the purposes of this assessment, the log Kow value 9.89, derived from the LSA method, was selected. To maintain internal consistency of physical-chemical values, the LSA method value for water solubility and vapour pressure were also considered. Final selected values are summarized in Table 3-1.
Generally, DBDPE is characterized by very low water solubility, low to very low vapour pressure, and a very high organic carbon-water partition coefficient and octanol-water partition coefficient.
| Property | Experimental | Modelled | Selected value for modellingc |
|---|---|---|---|
| Physical state | (off) white powder | N/A | N/A |
| Melting point (ºC) | 345 - 355 | 259.7 | 345 |
| Boiling point (ºC) | N/A- degrade before boiling | 600.9 | N/A |
| Density (kg/m3) | 868 – 3250 (packed) | N/A | N/A |
| Vapour pressure (Pa) | ~1 x 10⁻⁶a – <1 x 10⁻⁴ | 2.85 x 10⁻¹⁶ - 5.59 x 10⁻¹⁰ | 5.59 x 10⁻¹⁰ (liquid subcooled 8.21 x 10⁻⁷) |
| Henry’s Law constant (Pa·m3/mol) | NA | 2.59 x 10⁻⁴ – 6.71 x10⁻² | 6.51 x10⁻³ – 6.71 x10⁻² |
| Log Kow (dimensionless) | ~3.55b, 8.7a | 7.86 –13.64 | 9.89 |
| Log Koc (dimensionless) | NA | 6.38 – 8.58 | 8.58 |
| Log Koa (dimensionless) | NA | 14.45– 19.22 | 14.45 |
| Water solubility (mg/L) | <1 x 10⁻⁴a – 7.2 x 10⁻⁴ | 7.34 x 10⁻¹⁰ – 2.15 x 10⁻² | 8.10 x10⁻⁶ (liquid subcooled: 1.19 x10⁻²) |
| pKa | N/A | N/A | N/A |
Abbreviations: N/A, not applicable. log Kow, octanol-water partition coefficient; log Koc, organic carbon-water partition coefficient; log Koa, octanol-air partition coefficient; pKa, acid dissociation constant; NA, not available.
a Read-across value from analogue decaBDE.
b Experimentally estimated log Kow value (3.55) evaluated to be highly uncertain and therefore not included in mean log Kow for LSA.
c See Appendix B, Table B-2 for detailed physical-chemical property values and references.
4. Sources
There is no reference in the published literature for the natural occurrence of DBDPE in the environment. Sources of exposure to DBDPE are anthropogenic, primarily from waste streams or effluents of manufacturing and processing plants using DBDPE as an additive flame retardant, and release from products available to consumers or commercial products to the environment.
DBDPE has become increasingly important commercially since the 1990s as a flame retardant in its own right and as a replacement for commercial DecaBDE (Kierkegaard et al. 2004, Covaci et al. 2011; EFSA 2012). North American manufacturers of decaBDE have voluntarily phased out the production, import, and sale of DecaBDE by 2012 in cooperation with the US Environmental Protection Agency (EPA) and ECCC (BSEF c.2001-2015). There also exist governmental efforts to limit the manufacture, import and use of decaBDE (Environment Canada c.2006-2013). In Canada, risk management of decaBDE is supported by concerns respecting the transformation of decaBDE to lower brominated polybrominated diphenyl ethers (PBDEs), which include tetra-, penta- and hexaBDEs, substances considered to be highly persistent and bioaccumulative (Environment Canada 2010, Canada c.2006-2013).
In Canada, as DBDPE is not present on the DSL, it is subject to the New Substances Notifications Regulations (Chemicals and Polymers) pursuant to CEPA. On the basis of information gathered from a survey conducted under section 71 of CEPA, and the data from New Substances notifications, the total quantity of DBDPE imported into Canada in 2011 was in the range of 1 000 000 – 10 000 000 kg, including DBDPE in some products. No DBDPE was identified as being manufactured in Canada. The total quantity of DBDPE exported out of Canada in 2011 was less than 100 000 kg (Canada 2005; ECCC 2013-2014).
Globally, manufacturing of DBDPE is known to occur in the United States (US) (Covaci et al. 2011, US EPA 2012). In the US, DBDPE is a chemical on the Toxic Substances Control Act (TSCA) Inventory, and the substance is subject to a Significant New Use Rule (SNUR). In 2012, the US production/import volume was between 22 720 000 to 45 450 000 kg (50 to 100 million pounds) (US EPA 2012). According to the US EPA 2012 Chemical Data Reporting (CDR), 5 companies were associated with DBDPE as producers or importers in the US.
No manufacturing of DBDPE has been reported to occur in Europe (Environment Agency 2007). Although the substance is listed as a Low Production Volume chemical (under 1 000 000 kg/yr) on the European Chemical Substance Information Systems (ESIS) website (searched March 2014) (ESIS 1995-2012), other sources suggest use in Europe may be higher. For example, use in Europe has been estimated at 2 500 000 kg/year with data trends suggesting increasing consumption (Environment Agency 2007), primarily in Germany (Covaci et al. 2011). A Substances in Preparations in Nordic Countries (SPIN) database (searched April 2014) indicated records of use for 2006, and 2008 through 2011 in Sweden, with substance use ranging between 5000 and 39 000 kg/year (SPIN 2006). The substance is listed as a High Production Volume chemical on the OECD Existing Chemicals Website (searched March 2014).
Recent production (e.g., 2006) of DBDPE in China has been reported to range from 11 000 000 to 12 000 000 kg per year (Shi et al. 2009; Zhang et al. 2009). Shi et al. (2009) suggests that China has become a significant brominated flame retardant producer during the past decades.
5. Uses
DBDPE is made by the direct bromination of diphenylethane (Weil and Levchik 2009), and marketed globally under different trade names (Appendix A, Table A-1). DBDPE is reported to be a relatively pure substance; the commercial grade is reported to be typically 96 to 98.5% (by weight) pure, with the remainder consisting largely of nonabromodiphenyl ethane congeners (1 to 3% by weight), and octabromodiphenyl ethane congeners of less than 1% by weight (Chemtura 2005; Environment Agency 2007; Albermarle 2008, 2013, 2016).
In Canada, as DBDPE is not present on the DSL, it is subject to the New Substances Notifications Regulations (Chemicals and Polymers) pursuant to CEPA (Canada 2005). Recent risk management measures (i.e., Ministerial Conditions), on the basis of the New Substances ecological risk assessments, have limited the import of the substance for use as a flame retardant component of wire and cable coatings, thermoplastic parts, thermoplastic coatings, thermoset parts and thermoset coatings, as well as placing some restrictions on its release and disposal (Canada 2004, 2011). According to submissions made under section 71 of CEPA (Canada 2013) and submissions under the New Substance Notifications Regulations, (Ministerial Conditions 13228 and 16260) (Canada 2004, 2011), DBDPE is used in Canada as a flame retardant in applications of: plastic and rubber materials such as thermoplastic or thermoset parts and coatings (for use in polymer resins and polymer plastics); electrical and electronics including appliances and wire and cable coatings for the telecommunications industry; automotive, aircraft, and transportation, adhesives and sealants, appliances; and basic organic chemical manufacturing. DBDPE was also reported to be used in the manufacture of automotive airbag textile and generally in motor vehicles (ECCC 2013-2014). It is expected that typical polymer loading rates of DBDPE are similar to those of decaBDE, i.e., 10 to 15% by weight (Environment Agency 2007).
Globally, DBDPE is used as a substitute for decaBDE, and is therefore used in similar applications, such as the manufacture of plastics (including polyester and vinyl ester resins) and rubber products, and as an additive in textiles, such as cotton and polyester (Covaci et al. 2011). The substance is also used in polymers used for electronic and electrical applications, as well as in adhesives and sealants (EFSA 2012). Manufacturer literature indicates DBDPE is suitable for use in systems where mechanical recycling is anticipated, owing to its impressive thermal stability and low blooming characteristics (i.e., additives migrating to the surface of the material over time) in finished resins (Albermarle 2007). This manufacturer also claims that DBDPE's high bromine content allows for a high level of flame retardancy at a relatively lower flame retardant loading than alternative substances, and that it may be found in electronic devices, in wire and cable applications, in buildings where electrical current is present and in a variety of transportation related applications (Albemarle 2016).
Available information from Europe has indicated that the major use of DBDPE in Europe and the United Kingdom (accounting for at least 90% of the tonnage supplied) is as an additive flame retardant for polymers. The remaining consumption is expected to be largely for textiles (Environment Agency 2007). SPIN database records of use for 2006, and 2008 through 2011 for Sweden, indicate that all DBDPE use falls in the category of manufacture of rubber and plastic products (specifically flame retardants and extinguishing agents). For Finland, records note DBDPE use for the manufacture of other transport equipment (specifically adhesives and binding agents).
Currently, DBDPE is the second highest additive brominated flame retardant (BFR) used in China with production increasing at 80% per year (Covaci et al. 2011). This is likely related to the rapid growth of its electrical and electronic industries during the past decades (Shi et al. 2009). In Japan, the use of DBDPE is likely replacing the use of DecaBDE (Watanabe and Sakai 2003, Covaci et al. 2011). The use of DBDPE increased continuously in Japan from 1993 to 2000, whereas the consumption of DecaBDE decreased over the same time period (de Wit et al. 2011).
DBDPE is not listed as an approved food additive in the Lists of Permitted Food Additives, which have been incorporated by reference into their respective Marketing Authorizations issued under the Food and Drugs Act (Health Canada [modified 2017]), nor has it been identified as being used/present in formulations of food packaging materials or incidental additives (August 2013 email from Food Directorate, Health Canada, to Risk Management Bureau, Health Canada; unreferenced). DBDPE is not listed in the Drug Products Database, the Therapeutic Products Directorate’s internal Non-Medicinal Ingredient Database, the Natural Health Products Ingredients Database or the Licensed Natural Health Products Database as a medicinal or non-medicinal ingredient present in final pharmaceutical products, natural health products or veterinary drugs in Canada (DPD [modified 2017]; LNHPD [modified 2016]; NHPID [modified 2017]; July 2013 email from the Therapeutic Products Directorate, Health Canada, to Risk Management Bureau, Health Canada; unreferenced). On the basis of the notifications submitted under the Cosmetic Regulations to Health Canada, DBDPE is not anticipated to be used in cosmetic products in Canada (June 2013 email from the Consumer Product Safety Directorate, Health Canada to the Risk Management Bureau, Health Canada; unreferenced).
DBDPE is not in any registered products regulated under the Pest Control Products Act (May 2012 email from Pest Management Regulatory Agency, Health Canada to the Risk Management Bureau, Health Canada; unreferenced).
With increasing regulation and phasing-out of production of the polybrominated diphenyl ethers (PBDEs), it is expected that the production and usage of DBDPE will increase (Ricklund et al. 2008).
6. Releases to the environment
Anthropogenic releases to the environment depend upon various losses occurring during the manufacture, industrial use, consumer/commercial use, service life and disposal of a substance. Releases of DBDPE to the Canadian environment, owing to the substance’s use as an additive flame retardant, are expected to be from both point sources (e.g., from processing facilities, product manufacturing) as well as from diffuse sources. Releases may occur in both indoor and outdoor environments.
According to submissions made under section 71 of CEPA and publicly available technical literature, DBDPE is imported into Canada in neat form, as formulations, and in commercial products or products available to consumers (Canada 2013, CCC 2011).
DBDPE release to the environment is most likely to occur during the manufacturing, formulation or industrial use. Releases to the environment are expected to occur primarily through wastewater, with some release to water directly from industrial sites. Canadian effluent and wastewater biosolids data show that publicly owned wastewater treatment systems (WWTS) with higher proportional industrial inputs (e.g., greater than 30%) have higher DBDPE concentrations (e.g., 10X) than those dominated by domestic (non-industrial) influent input (Kim et al. 2014; Melymuk et al. 2014). Release to the soil could occur through the application of wastewater biosolids to agricultural and pasture lands.
In terms of migration from commercial products and products available to consumers, or as an additive brominated flame retardant that is blended with the polymer product (rather than a reactive flame retardant chemical bonded to the polymer product), there is the possibility of release from these products to the environment (Guerra et al. 2011). DBDPE is proposed to be released to air or dust by volatilization or abrasion of product containing the substance (Melymuk et al. 2014), which could result in DBDPE deposition to soil and water release to publicly owned WWTS.
Although DBDPE has low volatility, emissions to air (e.g., from airborne particles, dust or release from products) could result in atmospheric deposition to soil and water. For example, a pattern of increasing pond sediment DBDPE concentrations with proximity to chemical manufacturing facilities has been attributed largely to transport through the movement of air and airborne particles (Wei et al. 2012). When a substance is transferred to land, it may become bound to soil, be washed into the sewer or surface water or transferred by wind or rain to nearby soil.
Finally, while the majority of landfills in Canada treat their leachate through WWTS, landfills that do not collect and treat their leachate may potentially release substances to ground or surface water via leachate or, although unlikely, there is potential for releases of substances to the atmosphere through gas from landfills that do not collect and destroy their landfill gas.
This information and fate in the environment are used to further develop exposure characterization scenarios to estimate resulting environmental concentrations.
7. Measured environmental concentrations
There are challenges to measuring and analyzing very hydrophobic substances like DBDPE in environmental media, including very low solubility in water and organic solvents; tendency to adsorb to particulates and solids (e.g., organisms and/or chamber walls); degradation during clean-up and instrumental analysis; and generally less expertise in the analysis of the substance (Breitholtz et al. 2006; Kierkegaard et al. 2009). DBDPE is a difficult brominated flame retardant to analyze, and uncertainty can reach 40 to 60%, depending on the internal standard used for quantification (2014 communication from A. Covaci to Environment Canada; unreferenced). Most studies to date have analyzed DBDPE using gas chromatography/mass spectrometry (GC-MS) using analysis for the bromide ion. Furthermore, as is common for ‘emerging’ chemical substances, established analytical methods to detect, identify, and quantify DBDPE transformation products in environmental matrices are lacking (Dirtu et al. 2014, Lambropoulou and Nollet 2014).
DBDPE has been detected in the Canadian environment, as well as in other countries, generally at low levels. Highest concentrations of DBDPE tend to be found close to urban or industrial areas (Tables 7-1 and 7-2, ECCC, HC 2019).
Few studies have reported the presence of DBDPE in air. Air and precipitation samples were collected every 12 days at five sites near the North American Great Lakes from 2003 to 2011 (inclusive) by the Integrated Atmospheric Deposition Network (IADN). On the basis of IADN data, Ma et al. (2013) reported overall DBDPE average atmospheric concentrations (vapour + particle) of 1.2 to 5.2 pg/m3 for the five sites (detection frequency ranged from 8 to 54%), with the highest concentrations near urban areas (increasing as a function of population). Vernier and Hites (2008) evaluated earlier data from the same sites, and determined a maximum mean concentration of ~ 22 pg/m3 near an urban area (Cleveland) but lower levels in a remote area (Eagle Harbour, Michigan,~ 1 pg/m3, read from graph).
In the Canadian Arctic (Devon Ice Cap, Nunavut), DBDPE was detectable in some horizons of snow pits; however, the concentration patterns did not show clear deposition time trends (Meyer et al. 2012), and the concentrations (Non Detected (ND) – 24 pg/L, detected only twice) were, on average, lower than those reported for the Norwegian Arctic. DBDPE has been measured in precipitation in the Great Lakes area, with mean concentrations of 256 to 1440 pg/L between 2003 and 2009 (Salmova and Hites 2010, 2011).
To date, only one study has detected DBDPE in Canadian surface water (Venier et al. 2014), reporting Great Lake basin wide DBDPE concentrations from an average of 0.25 ± 0.05 pg/L (Lake Huron) to 10.8 pg/L (Lake Ontario). In the same study, 6.7pg/L was the DBDPE concentration observed in Lake Superior, which was influenced by a sampling station near the heavily industrialized urban centre of Thunder Bay, Ontario. Other studies of Canadian surface water, however, have not detected DBDPE (Law et al. 2006; Muir et al. 2011).
While no soil measurements for DBDPE have been reported for Canada or North America, DBDPE has been measured and detected in soil in Asia (e.g., 1.13 (farmland) to 1612 (industrialized land of an e-waste site) ng/g dw for China (Lin et al. 2015).
DBDPE sediment concentrations have been reported for the Great Lakes (0.11 to ~200 ng/g dw) (Kolic et al. 2009; Yang et al. 2012). A recent sediment core study from the Great Lakes (Canada and the United States) reported DBDPE surface sediment concentrations ranging from 0.11 to 2.8 ng/g dw, with the highest concentrations in Lake Michigan (up to 2.5 ng/g dw) and Lake Huron (up to 2.8 ng/g dw) (Yang et al. 2012). DBDPE was the sixth most frequently detected of the 13 BFRs surveyed. Yang et al. 2012 noted that while DBDPE surface sediment concentrations were approximately one order of magnitude lower than those of decaBDE (0.87 to 106 ng/g dw), DBDPE input is increasing rapidly, with sediment concentrations estimated to double every 3 to 5 years in Lake Michigan and approximately every 6 to 7 years in Lake Ontario. In another study, Kolic et al. (2009) presented DBDPE concentrations ranging from approximately 8 to 200 ng/g dw (read from graph) in surface sediment from Lake Ontario and its tributaries. However, DBDPE was not detected in the sediments of Lake Winnipeg during a 2003 sampling program (Law et al. 2006). In an Arctic marine sediment study, Cai et al. (2012) measured DBDPE in sediment from the Canada Basin, Chukchi Sea, and Bering Sea of the western Arctic Ocean (non-detect to 452.6 pg/g dw), with an average of 166.7 pg/g dw. These concentrations were on the same order of magnitude as decaBDE concentrations measured in the same study.
Elsewhere in North America, Wei et al. (2012) reported a pattern of increasing lake or pond sediment DBDPE concentrations with increasing proximity to chemical manufacturing facilities that produce DBDPE (and produced DecaBDE) in Arkansas, USA, including the highest concentration yet reported for DBDPE (up to 2394 ng/g dw). As there are no manufacturing water releases to surface waters (but WWTS water and biosolids input occurred at on site from 1952 to1989), the dominant pathway for transport of DBDPE and decaBDE from the emission sources to the sampling sites was assumed to be through the movement of air and airborne particles.
DBDPE has been widely reported in wastewater effluent and biosolids (a potential route to the surface water and soil environments). In Canada, a recent study of 20 WWTS by Kim et al. (2014) reported mean DBDPE concentrations in final effluent to range from ND to 7.1 ng/L, with 86% of samples having nondetectable levels of DBDPE. Another study of six WWTS in Canada found DBDPE was detected in two of four samples, estimated at ~3 ng/L (value read from graph) (Zhou et al. 2010a). DBDPE estimates for WWTS biosolids vary greatly. Within Canada, measurements from Ontario range from 5.6 ng/g dw (wastewater biosolids) (Konstantinov et al. 2006) to ~100 ng/g dw (Kolic et al. 2009, value read from graph), although the level of treatment was not indicated. A study of 20 WWTS in Canada reported treated biosolids concentrations ranged from non-detect to 220 ng/g dw (Kim et al. 2014).
In Canada, DBDPE has been sampled in the fish tissue of several freshwater species, and concentrations have generally ranged from non-detect to very low (i.e., mean concentration ≤ 1 ng/g lipid weight (lw) (or wet weight (ww)) (Law et al. 2006; Ismail et al. 2006; Kolic et al. 2009; Byer et al. 2010, Byer 2013; Zhou et al. 2010b; Muir et al. 2011; Environment Canada 2014). The exception is a study reporting liver concentrations in 1 of 11 northern pike from the St. Lawrence River area and tributaries of 26.7 ng/g lw (3.78 ng/g ww) (Houde et al. 2014). DBDPE was not detected in mussels and plankton in Lake Winnipeg (2000 to 2002) (Law et al. 2006), nor in zooplankton sampled between 2006 and 2010 in the Great Lakes (Lake Ontario and Lake Erie), nor in a remote Ontario Lake (Lake Opeongo) (Muir et al. 2011).
Avian studies in Canada have occasionally detected DBDPE. DBDPE was not detected in eggs of four gull species (glaucous-winged (Larus glaucescens), California (Larus californicus), ring-billed (Larus delawarensis), and herring gulls (Larus argentatus) collected from 26 colonies across Canada (Atlantic to Pacific) (Chen et al. 2012). DBDPE was detected in 1 of 12 Peregrine Falcon eggs collected from the Great Lakes watershed, at 8.2 ng/g lw (Guerra et al. 2012), but DBDPE was not detected in Bald Eagle plasma collected from birds in the Great Lakes area, despite high levels of decaBDE in the same samples (Venier et al. 2010). Of the pools of eggs from seven Laurentian area Great Lakes colonies of herring gulls (Larus argentatus) collected between 1982 and 2006 (Gauthier et al. 2009), DBDPE was not detected prior to 1996, but was detected (mean concentration up to 11 ng/g ww) in 5 of 63 non-consecutive pools of eggs between 1996 and 2004. In 2005, DBDPE was detected in eggs from 3 of 7 colonies with concentrations up to 288 ng/g ww, and in 2006, eggs from 2 of 7 colonies had DBDPE concentrations up to 44 ng/g ww (Gauthier et al. 2009)
Ringed seal blubber samples from the Canadian Arctic in 2006 did not have measurable levels of DBDPE (de Wit et al. 2011). Polar bear adipose tissue samples from the Canadian Arctic, Alaska, and Svalbard, collected between 2005 and 2008, detected DBDPE in less than 14% of samples (McKinney et al. 2011b).
| Media (units) | Location(s) | Years (not continuous) | Concentration range |
|---|---|---|---|
| Air (pg/m3) | Nunavut, Great Lakes | 2005 to 2008 | ND – 22 |
| Surface water (pg/L) | Lake Winnipeg, Great Lakes, Ontario | 2004 to 2012 | ND-10.8 |
| Sediment (ng/g dw) | Lake Winnipeg, Great Lakes, Ontario, Canada Basin (arctic marine) | 2003 to 2008 | ND – 200 |
| Wastewater effluent (ng/L) | Ontario | NS | ND – 7.1 |
| Biosolids (ng/g dw) | Ontario | 2003 to 2010 | ND – 220 |
| Biota – aquatic (ng/g lw) | St. Lawrence, Ontario, Quebec, New Brunswick, Nova Scotia, Great Lakes, Lake Winnipeg | 2000 to 2012 | ND – 26.7 |
| Biota –terrestrial and avian (ng/g lw) | Great Lakes, Canadian Arctic, Southern NWT | 1982 to 2010 | ND – 8.2c |
Abbreviations: ND, not detected; NS, not stated.
a See Supporting Information (ECCC, HC 2019) for references and study details.
b Although wastewater system effluent and biosolids are not “environment,” they represent a direct source to the environment and are included in this table.
c Note the DBDPE range reported for terrestrial and avian organisms in “wet weight” (ww) is ND to 288 ng/g.
| Media (units) | Location(s) | Years (not continuous) | Concentration range |
|---|---|---|---|
| Air (pg/m3) | North America, Europe, Asia, Africa | 2003 to 2011 | ND - 3578 |
| Surface water (pg/L) | North America, Europe, Asia | 2003 to 2010 | ND – 38 |
| Soil (ng/g dw) | Asia | 2006 to 2007 | ND – 1612 |
| Sediment (ng/g dw) | North America, Europe, Asia | 2002 to 2009 | ND - 2394 |
| Wastewater, effluent (ng/L) | North America, Europe | 2006 to 2009 | ND – 7.1 (±5.6 SD) |
| Biosolids (ng/g dw) | North America, Australia, Africa, Asia, | 1998 to 2010 | ND – 4820 |
| Biota – aquatic (ng/g lw) | North America, South America, Asia, Europe | 1986 to 2010 | ND - 352 |
| Biota – terrestrial and avian (ng/g lw) | North America, Europe, Asia | 1982 to 2010 | ND – 863 |
a See Supporting Information (ECCC, HC 2019) for references and study details.
b Although wastewater system effluent and biosolids are not “environment,” they are included in this table since they are the pathway via which DBDPE from industrial inputs are expected to be released to the environment.
However, it is also important to consider how DBDPE levels in the environment may increase in future, for example, relative to the OFR it is proposed to replace, decaBDE. Ma et al. (2013) recently determined that DBDPE particle air concentrations in the Great Lakes area were similar to decaBDE air concentrations at most sampling locations, with the exception of Cleveland where manufacturing of decaBDE was expected to occur; the authors suggest the pattern indicates both substances are in use and share similar applications and sources (e.g., including products available to consumers). Goosey et al. (2013) also determined DBDPE dust concentrations in Toronto homes to be similar to those of decaBDE (see Section 10), both likely related to electrical and electronic equipment.
A comparison of DBDPE to decaBDE measurement ratios for WWTS data can provide evidence of where DBDPE use is high or substitution for decaBDE has occurred (Ricklund et al. 2008). Kim et al. (2013; 2014) measured both DBDPE and decaBDE in the same influent and effluent samples from 20 WWTS in Canada, representing populations of 1500 to greater than 1 000 000. The median influent DBDPE concentration was: 3.7 ng/L (maximum= 130 ng/L), while the median decaBDE concentration was 74.8 (and maximum= 433 ng/L), resulting in a median [DBDPE]/[decaBDE] influent ratio of 0.05. Similarly, the median final effluent DBDPE concentration was 0.2 (and maximum=7.1 ng/L), while the median decaBDE concentration was 3.7 (and maximum=59.9 ng/L), resulting in a similar [DBDPE]/[decaBDE] ratio of 0.055. An international survey of DBDPE in wastewater biosolids (Ricklund et al. 2008), showed ratios for Canadian samples of [DBDPE]/[decaBDE] in biosolids that ranged from 0.01 to 0.078. These ratios in both wastewater and biosolids indicate that DBDPE release reaching WWTS (including that from commercial products or products available to consumers) is still lower than that of decaBDE.
8. Environmental fate and behaviour
8.1 Environmental distribution
DBDPE is expected to be released to the environment primarily through wastewater, but may undergo some migration from products to the atmosphere as non-reactive brominated flame retardants have potential for some release from polymers (e.g., PBDEs)(Guerra et al. 2011). DBDPE is likely highly removed by adsorption to biosolids in wastewater treatment plants (Kim et al. 2014) and can be applied to agricultural soils during biosolids amendment. Level III fugacity modelling (Table 8-1) using the updated EQC model (v 1.0, 2012), was applied to describe the fate for these expected modes of entry into the environment. Generally, the results of Level III fugacity modelling show that DBDPE is expected to predominantly reside in soil and/or sediment, depending on the compartment of release.
| Substance released to: | Air (%) | Water (%) | Soil (%) | Sediment (%) |
|---|---|---|---|---|
| Air (100%) | 0.5 | 0.4 | 82.7 | 16.4 |
| Water (100%) | Negligible | 2.5 | Negligible | 97.5 |
| Soil (100%) | Negligible | Negligible | 99.9 | 0.1 |
Very low water solubility (8.10 x 10⁻⁶ mg/L), low vapour pressure (5.59 x 10⁻¹⁰ Pa at 25°C), low air–water partition coefficient (log Kaw = -4.57), and very high partition coefficients (log Kow of 9.89, estimated log Koc of 8.58) suggest that DBDPE released into the environment will be less likely to partition into and/or remain in air and water, moving instead to the sediments and soil. If released to air, a small fraction (less than 1%) DBDPE is expected to remain in air, with most of the substance depositing to soil and water with further partitioning to sediment. However, on the basis of predicted rates of degradation (greater than 4 days) and predicted patterns of transport (see description below), the small mass of DBDPE that remains in air has the potential for dispersion.
The high partition coefficients indicate that DBDPE released into surface water from wastewater treatment systems is expected to adsorb to the organic fraction of suspended solids and sediments, with 2.5% remaining in water. Volatilization from surface water to air is not expected. However, as in the case with air, the small fraction remaining is likely persistent and has the potential for some transport (e.g., particle transport). On the basis of its high log Koc, once in the sediment, DBDPE is not expected to be mobile, and may remain in this compartment with limited or slow degradation.
When DBDPE is released to soil as a function of biosolids application to agricultural lands, the majority of the mass fraction is expected to remain adsorbed to soil (99.9%) owing to its very hydrophobic nature. Evaporation from soil into air is not expected because of an extremely low vapour pressure. If released to soil, DBDPE is expected to be immobile based on its high estimated log Koc. In addition, low degradation is expected in soil; DBDPE is therefore likely to remain in this compartment, and the loss process in soil will mainly be driven by soil burial or surface runoff. The results of Level III fugacity modelling (Table 8-1) support the expectation that at steady state DBDPE predominantly distributes in soil or sediment, depending on the compartment of release (New EQC 2012).
8.1.1 Long-range transport potential
Predicted log Koa (14.45) and log Kaw (-4.57) values for DBDPE suggest low potential to reach the Arctic (Wania 2006, Brown and Wania 2008). The substance is identified as highly sorptive, sorbing to particles in atmospheric and aqueous media, and therefore, particle settling is predicted to limit long range transport (Brown and Wania 2008). However, if particle bound transport is more efficient than expected, given low predicted rates of degradation in air (greater than 4 days in gas phase, longer with air particles), there is the possibility that DBDPE could persist and be transported to the Arctic.
DBDPE was measured in horizons of snow pits dug in 2005, 2006 and 2008 in the Canadian Arctic (Devon Ice Cap, Nunavut); however, concentration patterns did not show clear deposition time trends (Meyer et al. 2012). In the Norwegian Arctic, Hermanson et al. (2010) measured DBDPE inputs of approximately 3.6 pg/cm2/yr (~1988) to 3.4 pg/cm2/yr (2005) in the top 34 m of an ice core (representing 1953 to 2005) from the western-most ice sheet of Svalbard; this suggests that either particle phase transport could be more important than expected, and/or that the quantity of the flame retardant used in source areas contributing to the ice sheet affects observations (Hermanson et al. 2010). However, other monitoring data for remote areas suggests that DBDPE does not currently seem to be found widely in the Arctic (e.g., de Wit et al. 2010, McKinney et al. 2011b).
The OECD POPs Screening Model can be used to help identify chemicals with high persistence and long-range transport potential (Scheringer et al. 2006). The Characteristic Travel Distance (CTD) calculated for DBDPE using the OECD model is 2860 km indicating that DBDPE has a significant potential for transport in air (with 99.99% of mass in air partitioned to particles/aerosols), but this is below the boundary (5097 km, CTD of PCB 28) suggested for global pollutants by Klasmeier et al. (2006). The model also calculates an overall persistence (Pov) of 277 days, and the transfer efficiency (TE), which is the percentage of emission flux to air that is deposited to the surface (water and soil) in a remote region. The TE for DBDPE was calculated to be 12.7%, which is above the boundary of 2.248% (PCB-28) established on the basis of the model’s reference substances empirically known to be deposited from air to soil or water. The high TE means that DBDPE might be deposited to Earth’s surface in remote regions.
In general, while DBDPE (considering its physical chemical properties) might not be expected to be a high concern for long-range transport, a high predicted transfer efficiency and some detection of DBDPE in remote areas, suggests the role of particle bound transport allows long-range transport of DBDPE to be possible. As well, it is unknown how susceptible potential DBDPE degradation products (see next section) could be for long-range transport.
8.2 Environmental persistence
On the basis of likely DBDPE releases and partitioning characteristics, environmental persistence is most relevant for the soil and sediment compartments where the majority of the substance is expected to be found. However, owing to the potential particle transport of DBDPE in air and water, all media are considered in this section. Empirical and modelled data were considered in the weight-of-evidence for DBDPE persistence. Data were also compared to the analogue, decaBDE. Relevant transformation processes for DBDPE include photodegradation, biodegradation and biotransformation, as well as combustion/pyrolysis.
Generally, model predictions are consistent with experimental findings that aerobic and anaerobic biodegradation of DBDPE is limited and that DBDPE is expected to be persistent in water, soil, and sediment. Photodegradation of DBDPE in solvents (e.g., n-hexane, tetrahydro-furan (THF)) may be fast; however, photodegradation could take much longer in other matrices/substrates (e.g., greater than 224 days in HIPS powder; Kajiwara et al. 2008). Modelled predictions for DBDPE in air suggest a half-life greater than 4 days (gas phase) and or an overall persistence (Pov) of 277 days (OECD POPs model). DBDPE testing under longer-term (e.g., greater than 6 month), environmentally relevant conditions to determine the degradation pathways and transformation products is lacking (possibly influenced by analytical challenges). Nevertheless, potential DBDPE transformation products were evaluated on the basis of predictions from photodegradation studies and biodegradation modeling, and by considering analogue decaBDE transformation products.
Tables 8-2 and 8-3 present empirical and modelled degradation data for DBDPE; a detailed description of studies is found in ECCC, HC (2019).
8.2.1 Abiotic degradation
A summary (2019 Albemarle Europe SPRL summary of information submitted under REACH as lead registrant and provided to Environment and Climate Change Canada in the context of the consultation on the Proposed amendments to the Prohibition of Certain Toxic Substances Regulations: 2018, unreferenced) of a study performed on the degradation of DBDPE at high temperature applications and during multiple recycling cycles is available. In this study, high-impact polystyrene samples treated with flame retardants (12% DBDPE and 4% antimony trioxide) were subjected to 6 recycling cycles at 250°C which the researchers noted approximated worst case conditions for high temperature use processes. The study found no observable degradation to octaBDPEs or lower brominated congeners at 100-200 ppm levels in resin. Approximately 0.2% of DBDPE was identified to debrominate to nonaBDPE during the six recycling cycles.
Kajiwara et al. (2008) observed no degradation of DBDPE in spiked high-impact polystyrene (HIPS) powder exposed to sunlight for 224 days (half-life was estimated at greater than 224 days), while the half-life of decaBDE in the same matrix was estimated at 51 days. Differences between DBDPE and decaBDE were attributed to structural differences in ether (oxygen) bond vs. ethane bond.
Nadjia et al. (2014) measured very rapid photolytic degradation of DBDPE in solvent under artificial UV-visible light: 63.18% degradation within 180 seconds. The degradation process is reported as stepwise reductive debromination.
Wang et al. (2012) studied the photolytic degradation of DBDPE under UV light using a range of matrices and solvents, including methanol/water and humic acid/water (to simulate the aquatic environment) and silica gel (to simulate the soil/sediment environment). These latter matrices are the most relevant to environmental conditions. Photolytic degradation occurred in all solvents/matrices (and none in the dark control), with 33.7 to 99.6% of the DBDPE lost. Degradation rates depended on the solvent used (Table 8-2). All matrices showed debromination and formation of nonaBDPEs, with subsequent degradation to octa-, and heptaBDPE congeners, although the percentage of transformation product relative to parent was not reported in the study. The authors recognize the presence of nona-BDPEs in the original solutions may be a result of impurities of the technical products (purity not reported) and/or degradation during sample injection; however, the concentrations of nona-BDPEs increased continuously from 0 to 45 min, and octaBDPEs (from 4 minutes on) and heptaBDPEs (from 30 minutes on) increased continuously during the experiments. The formation of tetra- to hexaBDPEs with longer exposure times was proposed, but not monitored.
In a preliminary study, Kierkegaard et al. (2009) studied technical DBDPE in n-hexane exposed to a daylight-mimicking fluorescent lamp, and found DBDPE was degraded, producing two nonabrominated congeners, as well as a number of peaks tentatively identified as octabrominated products. The authors also reported that DBDPE degrades to lower (mainly two nona-) brominated congeners during sample preparation/analysis, although it appeared to be less sensitive to thermal degradation than decaBDE (Kierkegaard et al. 2009).
The predicted half-life for atmospheric degradation of DBDPE because of the reaction with the hydroxyl radical is 4.47 days for the fraction of chemical that is in the gas phase (12-hr day, AOPWIN 2010). The results of AEROWIN (2010) predict a high fraction of DBDPE absorption to airborne particles (Phi = 1), and therefore, that the rate of DBDPE photolysis is likely lower than predicted (i.e., half-life longer than predicted 4.47 days). This is consistent with the OECD Pops model which finds 99.9% of DBDPE in air is sorbed to aerosols, and an overall persistence of 277 days for the substance.
On the basis of abiotic degradation modelled data and empirical data for DBDPE, the substance is expected to be persistent in air (Table 8-2). However, fate modelling indicates only a very small proportion of DBDPE released into the environment is expected to partition into air, and atmospheric concentrations of DBDPE are expected to be low. The high Koc of DBDPE suggests that DBDPE released directly into air will likely adsorb to particulates, with subsequent removal to soil or water by wet and dry deposition. Owing to DBDPE’s low water solubility, particle adsorption behaviour, as well as light attenuation by humic materials, photolysis in natural waters, soils, and biosolids is expected to be limited (Environment Agency 2007).
DBDPE does not contain functional groups expected to undergo hydrolysis.
| Medium | Fate process | Degradation value | Degradation endpoint / units | Methods | Reference |
|---|---|---|---|---|---|
| High-Impact Polystyrene (HIPS) | Photolysis | > 224 days | half-life/days | Published study | Kajiwara et al. 2008 |
| tetrahydro-furan | Photolysis | 1.89 min | half-life/min | Published study | Nadjia et al. 2014 |
| n-hexane | Photolysis | 16.6 min | half-life/min | Published study | Wang et al. 2012 |
| tetrahydro-furan | Photolysis | 6 min | half-life/min | Published study | Wang et al. 2012 |
| methanol/ water | Photolysis | >240 min | half-life/min | Published study | Wang et al. 2012 |
| humic acid/ water | Photolysis | 30 – 60 min | half-life/min | Published study | Wang et al. 2012 |
| silica gel | Photolysis | 75.9 min | half-life/min | Published study | Wang et al. 2012 |
| Air | Atmospheric oxidation | 4.47 daysb | half-life/days | Model | AOPWIN 2010a |
| Air | Ozone reaction | n/ac | n/ac | Model | AOPWIN 2010a |
| Water | Hydrolysis | n/ac | n/ac | Model | HYDROWIN 2010a |
a EPIsuite (2010-2012).
b AEROWIN (2010) predicts high fraction of DBDPE absorption to airborne particles (Phi = 1), therefore rate of DBDPE photolysis likely lower than predicted (i.e., half-life longer than predicted).
c Model does not provide an estimate for this type of structure.
8.2.2 Biodegradation
Laboratory tests have shown DBDPE is not likely to biodegrade quickly under aerobic conditions. A CITI (1991a) study measuring biodegradation by microorganisms found a range of 1–6 % biodegradation (mean of 2%) over 28 days in a ready-biodegradation test for DBDPE.
An inherent biodegradability study by Schaefer and Carpenter (2010) which followed the Concawe Test (OECD Draft Method 302D), found an average cumulative rate of 2.2% biodegradation after 90 days, indicating that DBDPE is not inherently biodegradable under aerobic conditions. The study indicates that test media were also analyzed for predicted degradation products (using radiolabeled test chambers), and reported no transformation products over the 90 day period, although the percent cut-off for identification was not reported.
The four ultimate biodegradation submodels (BIOWIN 2010; Catalogic 2012) predict that biodegradation is very slow or recalcitrant. In addition, a primary biodegradation model, BIOWIN Sub-model 4 (primary survey model), predicts that the substance is recalcitrant.
The existing data for anaerobic degradation of DBDPE suggests that if the substance degrades, it does so very slowly. An anaerobic biodegradation study that compared radiolabeled DBDPE in biotic and abiotic treatments of anaerobic digester sludge (initial dose of DBDPE 31 mg/L in THF), showed no mineralization or transformation over 63 days (Schaefer and Matthews 2011). Measurements of 14C activity at days 0, 30 and 63, as well as a mass-balance of compartments (solid sludge, extractable, and volatized), reported only the parent DBDPE. Earlier laboratory studies of analogue decaBDE (Gerecke et al. 2005, 2006) have also shown decaBDE to undergo slow anaerobically mediated reductive debromination, with a half-life of up to 700 days.
Recently, three studies examined aerobic and anaerobic DBDPE degradation and transformation in soils and sediments over a 6 month test period (Stenzel and Schaefer 2015a, 2015b, 2015c). These studies evaluated transformation of parent DBDPE from labelled radioactivity measurements over the study period, and reported maximum non-parent radioactivity (i.e. potential transformation product) increases from 1.6% to 9.9% in sediment and from 2.2% to 3.1% in soil (although non-parent radioactivity decreased in some soil tests). While the authors suggest the non-parent labelled radioactivity could be attributed to impurities and conclude that no transformation occurred (i.e. parent DBDPE greater than 91% at end of studies), impurities would not be expected to increase over the test period. Overall these new studies suggest that very limited DBDPE degradation, if any, occurred within the 6 month period of the studies.
In a further study, biotransformation of radiolabelled DBDPE was examined in aerobic soil systems for up to 60-61 days in a greenhouse environment with and without growing plants (2019 Albemarle Europe SPRL summary of information submitted under REACH as lead registrant and provided to Environment and Climate Change Canada in the context of the consultation on the Proposed amendments to the Prohibition of Certain Toxic Substances Regulations: 2018, unreferenced). In this study, four types of soil (sandy loam, loam, silt loam, loamy sand) and six plant species (radish, ryegrass, alfalfa, zucchini, corn and pumpkin) were used. The study found that DBDPE and nonaBDPE moved to a small extent into the roots of rye grass plants (nonaBDPE up to 0.10% of total amount of radioactivity and DBDPE up to 2.89% of the total amount of reactivity) and to a lower or comparable extent to the roots of the other plant species. DBDPE was the predominant analyte in root and soil samples based on HPLC/beta RAM analysis. No root to shoot movement of DBDPE or nonaBDPE was observed for all 6 plant species. The levels of nonaBDPE were either lower or statistically the same as those observed in the dose stock solution/dose mixture used in the tests. No hexa- to octaBDPEs were detected in any of the soil or plant samples, and overall, the study suggested that no DBDPE biodegradation occurred in soil and plant samples. In addition, no related debrominated congeners were identified based on non-target chemical analysis.
These aerobic and anaerobic biodegradation tests, as well as modelling results, indicate that the half-life in water is likely to be long, and that the substance is therefore likely to persist in water (Table 8-3). Using an extrapolation ratio of 1:1:4 for a water: soil: sediment biodegradation half-life (Boethling et al. 1995), DBDPE is expected to be persistent in soil and sediment, and thus is likely to present long-term exposures in these media.
| Medium | Fate process | Degradation value | Degradation endpoint / units | Methods | Reference |
|---|---|---|---|---|---|
| Activated sludge | Bio-degradation | 1- 6% (mean 2%) | 28-day Biodegradation BOD/% |
OECD 301C (Modified MITI I test) |
CITI 1991a |
| Mixture of pre-exposed sludge and soil | Enhanced aerobic Bio-degradation | 2.2% | 90-day aerobic Biodegradation IC/TOC/14C-activity |
OECD 302D (CONCAWE test) |
Schaefer and Carpenter 2010 |
| Anaerobic digester sludge | Biotic/ Abiotic Anaerobic mineralization | 0 (biotic) 0 (abiotic) | 63-day anaerobic mineralization /% |
OECD 314C (Anaerobic digester sludge) |
Schaefer and Matthews 2011 |
| Water | Primary Bio-degradation (aerobic) | 0.7743a “recalcitrant” |
NA | QSAR Model | BIOWIN 2010d |
| Water | Bio-degradation (aerobic) | -0.4568a “recalcitrant” |
NA | QSAR Model | BIOWIN 2010e |
| Water | Bio-degradation (aerobic) | -0.6209b “biodegrades slowly” |
NA | QSAR Model | BIOWIN 2010f |
| Water | Bio-degradation (aerobic) | 0.00b “biodegrades slowly” |
NA | QSAR Model | BIOWIN 2010g |
| Water | Bio-degradation (aerobic) | % BOD = 0.41c “biodegrades very slowly” |
ultimate half-life > 10 years | QSAR Model | Catalogic 2012 |
a Output is a numerical score from 0 to 5. NA=not applicable.
b Output is a probability score.
c Some uncertainty associated with model predictions, as substance is less than 60% (42%) covered by structural domain of model.
d Sub-model 4: Expert Survey (qualitative results).
e Sub-model 3: Expert Survey (qualitative results).
f Sub-model 5: MITI linear probability.
g Sub-model 6: MITI non-linear probability.
DBDPE appears to be moderately well covered by the biodegradation models used to estimate degradation. The number of fragments and molecular size covered by the domain of the BIOWIN Submodels 5 and 6 (aerobic biodegradation, MITI) suggest high coverage for DBDPE. The domain covered by BIOWIN Submodels 3 and 4 (aerobic biodegradation, Expert Survey) includes substances with fewer aromatic bromide fragments and smaller molecular weights than DBDPE; however, the degradation predictions are consistent with other modeled results and empirical data. There is some uncertainty associated with the CATALOGIC (2012) model predictions in that there is only 42% coverage of the DBDPE by the structural domain of the Catalogic model (greater than 60% structural coverage is recommended). However, given that the predicted results agree with other model predictions (BIOWIN submodels), and agree with the existing empirical data, it would suggest that the model is extrapolating correctly beyond interpolation space.
Modeling predictions and experimental data indicate very slow and/or limited biodegradation of DBDPE (ECCC, HC 2019). Catalogic model (2012) predictions indicate that when biodegradation occurs, while most of the substance stays as parent, there is a low probability of limited debromination under aerobic and anaerobic conditions, leading to nonaBDPEs and octaBDPEs, hydroxylated nonaBDPEs, and a form of brominated phenyl acid (ECCC, HC 2019).
Wei et al.(2012) measured two unknown brominated compounds in pond sediments near a DBDPE manufacturing plant in Arkansas, USA (a former WWTS biosolids pond), which were further identified as two nonabromodiphenyl ethanes (nonaBDPEs) when matched to photolytic debromination peaks in hexane. The nonaBDPE concentration increased towards the surface, with a ratio of 1.3 nona/DBDPE compared to ~0.7 nona/DBDPE in standards or other pond sediments. The increased nonaBDPE presence was attributed to DBDPE debromination in the upper sediment of one of the ponds. This pond also demonstrated PBDE debromination, which was attributed to a complex process likely involving physical and biological influences (ECCC, HC 2019).
Recently, very slow debromination of analogue decaBDE has been measured in sediment microcosms in a remote lake on the Canadian Shield under natural conditions over 1 month (Orihel et al. 2016). Although only a small loss of 13C-decaBDE was measured, octa- and nonaBDEs were formed from 13C-decaBDE in littoral and profundal sediments, and trace amounts of di- to heptaBDEs were detected in some samples. Degree of debromination was determined not to be influenced by light or dark conditions, although more nona- and octaBDEs were formed under oxic conditions than under anoxic conditions.
8.2.3 Metabolic biotransformation
Empirical metabolic biotransformation studies that discuss potential for DBDPE degradation pathways and transformation products are described in the Potential for Bioaccumulation section.
8.2.4 Combustion and pyrolysis
Thermal degradation for DBDPE in fires is identified as a potential source of degradation products. DBDPE may be susceptible to the formation of bromotoluenes, via cleavage of the ethane bridge (Eljarrat and Barceló 2011; Dirtu et al. 2014). Jakab et al. (2003) reported, under pyrolysis conditions, DBDPE in high-impact polystyrene (HIPS) samples, produces a relatively high yield of brominated toluenes including the major product pentabromotoluene (PBT) along with other lower brominated toluenes. This pathway differs from that of decaBDE, which can decompose to produce brominated dibenzofurans under pyrolysis conditions (Jakab et al. 2003); the formation of brominated dibenzofurans is not generally observed for DBDPE. Various industry reports were reviewed for analytical determinations of polybrominated di-benzo-p-dioxins (PBDDs) and dibenzofurans (PBDFs) in relation to DBDPE commercial products, and polymers containing DBDPE (2019 Albemarle Europe SPRL summary of information submitted under REACH as lead registrant and provided to Environment and Climate Change Canada in the context of the consultation on the Proposed amendments to the Prohibition of Certain Toxic Substances Regulations: 2018, unreferenced). The reports noted that thermal degradation and incineration of DBDPE results predominantly in polybrominated toluenes rather than PBDFs or PBDDs. The review concluded that the flame retardant, the polymer containing the flame retardant, and the polymer containing the flame retardant after simulated recycling did not contain PBDDs/PBDFs and were generally below the limits of quantification of the respective methods.
8.2.5 Persistence of transformation products
A summary of potential DBDPE transformation is found in the Supporting Information document (ECCC, HC 2019). Laboratory photodegradation studies (largely conducted with solvents) described in the section above report DBDPE debromination (Nadjia et al. 2014) to nona-, octa- and heptaBDPEs (Wang et al. 2012, Dirtu et al. 2014). Sediment studies have measured nonaBDPEs in the environment (Wei et al. 2012, He et al. 2012). Catalogic model (2012) predictions indicate that biodegradation may lead to limited debromination under aerobic and anaerobic conditions, leading to nonaBDPEs and octaBDPEs, hydroxylated nonaBDPEs, and a form of brominated phenyl acid. These predicted transformation products are expected to represent a minor fraction relative to parent DBDPE; however, they are similar to predicted/measured fractions of analogue decaBDE debromination products. Within the CPOPs model, the Bmax model (CPOPs 2012) uses rat metabolism data to predict DBDPE transformation to hydroxylated DBDPE and hydroxylated nonaBDPE. Considering DBDPE’s close analogue decaBDE, a substance that debrominates to lower brominated PBDEs (i.e., nonaBDEs through tetraBDEs) under specific conditions (e.g., photodegradation, aerobic biodegradation and metabolism) (Environment Canada 2010), it is reasonable to expect that DBDPE may also debrominate to lower BDPE transformation products (e.g., nona, octa, hepta-, hexa, and pentaBDPEs) following the pathway of debromination established for decaBDE (Appendix C, Table C-1).
Recently, three studies of aerobic and anaerobic DBDPE degradation and transformation in soils and sediments over a six month test period were conducted (Stenzel and Schaefer 2015a, 2015b, 2015c). These studies evaluated transformation of parent DBDPE from labelled radioactivity measurements over the study period, and reported maximum non-parent radioactivity (e.g. potential transformation product) increases ranging from 1.6% to 9.9% in sediment and from 2.2% to 3.1% in soil (although non-parent radioactivity decreased in some soil tests). The authors suggest the non-parent labelled radioactivity could be attributed to impurities; however, impurities would not be expected to increase over the test period. Other uncertainties with these studies relate to analytical difficulties for DBDPE measurements. Given that transformation product formation is expected to represent a small percentage of parent DBDPE, accurate measurement of DBDPE and non-parent concentrations is critical to understanding the transformation process. While these new studies suggest very limited, if any, DBDPE degradation occurs during the 6 month period of the studies (e.g. parent DBDPE remains greater than 91%), this result is not unexpected given the assessment estimates the half-life of DBDPE in soil and sediment to be in the range of many months to years, and transformation products are predicted to represent a small (but important) fraction relative to parent DBDPE.
Owing to the lack of experimental data on the transformation products, (Q)SAR modelling was conducted to assess their persistence, biodegradation and toxicity characteristics. See Appendix C for a description of transformation product (Q)SAR modeling and physical chemical properties (Table C-2).
To evaluate persistence of potential transformation products, a (Q)SAR-based degradation modelling approach was used. Results of BIOWIN (2010) sub-models suggest that all potential transformation products (nona- through pentaBDPEs, hydroxylated DBDPE and nonaBDPE, and brominated phenyl acids) demonstrate biodegradation is very slow or recalcitrant in water (Appendix C, Table C-3).
The predicted transformation products do not contain functional groups expected to undergo hydrolysis, with the exception of brominated phenyl acids, which are recognized to have acyl halides. HYDROWIN (2010) predicts acyl halides react readily with water to yield the parent acid and hydrogen halide, with a half-life less than 10 minutes (or faster) (Table C-3).
The predicted half-life for atmospheric degradation of nona- through pentaBDPEs, hydroxylated DBDPE and nonaBDPE because of their reaction with the hydroxyl radical ranges from ~2 days to greater than 4 days (12-hr day, AOPWIN 2010) (Table C-3). AOPWIN (2010) also identifies the brominated phenyl acids to undergo ozone reaction, and predicts a half-life of 79.3 days.
Therefore, considering all model results, there is evidence that the predicted degradation of the debrominated BDPEs (penta through nonaBDPEs) and hydroxylated nonaBDPE, is slow and that the substances are persistent in water and air. Using an extrapolation ratio of 1:1:4 for a water: soil: sediment biodegradation half-life (Boethling et al. 1995), it is expected that nona- through pentaBDPEs, hydroxylated DBDPE and nonaBDPE, and brominated phenyl acids are also very persistent in soil and sediment.
8.3 Potential for bioaccumulation
Properties of the substance (i.e., log Kow, log Koa, molecular size and cross-sectional diameters) as well as empirical data (bioconcentration factor (BCF), biomagnification factor (BMF), trophic magnification factor (TMF) and bioaccumulation factor (BAF)) were considered for evaluation of DBDPE bioaccumulation potential.
Kelly et al. (2004) demonstrated that the absorption of ingested chemical in fish (and other wildlife) decreases with increasing log Kow starting at ~ 7 to 7.5 because the diffusion of hydrophobic substances across an unstirred water layer to the luminal membrane (i.e., gastrointestinal tract) of an organism is rate limiting for substances like DBDPE which have very high log Kow and low water solubility. Although Arnot and Gobas (2003a, 2004, 2006) do state that the log Kow domain of their model ranges from 1-9, there is considered to be insufficient empirical field evidence (i.e., BAFs) to support model estimates beyond log Kow~ 8.2. Therefore, the log Kow of 9.89 for DBDPE is considered out of the model domain for the mass-balance three trophic level BCFBAF model (Arnot and Gobas 2003a) and the (Q)SAR based Dimitrov et al. (2005) model. Importantly, lack of empirical BCF and BAF data for chemicals with log Kow greater than 8.2 does not allow for benchmarking of predicted results. Consequently, bioaccumulation of DBDPE was not modelled in this assessment. However, empirical analogue decaBDE was considered in the discussion, owing to its similar structure and physical-chemical properties.
There has been some debate in the literature as to the bioaccumulation potential of DBDPE (Law et al. 2006, Wang et al. 2010, and Hardy et al. 2012). While DBDPE appears to be bioavailable to some organisms, the available evidence is equivocal with respect to higher bioaccumulation. On the basis of its physical and chemical properties (e.g., moderately large maximum diameter, very low water solubility, high log Kow), DBDPE is expected to have a low bioconcentration potential. Monitoring studies from many parts of the world have reported measurable DBDPE in aquatic and terrestrial organisms; however, there are also very high proportions on non-detects in biota studies (frequently greater than 50%) (ECCC, HC 2019). Data for field-based BMFs and BAFs are not consistent and have uncertainties to consider. Studies of DBDPE in rats and wildlife suggest that DBDPE may be bioavailable for uptake, and metabolism may occur in some species.
Therefore, while it appears that DBDPE may accumulate in the tissues of some organisms to some extent, at present there is not adequate evidence of potential for high bioaccumulation. Currently there are more lines of evidence to suggest that bioaccumulation potential of DBDPE is limited by low bioavailability and dietary assimilation efficiency (Kelly et al. 2004), steric uptake restriction and some metabolism.
With respect to possible DBDPE transformation products, this assessment provides preliminary modelling evidence to suggest that that hexaBDPE though nonaBDPEs may have potential for high bioaccumulation, and that the bioaccumulation potential will increase from nona to hexaBDPEs.
The evaluation of DBDPE bioaccumulation potential presented below considers empirical bioconcentration factor, biomagnification, trophic magnification, bioaccumulation factor, and metabolism data.
8.3.1 Bioconcentration factor (BCF)
Experimental BCF data for DBDPE exist from one study (BCF of less than 2.5 to 34 L/kg) (CITI 1991b). This study examined Japanese carp exposed for 8 weeks to DBDPE concentrations of 0.5 mg/L and 0.05 mg/L. While the study indicated that it met 1981 Good Laboratory Practice (GLP) standards, the exposure concentrations in the study greatly exceed DBDPE water solubility and dispersants were used and it is not certain that steady state conditions were reached in the test system.
Recent investigations relating fish BCF data and molecular size parameters (Dimitrov et al. 2005, Sakuratani et al. 2008) suggest that the probability of a molecule crossing gill cell membranes as a result of passive diffusion declines significantly with increasing maximum diameter (Dmax). On the basis of the BCFmax Model with Mitigating Factors (Dimitrov et al. 2005), the maximum diameter of DBDPE ranges from 1.4 to 1.7 nm. This suggests that DBDPE is likely to experience a reduced rate of uptake from steric effects at the gill surface allowing elimination processes to mitigate accumulation.
At a log Kow of 9.89 (Table 3-1), the predicted bioavailable fraction of DBDPE in the water column (excluding loss from volatilization) according to mass-balance fish models is 0.15% (BCFBAF v. 1.5), which indicates the majority of the chemical in the water column is not taken up at the gill surface.
8.3.2 Bioaccumulation factor (BAF)
Bioaccumulation factors are measured under field conditions as the ratio of the whole body of chemical concentrations taken up from all exposures to that of the ambient water concentrations. Measures of BAF are a preferred metric for assessing the bioaccumulation potential of substances because it incorporates all chemical exposures including the diet, which predominates for substances with log Kow of greater than ~4.0 (Arnot and Gobas 2003a).
A study summary (2019 Albemarle Europe SPRL summary of information submitted under REACH as lead registrant and provided to Environment and Climate Change Canada in the context of the consultation on the Proposed amendments to the Prohibition of Certain Toxic Substances Regulations: 2018, unreferenced) is available on a dietary exposure bioaccumulation test with bluegill (Lepomis macrochirus) using DBDPE (98.9% and 98.6% pure). This preliminary study was conducted for the purpose of dose range finding and to determine optimal conditions for the definitive study (underway). The study was conducted in accordance to OECD TG 305 and GLP, and included a positive control (2,2’,4,4’5,5’-hexachlorobiphenyl) and an assimilation control (chromium (III) oxide). The bluegill were exposed to a commercial diet treated at nominal DBDPE concentrations of 100 µg/g for 28 days, and 1000 µg/g for 56 days. Limited results are provided specifically on DBDPE; however, the researchers indicated that DBDPE had negligible absorption efficiency in the fish gastro-intestinal tract, and did not bioaccumulate in fish tissue. The steady-state BMF expressed on a lipid weight basis for the DBDPE in the low and high treatment groups were 0.0030 and 0.0010, respectively. The summary indicates that no DBDPE metabolites were formed in the gut.
A study conducted in the Dongjiang River (tributary of Pearl River) of China, where previous studies reported levels of PBDEs and DBDPE in sediments among the highest in the world, (He et al. 2012) compared DBDPE in water, sediment and fish muscle samples for Mud carp (Cirrhinus molitorella), Tilapia (Tilapia nilotica), and Plecostomus (Hypostomus plecostomus) (collected 2009 and 2010). The measured DBDPE concentrations were approximately one order of magnitude higher than the decaBDE concentrations in fish but not in sediment in the same study. Concentrations of DBDPE in water (dissolved) and fish muscle were used to estimate log BAF values, resulting in DBDPE logBAFs of 6.1 to 7.0, suggesting high bioaccumulation (Table 8-5). There are, however, limitations/uncertainties associated with this study. For instance, total DBDPE concentration (including particulates which could be ingested) may better represent a water exposure since dietary exposure is not discussed but could be very important. Also, the study had small water sample sizes, and water/fish samples were collected at varying times, which suggests that “steady state” was not achieved (Arnot et al. 2006).
8.3.3 Biomagnification factor (BMF)
BMF values describe the process in which the concentration of a chemical in an organism reaches a level that is higher than that in the organism’s diet, because of dietary absorption (Gobas and Morrison 2000). A BMF exceeding 1 indicates that biomagnification is potentially occurring, and may be considered an indicator of the potential for uptake and accumulation in biota. Table 8-4 presents empirical BMF data for DBDPE.
In a recent study in south China, DBDPE and decaBDE in common kingfishers (Alcedo atthis), a piscivorous bird, and their prey fish from an e-waste-recycling site were examined (Mo et al. 2012). BMFs were calculated as the ratios of lipid normalized concentrations in the muscle of kingfisher to mean lipid-based concentrations in prey fish. For DBDPE, BMFs ranged from 0.10 to 0.77, which suggests biomagnification was not occurring in the investigated feeding relationship. This contrasts with the study’s BMF values for decaBDE, which exceeded 1. In a similar study comparing DBDPE in kingfishers between the Dinghushan Biosphere Reserve and a reference site in South China, Mo et al. (2013) also reported BMF of less than1 for DBDPE from prey fish to kingfisher.
Another study in South China (She et al. 2013) examined a small herbivorous food chain (paddy soils to rice plant to apple snails) and found that although DBDPE concentrations were measureable in the paddy soils (14.7 ng/g dw) and rice plants (3.59 ng/g dw), it was non-detectable in the snail. A plant to soil concentration ratio of 0.20 was determined for DBDPE.
Law et al. (2006) examined potential DBDPE bio and trophic magnification in Lake Winnipeg, Canada. Samples of fish muscle tissue (six species), plankton, mussels, sediment and water were collected between 2000 and 2004. DBDPE was not detected in water, sediment, zooplankton, mussels or whitefish (Coregonus clupeaformis), but was detected in walleye (Stizostedion vitreum) (1.01 ng/g lw), emerald shiner (Notropis atherinoides) (0.30 ng/g lw), goldeye (Hiodon alosoides) (0.62 ng/g lw), white sucker (Catostomus commersoni) (0.08 ng/g lw), and burbot (Lota lota) (0.66 ng/g lw). Biomagnification factors (lipid weight corrected) for fish species with detectable concentrations of DBDPE in prey ranged from 0.2 to 9.2, with four of the five BMFs calculated as greater than 1. However, this study also suffers from a number of limitations including that concentrations of DBDPE were low and near the detection limit (0.1 µg/g), sample sizes were small and samples were collected at varying times, meaning that steady state cannot be assumed. Also, lipid concentrations were very low for some species; therefore lipid normalized data may have resulted in an over-estimation of the BMF (Environment Canada 2010).
| Test organism | Steady-state, kinetic and lipid normalized values (/kg) | Reference |
|---|---|---|
| Common kingfishers (Alcedo atthis)/prey fish | <1 | Mo et al. 2013 |
| Common kingfishers (Alcedo atthis)/prey fish | 0.10 to 0.77 (BMF<1) | Mo et al. 2012 |
| Walleye/emerald shiner | 3.0 | Law et al. 2006 |
| Walleye/white sucker | 9.2 | Law et al. 2006 |
| Walleye/goldeye | 1.6 | Law et al. 2006 |
| Burbot/emerald shiner | 2.0 | Law et al. 2006 |
| Whitefish/ emerald shiner | 0.2 | Law et al. 2006 |
The available biomagnification data are limited, and most studies do not provide kinetic data (e.g., dietary assimilation efficiency, elimination rates). Reported dietary assimilation efficiencies in fish for analogue decaBDE are low, and range from 0.02% to 0.5% (Kierkegaard et al. 1999, Stapleton et al. 2004, Wan et al. 2013). In a study establishing benchmarks of absorbable and non-absorbable compounds, DBDPE was detected in feces but not in fish, confirming that it was a suitable choice as the nonabsorbable benchmark (Xiao et al. 2013).
The combination of high log Kow and log Koa (9.89 and 14.45, respectively) suggests that DBDPE may have the potential to biomagnify in terrestrial food webs as suggested by Gobas et al. (2003) and Kelly et al. (2007). However, these partition coefficients do not account for physiological parameters such as metabolism. Kelly et al. (2004) discuss that diminished BMFs due to metabolic transformation are more common in birds and mammals compared to fish, because those organisms generally have a greater capacity to metabolize organic contaminants.
The available studies do not unequivocally suggest that the BMF of DBDPE exceeds 1. However, DBDPE dietary exposures still may contribute to individual body burdens, as well as DBDPE trophic transfer and accumulation in certain species and/or food webs.
8.3.4 Trophic magnification factor (TMF)
The TMF is a measure of the averaged biomagnification potential of a substance within a studied foodweb under field conditions, and is estimated by correlating the normalized substance concentrations in biota at different trophic levels.
Only one North American study was found that presented results for TMF of DBDPE in a pelagic foodweb (Law et al. 2006, see BMF section for study details). A TMF was determined for Lake Winnipeg as 2.7, suggesting trophic magnification was occurring. However, as described above, the uncertainties with this study are considered important and may result in an over-estimation of biomagnification and trophic magnification.
TMF estimates were reported by a Norwegian monitoring report (KLIF 2013) for both mainland and arctic areas. As TMFs were on the basis of representative samples from food webs rather than a true “food chain” (i.e., not a feeding relationship), the values are presented in the reports as estimates. Furthermore, the authors advise that study uncertainties should be considered: for example, tissue samples for organisms were collected from liver, plasma, and egg samples (rather than traditional muscle or fat), and as this influences turnover rate (i.e., the shorter turnover rate of these tissues reflects a shorter exposure period), biomagnification potential in the environment may not be accurately reflected. Despite these caveats, the TMF estimate (log transformed lipid weight) was 3.9 (r2=0.49) for DBDPE in the Arctic marine environment, from polar cod up to polar bear, and 14.5 (r2=0.23) for the mainland marine samples (cod to harbour seal), suggesting high trophic magnification.
8.3.5 Other bioaccumulation and metabolic transformation-related studies
Two single dose pharmacokinetic studies in rats demonstrated negligible to limited uptake after oral administration. A pharmacokinetic study (Black 2012) observed DBDPE has limited uptake by rats after a single dose in corn oil (100 mg/kg unlabeled plus 14C labeled DBDPE), and was not accumulated in tissues. Nearly all the administered radioactivity was recovered in feces (89.7%) and cage rinse (0.25%) after 168 h. In total, tissues sampled contained less than 0.02% of dose, suggesting that DBDPE was eliminated in feces rather than absorbed from the GI tract (see section 10.2 "Health Effects Assessment").
Wang et al. (2010) studied potential for DBDPE bioavailability to mammals (from 100 mg/kg bw/day of DBDPE (and decaBDE) in corn oil for 90 days) and investigated possible metabolites in DBDPE exposed rats compared to control rats. At least seven unknown bromine containing compounds were observed in the livers of DBDPE-exposed rats. However, none of these compounds matched the analytical retention time of DBDPE debromination products (hepta- through nonaBDPEs) identified during a concurrent photodegradation experiment (ECCC, HC 2019).The only two metabolic products with peaks strong enough to provide structural information were found mainly in liver and kidney, and were hypothesized to be a methyl sulfone (MeSO2)-nona-BDPE and an ethyl sulfone (EtSO2)-nona-BDPE. However, Banasik et al. (2010) argue the mass spectral data do not conform to the sulfone structures. Furthermore, the percentage of DBDPE uptake vs. transformation vs. elimination was not quantified in this study. See section 10.2 "Health Effects Assessment" for further details on this study.
The Bmax model of CPOPs (2012) uses rat metabolism data to predict DBDPE transformation products. Two transformation products were predicted: hydroxylated DBDPE and hydroxylated nonaBDPE.
McKinney et al. (2011a) compared oxidative and reductive debromination of DBDPE and other brominated flame retardants (including decaBDE) using an in vitro test of liver microsomes from arctic marine feeding mammals (polar bear, beluga whale, ringed seal and laboratory rat). Biotransformation assays were performed by incubating hepatic microsomes with either individual OFRs or a mixture of OFRs, and compared to controls (i.e., no enzyme activity). Generally, the microsomes of all specimens substantially depleted DBDPE (44 to 74% in the single OFR assays, and 27 to 59% in the OFR mixture assays, more than any of the PBDEs). The authors concluded simple debromination was not the primary pathway (no clear evidence for the formation of any debrominated DBDPE metabolites). Two likely nonaBDPEs were detected in assays and controls (which had no enzyme activity), possibly resulting from contamination and some metabolic debromination. Two phenolic metabolites were detected in polar bear liver microsomes, but only accounted for less than 20% of DBDPE depleted. In general, metabolites were not detected that could account for the degree of DBDPE (or decaBDE) depletion. The authors suggest this could be due to low/non-detectable concentrations of metabolites, the possibility of non-extractable metabolites, etc. An industry review of this study suggests that adsorption, rather than metabolism, is responsible for the DBDPE depletion (Hardy 2012).
Although a single exposure, in a study of dietary efficiency of chemicals by fish, DBDPE was selected as a “nonabsorbable benchmark”, where no absorption into the gastrointestinal tract was expected (Xiao et al. 2013). Study fish were fed a single meal of contaminated feed, and then analyzed for chemical distribution after 5 days. For all tests, DBDPE was detected in feces but not fish tissue.
A recent study of close analogue decaBDE (high purity) dietary exposure to kestrals (21 days) found that there was substance uptake and accumulation as well as degradation (debromination) to lower brominated PBDEs in vivo (Letcher et al. 2014). At the end of the 25-day exposure period, decaBDE in liver and fat of exposed birds was significantly greater than in control birds. NonaBDEs and octaBDEs were found in kestrel plasma, while heptaBDEs were identified in liver and fat. In vivo elimination was also observed: by day 25 of the elimination period, decaBDE in plasma was depleted by 82%.
These fish, rodent and wildlife studies provide variable and equivocal evidence of the degree of bioavailability and metabolism of DBDPE. Shorter-term and single-dose studies show DBDPE is excreted with only minimal uptake in fish and rodents. Other studies indicate DBDPE bioavailability (uptake) and potential metabolic transformation. Bioavailability and metabolic transformation potential for DBDPE may be species-specific, and vary with length of dietary exposure.
8.3.6 Predicted bioaccumulation potential of transformation products
As described in the persistence section, there is some evidence to suggest DBDPE may debrominate to transformation products. As there are no experimental data characterizing the bioaccumulation potential for potential DBDPE transformation products, these are subjected to (Q)SAR modelling. For predictions with the (Q)SAR model, the log Kow for predicted transformation products was estimated using the Experimental Value Adjustment (EVA) method on the basis of DBDPE (Appendix C, Table C-2). The resulting modelled log Kow values of 4.83 to 9.0 suggest that some of these substances have a moderate to high potential to bioaccumulate in aquatic biota.
The detailed results of the BCF and BAF modelling are given in Appendix C (Table C-4). Results vary widely; BCFBAF (Episuite 2000-2012) predicts most transformation products will have low to moderate bioconcentration, with estimated BCFs based on total water concentrations ranging from 3.2 to 3803 (linear regression method). BCF and BAF estimates for a middle trophic level fish representative of Canadian waters, corrected for potential biotransformation (predicted kM = 0.016 to 0.271 for 100 g fish at 15 ̊C), were 38.9 to 3510 (low to moderate BCF) and 738 to 176 000 (low to high BAF), respectively (Episuite 2010 to 2012). This modelling suggests that the transformation products with greatest potential for bioaccumulation are the hexaBDPE though octaBDPEs.
Modelled metabolic biotransformation rates (kM) for transformation products generally fall within the range of those predicted for parent DBDPE (BCFBAF (2010) kM = 0.006 /day for 100 g fish at 15 °C middle trophic level fish representative of Canadian waters, CPOPS kM= ~0.0209 /day), with the exception of the brominate phenyl acids. The kM values for octa and nonaBDPEs are also comparable to those measured and/or predicted for their octa- and nonaBDE counterparts (0.03 /day and 0.02, respectively, for 184 g fish, 15 ̊C) (Environment Canada 2010). The lower brominated BDPEs (penta-hepta) predicted kM values are higher than those reported for lower brominated PBDEs (Environment Canada 2010).
These results suggest high bioaccumulation potential for some DBDPE lower brominated transformation products, which is supported by research on the transformation products of the analogue decaBDE. However, it must be considered that there is uncertainty with these estimates (see Uncertainties section). In particular, at log Kow of greater than 8.2, the bioaccumulation estimates for hydroxylated nonaBDPE and hydroxylated DBDPE transformation products are outside of the dataset of the BCFBAF model, and results based on this extrapolation are less certain. It is noted that the BCF model estimates bioconcentration from water exposure, which may not be the dominant exposure pathway for DBDPE transformation products; therefore BAF estimates may better represent bioaccumulation potential for these substances. In addition, consideration of both the log Kow values (4.83 to 9.0) and log Koa values (8.61 to 17.27) suggests that at least some of these substances will have the potential to biomagnify in terrestrial food webs as a result of dietary exposure and low loss via exhalation. Owing to the lack of measured data for reliable input data, terrestrial biomagnification modelling was not undertaken in this assessment.
8.4 Summary of environmental fate
DBDPE is expected to be released to surface water from industrial sources primarily through wastewater. There may be a potential for migration of DBDPE from plastics to the atmosphere (dust and air) given that the substance is added to the polymer matrix and thus could leach to some extent. A strong tendency to sorb to the solid phase in various media (including suspended air particles) indicates that DBDPE will reside in biosolids, sediments, suspended air particles and be transferred to soil from dry deposition and application of biosolids to agricultural lands. Exposure to organisms directly via water is expected to be minimal. DBDPE’s high intrinsic persistence suggests that long-term exposures can be expected in sediment and soil with a potential for significant build-up in near-field environments from continuous emissions. Removal process from the environment would include sediment and soil burial, and potentially very slow degradation. DBDPE might be expected to undergo long-range transport in air and deposition to remote environments due to fine particle transport as has been evidenced with other hydrophobic flame retardants with high air particle sorption. Even with long-term exposure to DBDPE in terrestrial and aquatic environments, owing to the limited available literature, this substance is not expected to be highly bioavailable and thus tissue residue levels in organisms and migration in foodwebs is not expected to be significant. However, future bioaccumulation studies should be monitored.
Almost no data are available for potential DBDPE transformation products. However, the findings of this analysis are consistent with the concerns expressed in the 2010 Ecological State of the Science Report on Decabromodiphenyl Ether (Environment Canada 2010) in that DBDPE is expected to transform to lower brominated products in a manner similar to decaBDE. Predictions made from the (Q)SAR modelling suggests that expected transformation products of DBDPE are likely to be found and behave in the environment in a similar fashion to DBDPE itself (residing in solid phase in various media, long-term exposures expected in sediment and soil, possible long range transport in air due to fine particle transport); however, some also have a high potential to bioaccumulate in organisms, similar to analogous PBDEs.
9. Potential to cause ecological harm
9.1 Ecological effects assessment
Empirical data for DBDPE, as well as relevant comparative data for the structural analogue, decaBDE, were considered in the weight-of-evidence for assessing the ecological effects of DBDPE. (Q)SAR aquatic toxicity modelling for DBDPE was considered unreliable due to exceedance of log Kow cut-offs, or the substance being poorly covered by the toxicity training sets (ECCC, HC 2019).
Results from most empirical aquatic toxicity studies have high uncertainty, questionable reliability and/or results that are difficult to translate to the environment (e.g., use of solvents, WAF studies). Since the vast majority of DBDPE settles in soil or sediment compartments (e.g., bioavailable fraction of DBDPE in water is 0.15% (BCFBAF v. 1.5), water-based exposure is not considered an environmentally important pathway for exposure. For this reason, combined with the uncertainty of available aquatic toxicity data, no water (pelagic) critical toxicity value (CTV) or predicted no effects concentration (PNEC) are determined for DBDPE in this assessment. However, recent analogue decaBDE studies in aquatic environments suggest that molecular-level effects may occur in some species.
The results of sediment and soil chronic toxicity testing indicate that DBDPE appears to have the potential to cause effects at high exposure concentrations to reproduction of earthworms as well as plant survival and growth, while no effects were observed for sediment organisms. No overtly toxic effects were found in wildlife, although DBDPE may affect enzyme activity in some test species.
9.1.1 Empirical studies in water
Owing to the slow uptake kinetics of highly hydrophobic compounds, acute toxicity tests are expected to not allow enough time for a steady state to be established (Tolls et al. 2009; Mayer and Reichenberg 2006). For DBDPE, results from the available empirical aquatic toxicity studies have high uncertainty and/or have unclear results: for example, exceeding the water solubility or employing test methods difficult to translate to effects levels in the environment (e.g., WAF approach, solubilizer etc.).
In one study, Nakari and Huhtala (2010) found DBDPE effects on aquatic organisms are possible at low concentrations (e.g., DBDPE= 0.0063 to 0.025 mg/L), although the dose greatly exceeded DBDPE’s water solubility limit and solubilizers were used. In this study, DBDPE was shown to suppress hatching success of zebrafish eggs, while in rainbow trout and brown trout hepatocytes, DBDPE increased vitellogenin synthesis (a marker of estrogenic effects), inhibited CYP1-dependent monooxygenase activity, and increased the activity of UGT (Nakari and Huhtala 2010). Although there are some questions about the reliability of this study (e.g., concentration of solvent used, exceedance of water solubility), the results suggest aquatic effects may be possible in environments where solubilizer-like substances co-occur with DBDPE in water (e.g., cosolvation in waste effluents; dissolved organic carbon interactions, surfactant interactions); or possibly where very long-term exposure allows steady state conditions to establish.
Based on information in a study summary (2019 Albemarle Europe SPRL summary of information submitted under REACH as lead registrant and provided to Environment and Climate Change Canada in the context of the consultation on the Proposed amendments to the Prohibition of Certain Toxic Substances Regulations: 2018, unreferenced), Daphnia magna were exposed to radiolabelled DBDPE under flow-through conditions for 21 days following OECD TG 211 and GLP. The study included both solvent (dimethylformamide) and dilution water treatment controls, and two mean measured treatment concentrations of 0.000256 and 0.000356 mg/L. The study found no statistically significant treatment-related effects on survival, reproduction and growth at either treatment concentration. The study NOEC was identified as 0.000356 mg/L, while the LOEC was identified as greater than 0.000356 mg/L.
Analogue decaBDE also has limited water solubility and early hazard assessments suggested that significant acute or chronic toxic effects were not likely to occur in aquatic organisms at concentrations under water solubility (e.g., EC 2006; Environment Agency 2007). However, recent aquatic toxicity studies of the substance have reported effects on aquatic organisms, fish and amphibians, such as effects on growth, reproduction, development, thyroid hormone disruption, and neurobehavioural alterations after exposure to low level decaBDE (Kuo et al. 2010, He et al. 2011, Noyes et al. 2011, Qin et al. 2012, ECHA 2012). The lowest aquatic NOEC for exposure via water is reported below 0.001 mg/L for delayed metamorphosis in amphibians (Qin 2010, see also ECHA 2012a). DecaBDE exposure to fish via diet (feeding studies) with fathead minnows conducted at environmentally relevant concentrations showed that the substance may interfere with the thyroid hormone system in juvenile fish (Noyes 2011, Noyes 2013). Some questions regarding the above studies include methodological problems in quantifying decaBDE effects in the range of water solubility, non-GLP studies, etc. As well, it cannot be excluded that PBDE congeners other than decaBDE may have contributed to the effects reported (i.e., debromination products observed in these studies include nona-, octa-, hepta-, hexa- and pentaBDEs (ECHA 2012)). Nonetheless, these studies raise concern for potentially serious toxicological effects for decaBDE, and by analogy, DBDPE.
Within the OECD QSAR Toolbox (2012) profile, DBDPE is classified as base surface narcotic/neutral organic for aquatic toxicity by OASIS (v 1.2) and ECOSAR; however, aquatic classification by Verhaar (Modified) reports DBDPE as Class 4 (compounds and groups of compounds acting by a specific mechanism). As well, protein binding alerts are also identified (OASIS v.1.2, OECD).
Mayer and Reichenberg 2006 have shown evidence for a melting point “cut-off” of about 210 °C above which a chemical with only a baseline narcosis mode of action cannot exert acute lethal toxicity through aqueous exposures, i.e., LC50s. Given that observed sub-lethal effects require exposure levels well above chemical solubility limits, the weight of evidence suggests that DBDPE is probably a baseline toxicant and that aqueous-based exposures alone are not capable of exerting a lethal effect to organisms in aquatic environments. While exposure-based modelling using critical body residues (CBR) may provide insights into the potential for adverse effects (sub-lethal) as a result of combined environmental and dietary exposures, due to uncertainty in BAF estimates, a CBR analysis was not conducted.
See the Supporting Information (ECCC, HC 2019) for a review of existing aquatic toxicity studies.
9.1.2 Empirical studies in sediment
Sediment organism toxicity tests have been performed with chironomids (Chironomus riparius) and oligochaetes (Lumbriculus variegates) (Krueger et al. 2003a, b; Hardy et al. 2012) (Table 9-1). Chironomids (midge) were exposed to DBDPE in sediment with overlying water over 28 days under static conditions. For oligochaete tests, 10 oligochaetes per test concentration were exposed to DBDPE for 28 days under flow-through conditions. In both studies, potential effects were noted, but endpoints did not show a significant effect. Therefore, EC50 values and NOECs for all measured endpoints were reported to be above the highest concentration level of greater than 5000 mg/kg for both the chironomid and oligochaete studies. As the test sediment contained 1.8% organic carbon, the maximum ‘solubility’ (ECCC, HC 2019)) of DBDPE in sediment was 52.9 mg/kg dw. The sediment solubility limit, therefore, may have been exceeded under the conditions of the study, although no adverse effects were observed in the test organisms.
| Test organism | Test type | Endpoint | Value (mg/kg dry weight (dw)) | Reference |
|---|---|---|---|---|
Midge (Chironomus riparius) |
Prolonged sediment toxicity: survival, emergence and development | 28d EC50 LOEC NOEC |
>5000 >5000 5000 |
Krueger et al. 2003a, Hardy et al. 2012 |
Oligochaete (Lumbriculus variegates) |
Prolonged sediment toxicity: survivorship and growth | 28d EC50 LOEC NOEC |
>5000 >5000 >5000 |
Krueger et al. 2003b, Hardy et al. 2012 |
Abbreviations: EC, effective concentration; LOEC, lowest-observed effect concentration; NOEC, no-observed effect concentration
As with aquatic toxicity, a recent sediment toxicity study with analogue decaBDE reported effects on fish larvae in sediment (behaviour and neurological pathway expression) at lower sediment concentrations than previously determined (12.5 mg/kg) (Garcia Reyero 2014), suggesting toxicological effects from low levels of DBDPE are a possibility if a similar mode of action is determined.
A CTV of 5000 mg/kg (greater than 5000 mg/kg) is selected for DBDPE in sediment, representing the only DBDPE toxicity endpoint available, although this value is unbounded with no effects observed at this concentration. Owing to the uncertainty in inter/intra species variation for a chronic test, an assessment factor of 10 is applied. The resulting PNEC is 500 mg/kg dw. When this value is adjusted from test organic carbon content (1.8%) to standard sediment organic carbon content (3%) (Webster et al. 2004), the PNEC for sediment organisms is 833 mg/kg dw.
9.1.3 Empirical studies in soil
Terrestrial soil toxicity tests were undertaken with wastewater and soil bacteria, earthworms, and plants (Hardy et al. 2011) (Table 9-2). In the earthworm (Eisenia fetida), survival (28 day) and reproduction (56 day) were not impacted (NOEC and EC50 greater than 3720 mg/kg), but reproduction by day 56 was affected at the highest test concentration (reproduction reduced 60%). DBDPE concentrations showed a substantial decrease in the soil in all test groups, ranging from a 17 to 40% decrease, exceeding the 20% typically accepted as a stable testing environment. However, given that effects are still noted, it is likely that effects would have remained the same or be more pronounced with stable concentrations.
The effects of DBDPE on terrestrial plant seedling emergence and growth were evaluated by Hardy et al. (2011) in a 21-day study. Corn (Zea mays), onion (Allium cepa) and ryegrass (Lolium perenne) represented monocotyledons, while cucumber (Cucumis sativa), soybean (Glycine max) and tomato (Lycopersicon esculentum) represented the dicotyledons. No adverse effects on any endpoint were reported for corn, ryegrass or soybean, resulting in EC25 values greater than 6250 mg/kg. Cucumber’s group mean survival was reduced by 18% at the highest test concentration (LOEC =6250, NOEC=3125 mg/kg). Reductions in onion plant mean height of 22% and 24% and weight reductions of 32% and 30% respectively, were observed at the two highest concentrations (LOEC=3125, NOEC=1563 mg/kg). Effects on height and weight of tomato at the highest concentration of DBDPE resulted in reductions of 37% and 40% compared to the controls (LOEC=6250, NOEC=3125 mg/kg). An EC25 for onion was reported as 2440 mg/kg.
As the test soil for this latter study contained 2.7% OC, the maximum ‘solubility’ of DBDPE was 79.4 mg/kg dw (Supporting Information document: ECCC, HC 2019). Therefore, the soil solubility limit may have been exceeded under the conditions of the study. This suggests that free DBDPE may have been present in the test system and may have contributed to the observed effects through factors such as the physical clogging of respiratory surfaces.
| Test organism | Test type | Endpoint | Value (mg/kg dw) | Reference |
|---|---|---|---|---|
| Earthworms (Eisenia fetida) | 28-day Survival | LC50 | >3720 | Aufderheide 2003 |
| Earthworms (Eisenia fetida) | 56-day Reproduction | EC10 EC50 LOEC NOEC |
1860 3180 3720 (reproduction reduced 60%) 1910 |
Aufderheide 2003 |
Plants: Monocoty-ledons Onion (Allium cepa) |
21-day Survival / Reproduction | LOEC NOEC EC25 |
3091 (3125 nominal) 1722 (1563 nominal) 2440 (22% and 24% height reduction at 3125, 32% and 30% weight reduction at 6250 respectively) |
Porch and Krueger 2005 |
Plants: Dicotyledons Tomato (Lycopersicon esculentum) |
21-day Survival / Reproduction | LOEC NOEC EC25 |
6076 (6250 nominal) 2677 (3125 nominal) 4990 (37% height reduction and 40% weight reduction at 6250) |
Porch and Krueger 2005 |
Abbreviations: LC, lethal concentration; EC, effective concentration; LOEC, lowest-observed effect concentration; NOEC, no-observed effect concentration
On the basis of the endpoints from a range of soil toxicity studies (soil bacteria, earthworms, and six plant species), the lowest concentration at which a clear effect was determined is the EC10 value for earthworm reproduction of 1860 mg/kg DBDPE in soil and the EC25 for decreased onion weight of 2440 mg/kg (onion NOEC = 1563 mg/kg, but low EC values are preferred over NOEC values). The EC25 value is considered a clear, measurable effect (i.e., the EC10 value is close to a ‘no-effect’ value), therefore for the purposes of this assessment, the value of 2440 mg/kg is selected as the CTV. On the basis of inter/intra species variation for a chronic test and the uncertainty in exposure time needed for DBDPE, a total assessment factor of 10 is applied, and the resulting PNEC is 244 mg/kg dry soil. When this value is adjusted from test organic carbon content (0.027) to standard soil 2% organic carbon content (ECHA 2010), the PNEC for soil organisms is 180.7 mg/kg dry soil.
9.1.4 Empirical studies in wildlife
There are limited DBDPE studies relevant to wildlife. Standard mammalian (rodent) repeated dose toxicity studies conducted with DBDPE have generally shown No Observed Adverse Effect Levels (NOAEL) at the highest dose tested: 1000 mg/kg bw/day (90 day rat study), and 1250 mg/kg bw/day (rat and rabbit pre-natal) (Margitich 1992, Hardy et al. 2002, 2010, and 2011). Wang et al. (2010) reported a Lowest Observed Effect Level (LOEL) of 100 mg/kg bw/day on the basis of significant increase in serum thyroid hormone triiodothyronine (T3) levels at this dose level in Male Sprague-Dawley rats (6 per treatment, orally administrated 100 mg/kg bw/day of DBDPE in corn oil for 90 days). See section 10.2 "Health Effects Assessment" for detailed analysis of rodent toxicity studies.
Egloff et al. (2011) conducted a study of combined in vitro/in ovo approach to determine concentration-dependent effects on overt toxicity and hepatic messenger RNA (mRNA) expression levels of 11 transcripts in primary cultures of chicken embryonic hepatocytes. DBDPE was added at the following concentrations: 0.001, 0.003, 0.01, 0.03, 0.1, 0.2 μM DBDPE (concentrations exceeding those reported in wildlife) (n= 3 replicates per treatment group) and incubated for 36 hours. Hepatocyte viability was not affected by DBDPE (or any BFR). DBDPE induced CYP1A 4/5 by 29 and 59 fold at 0.2 uM.
The existing mammalian and avian studies suggest that although DBDPE may be bioavailable to wildlife, it is not overtly hazardous (no effects at highest dose), and organisms may show indication of potential to metabolize DBDPE. However, the recent molecular-level studies (avian and fish) suggest DBDPE may affect enzyme activity levels in test species.
CTV in wildlife estimates of 754 and 458 mg/kg bw/day were determined from a wildlife Toxicity Reference Value (TRV) approach (Sample et al. 1996), where effects in rats were normalized to a typical body weight of mink (Mustela vison) and river otter (Lontra canadensis) respectively, which are representative wildlife species (ECCC, HC 2019). A NOAEL of 1000 mg/kg bw/day, determined from a 90-day oral sub-chronic toxicity study in rats (Margitich 1992), was selected from a range of laboratory rodents tests for the derivation of the CTV and TRV (see Section 10.2.1). An assessment factor of 10 was applied to the CTV to account for extrapolation from a subchronic no-effect value to a chronic no-effect value. The resulting TRV was 75.4 and 45.8 mg/kg food bw day for mink and river otter, respectively.
9.1.5 Ecological effects of transformation products
Modelled aquatic toxicity predictions were undertaken for possible DBDPE transformation products (Appendix C, Table C-5). Similar to DBDPE, the pelagic environment is unlikely to be the most important route of exposure for the very hydrophobic higher brominated BDPEs (e.g., octa and nonaBDPEs, and hydroxylated nona and DBDPEs), but currently represents the only toxicity data for potential transformation products and therefore serve as a coarse level of screening. ECOSAR (2012) classifies the penta- through nonaBDPEs as neutral organics, on the basis of chemical structure. Two potential transformation products predicted by Catalogic (2012) include hydroxylated nonaBDPEs (classified as phenols) and the brominated phenyl acids (classified as halo acids, vinyl/allyl halides-acid and neutral organics). The hydroxylated DBDPE transformation product predicted by the rat metabolism (CPOPS 2012) was classified as a benzyl alcohol in addition to neutral organic. In general, most groups of predicted transformation products were estimated to have toxic chronic effects at very low concentrations much less than1 mg/L) for at least some endpoints, representing a concern if the substances form in the environment. NonaBDPEs, octaBDPEs and hydroxylated nonaBDPEs were estimated to have no effects at saturation due to very low water solubility and high log Kow (greater than 8).
Considering that potential transformation products are expected to be more bioavailable and likely more bioaccumulative than parent DBDPE, the predicted aquatic toxicity at low concentrations should be considered, despite model uncertainty. With no empirical toxicity data to evaluate for lower brominated BDPEs, data from analogue decaBDE are also considered, which support that potential transformation products could be inherently toxic (e.g., tetra through hexaBDEs) (EC 2006).
9.2 Ecological exposure assessment
While measured DBDPE concentrations in the environment have been presented, limited data concerning the concentrations of DBDPE in water in Canada have been identified. Therefore, environmental concentrations have been estimated from available Canadian information, including estimated substance quantities, estimated release rates, and characteristics of the receiving environment. Environmental concentrations have been estimated for industrial release scenarios, as described below.
9.2.1 Industrial exposure scenarios and predicted environmental concentrations
Aquatic exposure to DBDPE is expected if the substance is released from industry (e.g., formulation) either directly to receiving surface water or to a wastewater treatment system that discharges its effluent to a receiving surface water body. The concentration of the substance in the receiving water near the discharge point of the wastewater system is used as the predicted environmental concentration (PEC) in evaluating the aquatic risk (e.g., to water and/or sediment) of the substance. It can be calculated using the equation:
PEC = [1000 x Q x L x (1-R)] / N x F x D
Where
PEC: aquatic concentration resulting from industrial releases, mg/L
Q: total substance quantity used annually at an industrial site, kg/yr
L: loss to wastewater, fraction
R: wastewater system removal rate, fraction
N: number of annual release days, d/yr
F: wastewater system effluent flow, m3/d
D: receiving water dilution factor, dimensionless
As DBDPE is used by industrial facilities and is expected to be released to water, several conservative aquatic industrial release scenarios were developed to cover a range of different potential industrial activities in Canada. The scenarios include rubber compounders, plastic compounders, plastic injection molders, plastic extrusion facilities, textile backcoating facilities and other facilities using DBDPE for unspecified industrial activities (ECCC, HC 2019) for descriptions of industrial scenarios). Information from the different facilities considered was collected and scenarios reflected expected practices and conditions, including type of wastewater treatment, direct or indirect releases to the receiving media, and receiving environment.
Table 9-3 presents the range of inputs used to estimate resulting aquatic concentrations close to the industrial point of discharge. On the basis of these assumptions, these industrial scenarios yield total predicted environmental aquatic concentrations (PECs) of 3.0 x 10ˉ7 to 2.1 x 10⁻³ mg/L. These PEC values represent the total DBDPE concentrations (particle associated and dissolved) in the receiving water near the point of the discharge at each site, and in cases these exceed the water solubility of DBDPE (i.e., dissolved DBDPE limit) by 1 to greater than 2 orders of magnitude. The highest PECs result from industrial scenarios associated with high releases which are also uncertain (e.g., typically textile or unspecified industries), and therefore are considered more conservative.
| Input | Value | Justification and reference |
|---|---|---|
| Quantity used per site (kg) | 1000 to 1 000 000 | Section 71 survey or New Substances Notification |
| Loss to wastewater (%) | 0.001 to 1.0 | OECD 2004, 2009 |
| Wastewater system removal efficiency (%) | 0, 59.7, or 94 | Predicted for no treatment, primary treatment, secondary treatment |
| Number of annual release days (days) | 250 or 350 | EC standard assumption for continuous releases or NPRI data |
| Wastewater system effluent flow (m3/d) | 2900 to 400 000 | Site specific wastewater system data |
| Dilution factor (–) | 1 to 10 | Site specific wastewater system flow rate/ receiving environment flow rate. When a dilution factor was greater than 10, a maximum default value of 10 was used. |
In addition to modelled industrial releases of DBDPE, effluent and biosolids monitoring data from 20 Canadian WWTS (encompassing lagoon, primary, secondary, and advanced liquid treatment processes) were considered in the exposure analysis (Kim et al. 2014). Predicted aquatic environmental concentrations (PECs) derived from measured effluent DBDPE ranged from 7.8 x 10⁻⁸ to 1.4 x 10⁻⁶ mg/L for total DBDPE (dissolved and particle associated).
An equilibrium sediment-water partition approach was used to estimate the concentration of DBDPE in bottom sediment. This approach is based on a partitioning principle described by the European Chemicals Agency (ECHA 2010) and incorporates two additional calculation methods. The first method is to estimate the substance’s concentration in the aqueous phase (dissolved) of the overlying water from its total concentration, according to studies by Gobas (2007 and 2010). The second method is to estimate a substance’s concentration in bottom sediment from its concentration in the aqueous phase of the overlying water on the basis of an equilibrium partitioning assumption between bottom sediment and overlying water described by the USEPA’s National Center for Environmental Assessment (USEPA 2003). At equilibrium, the predicted environmental concentration (PEC) in bottom sediment can linearly correlate with the concentration in the aqueous phase of the overlying water. Sediment exposure scenarios were developed using aquatic PECs from the industrial aquatic release scenarios, as well as PECs from WWTS monitoring across Canada described above, to determine equilibrium sediment PECs, standardized to 3% organic carbon (typical organic carbon content in bottom sediment for rivers and lakes). The resulting PEC values in bottom sediment ranged from 3.34 x 10⁻⁴ to 8.78 mg/kg dw.
An approach described by the ECHA (2010) was used to estimate predicted environmental concentrations in soil (soil PECs) resulting from the land application of wastewater biosolids. This approach employed the quantity of biosolids accumulated within the top 20-cm layer (ploughing depth) of soil over 10 consecutive years as the basis for soil PECs. One underlying assumption of the approach was that substances were subject to no loss due to degradation, volatilization, and leaching and soil run-off upon their entry into soil via biosolids land application. This assumption, therefore, yielded conservative soil PECs. Soil exposure scenarios were developed as an extension of the aquatic release scenarios described above, using wastewater biosolids concentration and production rates from site specific wastewater treatment plants. The estimated concentration in biosolids ranged from 0.1 mg/kg dw to 730 mg/kg dw. Soil PECs were standardized to 2% organic carbon (ECHA 2010), and for application over 10 years (20 cm), and the resulting PEC values ranged from 0.00046 to 25.3 mg/kg dw.
9.2.2 Exposure scenario for products available to consumers and predicted environmental concentrations
In addition to industrial sources of DBDPE, commercial products or products available to consumers represent a potential source of DBDPE to the environment, through both volatilization and particulates from abrasion (ECB 2004). The presence of DBDPE in dust samples (see Human Health section) and wastewater treatment plant media (influent, effluent, and wastewater biosolids) (Ricklund et al. 2008, Kolic et al. 2009, Davis et al. 2012, Kim et al. 2014), support that the substance can be released from products available to consumers (Davis et al. 2012, Melymuk et al. 2014), although there is minimal literature quantifying such releases. While service life release rates from commercial products or products available to consumers were not found for DBDPE, a study by Kemmlein et al. (2003) determined specific emission rates (SER) of 0.3 ng/m2/h for decaBDE (from the Commercial OctaBDE mixture) during a 105-day test of television set housing (23 °C). OECD (2009) identifies potential volatility to atmosphere from service life for generic OFRs in plastics, estimated at 0.05% over lifetime for indoor or outdoor use; however, this generic value may be an overestimate for a very low volatility OFR like DBDPE. Environmental release of the substance from plastic polymers via leaching is considered possible, albeit low. .The potential release of OFRs from plastics during service life to water is estimated at 0.05% over lifetime if the substance is for indoor use or 0.16% over service life for outdoor use (OECD 2009). The large majority of DBDPE containing products would be enclosed or used for indoor use; the release rate of 0.05% is therefore most applicable and may likely be an overestimate since contact with water is not expected.
Owing to the lack of data on DBDPE, current research on decaBDE release from products was examined to investigate DBDPE behaviour. According to the measurements in Toronto, Canada, Melymuk et al. (2014) have proposed a typical pathway of urban PBDE release as follows:
- release from products available to consumers to the indoor environment (e.g. by volatilization, for and abrasion of product containing flame retardant substance), then transportation (of dust) to the outdoor environment;
- deposition on surfaces; and
- wash-off to storm water (e.g., WWTS and tributaries).
Examination of decaBDE loadings to Lake Ontario from Toronto determined that approximately 30% of total loading was via WWTS sources, approximately 60% via tributaries, and less than 8% via air deposition (wet and dry particle) (Melymuk et al. 2014). Assuming a similar pathway for DBDPE release from products, available measured concentrations in water, sediment and biosolids (Kim et al. 2014) are well below those estimated by the exposure scenarios from industrial uses, and thus, existing scenarios appear adequately protective of additional, potential releases from commercial products and products available to consumers.
Various mechanisms for OFR transfer from products available to consumers to dust have been proposed (Toms et al. 2011). In one study, clothing, and the dust entrapped with it, has been proposed as an important source of additive flame retardants, including DBDPE to wastewater treatment systems via cleaning and laundering activities (Schreder and La Guardia 2014, Melmyuk et al. 2014).
Schreder and La Guardia (2014) measured the mean concentration of DBDPE in residential dust and laundry wastewater sampled from 20 homes in the northwestern United States between 2011 and 2012. The mean concentration of DBDPE in the laundry wastewater was measured as 24.5 ng/L. It is noted that the concentration of DBDPE in laundry wastewater is slightly above the modeled water solubility, but may reflect a total concentration. The authors also measured the influent and effluent concentrations of DBDPE at two wastewater treatment plants serving these homes. These plants receive over 80% of their input from households, with no known flame retardant discharges from the remaining industrial contribution. Using the proportion of influent expected from laundry wastewater and the proportion of influent expected from households, the authors determined that laundry wastewater may be a primary source of these flame retardants to the wastewater treatment plants (Schreder and La Guardia 2014).
Laundry wastewater data from the northwestern United States from the Schreder and La Guardia study (2014) is considered sufficiently representative to construct an exposure scenario relevant to Canada for laundry wastewater, as a route to the environment for DBDPE released from products available to consumers. ECCC indicates that the average domestic water use is 343 L/day/Canadian, while 20% of the water is used for laundry (Environment Canada 2013). These values, multiplied by 365 days/year, 35,540,400 Canadians, and the mean concentrations of DBDPE in laundry wastewater reported above give an annual national release of 21.8 kg/year for DBDPE (Schreder and La Guardia 2014, Statistics Canada 2014).
Overall, releases from products available to consumers are expected to be geographically dispersed and spread out over the duration of the service life and end-of-life stages. The low release rate of 21.8 kg/year, dispersed across Canada, suggests the potential for exposure to DBDPE from laundry wastewater is lower than potential for exposure from industrial sources. Therefore, the exposure scenarios from industrial uses presented above, appear adequately protective of potential releases from this laundry wastewater source.
While the laundry scenario presented above may address a major source of release to the environment during service life of products available to consumers, there is an absence of data to quantitatively address solid waste disposal of dust and end-of-life releases from all manufactured items, including non-residential sources. For example, seepage water from a metal recycling site in Norway reported a DBDPE average concentration of 80 ng/L, although DBDPE was not detected in seepage water from a municipal landfill in the same study (Nyholm et al. 2013).
9.2.3 Exposure of degradation products
As is common for ‘emerging’ chemical substances and their transformation products, there is a data gap with respect to DBDPE transformation product presence in the environment; possibly because of a lack of established analytical methods to detect, identify, and quantify transformation products in environmental matrices (Dirtu et al. 2014, Lambropoulou and Nollet 2014). With limited empirical data for potential DBDPE transformation products, methods to estimate the potential exposure of such substances in the environment are limited. The quantity of transformation products is assumed to be less than the reported volumes for parent DBDPE. Using CPOPs (2012) generated molar ratios of predicted DBDPE transformation products relative to DBDPE, depending on the transformation pathway, ratios of initial transformation products produced could range from 3 to 6% of DBDPE (formation of nonaBDPE or hydroxylated nonaBDPE via aerobic biodegradation), to 31 to 56% of DBDPE (hydroxylated DBDPE and hydroxylated nona BDPE predicted for in vivo rat metabolism products). Latter molar ratios for in vivo rat metabolism suggest that a third to half of parent DBDPE bioavailable to organisms could be transformed, which could have implications for wildlife exposure. However, the evidence presented suggests that only a small fraction of DBDPE will be bioavailable (see bioaccumulation section), thereby limiting wildlife exposure to such biotransformation products. Molar ratios for aerobic biodegradation may be most relevant for DBDPE found in soil and possibly sediment or wastewater /biosolids. A small ratio (3 to 6%) is attributed to these transformation products relative to the parent DBDPE; however, similar to their parent, models suggest some transformation products could be persistent, and therefore, build-up in the environment over extended periods of time. This predicted ratio (3 to 6%) is in the range of possible DBDPE transformation product (i.e. non-parent substance) reported in a 6 month DBDPE transformation study using labelled radioactivity measurements (e.g. average non-parent radioactivity increased from 1.6% to 9.9% (max) in sediment and from 2.2% to 3.1% in soil, noting possible impurities), despite the study length being shorter than predicted DBDPE biodegradation half-life (Stenzel and Schaefer 2015a, 2015b, 2015c). Furthermore, this percentage of transformation is similar to measured decaBDE debromination in sediment microcosms over a one-month period ([13C]decaBDE decreased by up to 3.5%, as a percent of total PBDEs) (Orihel et al. 2016), as well as predicted decaBDE transformation using CPOPS (2012). The molar ratio of lower brominated BDPEs (i.e., octaBDPEs and lower) is predicted to be less than 1% relative to parent. Therefore, while it appears, on the basis of predictive degradation pathway molar ratios, that transformation products are expected to represent a minor fraction relative to parent DBDPE, they are a similar fraction to those predicted/measured for analogue decaBDE. Furthermore, if DBDPE levels in the environment continue to increase, the pool of potential transformation products would also be expected to increase in importance.
9.3 Characterization of ecological risk
9.3.1 Risk quotient analysis
A risk quotient analysis, integrating conservative estimates of exposure with toxicity information, was performed for the sediment and soil media, as well as for wildlife, to determine whether there is potential for ecological harm in Canada. A risk quotient analysis was not conducted for the pelagic aquatic environment due to low relevance and unreliable toxicity data.
The site-specific industrial scenarios (considering the actual receiving water bodies) presented above yielded predicted environmental concentrations (PEC) from 7.8 x 10⁻⁸ mg/L to 2.1 x 10⁻³ mg/L (total DBDPE). These PEC values represent the level of exposure in the receiving water near the point of the discharge. Using aquatic PECs in water to determine equilibrium sediment PECs, standardized to 3% OC, the resulting sediment PEC values ranged from 3.34 x 10⁻⁴ to 8.78 mg/kg dw . A predicted no-effect concentration (PNEC) was derived from the chronic sediment organism toxicity values to give a value of 833 mg/ kg dw (see Ecological Effects Assessment section). The resulting risk quotient (PEC/PNEC) is 1.76 x 10⁻⁷ to 0.011. Therefore harm to sediment organisms is unlikely for these industrial scenarios, within greater than 1000-fold margin of error.
Predicted soil PECs resulting from the land application of wastewater biosolids to land (standardized to 2% OC) ranged from 0.00046 to 25.3 mg/kg dw. The PNEC for soil organisms is calculated as 180.7 mg/kg dw (See Ecological Effects Assessment section). The resulting risk quotient (PEC/PNEC) is 2.5 x 10⁻⁶ to 0.14. Therefore harm to soil organisms is unlikely at these sites, within 10 fold margin of error.
A wildlife TDI was derived from a Total Daily Intake (TDI) for mink (Mustela vison) and river otter (Lontra canadensis) consuming fish following the approach of US EPA (1993). In calculating TDI, a northern pike liver tissue concentration (Ci) of 0.00378 mg/kw (ww) was selected and equated to whole body concentration as a conservative assumption. This value represented the highest published concentration of DBDPE in Canadian biota (Houde et al. 2014), resulting in a TDI of 0.0007 (otter) to 0.002 (mink) mg/kg bw/day See ECCC, HC 2019) for details of TDI model inputs). The derived TRV was 75.4 (mink) and 45.8 (otter) mg/kg bw/day (see Ecological Effects Assessment section). The resulting risk quotient results (TDI/TRV) are 9.48 x 10⁻⁶ for mink and 4.07 x 10⁻⁵ for otter, indicating that even with conservative assumptions, current DBDPE concentrations in Canadian biota are unlikely to exceed minimum effects levels, within greater than 1000-fold margin of error (Table 9-4).
| Compartment | Scenario | PNEC/TRV | PEC/TDI | RQ |
|---|---|---|---|---|
| Sediment | Industrial (or laundry wastewater, products available to consumers) release to water | 833 mg/kg dw | 3.34 x 10⁻⁴ to 8.78 mg/kg dw | 1.76 x 10⁻⁷ to 0.011 |
| Soil | Biosolids application to soil | 180.7 mg/kg dw | 4.6 x 10⁻⁴ to 25.3 mg/kg dw | 2.5 x 10⁻⁶ to 0.14 |
| Wildlife | Piscivore TDI (mink/fish) | 75.4 (mink) and 45.8 (otter) mg/kg bw/day | 0.0007 (otter) to 0.002 (mink) mg/kg bw/day | 9.48 x 10⁻⁶ (mink) 4.07 x 10⁻⁵ (otter) |
9.3.2 Consideration of lines of evidence and conclusion
DBDPE, as well as potential transformation products, are expected to be persistent in air, water, soil and sediment. It is difficult to determine the bioaccumulation potential of DBDPE on the basis of the limited data; however, the weight of evidence to date suggests DBDPE itself is expected to have a low bioaccumulation potential. Yet, considering the analogue decaBDE, as well as preliminary DBDPE transformation product studies and modeling, there is concern for potential formation of bioaccumulative (and more hazardous) transformation products, which can be considered analogues to lower brominated polybrominated diphenyl ethers (PBDEs). The Ecological Screening Assessment on PBDEs (June 2006) concluded that lower brominated PBDEs, namely tetraBDE, pentaBDE and hexaBDE, satisfy the criteria outlined in the Persistence and Bioaccumulation Regulations of CEPA.
The high importation volumes of DBDPE into Canada, along with information on its uses, indicate potential for widespread release into the Canadian environment. Once released into the environment, DBDPE will be found mainly in sediment and soil, where it may persist for long periods of time, resulting in DBDPE build-up, as seen by rapid doubling times in sediment in the Great Lakes. DBDPE, via sorption to particles, also has potential for long-range transport and deposition in remote areas, on the basis of results of long-range transport modelling and some measurements in remote areas. Most early hazard studies suggest DBDPE itself demonstrates low potential for toxicity to aquatic sediment, terrestrial organisms, and wildlife; however, there is some uncertainty with respect to the mode of action for DBDPE. At least one set of DBDPE aquatic studies (although using solvent) suggest molecular-level effects at low concentrations; and recent analogue decaBDE studies have also reported effects on aquatic organisms (water, sediment, and diet exposure) at low concentrations, warranting consideration of precaution. Modelled aquatic toxicity data for potential DBDPE debrominated transformation products suggest effects at low concentrations in the range of water solubility. The lack of empirical toxicity data (e.g., for pelagic, benthic and soil organisms) for potential transformation products is an important source of uncertainty, warranting consideration of precaution. Generally, the findings of this analysis are consistent with the concerns expressed in the 2010 Ecological State of the Science Report on Decabromodiphenyl Ether (Environment Canada 2010) in that DBDPE is expected to transform to lower brominated products in a manner similar to decaBDE. While it appears that, on the basis of predictive degradation pathway molar ratios, transformation products are expected to represent a minor fraction relative to parent DBDPE, they are similar to predicted/measured fractions of analogue decaBDE debromination products, and if DBDPE levels in the environment continue to increase (as seen in Great Lakes sediment), the pool of potential brominated BDPE transformation products could become important.
This information indicates that DBDPE has the potential to cause ecological harm in Canada.
9.3.3 Uncertainties in evaluation of ecological risk
One of the major areas of uncertainty affecting results in the assessment is ‘analytical uncertainty’. DBDPE is a difficult brominated flame retardant to analyze, and uncertainty can reach 40 to 60%, depending on the internal standard used for quantification (A. Covaci pers. comm.). Inaccurate measurement of DBDPE in media could impact all areas of the assessment involving measured data, and importantly, the bioaccumulation assessment and hazard assessment.
There is high confidence that DBDPE is very stable in the environment with a long residence time.
Generally, existing data on DBDPE bioaccumulation are limited and uncertain, and reliable quality laboratory and field measurements are not available. While the current weight of evidence suggests low to moderate bioaccumulation potential, consideration of log Kow and log Koa values suggests that DBDPE may have the potential to biomagnify in terrestrial food webs as a result of dietary exposure. An underestimation of bioavailability of DBDPE could result in underestimation of DBDPE exposure to organisms. There is a moderate level of confidence with the conclusion of low DBDPE bioaccumulation potential.
PNECs/TRVs for risk analysis were developed using available CTVs from DBDPE toxicity studies for soil, sediment, and rodents, which reported low to no toxicity. However, there are information gaps on the toxicity of DBDPE to wildlife and effects on pelagic, sediment and terrestrial species resulting from prolonged (e.g., lifetime and mutigenerational) exposure. In addition, there are some recent aquatic and sediment analogue decaBDE studies reporting effects at lower concentrations (e.g., ~10x lower concentration in sediment than current PNEC); although there are uncertainties with these studies as well, there is the possibility future DBDPE toxicity studies may determine similar effects at low concentrations. This uncertainty was considered in the application of precaution and the proposed conclusion for the assessment. Owing to the unreliable aquatic toxicity results and assumptions of low relevance of the pelagic environment for DBDPE exposure, risk was not determined for the pelagic aquatic environment. This could represent a source of uncertainty for risk to aquatic organisms; however, pelagic exposure to DBDPE is considered to be lower than exposures via the benthos and benthic-related food chains. Generally, confidence in DBDPE toxicity results is low to moderate.
Uncertainties are present due to the lack of information on the environmental concentrations in Canada, particularly in water, soils, sediments and biota. In spite of this limitation, exposure scenarios for use in risk analysis were developed using the best available information and they are considered sufficiently conservative to characterize potential risks from releases of parent DBDPE to the Canadian environment. Even with conservative assumptions of large DBDPE quantities in use at industrial sites, risk quotients for parent DBDPE were much less than one, suggesting low risk.
The exposure assessment focuses on industrial point sources as being most relevant for DBDPE in the environment. From its use as an additive flame retardant, some DBDPE will migrate from products, as evidenced by concentrations in household dust (see Health Assessment section). There is also limited information characterizing potential releases from products in use and during disposal/recycling in this assessment. No Canadian DBDPE landfill leachate data have been reported to date, and while the majority of landfills treat leachate via WWTS, leachate data could help interpret end-of-life releases. DBDPE quantity in products (considering all products imported and in use) could be high; however, considering available analogue decaBDE information, it assumed that major DBDPE pathways of release from products in service are covered under the current industrial release scenarios. Furthermore, the dust-laundry wastewater exposure scenario, on the basis of measured DBDPE levels in the USA, suggests predicted DBDPE release via this pathway in Canada, is also covered under the current industrial release scenarios. Generally, there is moderate confidence in the DBDPE exposure scenarios.
The greatest uncertainty in this assessment relates to the lack of data for the occurrence of DBDPE transformation products in the environment; it is uncertain what transformation products may form and in what quantities. There are few empirical data available for transformation products, and the few laboratory studies reporting DBDPE degradation are for photodegradation, primarily in solvents, some of which are not environmentally relevant. In addition, accredited analytical methods for the measurement of the potential transformation products in environmental matrices are lacking, which limits monitoring studies. However, on the basis of the analogous chemical, decaBDE, debromination of DBDPE in the environment is expected. While the only DBDPE debrominated products identified in empirical studies to date are nonaBDPEs (in sediment and solvents) through heptaBDPEs (solvents only), DBDPE debromination to hexa and pentaBDPEs is also expected on the basis of the close analogue, decaBDE.
Therefore, while this assessment predicts that DBDPE transformation products have high overall persistence, bioaccumulation potential, and ecotoxicity, it must be considered that there is uncertainty with these estimates. There are no experimental studies evaluating physical chemical properties, persistence, bioaccumulation potential, or toxicity of any DBDPE debrominated products to verify the predicted values. Predicted transformation products are within the domain of the Persistence and Bioaccumulation models presented, but there is less certainty with aquatic toxicity predictions. It is possible aquatic toxicity is over-estimated for transformation products. However, on the basis of the analogue decaBDE, it is expected that DBDPE transformation products are more bioavailable and hazardous than parent DBDPE.
10. Potential to cause harm to human health
10.1 Exposure assessment
10.1.1 Environmental media and food
DBDPE is associated with very low solubility in water and volatility, and is expected to partition predominantly to dust, soil and sediment when released to the environment. In residential environments, DBDPE is a common component of house dust. Based on Health Canada (1998) intake rates for air, water, food and dust/soil, the estimated total intake of DBDPE from environmental media and food for the Canadian population ranges from 0.001 µg/kg bw/day for adults over 60 years old to 0.062 µg/kg bw/day, for infants aged 0 to 0.5 years. Dust is the main contributor to the total daily exposure from environmental media and food. These results are summarized in Appendix D.
Concentrations in environmental media selected to derive estimated intakes are described in the following sections.
10.1.1.1 Air
Ambient air
Reported concentrations of DBDPE in ambient air are presented in the Supporting Information document (ECCC, HC 2019).
No reports of DBDPE in ambient air from Canadian environments were identified, although it has been detected in ice cores from Devon Island, Nunavut (Meyer et al. 2012). DBDPE has been detected in ambient air samples from other countries. The atmospheric concentration of DBDPE in the US is monitored as a part of the Integrated Atmospheric Deposition Network (IADN), with published data available from 2003 to 2011. The highest mean concentration (vapour plus particle phases) reported for an urban site was 22 pg/m3 for Cleveland, Ohio, when monitored between 2005 and 2006 (Venier and Hites 2008). In the same time period (2005-2006), the lowest mean concentration reported was for a remote site in Eagle Harbor, Michigan, at 1.0 pg/m3. Over the 2005-2011 time period, the highest mean concentration (particle phase only) for an urban site was 5.2 pg/m3, also for Cleveland, Ohio, while the lowest mean concentration (particle phase only) reported for a remote site was 1.2 pg/m3, again for Eagle Harbor, Michigan (Ma et al. 2013). The authors of this study stated that data were too sparse for DBDPE to determine if there was a temporal trend (no consistent trends amongst the five sampling sites in the Great Lakes). Mean concentrations of 7 or 10 substances measured, including DBDPE, were higher in Cleveland than in Chicago even though Cleveland’s population is only about one third of Chicago’s population, and the authors suggested that this may be related to the presence of one or more point or industrial sources of flame retardants in or near Cleveland (Ma et al. 2013). DBDPE was also detected in atmospheric particles in Aspvreten, Sweden; a maximum concentration of 7.9 pg/m3 was reported for this remote location (Egebäck et al. 2012). A Nordic screening project reported ambient air concentrations of DBDPE for locations in Denmark, Norway and Sweden (Nordic Co-operation 2011). Of all the locations monitored, the highest concentration was reported for atmospheric particles collected from an urban area in Oslo, Norway at 44 pg/m3.
The maximum DBDPE concentration in ambient air reported for China was 3578 pg/m3 in a highly industrialized and urbanized area (Shi et al. 2009). Tian et al. (2011) also reported a deposition rate of 41 600 ng/m2/year (approximately 114 ng/m2/day) in the same highly industrialized and urbanized area (as well as 9780 and 850 ng/m2/year near an electronics waste recycling site and in a rural site, respectively) in southern China.
To derive the upper-bounding estimate of daily intake from outdoor air for the Canadian population, the highest reported mean concentration from Cleveland (Venier and Hites 2008) was used as it is considered conservative for urban exposure in Canada, and as suggested by Ma et al. (2013), it may also account for point sources of DBDPE.
Indoor air
A recent study of DBDPE measured in indoor air in 23 homes in Toronto, Canada reported concentrations ranging from not detected to 74 pg/m3 (Venier et al. 2016). Residential indoor air studies in Oslo, Norway and three different cities in Sweden reported concentrations ranging from not detected to 963 pg/m3 (Karlsson et al. 2007; Cequier et al. 2014). A Nordic screening project reported a maximum concentration of 56 pg/m3 for DBDPE in atmospheric particles in an office building in Oslo, Norway (Nordic Co-operation 2011). DBDPE was not detected in the indoor air of three aircraft during flights in Sweden (LOD = 0.01 picomol; Strid et al. 2014), nor was it detected in the indoor air of a hotel in Japan (Takigami et al. 2009).
The maximum concentration of 74 pg/m3 reported in the Canadian residential study (Venier et al. 2016) was used to derive the upper-bounding estimate of daily indoor air intake for the Canadian population.
Estimates of exposure via air (indoor and ambient) are shown in Appendix D. For both outdoor and indoor air, the estimates are less than 0.0001 µg/kg bw/day, which are considered negligible.
10.1.1.2 Dust
DBDPE is a common component of house dust and its presence has been reported in numerous house dust samples. Although the source of DBDPE is not typically identified, it may be electronic equipment that contains DBDPE as an additive flame retardant and/or it may occur in dust transported into homes from outside environments. In one unpublished Canadian study, 5 homes in Toronto were sampled each year from 2010 to 2012 and the maximum dust concentration was 5600 ng/g. The authors of this study stated that DBDPE dust profiles for living rooms and bedrooms were higher, compared to kitchens. In 2011, DBDPE was not detected in additional window wipe samples from 5 homes in Toronto nor in the majority of hand wipe samples from occupants living in the sampled homes [8% detection frequency; number of participants not stated] (Diamond et al. 2013). Recently published Canadian studies measured DBDPE in dust in 35 homes and 10 offices in Toronto during 2012 and 23 homes in Toronto during 2013. Concentrations of DBDPE in dust ranged from not detected to 5500 ng/g with wider ranges and higher average concentrations in homes than in offices. Window wipe samples in the 2013 study resulted in DBDPE concentrations of not detected to 6.8 ng/m2 [23.5% detection frequency] (Abbasi et al. 2016; Venier et al. 2016). The highest maximum concentration of DBDPE in US house dust is 11 070 ng/g, reported by Stapleton et al. (2008) in a study in which samples were collected from 20 homes in the Greater Boston Area. It was also measured in dust samples from 16 homes in San Francisco with the highest level reported at 2800 ng/g (Dodson et al. 2012).
Abbasi et al. (2016) also analyzed the association of DBDPE in dust from the 2012 study with dust on products in the same locations. DBDPE was found mainly on the surface of flat screen TVs (not detected to 6262 ng/wipe), followed by audio/video devices and household appliances (not detected to 1380 ng/wipe). The authors showed that there was a positive correlation between the geometric mean concentrations of halogenated flame retardants (including DBDPE) in home and office dust with those in dust from the surfaces of electronic products.
In Europe, the highest maximum concentration of DBDPE reported for house dust was from Sweden at 24 000 ng/g, measured from one of 6 apartments; however, concentrations in the 5 other apartments and one home ranged from 470 to 2200 ng/g (Sahlström et al. 2012; Remberger et al. 2014). The maximum concentration reported in Romania (12 240 ng/g) was comparable to the maximum level reported in the US (Dirtu et al. 2012), and lower values were reported for maximum concentrations in house dust from Oslo, Norway (4460 ng/g; Cequier et al. 2014), Prague, the Czech Republic (3567 ng/g, Kalachova et al. 2012), West Midlands, UK (3400 ng/g, Harrad et al. 2008), Belgium (2126 ng/g, Ali et al. 2011a), and Germany (1570 ng/g, Fromme et al. 2014). In Asia, the maximum reported concentration in urban house dust was 16 000 ng/g reported from China (Qi et al. 2014), but lower maxima were reported in other countries: 2175 ng/g in Kuwait City, Kuwait (Ali et al. 2013a) and 850 ng/g in Gujrat, Pakistan (Ali et al. 2012a). The maximum reported concentration of DBDPE in house dust from New Zealand was 1430 ng/g (Ali et al. 2012b). The differences in concentrations observed may be due to varying flammability standards in different jurisdictions, or the diversity of products available to consumers found in each home.
For non-residential indoor environments, such as among three studies of dust from classrooms, offices and vehicles from West Midlands, UK (Ali et al. 2011a, Goosey et al. 2009, Harrad et al. 2008), vehicle dust was found to contain the highest maximum concentration of DBDPE at 2900 ng/g (Harrad et al. 2008). In Prague, the Czech Republic, the maximum reported concentration of DBDPE in vehicle dust was 3567 ng/g (Kalachova et al. 2012). Maximum concentrations in vehicle dust in Kuwait City, Kuwait (8200 ng/g) and Faisalabad, Pakistan (5420 ng/g) were generally higher than those reported for vehicles in Europe. However, one sample of dust in a new car in Sweden revealed a concentration of 92,000 ng/g (Remberger et al. 2014). During flights within Sweden, DBDPE levels in three aircraft ranged from < 1460 to 5730 ng/g (Strid et al. 2014). Reported maximum concentrations in dust in non-residential buildings in Germany and Sweden ranged from 140 (school) to 8100 ng/g (conference centre) DBDPE (Brommer et al. 2012; Remberger et al. 2014). In a study of 81 urban and rural homes and buildings in China, higher concentrations were noted in urban buildings versus rural buildings, with maximum concentrations ranging from 5300 (office) to 13 000 ng/g (mushroom factory) (Qi et al. 2014). The highest concentration reported in three offices in Beijing, China was 16,200 ng/g (Cao et al. 2014). In electronic waste facilities in Thailand, DBDPE concentrations in dust ranged from 380 to 44 000 ng/g (mean = 8,630 ng/g); the six highest measures (12 500-44 000 ng/g) in all 21 samples were attributed to dust from rooms storing personal computers and printers (Ali et al. 2011b). Concentrations of 20 000 and 23 0000 ng/g were also reported in -an electronic waste recycling facility in Sweden (Remberger et al. 2014).
Results from North American studies are considered most representative of levels in Canadian dust. Although the results from the Toronto study showed a lower maximum indoor dust concentration, the maximum value of 11 070 ng/g from the Boston study (Stapleton et al., 2008) was selected to derive an upper bound estimate of daily intake from dust for the Canadian general population. This level is considered conservative and accounts for potential variability in dust levels from different indoor settings (e.g., offices, vehicles, aircraft).
For all age groups, exposure from ingesting dust contributed 76-100% of the estimated daily intake of DBDPE.
10.1.1.3 Soil and sediment
No monitoring data on DBDPE in soil in Canada or the U.S. were identified. Although there were reported concentrations of DBDPE in surface soil from Indonesia and in farmland soil from China (Ilyas et al. 2011; Shi et al. 2009), it was considered that modeled estimates of soil concentration for Canada (see below) were more relevant to the estimates of intake based on soil.
A maximum DBDPE soil predicted environmental concentration (PEC) of 25.3 µg/g dw (25.3 mg/kg dw) was estimated for land application of biosolids on an agricultural field using conservative approaches (see section 9.2.1). As no relevant monitoring studies on DBDPE in soil were identified, the soil maximum PEC was selected for upper-bounding intakes from the ingestion of soil for the general population in Canada.
10.1.1.4 Water
Reported concentrations of DBDPE in surface water and precipitation are presented in Supporting Information (ECCC, HC 2019). Measurements in groundwater or drinking water were not identified.
DBDPE was detected in all five Great Lakes at average concentrations of 0.25 ± 0.05 pg/L (L. Huron) to 6.7 ± 5.0 pg/L (L. Superior) [LOD not stated]. The highest concentration was from Lake Ontario at 10.8 pg/L, although there was only one sample from this lake in which DBDPE was detected. The authors stated that the concentration measured in Lake Ontario was similar to the concentrations measured in Lake Superior (Venier et al. 2014). Other studies of Canadian surface water have not detected DBDPE (Law et al. 2006; Muir et al. 2011).
In Norway, DBDPE was detected in one of three influent sources to wastewater treatment plants in Norway at a mean concentration of 5.1 ng/L (in 2/3 of composite samples of incoming wastewater), but it was not detected in seepage water from a municipal landfill site in Drammen, Norway (Nyholm et al. 2013). DBDPE was not detected in sea, tidal inlet, and river water in Spain (LOD = 5.0 ng/L) (Valls-Cantenys et al. 2013).
DBDPE was not detected in a southern Chinese pond (Wu et al. 2010). Another study sampled surface water from the Dongjiang River in southern China and reported the presence of DBDPE in both the dissolved phase (i.e., filtered water from the sample) and the particulate phase (He et al. 2012). DBDPE was found at a maximum concentration of 38 pg/L in the dissolved phase and 110 ng/g dry weight in the particulate phase. The Dongjiang River runs through Dongguan City, an intensive electronic and telecommunication equipment manufacturing base, and thus, the neighbouring industrial activities are assumed to contribute to the loading of DBDPE in the river.
The highest concentration of DBDPE reported in North American surface water (10.8 pg/L measured in Lake Ontario) was used to derive the upper-bounding estimate of drinking water intake for the Canadian population. As part of the Integrated Atmospheric Deposition Network (IADN), measurable amounts of DBDPE have also been reported in precipitation for multiple US locations (Salamova and Hites 2010, 2011; Ma et al. 2013). Because precipitation undergoes many transformations prior to becoming a part of drinking water, the applicability of precipitation data for estimating general population exposure to DBDPE through drinking water is uncertain.
10.1.1.5 Food
No reports of DBDPE in Canadian food were identified. In two studies of food from the UK and Ireland, over 100 types of food samples were analyzed (including meat, fish, milk, cheese, eggs and vegetables) and DBDPE was not detected in any of the food samples (Fernandes et al. 2010; Tlustos et al. 2010). However, DBDPE was detected in infant formula and baby foods in the US and China in a recent study. The maximum DBPDE concentrations, measured in samples purchased in 2013 in U.S. stores, were 28.6 pg/g fresh weight (fw) in infant formula and 48.8 pg/g fw in baby food cereal. Although DBDPE was not detected in baby food puree in the US, it was detected in Chinese samples (10.2 to 16.2 pg/g in meat, vegetable, and mixed puree types). In the same study, several other halogenated flame retardants were also detected in infant formula and baby foods, including declorane plus (DP). Based on analyses of both food and packaging for DP, the authors concluded that it was unlikely that the samples were contaminated from their packaging, but rather that raw foods were contaminated or that they became contaminated during processing (Liu et al. 2014). By extension, it is assumed that DBDPE levels in baby food cereal products are due to contamination of raw foods or during processing.
As shown in section 7, DBDPE has been sampled in the fish tissue of several freshwater species in Canada, and concentrations have generally ranged from not detected to very low (i.e., mean concentration ≤ 1 ng/g lipid weight [lw]) (Ismail et al. 2006; Law et al. 2006; Kolic et al. 2009; Byer et al. 2010; Zhou et al. 2010b; Muir et al. 2011). The highest concentration measured in fish muscle was 3.3 ng/g lw, from sampling of six different fish species in Lake Winnipeg (Law et al. 2006), whereas the highest concentration in liver was 26.7 ng/g lw, sampled from two fish species in the St. Lawrence River (Houde et al. 2014). Daily intake estimates of DBDPE from the consumption of infant formula and cereal products for the general population were based on the maximum concentrations in formula and cereal samples, respectively (Liu et al. 2014). Daily intake estimates of DBDPE from the consumption of fish were based on the maximum concentration of DBDPE in fish muscle reported for Lake Winnipeg fish, specifically Whitefish (Law et al. 2006), This estimate assumes that all fish consumed contain DBDPE and is considered to take into consideration potential variability in dietary exposure due to varying eating habits, including increased fish consumption or potential consumption of fish liver by certain subpopulations.
10.1.1.6 Breast milk
DBDPE was not detected (LOD = 1.7 ng/g lipid weight [lw]) in 91% of breast milk samples collected from 105 adult nursing women in Sherbrooke, Quebec, in 2008-2009 (see Appendix D). However, the 95th percentile and maximum detected values were 3.3 and 25 ng/g lw, respectively (Zhou et al. 2014). In New Zealand, DBDPE was not detected in the breast milk of 35 of 36 first-time mothers; one sample showed a value of 325.50 pg/g lw (Mannetje et al. 2013). An upper-bounding estimate of daily intake from breastmilk was derived based on the 95th percentile concentration of DBDPE reported in the Sherbrooke, Quebec study (Zhou et al. 2014).
10.1.2 Products available to consumers
DBDPE is an additive flame retardant used in the manufacture of plastics and rubber products, as an additive in textiles and polymers for electrical applications (Covaci et al. 2011; EFSA 2012) (see section 5). DBDPE is expected to have similar polymer loading rates as decaBDE, which it is marketed to replace (Environment Agency 2007). Appendix E summarizes the reported concentrations of DBDPE in products available to consumers.
Health Canada conducted product testing on 23 items (e.g., children’s toys, nursing pillows, crib mattress and other plastic, foam or textile products) purchased in retail stores in Ottawa in 2014. DBDPE was detected above the limit of quantification (LOQ of 0.5%) in the textile of a children’s play tent; it was not detected in any of the other 22 products (Health Canada 2014a, b). Another Canadian study tested for brominated flame retardant (BFR) concentrations in a number of manufactured items available to consumers from the Greater Toronto area in 2012. DBDPE was not detected in the majority of these products, except for the casings of audiovisual, computer products, and TV monitors, with maximum concentrations of 100 to 500µg/g. The authors noted that DBPDE and some other targeted BFRs were often detected in a single sample of each product type, and stated that “The sources of these flame retardants at such a low level were not clear.” (Mochungong et al. 2014).
Black polymeric food contact articles from different distributors within Europe were analyzed for bromine content and subsequent identification of the flame retardants within them. Of the 10 articles tested, three were found to contain DBDPE and tetrabromobisphenol A together (electric frying pan), plus decabromodiphenylether [decaBDE] (thermos-cup cover) or bis(2,4,6-tribromophenoxy)ethane (apple cutter) at bromine concentrations ranging from 279 to 5975 µg/g. These concentrations were lower than expected to obtain flame retardancy and the authors suggested that there was a high probability that recycled plastic fractions containing flame retardants, were used in the production of these articles. Although concentrations of the individual substances were not determined, the authors also stated, "The obtained data show that in some cases DBDPE as the newer replacement for decaBDE was found in the samples." (Puype et al. 2015).
In Asia, other studies have analyzed for DBDPE in many manufactured items including electronic components (television casings, computer monitor displays and accessories), car interiors (plastic, seat polyurethane and textile coating), household items (curtains, wallpaper and building materials) and furniture (sofa, mattress, pillow and carpet padding) (Chen et al. 2010b; Kajiwara et al. 2011). Across the studies, concentrations were highest in TV casings (ND – 268.23 µg/g). In a separate Japanese study, DBDPE blended with high-impact polystyrene plastic and DBDPE present in plastic casings of televisions did not degrade in natural sunlight over 244 days (experiment conducted in a temperature controlled glass room, in which tubes containing samples were rotated constantly over 14 hrs each day to achieve uniform light exposure, and sample tubes shaken once a week to ensure homogeneous sunlight exposure of the particles; Kajiwara et al. 2008). Exposure to DBDPE from direct contact with electronics is considered minimal. Any abrasion to the plastic surfaces during the service life of these items may result in DBDPE adhering to dust particles in the surrounding area which is accounted for through exposure estimates in dust (see section 10.1.1.2).
Although Chen et al. (2010b) reported DBDPE concentrations in textile coatings in car interiors in China, it was not detected in car seats nor in furniture upholstery in one recent study in Canada (Mochungong et al. 2014). DBDPE was reported for unspecified uses in motor vehicles, as well as in the manufacture of automotive airbag textile in Canada (ECCC 2013-2014; Health Canada 2014a, b). Evidence based on limited studies in Europe and Asia indicate that time spent in a car may represent a source of exposure to DBDPE in dust. However, the upper bound daily intake of dust derived based on studies in residences is considered to account for potential variability in other indoor settings, such as vehicles (see section 10.1.1.2). Use of DBDPE in furniture textiles has not been reported in North America. Current information indicates that the potential for exposure of the Canadian general population to DBDPE from furniture textile is low.
DBDPE was detected in different types of toys purchased in China (hard plastic, rubber/soft plastic, foam, textile and stuffed toys) with the highest concentrations measured in hard plastic toys. Concentrations are reported in Appendix E (Chen et al. 2009).Footnote 2 Since DBDPE use in Canada is in plastic, rubber and textile materials rather than foam (ECCC 2013-2014; Health Canada 2014a,b), the potential exposure to DBDPE from mouthing of hard plastic toys by 0.5- to 4-year old children was modelled. A migration rate of 0.00769 μg/cm2 per minute, based on volunteers mouthing plastic toys or rubber (Chen et al. 2009), was used in an algorithm to estimate oral daily intake. The resulting upper-bounding estimate of exposure from the mouthing of hard plastic toys was 1.9 × 10⁻⁴ mg/kg bw/day (Appendix F). Although skin contact with toys or hand-to-mouth contact following play with toys may result in potential exposure to DBDPE, it is expected to be minimal based on DBDPE physico-chemical properties, and therefore it is not expected to contribute significantly to the overall systemic exposure from toys.
Chen et al. (2009) conducted their own exposure estimates from mouthing of hard plastic toys using their own algorithms for the brominated flame retardants measured in the study. Their estimates for DBDPE (1.3 × 10⁻⁶ to 1.5 × 10⁻⁵ mg/kg bw/day) are close to the estimate derived from the model used in this assessment.
10.1.3. Biomonitoring
Appendix G summarizes the reported concentrations of DBDPE in serum and plasma, and human hair.
DBDPE was detected in 6% of serum samples collected from 102 adult nursing women in Sherbrooke, Quebec, during 2008 -2009, with concentrations between 3.4 (LOD) and 123 ng/g lipid weight (lw) (Zhou et al. 2014). The authors of this study suggested that toxicokinetics and analytical methods contributed to the low detection frequencies of DBDPE in human samples. DBDPE was not detected in the serum of residents from North China (Zhu et al. 2009) nor in serum from women from California, US (Petreas et al. 2012). In addition, DBDPE was not detected in the plasma or serum of residents from Sweden (Karlsson et al. 2007; Remberger et al. 2014).
The presence of DBDPE in human hair samples from South China was reported by Zheng et al. (2011), but is presumed to be from deposition of dust rather than an indication of sequestration in human hair. The authors showed that DBDPE concentrations in dust amongst these different areas followed the same spatial distribution as that in hair, and that there was a significant correlation of DBDPE concentrations (r = 0.97, p = 0.03) between dust samples and hair samples, indicating that dust was one of the primary exposure routes for DBDPE in hair (i.e., dust depositing in hair). In another study, lower concentrations of DBDPE were reported in the hair of pet dogs and cats in Pakistan (maximum of 17.6 ng/g), and DBDPE was not detected in the serum of these animals (Ali et al. 2013b).
The low levels of DBDPE found in human serum is consistent with the expected low levels of exposure estimated using models. It is noted that different studies used variations in the gas chromatography-mass spectrometry (GC-MS) analytical methodology for detection of DBDPE in human serum/plasma and breast milk. For analysis of DBDPE in serum/plasma, Petreas et al. (2012) used GC-high resolution (RM) MS with the MS operating in electron impact ionization mode using multiple ion detection; Zhou et al. (2014) used GC-MS with the MS operating in electron capture negative chemical ionization (ECNI) mode using selective ion monitoring (SIM) [ion pairs m/z 890.5 and 892.6]; whereas Zhu et al. (2009) and Karlsson et al. (2007) used GC-MS with ECNI using SIM [ion pairs m/z 79 and 81]. For analysis of breast milk (see Appendix G), Mannetje et al. (2013) used HRGC-HRMS with SIM using ion pairs (specific ions not stated in article), whereas Zhou et al. (2014) used GC-MS with ECNI using SIM and ion pairs. Zhou et al. (2014) and Mannetje et al. (2013) were the only studies that detected DBDPE in serum/breast milk. Due to the variations in analytical methodology amongst the available studies attempting to measure DBDPE in serum/plasma/breast milk, there is evidence to support the observation that biomonitoring results in low (or very low) detections of DBDPE in biological fluids.
10.2 Health effects assessment
A summary of the available health effects information for DBDPE is presented in Appendix H.
No classifications of the health effects of DBDPE by national or international regulatory agencies were identified.
No chronic or carcinogenicity studies on DBDPE were identified. Mutagenicity studies with DBDPE in Salmonella typhimurium (TA 98, TA 100, TA 1535, TA 1537, and TA 1538 strains) and Escherichia coli (WP2 uvrA strain) were negative when tested with or without metabolic activation at concentrations ranging from 0 to 5000 μg/plate in DMSO (Stankowski 1988; San and Wagner 1991). No chromosomal aberrations were found in Chinese hamster lung (CHL) cells at concentrations from 78 to 625 μg/ml for 6 hours with or without metabolic activation (Putman and Morris 1992). An independent repeat assay conducted with DBDPE suspended in carboxymethyl cellulose at concentrations of 625 to 5000 μg/ml with or without metabolic activation was also negative (Putman and Morris 1992). No in vivo studies were identified. Therefore, based on the available information, DBDPE is not considered mutagenic in vitro.
In the absence of chronic or carcinogenicity studies on DBDPE, Health Canada conducted an analysis of (Q)SAR model predictions for carcinogenicity. Results were inconclusive. However, the (Q)SAR model predictions supported the findings from in vitro assays that indicated that DBDPE is not genotoxic. More detailed information of (Q)SAR modelling on carcinogenicity and genotoxicity is presented in Appendix H.
The UK Environment Agency (EA) assessed DBDPE in 2007 (Environment Agency 2007) and indicated in their report that the absence of signs of carcinogenicity from repeated-dose studies, such as proliferative changes, and the lack of genotoxicity in the available data, would suggest that DBDPE is unlikely to be carcinogenic (Environment Agency 2007).
Several repeated dose studies have been identified. In a sub-chronic oral study, DBDPE was administered to male and female Sprague-Dawley rats (10 animals/sex/group with an additional 10 animals/sex/group were added to the control and high-dose groups) at dose levels of 0, 100, 320 or 1000 mg/kg/day by gavage in corn oil for 90 consecutive days. At the end of the 90 days, all animals were sacrificed except for the additional animals from the control and high-dose groups; these were kept alive for a recovery period of 28 days to determine the reversibility, persistence or delayed occurrence of toxic effects. Results of the study showed that no treatment-related clinical signs of systemic toxicity, ocular lesions, alterations in urinalysis, clinical chemistry or hematology values were observed in the treated or recovery groups. No biologically or toxicologically significant differences were observed in body weights, body weight gains, and food consumption. In the male exposed rats, there were statistically significant differences in mean absolute or relative liver weights at the 1000 mg/kg bw/day dose level as well as low-grade liver changes, consisting of minimal to slight hepatocellular vacuolation (high-dose males) and minimal to slight centrilobular hepatocyte hypertrophy (high- and possibly mid-dose males). These liver weight and histomorphological changes were, however, resolved by the end of the 28-day recovery period. No treatment-related changes were found in the liver of female rats. No treatment-related histomorphological changes were present in any of the other tissues (40 organs were examined). Overall, a NOAEL of 1000 mg/kg bw/day, the highest dose tested, was identified from this study (Margitich 1992; Hardy et al. 2002).
In a study conducted by Wang et al. (2010), male Sprague-Dawley (SD) rats were administered 100 mg/kg bw/day DBDPE orally in corn oil for 90 days. No significant changes in body weight, liver and kidney weight were observed. However, DBDPE induced changes in clinical parameters (suppression of aspartate aminotransferase (AST), alkaline phosphatase (ALP) and creatinine (Cr), an increase in total bile acids (TBA). The EFSA Panel on Contaminants in the Food Chain (CONTAM Panel) considered these effects to be toxicologically non-significant (EFSA 2012). The results of this study also indicated that DBDPE may induce pregnane X receptor (PXR)-dependent gene expression because CYP3A mRNA was slightly increased in the liver, but no arylhydrocarbon receptor (AhR)- nor constitutive androgen receptor (CAR)-dependent gene expression nor consequent possible adverse effects were observed (Wang et al. 2010; EFSA 2012). Banasik et al. (2011) commented on the findings of this study, and considered various changes to be natural adaptive responses.
One short-term oral study was identified in which DBDPE was administered to SD rats (6 animals/sex/group) at dose levels of 0 to 1250 mg/kg bw/day by gavage in corn oil for 28 consecutive days. At 1250 mg/kg bw/day, the highest dose tested, there were no effects on mortality, clinical signs, body weight, food consumption, body weight gain, hematology and serum chemistry values, urinalysis, ocular examinations, gross necropsy results, and light microscopy of selected tissues (adrenals, heart, kidneys, liver, mesenteric lymph node, parathyroids, spleen, and thyroid). A mild and reversible increase in relative liver weights in the high-dose females was observed without any histopathology. Also, no evidence of delayed or progressive effects was found in the 14-day recovery period (Margitich 1991).
The acute oral toxicity of DBDPE is considered to be low, based on the absence of mortality and any clinical signs of toxicity in SD rats administered 5000 mg/kg bw DBDPE via gavage (Mallory 1988a). An acute dermal toxicity assay was performed using New Zealand White Rabbits in which DBDPE was applied to the intact shaved dorsal skin at a dose of 2000 mg/kg bw and covered for 24 hours. There were no mortalities and all animals gained weight (Mallory 1988b).
The developmental toxicity of DBDPE has been examined in rats and rabbits via the oral route. In a study conducted by Mercieca (1992a), groups of 25 mated female SD rats were administered 0, 125, 400 or 1250 mg/kg bw/day DBDPE suspended in corn oil by gavage on gestational day (GD) 6 -15 and sacrificed on day 20. There were no indications of toxicity among the dams during gestation except for whitish coloured faeces; this is likely due to the large quantity of the test material in the faeces, observed in about half of the highest dose dams. All the animals survived until scheduled necropsy and the body weights and food consumption of the treated animals were comparable to those of the controls. There were no treatment-related effects on foetal weight, sex ratio and late resorption. There were no external or visceral abnormalities in offspring. However, a statistically significant increase in the number of litters with unossified hyoid and reduced ossification of the skull was observed at 400 mg/kg bw/day. This observation was considered to be incidental by the author, as a similar increase was not seen at the top dose. A number of variations occurred to a similar extent in the control and treated animals. In this study, no developmental toxicity was observed in rats up to the highest dose tested of 1250 mg/kg bw/day (Mercieca, 1992a).
Similar examinations were conducted in rabbits. Groups of 20 previously artificially inseminated female New Zealand White Rabbits were administered 0, 125, 400 or 1250 mg/kg bw/day DBDPE suspended in 0.5% methylcellulose by gavage on GD 6-18. No treatment-related mortality or clinical signs of toxicity were seen in the dams. Abortion occurred in one animal in each of the groups treated with 125 and 400 mg/kg bw/day and in two animals of the 1250 mg/kg bw/day group. However, in view of the low incidence of this observation and given that rabbits are known to have a high spontaneous abortion rate, this finding is considered to be incidental. There were no treatment-related effects on foetal weight, sex ratio, and early or late resorption. No abnormalities related to treatment with DBDPE were seen. The only statistically significant difference was an increased number of litters with the 27th presacral vertebra at 1250 mg/kg bw/day (9 litters compared to 4 in controls). However, given that this is a common finding in rabbits (the laboratory historical control range is 12.5 -93.8%), it was not considered adverse. A low incidence of vascular abnormalities was observed in the mid- and high-dose groups. Enlarged aortic valve, bulbous aortic arch and poorly developed right ventricle were observed in one foetus from the 400 mg/kg bw/day group. Malformation of the aortic arch and undeveloped right ventricle were seen in two foetuses from a single litter of the 1250 mg/kg bw/day group. Based on these low incidences, the reported malformations were not considered to be indicative of a treatment-related effect. Overall, no maternal toxicity was observed in this study with any of the doses tested. There were no adverse developmental effects observed in rabbits treated with DBDPE at doses up to 1250 mg/kg bw/day (Mercieca, 1992b).
Hardy et al. (2010) conducted a similar study both in rats and rabbits to evaluate potential embryotoxic and teratogenic effects of DBDPE. Animals were administered DBDPE via gavage at dosage levels of 0, 125, 400 or 1250 mg/kg bw/day from GD 6 through 15 for rats and GD 6 through 18 for rabbits. All female rats and rabbits were sacrificed on day 20 or 29 respectively, and subjected to caesarean section. No treatment-related mortality, abortions or clinical signs of toxicity were observed during the study. Body weights, body weight gain and food consumption were not affected by treatment. No significant internal abnormalities were observed in either species on necropsy. Caesarean section parameters were comparable between control and treated group. No treatment-induced malformations or developmental variations occurred. These study results showed no evidence of maternal toxicity, developmental toxicity, or teratogenicity in rats or rabbits treated with DBDPE at dosage levels up to 1250 mg/kg bw/day (Hardy et al. 2010).
No reproductive studies have been identified. However, there were no adverse effects on the reproductive organs (among the 40 organs examined) in the 90-day oral study in rats at doses up to 1000 mg/kg bw/day (Margitich 1992; Hardy et al. 2002).
Information on the toxicokinetics of DBDPE indicated that DBDPE was poorly absorbed via the oral route. In a study cited in the UK assessment report, no radioactivity was detected in plasma, bile and urine of rats exposed to a single dose of 1000 mg/kg bw of 14C-DBDPE suspended in corn oil at various intervals for up to 168 hours post-dosing (Environment Agency 2007).
In a study conducted by Black (2012), rats were administered DBDPE via gavage with a single dose of 100 mg/kg bw of unlabeled and 14C-labeled DBDPE in corn oil, and tissues, bile, feces and urine were assayed for radiochemical content. Up to 168 hours post dosing, 89% of radioactive content was recovered in the feces with none in urine. Radioactivity in tissues (adipose, kidney, liver, spleen and GI tract consisting of stomach, small and large intestine, and cecum (all with contents)) was generally not detected. No bile samples had increased levels of radioactivity compared to controls. In addition, levels of radioactive content in blood and plasma were not detected at any of the time points. The majority of radioactivity in the GI tract was found through 24 hours, with no radioactivity found by 72 hours post exposure. It was presumed to have been excreted in the feces (Black 2012).
10.3 Characterization of risk to human health
No classifications of the health effects of DBDPE by national or international regulatory agencies were identified. No chronic or carcinogenicity studies using DBDPE were identified. On the basis of the available information regarding genotoxicity, DBDPE is not genotoxic in vitro.
No adverse effects were observed in rats exposed to DBDPE orally for 28 or 90 days, up to doses of 1250 or 1000 mg/kg bw/day, respectively. No reproductive studies were identified. In two separate developmental toxicity studies, no treatment related maternal effects were observed in rats and rabbits exposed to DBDPE via the oral route; and no malformations or developmental variations occurred in the offspring.
There were no adverse effects observed in experimental animals exposed to oral doses up to 1000 mg/kg bw/day in sub-chronic studies (two 90-day gavage studies in rats). There are seven orders of magnitude between this dose and the highest estimate of total daily intake of DBDPE from environmental media and food (0.000062 mg/kg bw/day in infants aged 0-0.5 years). This margin of exposure is considered to be adequate to address uncertainties in the health effects and exposure databases. Limited biomonitoring data for DBDPE in adults in Canada (Zhou et al. 2014), the U.S. (Petreas et al. 2012), and other locations around the world (Remberger et al. 2014; Mannetje et al. 2013; Zhu et al. 2009; Karlsson et al. 2007) resulted in low detection frequency in serum, plasma or breast milk, which appears to support a low level of environmental exposure in the general population.
Products available to consumers, specifically children’s toys, were identified as a potential source of exposure of young children to DBDPE. There are, however, six orders of magnitude between the highest doses tested in short-term or subchronic oral studies (1250 mg/kg bw/day in a 28-day rat study and in four developmental toxicity studies in rats or rabbits; 1000 mg/kg bw/day in a 90-day rat study) associated with no adverse effects in experimental animals, and the estimate of exposure (1.9× 10⁻⁴ mg/kg bw/day) for children aged 0.5-4 years mouthing hard plastic toys. This margin of exposure is considered adequate to address uncertainties in the health effects and exposure databases.
10.4 Uncertainties in evaluation of risk to human health
There are uncertainties associated with the estimate of human exposure to DBDPE from environmental media, because it is a difficult brominated flame retardant to analyze, and uncertainty can reach 40-60%, depending on the internal standard used for quantification (2014 communication from A. Covaci to Environment Canada, unreferenced). Although studies selected to derive exposure estimates were considered to be relevant for Canada, most were non-Canadian and the data from Canadian locations was limited (e.g., surface water concentrations as a surrogate for drinking water concentrations; breast milk concentrations sampled from one urban population). However, the estimates of exposure from environmental media were based on conservative assumptions.
There are also uncertainties associated with the estimate of exposure to products available to consumers, including uncertainties associated with the assumptions used in the model for estimating exposure to DBDPE via mouthing. The experimental migration rate for transfer of DBDPE from toys to the mouth was based on the highest rate observed in 5 volunteers and not an average rate. However, as this is a conservative assumption, there is confidence that exposure was not underestimated. In addition, although limited, the biomonitoring data appear to support the expected low levels of environmental exposure of the general population.
There is an uncertainty associated with the assessment of carcinogenic and reproductive effects of DBDPE because of the absence of chronic and carcinogenic studies and reproductive toxicity studies. However, the collective evidence indicates that this substance is unlikely to be mutagenic; there were no adverse effects observed at the highest dose tested in the available short-term and sub-chronic studies, and large margins of exposure were determined for non-cancer effects.
11. Conclusion
Considering all available lines of evidence presented in this screening assessment, there is risk of harm to organisms, but not to the broader integrity of the environment from DBDPE. It is concluded that DBDPE meets the criteria under paragraph 64(a) of CEPA as it is entering or may enter the environment in a quantity or concentration or under conditions that have or may have an immediate or long-term harmful effect on the environment or its biological diversity. However, it is concluded that DBDPE does not meet the criteria under paragraph 64(b) of CEPA as it is not entering the environment in a quantity or concentration or under conditions that constitute or may constitute a danger to the environment on which life depends.
On the basis of the adequacy of the margin between estimates of exposure from environmental media or products available to consumers and the highest doses tested in experimental animals, with no treatment related effects following subchronic exposure, it is concluded that DBDPE does not meet the criteria under paragraph 64(c) of CEPA as it is not entering the environment in a quantity or concentration or under conditions that constitute or may constitute a danger in Canada to human life or health.
It is concluded that DBDPE meets one or more of the criteria set out in section 64 of CEPA. DBDPE has been determined to meet persistence criteria but does not meet bioaccumulation criteria as set out in the Persistence and Bioaccumulation Regulations of CEPA. However, DBDPE may contribute to the formation of persistent, bioaccumulative and inherently toxic transformation products, such as lower brominated DPEs in the environment.
References
Abbasi G, Saini A, Goosey E, Diamond ML. 2016. Product screening for sources of halogenated flame retardants in Canadian house and office dust. Sci. Total Environ. 545–546:299–307.
ACD/Percepta [Prediction Module]. c1997-2012. Toronto (ON): In Silico Prediction of Physicochemical, ADME, and Toxicity Properties. Advanced Chemistry Development. [cited July 2014].
[AEROWIN] AEROWIN Program for Windows [Estimation Model]. 2010. Version 1.00. Washington (DC): US Environmental Protection Agency, Office of Pollution Prevention and Toxics; Syracuse (NY): Syracuse Research Corporation. [cited January 2014].
Albermarle. 2001. SAYTEX® 8010 Flame Retardant data sheet. Albemarle Corporation. [accessed May 2011].For more information, see: Flame Retardant Sheet [PDF]
Albermarle 2007. Albemarle to Expand Production of Popular SAYTEX® 8010 Flame Retardant. Albermarle Corporation- News and Events documentation (1999-2008).
Albemarle. 2008. SAYTEX® 8010 Flame Retardant. Material Safety Data Sheet. Albemarle Corporation. Revision Date 12-Nov-2008. [accessed June 2011].
Albemarle. 2016. CMP Certain Organic Flame Retardants Substance Grouping; CAS#84852-53-9; 1,2 bis [2,3,4,5,6-pentabromophneyl]ethane (EBP). Letter to Chemicals Management Plan, Government of Canada, dated 6 December 2016.[restricted access].
Ali N, Harrad S, Goosey E, Neels H, Covaci A. 2011a. ‘‘Novel’’ brominated flame retardants in Belgian and UK indoor dust: Implications for human exposure. Chemosphere 83:1360-1365.
Ali N, Harrad S, Muenhor D, Neels H, Covaci A. 2011b. Analytical characteristics and determination of major novel brominated flame retardants (NBFRs) in indoor dust. Anal Bioanal Chem 400:3073-3083.
Ali N, Van den Eede N, Dirtu AC, Neels H, Covaci A. 2012a. Assessment of human exposure to indoor organic contaminants via dust ingestion in Pakistan. Indoor Air 22:200-211.
Ali N, Dirtu AC, Van den Eded N, Goosey E, Harrad S, Neels H, Mannetje A, Coakley J, Douwes J, Covaci A. 2012b. Occurrence of alternative flame retardants in indoor dust from New Zealand: Indoor sources and human exposure assessment. Chemosphere 88:1276-1282.
Ali N, Ali L, Mehdi T, Dirtu AC, Al-Shammari F, Neels H, Covaci A. 2013a. Levels and profiles of organochlorines and flame retardants in car and house dust from Kuwait and Pakistan: Implication for human exposure via dust ingestion. Environment International 55:62-70.
Ali N, Malik RN, Mehdi T, Shah Eqani SAMA, Javeed A, Neels H, Covaci A. 2013b. Organohalogenated contaminants (OHCs) in the serum and hair of pet cats and dogs: Biosentinels of indoor pollution. Sci Total Env. 449:29-36.
[AOPWIN] Atmospheric Oxidation Program for Windows [Estimation Model]. 2010. Version 1.92a. Washington (DC): US Environmental Protection Agency, Office of Pollution Prevention and Toxics; Syracuse (NY): Syracuse Research Corporation. [accessed January 2014].
Arnot JA, Gobas FAPC. 2003a. A generic QSAR for assessing the bioaccumulation potential of organic chemicals in aquatic food webs. QSAR Comb Sci 22(3):337-345.
Arnot JA, Gobas FAPC. 2003b. Categorization of organic substances on the Domestic Substances List for bioaccumulation potential. Report to Environment Canada, Existing Substances Branch. June 2003. Gatineau (QC): Environment Canada.
Arnot JA, Gobas FAPC. 2004. A food web bioaccumulation model for organic chemicals in aquatic ecosystems. Environ Toxicol Chem 23(10):2343-2355.
Arnot JA, Gobas FAPC. 2006. A review of bioconcentration factor (BCF) and bioaccumulation factor (BAF) assessments for organic chemicals in aquatic organisms. Environ Rev 14:257-297.
Aufderheide J. 2003. Effects of Saytex 8010 on the survival and reproduction of the earthworm, Eisenia fetida. ABC Laboratories, Columbia, Missouri (USA): Study number 47634.
Banasik M, Hardy M, Harbison RD, Stedeford T. 2010. Comment on “Brominated flame retardants in children’s toys: concentration, composition, and children’s exposure and risk assessment.” Environ Sci Technol 44(3):1154-1155.
Banasik M, Harbison RD, Lee RV, Lassiter S, Smith CJ, Stedeford T. 2011. Comment on "comparative tissue distribution, biotransformation and associated biological effects by decabromodiphenyl ethane and decabrominated diphenyl ether in male rats after a 90-day oral exposure study". Environ Sci Technol. 45(11):5060-1.
[BCFBAF] Bioaccumulation Program for Windows [Estimation Model]. 2010. Version 3.10. Washington (DC): US Environmental Protection Agency, Office of Pollution Prevention and Toxics; Syracuse (NY): Syracuse Research Corporation. [accessed January 2014].
Bergman Å, Rydén A, Law RJ, de Boer J, Covaci A, Alaee M, Birnbaum L, Petreas M, Rose M, Sakai S, Van den Eede N, van der Veen I. 2012. A novel abbreviation standard for organobromine, organochlorine and organophosphorus flame retardants and some characteristics of the chemicals. Environment International 49:57-82.
Bhaskar T, Matsui T, Uddin MA, Kaneko J, Muto A, Sakata Y. 2003. Effect of Sb2O3 in brominated heating impact polystyrene (HIPS-br) on thermal degradation and debromination by iron oxide carbon composite catalyst (fe-C). Appl Catal. B 43(3):229-41.
[BIOWIN] Biodegradation Probability Program for Windows [Estimation Model]. 2010. Version 4.10. Washington (DC): US Environmental Protection Agency, Office of Pollution Prevention and Toxics; Syracuse (NY): Syracuse Research Corporation. [accessed January 2014].
Black, S. 2012. Final Study Report: Pharmacokinetic studies of [14C] decabromodiphenyl ethane (EBP). Submitted to Albermarle. Report Number: RTI/0212983.001.002. RTI International. North Carolina. 36 pp. [restricted access].
Blankinship A, Krueger H. 2003a. A 48-hour static acute toxicity test with the cladoceran (Daphnia magna). Wildlife International, Ltd. Easton, Maryland (USA): Project number 471A-106. [restricted access].
Blankinship A, Krueger H. 2003b. A 96-hour static acute toxicity test with the rainbow trout (Oncorhynchus mykiss). Wildlife International, Ltd. Easton, Maryland (USA): Project number: 471A-107. [restricted access].
Boethling RS, Howard PH, Beauman JA, Larosche ME. 1995. Factors for intermedia extrapolations in biodegradability assessment. Chemosphere 30(4):741-752.
Breitholtz M, Ruden C, Hansson SO, Bengtsson BE. 2006. Ten challenges for improved ecotoxicological testing in environmental risk assessment. Ecotox. and Environ. Safety. 63:324-335.
Bremmer HJ, van Veen MP. 2002. Updated version for ConsExpo 4 [Internet]. Bilthoven (NL): Rijksinstituut voor Volksgezondheid en Milieu (National Institute for Public Health and the Environment). RIVM Report No.: 612810012/2002.
Brommer S, Harrad S, Van den Eede N, Covaci A. 2012. Concentrations of organophosphate esters and brominated flame retardants in German indoor dust samples. J Environ Monit. 14:2482-2487.
Brown T, Wania F. 2008. Screening Chemicals for the Potential to be Persistent Organic Pollutants: A Case Study of Arctic Contaminants Environ. Sci. Technol. 2008, 42, 5202-5209.[BSEF]: Brominated Science Environmental Forum [Internet]. c.2001-2015.[accessed 2015 Jan].
Byer JD, Alaee M, Brown RS, Lebeuf M, Trottier S, Backus S, Blunt S, Jeir M, Jonefal M, Pacapavicius G, et al. 2010. Brominated flame retardants in American eel (a reason for the eel’s decline) [PDF]
Byer JD. 2013. Organohalogenated persistent organic pollutants in American Eel (Anguilla Rostrata) captured in Eastern Canada.[dissertation]. [Kingston (ON)]: Queen’s University. 238 pp.
Cai MG, Hong QQ, Wang Y, Luo XJ, Chen SJ, Cai MH, Qiu CR, Huang SY, Mai BX. 2012. Distribution of polybrominated diphenyl ethers and decabromodiphenylethane in surface sediiments from the Berring Sea, Chukchi Sea, and Canada Basin. Deep-Sea Research II, 81-84:95-101.
Canada. 1999. Canadian Environmental Protection Act, 1999. S.C., 1999, c. 33. Part III. vol. 22, no. 3.
Canada. 2004. Dept. of the Environment. Ministerial Condition No. 13228. Canada Gazette I 138(40):2645-2646. [accessed 2004 Oct]
Canada. 2004. Dept. of the Environment. Canadian Environmental Protection Act, 1999: Announcement of conditions regarding application, use and release of 1,1’-(1,2-ethanediyl)bis(2,3,4,5,6-pentabromo)- substances Canada Gazette, Part I, vol. 138, no. 40 p. 2644-2646. [accessed 2004 Oct 2]
Canada. 2005. Canadian Environmental Protection Act, 1999: New Substances Notification Regulations (Chemicals and Polymers). P.C. 2005-1484. SOR/2005-247. [accessed 2005 August 31]
Canada. 2010. Canada Consumer Product Safety Act [PDF]. S.C. 2010, c. 21. Canada Gazette, Part III, vol. 33, no. 3.
Canada. 2011. Dept. of the Environment. Ministerial Condition No. 16260 [PDF]. Canada Gazette I 145(20):1513-1515. May 14, 2011.
Canada 2013. Dept. of the Environment. Canadian Environmental Protection Act, 1999: Notice with respect to certain organic flame retardant substances [PDF]. Canada Gazette, Part I, vol. 147, no. 13, p. 613-633.
Canada. c.2006-2013. Polybrominated Diphenyl Ethers (PBDEs)- Fact Sheets & Frequently Asked Questions- Chemical Substances [Internet]. [accessed 2015 Jan].
CATALOGIC [Computer Model]. 2012. Version 5.11.13. Bourgas (BG): Bourgas Prof. Assen Zlatarov University, Laboratory of Mathematical Chemistry.
[CCC]. Canada Colours and Chemicals. 2011. FR-1410 Material Safety Data Sheet. Product ID:9311. ICL Industrial Products. Revision Date 2-11-2011. [accessed February 2014].
Cao Z, Xu F, Covaci A, Wu M, Yu G, Wang B, Deng S, Huang J. 2014. Differences in the seasonal variation of brominated and phosphorus flame retardants in office dust. Environment International 65: 100-106.
Cequier E, Ionas AC, Covaci A, Marcé RM, Becher G, Thomsen C. 2014. Occurrence of a broad range of legacy and emerging flame retardants in indoor environments in Norway. Env Sci Tech. 48:6827-6835.
Chemtura. 2005. Material Safety Data Sheet: Firemaster® 2100 and Firemaster® 2100C. Chemtura USA Corporation. MSDS Number: 01129. Effective Date: December 31, 2005.
Chen S, Ma Y, Wang J, Chen D, Luo X, Mai B. 2009. Brominated flame retardants in children’s toys: Concentration, composition, and children’s exposure and risk assessment. Environ Sci Technol. 43:4200-4206.
Chen S, Ma Y, Wang J, Chen D, Luo X, Mai B. 2010a. Response to “Comment on ‘Brominated flame retardants in children’s toys: Concentration, composition, and children’s exposure and risk assessment.’” Environ Sci Technol. 44:1154-1155.
Chen S, Ma Y, Wang J, Tian M, Luo X, Chen D, Luo X, Mai B. 2010b. Measurement and human exposure assessment of brominated flame retardants in household products from South China. J. Hazardous Material 176:979-984.
Chen D, Letcher RJ, Burgess NM, Champoux L, Elliot JE, Hebert CE, Martin P, Wayland M, Weseloh DVC, Wilson L. 2012. Flame retardants in eggs of four gull species (Laridae) from breeding sites spanning Atlantic to Pacific Canada. Environmental Pollution 168:1-9.
[CITI] Chemicals Inspection and Testing Institute. 1991a. Test of biodegradability of Saytex-402 by microorganisms. Kurume Research Laboratories, Chemical Biotesting Center. Test number 11893. [restricted access].
[CITI] Chemicals Inspection and Testing Institute. 1991b. Test on bioaccumulation of Saytex-402 in carp. Kurume Research Laboratories, Chemical Biotesting Center (Japan): Test number 41894. [restricted access].
[CMABFRIP] Chemical Manufacturers Association Brominated Flame Retardant Industry Panel.1997a. Decabromodiphenyl oxide (DBDPO): determination of n-octanol/water partition coefficient. Wildlife International Ltd. Project Number 439C-101, June 16, 1997. [restricted access].
[CMABFRIP] Chemical Manufacturers Association Brominated Flame Retardant Industry Panel. 1997b. Decabromodiphenyl oxide (DBDPO): determination of water solubility. Wildlife International Ltd. Project Number 439C-102, June 1997. [restricted access].
Covaci A, Harrad S, Abdallah M A-E, Ali N, Law RJ,Herzke D, de Wit C. 2011. Novel brominated flame retardants: A review of their analysis, environmental fate and behaviour. Environment International 37:532-556.
[CPOPs] Canadian Persistent Organic Pollutants Profiler Model. 2012. Version 1.1.18. Gatineau (QC): Environment Canada, Existing Substances Division; Bourgas (BG): Bourgas Prof. Assen Zlatarov University, Laboratory of Mathematical Chemistry. [Model developed from Mekenyan et al. 2005].
[DPDDrug Product Database [database]. [modified 2017 Feb 17]. Ottawa (ON): Government of Canada. [accessed 2014 April 24]. https://health-products.canada.ca/dpd-bdpp/index-eng.jsp
Wit CA, Herzke D, Vorkamp K. 2010. Brominated flame retardants in the Arctic environment — trends and new candidates.Science of the Total Environment 408: 2885-2918.
de Wit CA, Kierkegaard A, Ricklund N, Sellström. 2011. Emerging Brominated Flame Retardants in the Environment. In: Brominated flame retardants in the environment. Eds Eljarrat E and Barceló D. The Handbook of Environmental Chemistry.Springer.
Desjardins D, Krueger H. 2003. A 96-hour toxicity test with the freshwater alga (Selenastrum capricornutum). Wildlife International, Ltd. Easton, Maryland (USA): Project number 471A-108A.
Diamond ML, Goosey E, Saini A, Chaudhuri S. 2013. Assessment of the prevalence and exposure to new flame retardants (NFRs) in Canadian indoor environments. Unpublished study prepared for Health Canada under contract. 86 pp.
Dimitrov S, Dimitrova N, Parkerton T, Comber M, Bonnell M, Mekenyan O. 2005. Base-line model for identifying the bioaccumulation potential of chemicals. SAR QSAR Environ Res 16(6):531-554.
Dirtu AC, Ionas IC, Malarvannan G, Covaci A. 2014. Transformation Products of Brominated Flame Retardants (BFRs). In Lambropoulou DA and nollet LML editors 2014. Transformation Products of Emerging Contaminants in the Environment. Analysis, Processes, Occurrence, Effects and Risks. West Sussex, UK: John Wiley and Sons Ltd. 935 pp.
Dirtu AC, Ali N, Van den Eded N, Neels H, Covaci A. 2012. Country specific comparison for profile of chlorinated, brominated and phosphate organic contaminants in indoor dust. Case study for Eastern Romania, 2010. Environ Int 49:1-8.
Dodson RE, Perovich LJ, Covaci A, Van den Eded N, Ionas AC, Dirtu AC, Brody JG, Rudel RA. 2012. After the PBDE Phase-Out: A Broad Suite of Flame Retardants in Repeat House Dust Samples from California. Environ Sci Technol 46:13056-13066.
[EC] European Communities. 2002. European Union risk assessment report. Bis(pentabromophenyl) ether. CAS No.: 1163-19-5. EINECS No.: 214-604-9. Risk assessment. Final report, 2002. France and United Kingdom on behalf of the European Union.
[EC] European Community. 2003. Technical guidance document on risk assessment in support of commission Directive 93/67/EEC on risk assessment for new notified substances and commission regulation (EC) 1488/94 on risk assessment for existing substances and Directive 98/8/EC of the European Parliament and of the Council concerning the placing of biocidal products on the market. Brussels (BE): EC.
[ECHA] European Chemicals Agency. 2010. Guidance on information requirements and chemical safety assessment. Chapter R.16: Environmental exposure estimation. May 2010. Guidance for the implementation of REACH. Helsinki (FI): European Chemicals Agency
[ECHA] European Chemicals Agency. c2007-2013. Registered Substances [database]. Search results for CAS RN [84852-53-9]. Helsinki (FI): ECHA. [updated 2012 Nov 27; accessed 2014 March].
[ECOSAR] Ecological Structure Activity Relationships Class Program [Estimation Model]. 2012. Version 1.11. Washington (DC): US Environmental Protection Agency, Office of Pollution Prevention and Toxics; Syracuse (NY): Syracuse Research Corporation. [accessed January 2014]. Available from:
[EFSA] European Food Safety Authority. 2012. Scientific Opinion on Emerging and Novel Brominated Flame Retardants (BFRs) in Food [PDF]. EFSA Panel on Contaminants in the Food Chain. EFSA Journal 10(10):2908. 125 pp. doi:10.2903/j.efsa.2012.2908.
Egeback AL, Sellstrom U, McLachlan MS. 2012.Decabromodiphenyl ethane and decabromodiphenyl ether in Swedish background air. Chemosphere 86:264-269.
Egloff C, Crump D, Chiu S, Manning G, McLaren KK, Cassone CG, Letcher RJ, Gauthier LT, SW. 2011. In vitro and in ovo effects of four brominated flame retardants on toxicity and hepatic mRNA expression in chicken embryos. Toxicology Letters 207:25-33.
Eljarrat E, Barceló D. editors. 2011. Brominated Flame Retardants. Series: The Handbook of Environmental Chemistry. Volume 16. Heidelberg Berlin: Springer. 290 pp.
Environment Agency. 2007. Environmental risk evaluation report: 1,1'-(Ethane-1,2-diyl)bis[penta-bromobenzene] (CAS: 84852-53-9). Environment Agency, Government of the United Kingdom.
Environment Canada. 2006. Canadian Environmental Protection Act, 1999. Ecological Screening Assessment Report on Polybrominated Diphenyl Ethers (PBDEs) [PDF]. [accessed 2006 June]
Environment Canada. 2010. Ecological State of the Science Report on Decabromodiphenyl Ether (decaBDE)-Bioaccumulation and Transformation [PDF]. [accessed 2010 August]
Environment Canada. c.2006-2013. Risk Management of DecaBDE: Commitment to Voluntary Phase-Out Exports to Canada
Environment Canada. 2013. Wise water use. [accessed 2014 November]
Environment Canada. 2014. Data collected under Environment Canada’s National Fish Contaminants Monitoring and Surveillance Program (2010-2012).Database shared from the Great Lakes Water Quality Monitoring Division to the Ecological Assessment Division.
[ECCC] Environment and Climate Change Canada. 2013-2014. Data for certain organic flame retardants substance grouping collected under the Canadian Environmental Protection Act, 1999, section 71: Notice with respect to certain organic flame retardant substances. Data prepared by: Environment and Climate Change Canada, Health Canada; Existing Substances Program.
[ECCC, HC] Environment and Climate Change Canada and Health Canada. 2019. Supporting documentation: Information in support of the Screening Assessment for Benzene, 1’1-(1,2-ethanediyl)bis [2,3,4,5,6-pentabromo-; Decabromodiphenyl ethane (DBDPE) . Gatineau (QC): ECCC and HC Available on request from: substances@ec.gc.ca
Environment Canada, Health Canada. 2007. Chemical substances: Categorization. Ottawa (ON): Government of Canada. [accessed 2013 July 31]
[EPI Suite] Estimation Programs Interface Suite for Microsoft Windows [Estimation Model] 2000-2012. Version 4.1. Washington (DC): US Environmental Protection Agency, Office of Pollution Prevention and Toxics; Syracuse (NY): Syracuse Research Corporation. [accessed 2014 January]
[ETRMA] European Rubber and Tyre Manufacturer Association. 2010. Tyre and General Rubber Goods Generic Exposure Scenario. Emission Factor Guidance for Formulation and Industrial Use,[Includes SpERC factsheet for ERC 3 and ERC 6d].Prepared for: ETRMA Brussels, Belgium. Prepared by: ChemRisk LLC. Pittsburgh, PA August 4, 2010. Version 2.0.
[ESIS] European Chemical Substances Information System [database on the Internet]. c1995-2012. Joint Research Centre (JRC). [accessed March 2014].
Fernandes A, Smith F, Petch R, Panton S, Carr M, Mortimer D, Tlustos C, Rose M. 2010. The emerging BFRs hexabromobenzene (HBB), bis(2,4,6-tribromophenoxy)ethane (BTBPE), and decabromodiphenylethane (DBDPE) in UK and Irish foods. Abstract from the Fifth International Workshop on Brominated Flame Retardants, April 7-9, 2010, Kyoto, Japan.
Fromme H, Hilger B, Kopp E, Miserok M, Völkel W. 2014. Polybrominated diphenyl ethers (PBDEs), hexabromocyclododecane, (HBCD) and “novel” brominated flame retardants in house dust in Germany. Environment International 64:61-68.
Garcia-Reyero N, Escalon BL, Prats E, Stanley JK, Thienpont B, Melby NL, Barón E, Eljarrat E, Barceló D, Mestres J. et al. 2014. Effects of BDE-209 contaminated sediments on zebrafish development and potential implications to human health. Environnment International 63:216–223.
Gauthier L, Potter D, Hebert C, Letcher RJ. 2009. Temporal Trends and Spatial Distribution of Non-Polybrominated Diphenyl Ether Flame Retardants in the Eggs of Colonial Populations of Great Lakes Herring Gulls. Environ Sci Technol 43(2):312-7.
Gerecke AC, Hartmann PC, Heeb NV, Kohler H-PE, Giger W, Schmid P, Zennegg M, Kohler M. 2005. Anaerobic degradation of decabromodiphenyl ether. Environ Sci Technol 39(4):1078-1083.
Gerecke AC, Giger W, Hartmann PC, Heeb NV, Kohler H-PE, Schmid P, Zennegg M, Kohler M. 2006. Anaerobic degradation of brominated flame retardants in sewage sludge. Chemosphere 64:311-317.
Gobas FA, Kelly BC, Arnot JA. 2003. Quantitative structure activity relationships for predicting the bioaccumulation of POPs in terrestrial food-webs. QSAR Comb Sci 22:329-336.
Goosey E, Abdallah MA, Roosens L, Harrad S, Covaci A. 2009. Dust from UK primary school classrooms and daycare centres: Its significance as a pathway of exposure of young children to perfluoroalkyl compounds (PFCs) and brominated flame retardants (BFRs). Organohalogen Compd 71:436-441.
Great Lakes, 2003. Safety Data Sheet: Firemaster® 2100. Great Lakes ChemicalCorporation. Revision date 18 November 2003.
Guerra P, M Alaee, E Eljarrat and D Barcelo. 2011. Introduction to Brominated Flame Retardants: Commercial Products, Applications, and Physicochemical Properties. In Eljarrat E, Barceló D. editors. 2011. Brominated Flame Retardants. Series: The Handbook of Environmental Chemistry. Volume 16. Heidelberg Berlin:Springer. 290 pp.
Guerra P, Alaee M, Jiménez B, Pacepavicius G, Marvin C, MacInnis G, Eljarrat E, Barceló D,Champoux L, Fernie K. 2012. Emerging and historical brominated flame retardants in peregrine falcon (Falco peregrinus) eggs from Canada and Spain. Environnment International, 40:179-186.
Hardy, ML, Margitich D, Ackerman L, Smith RL. 2002. The subchronic oral toxicity of ethane, 1,2-bis(pentabromophenyl) (Saytex 8010) in rats. Int J Toxicol. 21:165-170.
Hardy ML. 2004. A comparison of the fish bioconcentration factors for brominated flame retardants with their nonbrominated analogues. Environ Toxicol Chem 23:656-661.
Hardy ML, Aufderheide J, Krueger HO, Mathews ME, Porch JR, Schaefer EC, Stenzel JI, Stedeford T. 2011. Terrestrial toxicity evaluation of decabromodiphenyl ethane on organisms from three trophic levels. Ecotox and Environ Safety 74:703-710.
Hardy ML, Krueger HO, Blankinship AS, Thomas S, Kendall TZ, Desjardins D. 2012. Studies and evaluation of the potential toxicity of decabromodiphenyl ethane to five aquatic and sediment organisms. Ecotox and Environ Safety 75:73-79.
Hardy ML, Margitich D, Ackerman L, Smith RL, 2002. The Subchronic Oral Toxicity of Ethane,1,2-Bis(pentabromophenyl) (Saytex 8010) in Rats. International Journal of Toxicology, 21, 165.
Hardy ML, Mercieca MD, Rodwell DE, Stedeford T. 2010. Prenatal developmental toxicity of decabromodiphenyl ethane in the rat and rabbit. Birth Defects Res B Dev Reprod Toxicol. 89(2):139-146.
Harrad S, Ibarra C, Abdallah MA, Boon R, Neels H, Covaci A. 2008. Concentrations of brominated flame retardants in dust from United Kingdom cars, homes, and offices: Causes of variability and implications for human exposure. Environ Int 34:1170-1175.
He MJ, Luo XJ, Chen MY, Sun YX, Chen SJ, Mai BX. 2012. Bioaccumulation of polybrominated diphenyl ethers and decabromodiphenyl ethane in fish from a river system in a highly industrialized area, South China. Sci Total Environ 419:109-115.
Health Canada. 1995. Investigating human exposure to contaminants in the environment: A handbook for exposure calculations. Ottawa (ON): Great Lakes Health Effects Program, Health Protection Branch, Health Canada.
Health Canada. 1998. Exposure factors for assessing total daily intake of priority substances by the general population of Canada. (Unpublished). December 1998. Priority Substances Section, Environmental Health Directorate, Health Canada.
Health Canada. [modified 2017 May 3]. . Ottawa (ON): Health Canada Food Directorate. [accessed 2014 April 24]. /content/canadasite/en/health-canada/services/food-nutrition/food-safety/food-additives/lists-permitted.html
Health Canada. 2014a. CMP survey 2014-2015: Determination of flame retardants in consumer products. Project no. 2014-2048. June 19, 2014.
Health Canada. 2014b. CMP survey 2014-2015: Determination of flame retardants in consumer products. Project no. 2014-2048C2. August 12, 2014.
[HENRYWIN] Henry’s Law Constant Program for Microsoft Windows [Estimation Model]. 2011. Version 3.20 Washington (DC): US Environmental Protection Agency, Office of Pollution Prevention and Toxics; Syracuse (NY): Syracuse Research Corporation. [accessed 2014 July]
Hermanson MH, Isaksson E, Forsstrom S, Teixeira C, Muir DCG, Pohjola VA, Van der Wal RSV. 2010. Deposition history of brominated Flame retardant compounds in an Ice core from Holtedahlfonna, Svalbard, Norway. Environ Sci Technol 2010:7405-7410.
Houde M, Berryman D, de Lafontaine Y, Verrault J. 2014. Novel brominated flame retardantsd and dechloranes in three fish species from the St. Lawrence River, Canada. Sci Total Environ 479-480:48-56.
[HYDROWIN] Hydrolysis Rates Program for Microsoft Windows [Estimation Model]. 2010. Version 2.00 Washington (DC): US Environmental Protection Agency, Office of Pollution Prevention and Toxics; Syracuse (NY): Syracuse Research Corporation. [accessed January 2014].
Ilyas M, Sudaryanto A, Setiawan IE, Riyadi AS, Isobe T, Ogawa S, Takahashi S, Tanabe S. 2011. Characterization of polychlorinated biphenyls and brominated flame retardants in surface soils from Surabaya, Indonesia. Chemosphere 83:783-791.
Ismail N, Bewurtz SB, Pleskach K, Whittle DM, Helm PA, Marvin CH, Tomy GT. 2009. Brominated and chlorinated flame retardants in Lake Ontario, Canada, Lake Trout (Salvelinus Namaycush) between 1979 and 2004 and possible influence of food-web changes. Environ Toxicol Chem 28(5):910-920.
Ismail N, Pleskach K, Marvin C, Whittle M, Keir M, Helm P, Tomy GT. 2006. Temporal trends of flame retardants in Lake Ontario lake trout (1979–2004). Organohalogen Compd 68:1808–1811.
Jakab E, Uddin MdA, Bhaskar T, Sakata Y. 2003. Thermal decomposition of flame-retarded high impact polystyrene. J Anal Appl Pyrolysis 68-69:83-99.
Kajiwara N, Noma Y, Takigami H. 2008. Photolysis studies of technical decabromodiphenyl ether (DecaBDE) and ethane (DeBDethane) in plastics under natural sunlight. Enviro Sci Technol 42:4404-4409.
Kajiwara N, Noma Y, Takigami H. 2011. Brominated and organophosphate flame retardants in selected consumer products on the Japanese market in 2008. J Hazard Mater. 192:1250-1259.
Kalachova K, Hradkova P, Lankova D, Hajslova J, Pulkrabova J. 2012. Occurrence of brominated flame retardants in household and car dust from the Czech Republic. Sci Total Environ 441:182-193.
Karlsson M, Julander A, van Bavel B, Hardell L. 2007. Levels of brominated flame retardants in blood in relation to levels in household air and dust. Environ Int 33:62-69.
Kelly BC, Gobas FAPC, McLachlan MS. 2004. Intestinal absorption and biomagnification of organic contaminants in fish, wildlife and humans. Environ Toxicol Chem 23(10):2324-2336.
Kelly BC, Ikonomou MG, Blair JD, Morin AE, Gobas FAPC. 2007. Food Web–Specific Biomagnification of Persistent Organic Pollutants.Science 317:236-239.
Kemmlein S, Hahn O, Jann O. 2003. Emissions of organophosphate and brominated flame retardants from selected consumer products and building materials. Atmos Environ 37:5485-5493.
Kierkegaard A. 2007. PBDEs in the environment. Time trends, bioaccumulation and the identification of their successor, decabromodiphenyl ethane [doctoral dissertation]. Department of Applied Environmental Science, Stockholm University, Stockholm, Sweden. 68 pp.
Kierkegaard A, Balk L, Tjärnlund U, de Wit CA, Jansson B. 1999. Dietary uptake and biological effects of decabromodiphenyl ether in rainbow trout (Oncorhynchus mykiss). Environ Sci Technol 33:1612-1617.
Kierkegaard A, Bjorkland J, Fridean U. 2004. Identification of the Flame Retardant Decabromodiphenyl Ethane in the Environment. Environ Sci Technol 38:3247-3253.
Kierkegaad A, Sellström U, McLachlan MS. 2009. Environmental analysis of higher brominated diphenyl ethers and decabromodiphenyl ethane. Journal of Chromatography A, 1216:364-375.
Kim M, Guerra P, Alaee M, Smyth SA. 2014. Occurrence and fate of four non-regulated brominated flame retardants in wastewater treatment plants. Environmental Science and Pollution Research 21(23): 13394-13404.
Klasmeier J, Matthies M, MacLeod M, Fenner K, Scheringer M, Stroebe M, Le Gall AC, McKone TE, van de Meent D, Wania F. 2006. Application of multimedia models for screening assessment of long-range transport potential and overall persistence. Environ Sci Technol 40:53-60.
[KLIF] Norwegian Climate and Pollution Agency. 2013. Perfluorinated alkylated substances, brominated flame retardants and chlorinated paraffins in the Norwegian Environment – Screening 2013. Tromso, (Norway): NILU (Norwegian Institute for Air Research) and SWECO Group, 98 pp.
[KOAWIN] Octanol Air Partition Coefficient Program for Microsoft Windows [Estimation Model]. 2010. Version 1.10 Washington (DC): US Environmental Protection Agency, Office of Pollution Prevention and Toxics; Syracuse (NY): Syracuse Research Corporation. [accessed 2014 January]
[KOCWIN] Organic Carbon Partition Coefficient Program for Windows [Estimation Model]. 2010. Version 2.00 Washington (DC): US Environmental Protection Agency, Office of Pollution Prevention and Toxics; Syracuse (NY): Syracuse Research Corporation. [accessed 2014 January]
Kolic TM, Shen L, MacPhersonK, Fayez L, Gobran T, Helm PA, Marvin CH, Arsenault G, Reiner EJ, 2009. The analysis of halogenated flame retardants by GC-HRMS in environmental samples.Journal of Chromatographic Science, 47:83-91.
Konstantinov A, Arsenault G, Chittim B, Kolic T, MacPherson K, McAlees A, McCrindle R, Potter D, Reiner EJ, , Tashiro C, Yeo B. 2006. Characterization of mass-labeled [13C14]-decabromodiphenylethane and its use as a surrogate standard in the analysis of sewage sludge samples. Chemosphere 64:245-249.
[KOWWIN] Octanol-Water Partition Coefficient Program for Microsoft Windows [Estimation Model]. 2010. Version 1.68 Washington (DC): US Environmental Protection Agency, Office of Pollution Prevention and Toxics; Syracuse (NY): Syracuse Research Corporation. [accessed January 2014]
Kuo YM, Sepulveda MS, Sutton TM, Ochoa-Acuna HG, Muir AM, Miller B, and Hua I. 2010. Bioaccumulation and biotransformation of decabromodiphenyl ether and effects on daily growth in juvenile lake whitefish (Coregonus clupeaformis).Ecotoxicology 19(4): 751-60.
Krueger H, Thomas S, Kendall T. 2003a. S8010: A prolonged sediment toxicity test with Chironomus riparius using spiked sediment. Wildlife International, Ltd. Easton, Maryland (USA): Project number 471A-110.
Krueger H, Thomas S, Kendall T. 2003b. S8010: A prolonged sediment toxicity test with Lumbriculus variegatus using spiked sediment with a total of 2% organic carbon. Wildlife International, Ltd. Easton, Maryland (USA): Project number 471A-109.
Lambropoulou DA, Nollet LML. 2014. Outlook. In Lambropoulou DA and Nollet LML editors 2014. Transformation Products of Emerging Contaminants in the Environment. Analysis, Processes, Occurrence, Effects and Risks. West Sussex, UK: John Wiley and Sons Ltd.935 pp.
Law K, Halldorson T, Danell R, Stern G, Gewurtz S, Alaee M, Marvin C, Whittle M, Tomy G. 2006. Bioaccumulation and trophic transfer of some flame retardants in a lake Winnipeg (Canada) food web. Environ Toxicol Chem 25, 2177-2186.
Letcher RJ, Marteinson SC, Fernie KJ. 2014. Dietary exposure of American kestrels (Falco sparverius) to decabromodiphenyl ether (BDE-209) flame retardant: Uptake, distribution, debromination and cytochrome P450 enzyme induction. Environment International 63:182-190.
Lin Y, Ma J, Qiu X, Zhao Y, Zhu T. 2015. Levels, spatial distribution, and exposure risks of decabromodiphenylethane in soils of North China. Environ Sci Pollut Res. 22:13319-13327.
Liu L-Y, Salamova A, Hites RA. 2014. Halogenated flame retardants in baby food from the United States and from China and the estimated dietary intakes by infants. J Environ Sci Technol. 48:9812-9818.
[LNHPD] Licensed Natural Health Products Database [database]. [modified 2016 Aug 10]. Ottawa (ON): Government of Canada. [accessed 2014 April 24].
Ma Y, Salamova A, Venier M, Hites RA. 2013. Has the phase-out of PBDEs affected their atmospheric levels? Trends of PBDEs and their replacements in the Great Lakes atmosphere. Environ Sci Technol. 47:11457-11464.
Mallory V.1988a. Acute exposure oral toxicity. Report no. PH 402-ET-001-88. Decabromodiphenylethane. Lot #SH-6427-49. Unpublished.
Mallory V.1988b. Acute exposure dermal toxicity. Report no. PH 422-ET-001-88. Decabromodiphenylethane. Lot #SH-6427-49. Unpublished.
Mallory V. 1988c. Primary dermal irritation study in rabbits. Report no. PH 420-ET-001-88. Decabromodiphenylethane. Lot #SH-6427-49. Unpublished.
Mallory V.1988d. Primary eye irritation study in rabbits. Report no. PH 421-ET-001-88. Decabromodiphenylethane. Lot #SH-6427-49. Unpublished.
Mannetje A, Coakley J, Bridgen P, Brooks C, Harrad S, Smith AH, Pearce N, Douwes J. 2013. Current concentrations, temporal trends and determinants of persistent organic pollutants in breast milk of New Zealand woman. Science of the Total Environment 458-460:399-407.
Margitich DL. 1992. Subchronic 90 day oral toxicity study in rats. PH 470-ET-001-91. Saytex 402.Lot#23-014-2A. Waverly, PA: Pharmakon Research International, Inc.
Margitich D. 1991. 28 day toxicity study in rats. Report no. PH 436-ET-002-90. Saytex°R 402. Lot #23-014-2A. Unpublished.
Mayer P, Reichenberg F. 2006. Can highly hydrophobic organic substances cause aquatic baseline toxicity and can they contribute to mixture toxicity? Environ Tox and Chem 25(10):2639-2644.
McCarty LS, Mackay D. 1993. Enhancing ecotoxicological modeling and assessment: critical body residues and modes of toxic action. Environ Sci Technol 27:1719-1728.
McCarty LS, Arnot JA, Mackay D. 2013. Evaluation of critical body residue for acute narcosis in aquatic organisms. Environ Sci Technol 32(10).
McKinney M, Dietz R, Sonne C, De Guise S, Skirnisson K, Karlsson K, Steingrimsson E, Letcher RJ. 2011a. Comparative hepatic microsomal biotransformation of selected PBDES, including Decabromodiphenyl ether, and Decabromodiphenyl ethane flame retardants in Arctic marine-feeding mammals. Environ Sci Technol 30(7): 1506-1514.
McKinney M, Letcher RJ, Aars J, Born EW, Branigan M, Dietz R,Evans TJ, Gabrielsen GW, Peacock E, Sonne C. 2011b. Flame retardants and legacy contaminants in polar bears from Alaska, Canada, East Greenland and Svalbard, 2005–2008. Environment International 37:365-374.
Mekenyan G, Dimitrov SD, Pavlov TS, Veith GD. 2005. POPs: A QSAR system for creating PBT profiles of chemicals and their metabolites. SAR QSAR Environ Res 16(1–2):103-133.
Melymuk L, Robson M, Csiszar S, Helm P, Kaltenecker G, Backus S, Bradley L, Gilbert B, Blanchard P, Jantunen L, Diamond M. 2014. From the City to the Lake: Loadings of PCBs, PBDEs, PAHs and PCMs from Toronto to Lake Ontario. Environ Sci Technol 48: 3732−3741.
Mercieca MD. 1992a. Developmental toxicity (teratology) study in rats with Saytex°R 402. SLS Study No. 3196.24. Unpublished.
Mercieca MD. 1992b. Developmental toxicity (teratology) study in rabbits with Saytex°R 402. SLS Study No. 3196.26. Unpublished.
Meyer T, Muir DCG, Teixeira C, Wang X, Young T. 2012. Deposition of brominated flame retardants to the Devon Ice Cap, Nunavut, Canada. Environ Sci Technol 46: 826-833.
MG Chemicals. 2011. Material Safety Data Sheet Code: 833FRB - Part B Name: Epoxy - Flame Retardant.MG Chemicals. Revision Date 4-11-2011. [accessed February 2014].
[MPBPWIN] Melting Point Boiling Point Program for Microsoft Windows [Estimation Model]. 2010. Version 1.43 Washington (DC): US Environmental Protection Agency, Office of Pollution Prevention and Toxics; Syracuse (NY): Syracuse Research Corporation. [accessed 2014 January]
Mo L, Wu JP, Luo XJ, Zou FS, Mai BX. 2012. Bioaccumulation of polybrominated diphenyl ethers, decabromodiphenyl ethane, and 1,2-bis(2,4,6-tribromophenoxy) ethane flame retardants in kingfishers (alcedo atthis) from an electronic waste-recycling site in south china. Environ Tox and Chem 31(9):2153-2158.
Mo l, Wu JP, Luo XJ, Li KL, Peng Y, Feng AH, Zhang Q, Zou FS, Mai BX. 2013. Using the kingfisher (alcedo atthis) as a bioindicator of PCBs and PBDEs in the Dinghushan biosphere reserve, China. Environ Tox and Chem 32(7):1655-1662.
Mochungong P, Abbasi G, Diamond ML, Zhu J. 2014. Polybrominated diphenyl ethers and alternative brominated flame retardants in furniture and electric and electronic devices collected from the Greater Toronto Area, Canada. Unpublished manuscript. 20 pp.
Muir DCG, Teixeira CF, Epp J, Young T, Wang X, Keir M, S. Backus. 2011. Bioaccumulation of Selected Halogenated Organic Flame Retardants in Remote Lakes and in the Great Lakes. Poster presented at SETAC.
Nadjia L, Abdelkader Elaziouti, Ulrich Maschke, and Bekka Ahmed. 2014. Spectroscopic behaviour of saytex 8010 under UV-visible light and comparative thermal study with some flame retardant. Journal of Photochemistry and Photobiology A: Chemistry 275:96-102.
Nakari T, Huhtala S. 2010. In vivo and in vitro toxicity of decabromodiphenyl ethane, a flame retardant. Environ Tox 25(4):333-338.
[New EQC] Centre for Environmental Modelling and Chemistry [New Equilibrium Criterion Model]. 2012. Version 1.0 (Beta). Peterborough (ON): Trent University, Canadian Environmental Modelling Centre. [accessed 2014 May]
Newton PE. 2003. A sensitization study (maximization method) of Saytex 8010 in guinea pigs. Study No. 972-001. MPI Research, Inc., Mattawan, Michigan. Unpublished.
[NCI] National Chemical Inventories [database on a CD-ROM]. 2009. Columbus (OH): American Chemical Society, Chemical Abstracts Service. [accessed 2010 June].
[NHPID] . [modified 2017 June 21]. Ottawa (ON): Government of Canada. [accessed 2014 April 24]. http://webprod.hc-sc.gc.ca/nhpid-bdipsn/search-rechercheReq.do?lang=eng
[NHW] Department of National Health and Welfare. 1990. Present patterns and trends in infant feeding in Canada. Ottawa: NHW. Catalogue Number H39-199/1990E. ISBN 0-662-18397-5. 9 pp. [cited in Health Canada 1998].
Nichols JW, Fitzsimmons PN, Burkhard LP. 2007. In vitro – in vivo extrapolation of quantitative hepatic biotransformation data for fish. II. Modeled effects on chemical bioaccumulation. Environ Toxicol Chem 26:1304-1319.
Nordic Co-operation. 2011. Brominated Flame Retardants (BFR) in the Nordic Environment [PDF]. TemaNord 2011:528 [86pp.].
Norris B, Smith S. 2002. Research into the mouthing behaviour of children up to 5 years old [PDF]. London, England: Consumer and Competition Policy Directorate, Department of Trade and Industry, London, UK. Cited in US EPA (2011: Exposure Factors Handbook).
Noyes PD, Hinton DE, and Stapleton, HM. 2011. Accumulation and debromination of decabromodiphenyl ether (BDE-209) in juvenile fathead minnows (Pimephales promelas) induces thyroid disruption and liver alterations. Toxicological Sciences 122(2):265-74.
Noyes PD, Lema SC, Macaulay LJ,Douglas NK,Stapleton HM. 2013. Low Level Exposure to the Flame Retardant BDE-209 Reduces Thyroid Hormone Levels and Disrupts Thyroid Signaling in Fathead Minnows. Environ Sci Technol 47:10012-10021.
Nyholm JR, Grabic R, Arp HPH, Moskeland T, Andersson PL. 2013. Environmental occurrence of emerging and legacy brominated flame retardants near suspected sources in Norway. Science of the Total Environment 443:307-314.
[OECD] Organisation for Economic Co-operation and Development. 1995. Selected brominated flame retardants (Risk Reduction Monograph No. 3, OECD Environment Monograph Series No. 102) [PDF], Paris
[OECD] Organization for Economic Co-operation and Development. 2000. Series on Testing and Assessment. No. 23. Guidance document on aquatic toxicity testing of difficult substances and mixtures [PDF]. Paris (FR): OECD, Environment Directorate. 53 pp.
[OECD] Organisation for Economic Co-operation and Development. 2004. Emission scenario document on textile finishing industry [PDF] Paris (FR): OECD, Environment Directorate. Report No: ENV/JM/MONO(2004)12, JT00166691 . [accessed 2014 February]
[OECD] Organisation for Economic Co-operation and Development. 2009. Emission scenario document on plastics additives [PDF]. Paris (FR): OECD, Environment Directorate. (Series on Emission Scenario Documents No. 3). Report No.: ENV/JM/MONO(2004)8/REV1. JT03267870 [accessed 2014 February].
OECD QSAR Toolbox. [Read across tool]. 2012. Version 3.0. Paris (FR): Organisation for Economic Co-oporation and Development, Environment Directorate.OECD Quantitative Structure-Activity Relationships Project [(Q)SARs]
Orihel D. Bisbicos T, Darling CTR, Dupuis AP, Williamson M, Muir DCG. 2016. Probing the debromination of the flame retardant decabromodiphenyl ether in sediments of a boreal lake. Environ. Toxicol. Chem. 35:573-583.
Papa E, Kovarich S. Gramatica P. 2010. QSAR modeling and prediction of the endocrine-disrupting potencies of brominated flame retardants. Chem. Res. Toxicol. 23:946-954.
Petreas M, Park JS, Wang M, Wang Y, Guo W, Tarrant D, Rhee A, Harwani S. 2012. The California Biomonitoring Program: Persistent organic pollutants in archived and contemporary serum. Global NEST J 1:80-85.
Porch J, Krueger H. 2005. S8010: A toxicity test to determine the effects of the test substance on seedling emergence of six species of plants. Wildlife International, Ltd. Easton, Maryland (USA): Project number 471-101A.
Putman DL. 1992. Chromosome aberrations in Chinese hamster lung (CHL) cells. Report no. T9499.227025. Saytex°R 402. Unpublished.
Puype F, Samsonek J, Knoop J, Egelkraut-Holtus M, Ortliebb M. 2015. Evidence of waste electrical and electronic equipment (WEEE) relevant substances in polymeric food-contact articles sold on the European market. 2015. Food Additives and Contaminants: Part A 32(3):410-426.
Qi H, Li W-L, Liu L-Y, Zhang Z-F, Zhu N-Z, Song W-W, Ma W-L, Li Y-F. 2014. Levels, distribution and human exposure of new non-BDE brominated flame retardants in the indoor dust of China. Environmental Pollution 195:1-8.
Qin X, Xia X, Xia Z, Yang Z., Yan S, Zhao Y, Wei R, Li Y, Tian M, Zhao X, Qin Z, and Xu X. 2010. Thyroid disruption by technical decabromodiphenyl ether (DE-83R) at lowconcentrations in Xenopus laevis. Jof Environmental Sciences 22(5):744-751.
Remberger M, Kaj L, Hansson K, Bibi M, Brorström-Lundén E, Haglund P, Liljelind P, Bergek S, Andersson R, Kitti-Sjöström R. 2014. Screening of Emerging Brominated Flame Retardants (BFRs) and Polybrominated dibenzofurans (PBDFs). IVL Swedish Environmental Research Institute Ltd. IVL Report B2110. 49 pp. + 6 appendices.
Ricklund N, Kierkegaard A, McLachlan MS. 2008. An international survey of decabromodiphenyl ethane (deBDethane) and decabromodiphenyl ether (decaBDE) in sewage sludge samples. Chemosphere, 73:1799-1804.
Sakuratani Y, Noguchi Y, Kobayashi K, Yamada J, Nishihara T. 2008. Molecular size as a limiting characteristic for bioconcentration in fish. J Environ Biol. 29(1):89-92.
Sahlström L, Sellström U, de Wit CA. 2012. Clean-up method for determination of established and emerging brominated flame retardants in dust. Anal Bioanal Chem 404:459-466.
Salamova A, Hites RA. 2010. Evaluation of Tree Bark as a Passive Atmospheric Sampler for Flame Retardants, PCBs, and Organochlorine Pesticides. Environ Sci Technol 44:6196-6201.
Salamova A, Hites RA. 2011. Discontinued and alternative brominated flame retardants in the Atmosphere and precipitation from the Great lake basin. Environ Sci Technol 45:8698-8706.
Sample BE, Opresko DM, Suter II GW. 1996. Toxicological Benchmarks for Wildlife: 1996 Revision.Health Sciences Research Division, Oak Ridge Tennessee. Submitted to United States Department of Energy. Contract No. DE-AC05-84OR21400.
San RH. Wagner VO. 1991.Salmonella/mammalian-microsome plate incorporation mutagenicity assay (Ames test) and Escherichia coli WP2 uvrA reverse mutation assay. Report no. Saytex°R 402. Unpublished.
Schaefer EC, Carpernter K. 2010. Saytex 8010 : An evaluation of Inherent Biodegradability using the CONCAWE Test. Wildlife International Ltd. Project No. 471E-104. Draft OECD Guideline 302D. Wildlife International Ltd., Maryland. 45pp
Schaefer EC, Matthews ME. 2011. Saytex 8010 : Biodegradation in anaerobic digester sludge. Wildlife International Ltd. Project No. 471E-105. OECD Guideline 314C. Wildlife International Ltd., Maryland. 56pp.
Schenker U, MacLeod M, Scheringer M, Hungerbuhler K. 2005. Improving data quality for environmental fate models: A least-squares adjustment procedure for harmonizing physicochemical properties of organic compounds. Environ Sci Technol 39: 8434-8441.
Scheringer M, MacLeod M, Wegmann F. 2006.The OECD POV and LRTP Screening Tool Version 2.0 [PDF]. Organisation for Economic Cooperation and Development; Zurich (CH): Swiss Federal Institute of Technology. Distributed at OECD/UNEP Workshop on Application of Multimedia Models for Identification of Persistent Organic Pollutants, Ottawa, Canada, May 31 – June 2, 2006.
Schreder, ED, La Guardia, MJ. 2014. Flame Retardant Transfers from U.S. Households (Dust and Laundry Wastewater) to the Aquatic Environment. Environ Sci Technol 48:11575-11583.
She YZ, Wu JP, Zhang Y, Peng Y, Mo L, Luo XJ, Mai BX. 2013. Bioaccumulationof polybrominated diphenyl ethers and several alterantive flame retardants in a small herbivorous foodchain. Environmental Pollution 174:164-170.
Shi T, Chen SJ, Luo XJ, Zhang XL, Tang CM, Luo Y, Ma YJ, Wu JP, Peng XZ, Mai BX. 2009. Occurrence of Brominated Flame Retardants other than Polybrominated Diphenyl Ethers in Environmental and Biota Samples from Southern China. Chemosphere 74:910–916.
[SPIN] Substances in Preparations in Nordic Countries [database]. 2006. Copenhagen (DK): Nordic Council of Ministers. [accessed 2001 March]. Available from:
Stankowski LF. 1998. Ames/Salmonella plate incorporation assay. Report no. PH301-ET- 001-88. Decabromodiphenylethane (DBDPE). Lot #SH-6427-49. Unpublished.
Stapleton HM, Alaee M, Letcher RJ, Baker JE. 2004. Debromination of the flame retardantdecabromodiphenyl ether by juvenile carp (Cyprinus carpio). Environ Sci Technol 38:112-119.
Stapleton HM, Allen JG, Kelly SM, Konstantinov A, Klosterhaus S, Watkins D, McClean MD, Webster TF. 2008. Alternate and new brominated flame retardants detected in U.S. house dust. Environ Sci Technol 42:6910-6916.
Stenzel JI, Schaefer EC 2015a. DBDPEthane: Aerobic Transformation in Soil. Wildlife International Project No: 471E-106 submitted to Albemarle Corporation. [restricted access].
Stenzel JI, Schaefer EC. 2015b. DBDPEthane: Aerobic and Anaerobic Transformation in Aquatic Sediment Systems. Wildlife International Project No: 471E-107 submitted to Albemarle Corporation. [restricted access].
Stenzel JI, Schaefer EC. 2015c. DBDPEthane: Anaerobic Transformation in Soil. Wildlife International Project No: 471E-108 submitted to Albemarle Corporation. [restricted access].
Stieger G, Scheringer M, Ng CA, Hungerbühler K. 2014. Assessing the persistence, bioaccumulation potential and toxicity of brominated flame retardants: Data availability and quality for 36 alternative brominated flame retardants. Chemosphere 116:118-123.
Strid A, Smedje G, Athanassiadis I, Lindgren T, Lundgren H, Jakobsson K, Bergman A. 2014. Brominated flame retardant exposure of aircraft personnel. Chemosphere 116:83-90.
Sun RB, Xi ZG, Yan J, Yang HL. 2012. Cytotoxicity and apoptosis induction in human HepG2 hepatoma cells by decabromodiphenyl ethane. Biomed Environ Sci. 25(5):495-501.
Takigami H, Suzuki G, Hirai Y, Ishikawa Y, Sunami M, Sakai S. 2009. Flame retardants in indoor dust and air of a hotel in Japan. Environ Int 35:688-693.
Tian M, Chen S-J, Wang J, Tian S, Luo X-J, Mai B-X. 2011. Atmospheric deposition of halogenated flame retardants at urban, e-waste, and rural locations in southern China. Environ Sci Technol. 45:4696-4701.
Tlustos C, Fernandes A, Rose M. 2010. The emerging BFRs - hexabromobenzene (HBB), bis(2,4,6-tribromophenoxy)ethane (BTBPE) and decabromodiphenylethane (DBDPE) – in Irish foods. Organohalogen Compd. 72:1577-1579.
Tolls J, Muller M, Willing A, Steber, J. 2009. A new concept for the environmental risk assessment of poorly soluble compounds and its application to consumer products. Integrated Environmental Assessment and Management. 5(3):374-378.
Toms, L-ML, Hearn L, Sjödin A, Mueller JF. 2011. Introduction to Brominated Flame Retardants: Commercially Products, Applications, and Physicochemical Properties. In Eljarrat E, Barceló D. editors. 2011. Brominated Flame Retardants. Series: The Handbook of Environmental Chemistry. Volume 16. Heidelberg Berlin:Springer. 290 pp.
Tue NM, Takahashi S, Suzuki G, Isobe T, Viet PH, Kobara Y, Nobuyasu S, Zhang G, Sudaryanto A, Tanabe S. 2013. Contamination of indoor dust and air by polychlorinated biphenyls and brominated flame retardants and relevance of non-dietary exposure in Vietnamese informal e-waste recycling sites. Environ Int 51:160-167.
[US EPA] United States Environmental Protection Agency. 1993. Wildlife Exposure Factors Handbook: Volume I. EPA/600/R-93/187a. Office of Research and Development.
[US EPA] U.S. Environmental Protection Agency. 2011. Exposure factors handbook: 2011 edition . National Center for Environmental Assessment, Washington, DC; EPA/600/R-09/052F. Available from the National Technical Information Service, Springfield, VA, and online at http://www.epa.gov/ncea/efh
[US EPA] US Environmental Protection Agency. 2012. Chemical Data Reporting [database]. Washington (DC): US EPA, Office of Pollution Prevention and Toxics. Search results for CAS RN [84852-53-9]. [ accessed 2014 February]].
[US EPA] US Environmental Protection Agency. 2014. An alternative assessment for the flame retardant decabromodiphenyl ether (DecaBDE) (final report) [PDF]. 901 pp.
Valls-Cantenys C, Villaverde-de-Sáa E, Rodil R, Benito Quintanab J, Iglesias M, Salvadóa V, Celab R. 2013. Application of polydimethylsiloxane rod extraction to the determination of sixteen halogenated flame retardants in water samples. Analytica Chimica Acta 770:85-93.
Van Hoven RL, Glassbrook N, Nixon WB. 2002. Determination of the vapor pressure of Saytex 8010 using the spinning rotor gauge method. Wildlife International Ltd. Project number: 471C-102 submitted to Albemarle Corporation. [restricted access].
Van Hoven RL, McGregor JA, Nixon WB. 1999a. Saytex 8010: Determination of water solubility by the generator column method. Wildlife International Ltd. Project number: 471C-101 submitted to Albemarle Corporation. [restricted access].
Van Hoven RL, McGregor J A, Nixon W B. 1999b. Saytex 8010: Determination of the noctanol/water partition coefficient by the generator column method. Wildlife International Ltd. Project number: 471C-103 submitted to Albemarle Corporation. [restricted access].
[VCCLAB] Virtual Computational Chemistry Laboratory. 2005. ALOGPS 2. [accessed 2013 October
Vernier M, Hites R. 2008. Flame Retardants in the Atmosphere near the Great Lakes. Environ Sci Technol 42:4745-4751.
Venier M, Audy A, Vojta S, Bečanová J, Romanak K, Melymuk L, Krátká M, Kukučka P, Okeme J, Saini A, et al. 2016. Brominated flame retardants in the indoor environment — Comparative study of indoor contamination from three countries. Environment International 94:15-160.
Venier M, Dove A, Romanak K, Backus S, Hites R. 2014. Flame Retardants and Legacy Chemicals in Great Lakes’ Water. Environ Sci Technol 48(16):9563-72.
Venier M, Wierda M, Bowerman M, Hites RA. 2010. Flame retardants and organochlorine pollutants in bald eagle plasma from the Great Lakes region. Chemosphere 80:1234-1240.
Wan Y, Zhang K, Dong Z, Hu J. 2013. Distribution is a major factor affecting bioaccumulation of decabrominated diphenyl ether: Chinese sturgeon (Acipenser sinensis) as an example. Environ Sci Technol 47(5):2279-86.
Wang F, Wang J, Wang J, Mai B, Dai J. 2011. Response to comment on "comparative tissue distribution, biotransformation and associated biological effects by decabromodiphenyl ethane and decabrominated diphenyl ether in male rats after a 90-day oral exposure study". Environ Sci Technol. 45(11):5062-3.
Wang J, Ma Y-J, Chen S-J, Tian M, Luo X-J, Mai B-X. 2010. Brominated flame retardants in house dust from e-waste recycling and urban areas in South China: Implications on human exposure. Environ Int. 36:535-541.
Wang F, Wang J, Dai J, Hu G, Wang J, Luo X, and Mai B. 2010. Comparative tissue distribution, biotransformation, and associated biological effects by decabromodiphenyl ethane and decabrominated diphenyl ether in male rats after a 90-Day oral exposure study. Environ Sci Technol 44(14):5655-5660.
Wang J, Chen S, Nie X, Tian , Luo X, An T, Mai, B. 2012. Photolytic degradation of decabromodiphenyl ethane (DBDPE).Chemosphere 89(7):844-9.
Wania F. 2006. Potential of degradable organic chemicals for absolute and relative enrichment in the Arctic. Environ Sci Technol 40:569–577.
Watanabe I, Sakai S. 2003.Environmental release and behavior of brominated flame retardants.Environment International 29:665-682.
[WATERNT] Water Solubility Program [Estimation Model]. 2010. Version 1.01Washington (DC): US Environmental Protection Agency, Office of Pollution Prevention and Toxics; Syracuse (NY): Syracuse Research Corporation. [accessed 2014 January
Webster E, Mackay D, Di Guardo A, Kane D,and Woodfine D. 2004. Regional differences in chemical fate model outcome. Chemosphere 55:1361-1376.
Wei H, Aziz-Schwanbeck AC, Zou Y, Corcoran MB, Poghosyan A, Li A, Rockne KJ, Christensen ER, Sturchio NC. 2012. Polybromodiphenyl ethers and decabromodiphenyl ethane in aquatic sediments from Southern and Eastern Arkansas, United States. Environ Sci Technol 46: 8017-8024.
Weil ED, Levchik, SV, 2009. Flame Retardants for Plastics and Textiles: Practical Applications. Cincinnati, Ohio: Hanser Publishers. 297 pp.
Weisbrod AV, Woodburn KB, Koelmans AA, Parkerton TF, McElroy AE, Borgå K. 2009. Evaluation of bioaccumulation using in vivo laboratory and field studies. Integr Environ Assess Manag 5(4):598-623.
Wilson R, Jones-Otazo H, Petrovic S, Mitchell I, Bonvalot Y, Williams D, Richardson GM. 2013. Revisiting Dust and Soil Ingestion Rates Based on Hand-to-Mouth Transfer.
[WSKOWWIN] Water Solubility for Organic Compounds Program for Microsoft Windows [Estimation Model].2010. Version 1.42Washington (DC): US Environmental Protection Agency, Office of Pollution Prevention and Toxics; Syracuse (NY): Syracuse Research Corporation. [accessed 2014 January]
Wu JP, Guan YT, Zhang Y, Luo XJ, Zhi H, Chen SJ , Mai BX. 2010. Trophodynamics of Hexabromocyclododecanes and Several Other Non-PBDE Brominated Flame Retardants in a Freshwater Food Web. Environ Sci Technol (44):5490-5495.
Xanthos M, Todd DB. 2004. Plastics Processing. Encyclopedia of Polymer Science and Technology.
Xiao R, Adolfsson-Erici M, Åkerman G, McLachlan MS, MacLeod M. 2013. A benchmarking method to measure dietary absorption efficiency of chemicals by fish. Environ Toxicol Chem 32: 2695-2700.
Yang R, Wei H, Guo J, Li A. 2012. Emerging Brominated Flame retardants in the sediment of the Great Lakes. Environ Sci Technol 46:3119-3126.
Zhang XL, Luo XJ, Chen SJ, Wu JP, Mai BX. 2009. Spatial distribution and vertical profile of polybrominated diphenyl ethers, tetrabromobisphenol A, and decabromodiphenylethane in river sediment from an industrialized region of South China. Environmental Pollution 157:1917-1923.
Zheng J, Luo XJ, Yuan JG, Wang J, Wang YT, Chen SJ, Mai BX, Yang ZY. 2011. Levels and sources of brominated flame retardants in human hair from urban, e-waste, and rural areas in South China. Environ Pollut 159:3706-3713.
Zhou SN, Reiner EJ, Marvin C, Helm P, Riddell N, Dorman F, Misselwitz M, Shen L, Crozier P, MacPherson K, et al. 2010a. Development of liquid chromatography atmospheric pressure chemical ionization tandem mass spectrometry for analysis of halogenated flame retardants in wastewater. Anal Bioanal Chem 396:1311-1320.
Zhou SN, Reiner EJ, Marvin C, Kolic T, Riddell N, Helm P, Dorman F, Misselwitz M, Brindle ID, 2010b. Liquid chromatography atmospheric pressure photoionization tandem mass spectrometry for analysis of 36 halogenated flame retardants in fish. Journal of Chromatography A, 1217, 633-641.
Zhou SN, Buchar A, Siddique S, Takser L, Abdelouabab N, Zhu J. 2014. Measurements of selected brominated flame retardants in nursing women: implications for human exposure. Environ. Sci. Technol. 48:8873-8880.
Zhu L, Ma B, Hites R. 2009. Brominated flame retardants in serum from the general population in northern China. Environ. Sci. Technol. 43(18):6963-6968.
Appendix A. Structural identity
| CAS RN | Other selected namesa |
|---|---|
| 84852-53-9 | Benzene, 1,1'-(1,2-ethanediyl)bis[2,3,4,5,6-pentabromo- (TSCA, ASIA-PAC, NZIoC) 1,1'-(ethane-1,2-diyl)bis[pentabromobenzene] (EINECS) 1,2-Bis(2,3,4,5,6-pentabromophenyl)ethane ;1,2-Bis(pentabromophenyl)ethane; Decabromodiphenylethane; Decabromodiphenylethylene Decadiphenyl 8010; Ethylenebis(pentabromobiphenyl); Ethylenebispentabromobenzene; 1,2,3,4,5-pentabromo-6-[2-(2,3,4,5,6-pentabromophenyl)ethyl]benzene; 2,2',3,3',4,4',5,5',6,6'-Decabromobibenzyl; Ethane 1,2-bis(pentabromophenyl);BDPE-209; DBDiPhEtb;DBDE; EBPE; DeBrPylE, EPB FCP 801; Firemaster 2100; Firemaster 2100C; Planelon BDE; RDT 3; S 8010; SAYTEX 8010; CG 801; PBB-209; SLFR-2; SAYTEX 4010 Flame Retardant; SAYTEX 4010 ZD; SAYTEX 402 Flame Retardant (no longer marketed); SAYTEX 8010 Flame Retardant; SAYTEX 8010 ZD; Netguard 8010; NNN® Br-971, Ecoflame B-971, YCFR-03, DBDPE/RDT-3, FR-1410 |
a Names acquired from the National Chemical Inventories (NCI 2009), ECHA (c. 2007-2013) (accessed March 6, 2014), Bergman et al. 2012, etc.
Selection of analogues
Decabromodiphenyl ether (decaBDE) represents a close structural analogue, and is considered appropriate for analysis of certain physical-chemical properties alongside DBDPE data, (see Appendix B for Experimental Value Adjustment (EVA)) and Least Squared Means description). DecaBDE, is discussed throughout the assessment in comparisons of substance behaviour with DBDPE (e.g., degradation, long-range transport, bioaccumulation potential, ecotoxicity etc.). However, it is noted that differences in molecular makeup, dimensions, and configurations exist that may affect the manner in which molecules interact with their environment, including interactions with membranes, receptors or enzymes, and solvents (2014 manufacturer communication to Environment Canada; unreferenced, Albermarle 2016). For example, according to a chemical manufacturer, DecaBDE exists as a single 3-dimensional conformer, arranged in space such that the aromatic rings are orthogonal (approximately perpendicular) to one another with a 120° bend at the oxygen bridge, whereas DBDPEs ethane bridge creates enough separation between the two fully substituted aromatic rings that the molecule can assume several 3-dimensional configurations, each with its own molecular dimensions. DBDPE’s most stable conformer is folded at an acute angle at the ethane bridge resulting in a shorter molecular length than DecaBDE. Nevertheless, DBDPE molecular volume, surface area and cross sectional diameter are larger than DecaBDE (2014 manufacturer communication to Environment Canada; unreferenced, Albermale 2016). In comparing the two substances, DBDPE’s ethane bridge between the aromatic rings (rather than the ether bridge in decaBDE) is expected to make it slightly more hydrophobic than of decaBDE, and is expected to introduce more conformational flexibility in the molecule (Covaci et al. 2011). As reported in Albermarle (2016), DBDPE requires a higher energy for debromination than decaBDE.
Appendix B. Physical and chemical properties
Some modelled Kow and water solubility values for DBDPE were determined using the experimental value adjustment (EVA) option in KOWWIN 2010. This approach estimates Kow and/or water solubility for a queried chemical (i.e., DBDPE) by comparing its structure to that of an analogue chemical that has an empirical value (i.e., decaBDE). The empirical value for the analogue is quantitatively adjusted to consider the influence that structural differences have on Kow and/or water solubility when the two chemicals are compared. Read across of the empirical values of analogue decaDBE were also considered for water solubility, log Kow, and vapour pressure, to include in geometric mean calculations with other DBDPE data.
Physical and chemical properties of DBDPE were checked for internal consistency according to the Least-Squares Adjustment Procedure (LSA) (Schenker et al. 2005). To conduct this, the geometric mean or arithmetic mean of available values for each physical and chemical parameter (vapour pressure, water solubility, octanol solubility, log Kow, log Koa, log Kaw) was entered into the model. Sub-cooled values were used for vapour pressure, water solubility, and octanol solubility. The values used to determine the geo and aritmentic (for log partition coefficients) means represent the most reliable and independent values available from empirical data, modelling, and analogues (Table B-1; for all physical-chemical values see Table B-2). In determining internal consistency of the properties, the LSA model also produces predicted values. Generally, DBDPE is characterized by very low water solubility, low to very low vapour pressure, and very high Koc and Kow values. While experimental based estimates for log Kow, water solubility, and vapour pressure exist for DBDPE, there remains uncertainty with these values (e.g. Stieger 2014). For the purposes of this assessment, the log Kow value of 9.89, representing the geomentric mean value checked with least squares adjustment method, was selected. This value is slightly higher than that of close analogue, decaBDE (8.7) (Environment Canada 2010), but slightly lower than the value determined from the EVA method using analogue decaBDE (10.23). To maintain internal consistency of physical chemical values, the least squares adjustment method value for water solubility and vapour pressure were also considered. The large percent (%) adjustment of the octanol solubility value after checking with LSA indicates that it is likely that this original input value is greatly underestimated. Were no value included for this variable in the LSA, the resulting log Kow would be greater than 10. Final selected values are summarized in Table B-1.
| Data source | Vapour pressure (Pa) | Water solubility (mol/m3) | Octanol solubility (mol/m3) | Log Kow | Log Kaw | Log Koa |
|---|---|---|---|---|---|---|
Experimental DBDPE |
1.00 x10⁻⁴ | 7.41 x10⁻⁷ | 1.96 x10⁻³i | ND | ND | ND |
Experimental DBDPE |
ND | ND | 8.75 x10⁻⁴i | ND | ND | ND |
Read Across decaBDE |
4.63 x10⁻⁶ | 1.04 x10⁻⁷ | ND | 8.7 | ND | ND |
EVA decaBDE |
ND | 4.23x10⁻⁹ | ND | 10.23 | ND | ND |
Episuite Model (no inputs) |
2.11 x10⁻¹² | 1.19x10⁻¹⁵a | ND | 13.64 | -5.58 | 19.22c |
Episuite Model |
ND | 1.0 x 10⁻⁹b | ND | ND | ND | 14.28d |
Episuite Model |
ND | ND | ND | ND | ND | 15.81e |
Episuite Model |
ND | ND | ND | ND | ND | 13.44f |
| VCC/AGLOGs | ND | 2.21 x10⁻⁵ | ND | 7.86 | ND | ND |
| ACD/Percepta | ND | 5.0 x10⁻⁹ | ND | 10.63 | ND | ND |
Geomean/ Meang LSA Input Values (sub-cooled value) |
9.92 x10⁻⁸ (1.46x10⁻⁴) |
1.72 x10⁻⁹h (2.52E-6) |
0.00131 (1.92)i |
10.21 | -5.58 | 15.69h |
| LSA Output Values (sub-cooled value) | 5.59 x10⁻¹⁰ (8.21x10⁻⁷) |
8.34 x10⁻⁹ (1.22x10⁻⁵) |
64.1 (9.41x10⁴) |
9.89 | -4.57 | 14.45 |
| % value adjustment | -99% | 385% | 4.88 x10⁶% | 53% | 929% | -94% |
Abbreviations: ND, no data
a WSKOWWIN 2010.
b WATERNT 2010 (fragment method).
c KoaWin 2010 using log Kow 13.64 from KOWWIN (no inputs).
d KoaWin 2010 using log Kow 8.7.
e KoaWin 2010 using log Kow 10.23 from EVA decaBDE).
f KoaWin 2010 using log Kow 7.86.
g Calculated arithmetic mean for logged values is equivalent to geometric mean for antilog values (of partition coefficients). In LSA, all input values =default 1 for estimated variance, except octanol solubility=3, due to high uncertainty with octanol solubility data.
h In order to maximize independence of parameter estimates, model values reliant on user log Kow value (e.g., water solubility from WSKOWWIN, other than default) were not included in the calculation of water solubility geomean. However, KoaWin was run with all log Kow values, as the model was the only source of Koa data (to avoid skewing Koa towards a single log Kow value).
i All data sources in Table B-2 (note unit conversions), other than octanol solubility [personal communication, Manufacturer unpublished report, presented to Ecological Assessment Division (Environment Canada), 2013; unreferenced]. Individual listed values are solid state values, however Water solubility, Vapour Pressure, and Octanol solubility inputs were “subcooled liquid values” (Shenker al. 2005) by dividing by fugacity ratio for DBDPE. The subcooled LSA Input and Output values are in brackets beneath the solid state values.
| Property | Type | Valuea | Temperature (°C) | Reference |
|---|---|---|---|---|
| Physical state | Experimental | white/off-white powder | N/A | Albermarle 2008 |
| Melting point (ºC) | Experimental | (>)345§ | N/A | Chemtura 2005, Albermarle 2008 |
| Melting point (ºC) | Experimental | 351-355 | N/A | Great Lakes 2003 |
| Melting point (ºC) | Experimental | 350 | N/A | Albermarle 2001 |
| Melting point (ºC) | Modelled | 259.71 | N/A | MPBPWIN 2010 |
| Boiling point (ºC) | Experimental | Irrelevant; expected to degrade before boiling | N/A | Environment Agency 2007 |
| Boiling point (ºC) | Modelled | 600.86 | N/A | MPBPWIN 2010 |
| Density (kg/m3) | Experimental | 868 (0.868 g/mL) |
25 | Albemarle 2001 |
| Density (kg/m3) | Packed density | 3250 (3.25 g/cm3) | 25 | Albemarle 2001 |
| Density (kg/m3) | Aerated density | 1760 (1.760 g/mL) | 25 | Albemarle 2001 |
| Vapour pressure (Pa) | Experimental | <1 x 10⁻⁴ Pa | 20 | European Commission 2002, Van Hoven et al. 2002 (Spinning rotor gauge) |
| Vapour pressure (Pa) | Modelled | 2.11 x 10⁻¹² (1.58x 10⁻¹⁴ mmHg)c |
25 | MPBPWIN 2010 (Modified Grain method) |
| Vapour pressure (Pa) | Modelled | 1.35 x 10⁻¹¹ (1.01 x 10⁻¹³ mmHg) |
25 | MPBPWIN 2010 (MacKay method) |
| Vapour pressure (Pa) | Modelled | 2.85 x 10⁻¹⁶ (2.14 x 10⁻¹⁸ mmHg)c |
25 | MPBPWIN 2010 (Antoine method) |
| Vapour pressure (Pa) | Modelled | ~1 x 10⁻⁶ | 25 | Environment Agency 2007 |
| Vapour pressure (Pa) | Modelled | 5.59 x10⁻¹⁰ (subcooled liquid : 8.21 x 10⁻⁷)§ |
25 | Least-Squares Adjustment Method (LSA) Schenker et al. 2005 |
| Henry’s Law constant (Pa·m3/mol) | Modelled | 6.51 x10⁻³§ (6.42 x10⁻⁸ atm m3/mol) (logKaw= -5.58) |
25 | HENRYWIN 2011 (Bond method) |
| Henry’s Law constant (Pa·m3/mol) | Modelled | 2.98 x 10⁻³ (2.94 x10⁻⁸ atm m3/mol) |
25 | HENRYWIN 2011 (Group Method) |
| Henry’s Law constant (Pa·m3/mol) | Modelled | 6.7 x 10⁻² (6.16 x10⁻⁹ atm m3/mol), (logKaw= 4.57) |
25 | (VP/WSg), LSA (Schenker et al. 2005) |
| Log Kow (dimensionless) | Experimental/ Estimated | ~3.55 (considered estimate based on uncertainty, not reliable) |
25 | Van Hoven et al. 1999b |
| Log Kow (dimensionless) | Modelled | 13.64 | 25 | KOWWIN 2010 |
| Log Kow (dimensionless) | Modelled | 10.23c | 25 | KOWWIN 2010 Experimental Value Adjusted (EVA) |
| Log Kow (dimensionless) | Modelled | 7.86 | 25 | ALOGPS 2.1 VCCLAB 2005 |
| Log Kow (dimensionless) | Modelled | 10.63 | 25 | ACD/Percepta 1997-2012 |
| Log Kow (dimensionless) | Modelled | 9.89g§ | 25 | LSA (Schenker et al. 2005) |
| Log Koc (dimensionless) | Modelled | 6.38 (MCI method) | 25 | KOCWIN 2010 |
| Log Koc (dimensionless) | Modelled | 8.58 d§ (Kow method) | 25 | KOCWIN 2010 |
| Log Koa (dimensionless) | Modelled | 19.22 | 25 | KOAWIN 2010 |
| Log Koa (dimensionless) | Modelled | 15.44d§ | 25 | KOAWIN 2010 |
| Log Koa (dimensionless) | Modelled | 14.45g | 25 | LSA (Schenker et al. 2005) |
| Water solubility (mg/L) | Experimental | ~7.2 x 10⁻⁴ (~0.72 μg/L) | 25 | Van Hoven et al. 1999a (generator column) |
| Water solubility (mg/L) | Modelled | 9.71 x 10⁻⁷ (fragment method) | 25 | WATERNT 2010 |
| Water solubility (mg/L) | Modelled | 2.16 x 10⁻⁸c | 25 | WSKOWWIN 2010 |
| Water solubility (mg/L) | Modelled | 3.85 x 10⁻⁹d | 25 | WSKOWWIN 2010 |
| Water solubility (mg/L) | Modelled | 7.34 x 10⁻¹⁰f | 25 | WSKOWWIN 2010 |
| Water solubility (mg/L) | Modelled | 2.15 x 10⁻² | 25 | ALOGPS 2.1 VCCLAB 2005 |
| Water solubility (mg/L) | Modelled | 4.11 x 10⁻⁶e | 25 | WATERNT (EVA) 2010 |
| Water solubility (mg/L) | Modelled | 5.0 x 10⁻⁹ | 25 | ACD/Percepta 1997-2012 |
| Water solubility (mg/L) | Modelled | 8.10 x 10⁻⁶g§ (subcooled liquid: 1.19 x 10⁻²) | 25 | LSA (Schenker et al. 2005) |
Abbreviations: log Kow, octanol-water partition coefficient; log Koc, organic carbon-water partition coefficient; log Koa, octanol-air partition coefficient; pKa, acid dissociation constant; N/A, not applicable.
§ Indicates selected value for modelling.
a Values in parentheses represent the original ones as reported by the authors or as estimated by the models.
b Bulk Density.
c Used log Kow = 8.7 (from read across decaBDE analogue).
d Used log Kow = 9.89 (LSA).
e Used water solubility = 1.0 x 10⁻⁴ mg/L (max from decaBDE analogue (<1.0 x 10⁻⁴ mg/L)).
f Used log Kow =10.23 (from EVA of decaBDE analogue log Kow).
g For Least Squares Method (LSA); see Table B-1 for list of input values used.
| Property | Type | Value | Reference |
|---|---|---|---|
| Vapour pressure (Pa) | Experimental | 4.63 x 10⁻⁶ (21 °C) | EC 2002 |
| Vapour pressure (Pa) | Experimental | < 133.32(250 °C) | OECD 1995 |
| Log Kow dimensionless) | Experimental | 8.7 (6.27– 9.7 | Environment Canada 2010, EC 2002 CMABFRIP 1997a |
| Log Kow (dimensionless) | Experimental | 6.265 (25 °C) | MacGregor and Nixon 1997 |
| Water solubility (mg/L) | Experimental | 0.02-0.03 (20-30 µg/L)<0.1 ug/L | OECD 1995 |
Appendix C. DBDPE potential transformation products modelling: physical-chemical properties, degradation, bioaccumulation, and aquatic toxicity
| BDPE degradation productsa | MW (g) b | Log Kowb | PBDEsc | MW (g)d | Log Kowe |
|---|---|---|---|---|---|
nonaBDPEs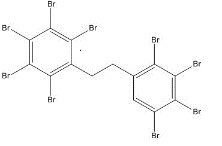 |
892.33 | 9.0 | nonaBDEs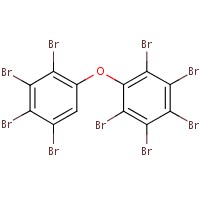 |
880.4 | 7.8 |
octaBDPEs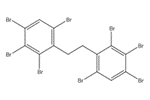 |
813.4 | 8.11 | octaBDEs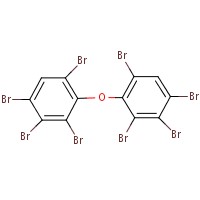 |
801.4 | 6.9 |
heptaBDPEs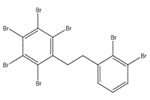 |
734.5 | 7.22 | heptaBDEs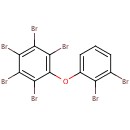 |
722.3 | 6.0 |
hexaBPDEs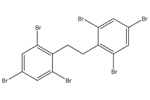 |
655.6 | 6.33 | hexaBDEs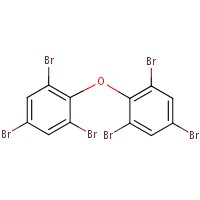 |
643.6 | 5.1 |
pentaBPDEs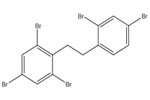 |
576.8 | 5.44 | pentaBDEs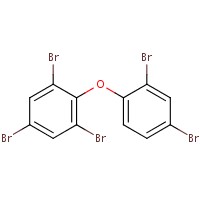 |
564.7 | 4.3 |
a Smiles for nonaBDPEs from Catalogic (2012); remainder of BDPEs generated on the basis of modifying PCBs congeners using: www.epa.gov/osw/hazard/tsd/pcbs/pubs/congenertable.pdf as structure source. Generated BDPE congener Smiles codes were verified in EPI drawing program.
b Estimated from EPISUITE models (2002-2012). Kow estimated by KOWWIN v 1.68 (2010) using the EVA method with a reference log Kow of 9.89 for DBDPE.
c Selected from Chem ID Plus (accessed Dec 2014), to match BDPE congeners.
d Values from PBDE Screening Assessment (Environment Canada 2006).
e Values from Ecological State of the Science Decabromodipheny ether (Environment Canada 2010).
| Degradation product | MW (g/mol) | Log Kowa | Water solubility (mg/L)b | Smiles (representative)c,d |
|---|---|---|---|---|
| DBDPE | 971.23 | 9.89 | 8.10 x 10⁻⁶ | c1(c(c(c(c(c1Br)CCc2c(c(c(c(c2Br)Br)Br)Br)Br)Br)Br)Br)Br |
| nonaBDPEs | 892.33 | 9.0 | 8.92 x10⁻⁷ | Brc1cc(CCc2c(Br)c(Br)c(Br)c(Br)c2Br)c(Br)c(Br)c1Br |
| octaBDPEs | 813.44 | 8.11 | 3.06 x10⁻⁶ | BrC1=C(C(Br)=C(Br)C(Br)=C1)CCC2=C(Br)C=C(Br)C(Br)=C2Br |
| heptaBDPEs | 734.54 | 7.22 | 1.63 x10⁻⁵ | BrC1=C(C(Br)=C(Br)C(Br)=C1Br)CCC2=CC=CC(Br)=C2Br |
| hexaBPDEs | 655.64 | 6.33 | 8.55 x10⁻⁵ | BrC1=C(C(Br)=CC(Br)=C1)CCC2=C(Br)C=C(Br)C=C2Br |
| pentaBPDEs | 576.75 | 5.44 | 4.4 x10⁻⁴ | BrC1=C(C(Br)=CC(Br)=C1)CCC2=CC=C(Br)C=C2Br |
| Hydroxylated DBDPE | 987.27 | 8.35 | 1.05 x10⁻⁵ | OC(Cc1c(Br)c(Br)c(Br)c(Br)c1Br)c1c(Br)c(Br)c(Br)c(Br)c1Br |
| Hydroxylated nonaBPDEs | 908.33 | 8.52 | 1.65 x10⁻⁵ | Oc1c(Br)c(Br)c(CCc2c(Br)c(Br)c(Br)c(Br)c2Br)c(Br)c1Br |
| Brominated phenyl acids | 940.33 | 4.83 | 2.33 x 10⁻⁴ | OC(=O)C(Br)=C(Br)C(Br)=C(CCc1c(Br)c(Br)c(Br)c(Br)c1Br)C(=O)Br |
a EVA based on DBDPE log Kow value (KOWWIN 2010).
b Water solubility value from WATNT (2010) model, except DBDPE (see Table B-2)
c Smiles for nona and hydroxylated and brominated phenyl acids from Catalogic (2012); remainder of BDPEs generated on the basis of modifying PCBs congeners using: www.epa.gov/osw/hazard/tsd/pcbs/pubs/congenertable.pdf as structure source. Generated BDPE congener Smiles codes were verified in EPI drawing program.
d Single smiles code selected for presentation purposes from list of several different Smiles per brominated species; however, QSAR modeling was run using representative smiles of an “extreme” configurations (unbalanced distribution of bromine atoms) and “balanced” configurations (balanced distribution of bromine atoms) for each congener. The only modelling differences reported among different bromine configurations for the same congener were for photolytic degradation (AOPWIN), but differences were minor.
| Degradation product | Log Kowa | Atmospheric oxidation (AOPWIN v. 1.92) predicted half-life | Biodegradation (Biowin v. 4.10 SubModels 3, 4, 5, 6) and extrapolated half-life | Ozone reaction (AOPWIN v.1.92) predicted half-life | Hydrolysis (HYDROWIN v. 2) predicted half-life |
|---|---|---|---|---|---|
| nonaBDPEs | 9.0 | 4.27 days | ‘Does not biodegrade fast’ to ‘Recalcitrant’ | n/ab | n/ab |
| octaBDPEs | 8.11 | 4.093 days | Does not biodegrade fast’ to ‘Recalcitrant’ | n/ab | n/ab |
| heptaBDPEs | 7.22 | 3.925 days | Does not biodegrade fast’ to ‘Recalcitrant’ | n/ab | n/ab |
| hexaBPDEs | 6.33 | 3.071 days | Submodels, 3 5,6: Does not biodegrade fast’ to ‘Recalcitrant’, submodel 4 (primary degradation): ‘months’ | n/ab | n/ab |
| pentaBPDEs | 5.44 | 2.224 daysa | Submodels 3 5,6: Does not biodegrade fast’ to ‘Recalcitrant’, submodel 4 (primary degradation): ‘months’; | n/ab | n/ab |
| Hydroxylated DBDPE | 8.35 | 1.098 days | Does not biodegrade fast’ to ‘Recalcitrant’; | n/ab | n/ab |
| Hydroxylated nonaBPDEs | 8.51 | 2.809 days | Does not biodegrade fast’ to ‘Recalcitrant’; | n/ab | n/ab |
| Brominated phenyl acids | 4.83 | 2.955 days | Submodels, 3 5,6: Does not biodegrade fast’ to ‘Recalcitrant’, submodel 4 (primary degradation): ‘months’; | 79.323 days | Hydrolyzable Function detected: Acyl Halides; Acyl halides react readily (some violently) with water to yield the parent acid and hydrogen halide. Hydrolysis half-lives are less than 10 minutes (or faster). |
a Depending on arrangement of Br atoms, pentaDBPE half-life in air ranges from less than 2 days (i.e. 1.5 days) to greater than 2 days.
b Model does not provide an estimate for this type of structure.
Similar to parent DBDPE, it is expected the DBDPE transformation products are moderately well covered by the BIOWIN biodegradation models used to estimate degradation. However, there appears to be poor coverage of DBDPE transformation products by CPOPs (2012) models (most transformation products are less than 30% within structural domain). For this reason, biodegradation predictions from CPOPs/Catalogic are not included in the assessment for transformation products.
The BCF and BAF of potential DBDPE transformation products were estimated using both structure-based models and a three trophic level kinetic mass-balance model. All estimates of BCF and BAF, except sub-model 1 of the BCFBAF model in EPIWIN v4.1, were corrected for metabolism because it represents a fundamental elimination pathway for many chemicals. This correction was performed by deriving metabolism rate constants (kM) using a structure-based QSAR method.
Most predicted DBDPE transformation products meet criteria to be considered “in domain” for the Arnot-Gobas mass-balance model; the substances meet the mechanistic and global parameter criteria of: being a neutral organic (except hydroxylated nonaBDPEs and brominated phenyl acids), having a molecular weight less than ~ 1200, as well as having a log Kow of less than 9 (except for nonBDPE). There appears to be poor coverage of DBDPE transformation products by CPOPs models (most transformation products are less than 40% within structural domain). For this reason, bioaccumulation predictions from CPOPs/Catalogic are not included in the assessment.
| Degradation Product | MW (g) | Log Kowa | Predicted BCF (no metabolism) (L/kg w-w) | Predicted BCFb Mid-trophic level fish (metabolism) (L/kg w-w) | Predicted BAFb Mid-trophic level fish (metabolism) (L/kg w-w) | Predicted kMb (1/day) (100 g fish, 15 degree C) |
|---|---|---|---|---|---|---|
| octaBDPEs | 813.4 | 8.11 | 3803 | 466.8 | 165600 | 0.016 |
| heptaBDPEs | 734.5 | 7.22 | 108380 | 1790 | 17600 | 0.025 |
| hexaBPDEs | 655.6 | 6.33 | 6975 | 3510 | 44210 | 0.039 |
| pentaBPDEs | 576.8 | 5.44 | 1804 | 2756 | 5636 | 0.062 |
| hydroxylated DBDPE | 987.27 | 8.35 | 1610 | 98.31 | 16380 | 0.047 |
| hydroxylated nonaBPDEs | 908.3 | 8.52 | 2394 | 38.9 | 4042 | 0.083 |
| brominated phenyl acids | 940.3 | 4.83 | 3.16 | 693.9 | 738.5 | 0.271 |
a Estimated using KOWWIN v 1.68 (2010) using the EVA method with a reference log Kow of 9.89 for DBDPE. Note that nonaBDPE was not included since at log Kow=9, substance exceeds cut-off for training set chemicals in model.
b Estimated from BCFBAF v 3.01(2008).
| Common name | Test organism | Endpoint | Value (mg/L) | Reference |
|---|---|---|---|---|
| nonaBDPEs | fish, Daphnia magna, green algae, etc. | acute and chronic | NES | ECOSAR v. 1.11 |
| octaBDPEs | fish, Daphnia magna, green algae, etc. | acute and chronic | NES | ECOSAR v. 1.11 |
| heptaBPDEs | Daphnia magna, fish, mysid saltwater | ChV | 7.3 x10⁻¹¹ to 6.75x10⁻⁶ (NES for remaining tests) | ECOSAR v. 1.11 |
| hexaBDPEs | Daphnia magna, fish, mysid saltwater, green algae (acute and chronic) | ChV, 96 h EC50 | 9.72 x10⁻¹⁰ to 0.00080 (NES for remaining tests) | ECOSAR v. 1.11 |
| pentaBDPEs | green algae, Daphnia magna, fish, mysid saltwater | ChV, 96 h LC50 | 1.27x10⁻⁸ to 0.002 (NES for remaining tests) | ECOSAR v. 1.11 |
| hydroxylated DBDPE (neutral organic) | fish, Daphnia magna, green algae | ChV | 2.02 x 10⁻⁷ to 7.3 x 10⁻⁵ (NES for remaining tests) | ECOSAR v. 1.11 |
| hydroxylated DBDPE (enzyl alcohols) | fish, Daphnia magna | ChV | 2.92 x 10⁻⁷ to 1.05 x10⁻⁴ (NES for remaining tests) | ECOSAR v. 1.11 |
| hydroxylated nonaBDPEs (neutral organic /Phenols) | fish, Daphnia magna, green algae, etc. | acute and chronic | NES | ECOSAR v. 1.11 |
| brominated phenyl acid (halo acids) | fish | ChV | 0.000186 | ECOSAR v. 1.11 |
| brominated phenyl acid (vinyl/allyl aalides-acid) | fish | ChV | 9.44x10⁻⁶ | ECOSAR v. 1.11 |
| brominated phenyl acid (neutral organic) | fish, Daphnia magna | ChV, 96 h LC50, 48 h LC 50 | 0.000191 to 0.000992 | ECOSAR v. 1.11 |
a All values estimated from ECOSAR v 1.11 (2012) using physical-chemical properties in Table D-2.
b NES- No effects at saturation, ChV-Chronic value, LC- Lethal concentration.
Appendix D. Estimates of daily intake of DBDPE by various age groups within the general population in Canada
| Route of Exposure | 0–6 moa(breast milk fed)b | 0–6 moa (formu-la fed)c | 0–6 moa (not formula fed)d | 0.5–4 yre | 5–11 yrf | 12–19 yrg | 20–59 yrh | 60+ yri |
|---|---|---|---|---|---|---|---|---|
| Ambient airj | <0.0001 | <0.0001 | <0.0001 | <0.0001 | <0.0001 | <0.0001 | <0.0001 | <0.0001 |
| Indoor airk | <0.0001 | <0.0001 | <0.0001 | <0.0001 | <0.0001 | <0.0001 | <0.0001 | <0.0001 |
| Drinking waterl | N/A | <0.0001 | <0.0001 | <0.0001 | <0.0001 | <0.0001 | <0.0001 | <0.0001 |
| Foodm | 0.006 | 0.0004 | 0.0003 | 0.0007 | 0.0006 | 0.0003 | 0.0002 | 0.0002 |
| Dustn | 0.056 | 0.056 | 0.056 | 0.029 | 0.011 | 0.0004 | 0.0004 | 0.0004 |
| Soilo | N/A | N/A | N/A | 0.023 | 0.017 | 0.0006 | 0.0006 | 0.0005 |
| Total intake | 0.062 | 0.056 | 0.056 | 0.053 | 0.029 | 0.0013 | 0.0012 | 0.0011 |
Abbreviations: N/A, not applicable; mo, months; yr, years.
a Assumed to weigh 7.5 kg, to breathe 2.1 m3 of air per day, to drink 0.8 L of water per day (formula fed) or 0.3 L/day (not formula fed, respectively (Health Canada 1998), and to ingest 38 and 0 mg of dust and soil per day, respectively (Wilson et al. 2013).
b Exclusively for breast milk-fed infants, assumed to consume 0.742 L of breast milk per day(Health Canada 1998), and breast milk is assumed to be the only dietary source. The concentration for whole (breast) milk of 0.061 µg/L was on the basis of a reported 95th percentile of 0.059 ng/g wet weight [ww] x 1.03 g/ml (density of breast milk) identified from 105 samples of human breast milk collected in 2008-2009 from adult nursing women in Sherbrooke, Quebec. The 95th percentile value = 3.3 ng/g lw x 1.8% geometric mean lipid% = 0.059 ng/ng = µg/kg whole milk (Zhou et al. 2014; personal communication from EHSRB, Health Canada, to ESRAB, Health Canada dated May 15, 2014).
c Exclusively for formula-fed infants, assumed to drink 0.8L of water per day (Health Canada 1998), where water is used to reconstitute formula. No monitoring data on DBDPE in formula were identified; therefore dietary intakes are only those from water. See footnote on water for details.
d Exclusively for not formula-fed infants, assumed to drink 0.7 L of water per day (Health Canada 1998), and approximately 50% of non-formula-fed infants are introduced to solid foods by 4 months of age, and 90% by 6 months of age (NHW 1990).
e Assumed to weigh 15.5 kg, to breathe 9.3 m3 of air per day, to drink 0.7 L of water per day, to consume 54.7 g of fish per day, and 162.2 g of cereal products per day (Health Canada 1998), and to ingest 41 and 14 mg of dust and soil per day, respectively (Wilson et al. 2013).
f Assumed to weigh 31.0 kg, to breathe 14.5 m3 of air per day, to drink 1.1 L of water per day, to consume 89.8 g of fish per day, and 290.1 g of cereal products per day (Health Canada 1998), and to ingest 31 and 21 mg of dust and soil per day, respectively (Wilson et al. 2013).
g Assumed to weigh 59.4 kg, to breathe 15.8 m3 of air per day, to drink 1.2 L of water per day, to consume 97.3 g of fish per day, and 320.9 g of cereal products per day (Health Canada 1998), and to ingest 2.2 and 1.4 mg of dust and soil per day, respectively (Wilson et al. 2013).
h Assumed to weigh 70.9 kg, to breathe 16.2 m3 of air per day, to drink 1.5 L of water per day, to consume 111.7 g of fish per day, and 248.4 g of cereal products per day (Health Canada 1998), and to ingest 2.5 and 1.6 mg of dust and soil per day, respectively (Wilson et al. 2013).
I Assumed to weigh 72.0 kg, to breathe 14.3 m3 of air per day, to drink 1.6 L of water per day, to consume 72.9 g of fish per day, and 229.0 g of cereal products per day (Health Canada 1998), and to ingest 2.5 and 1.5 mg of dust and soil per day, respectively (Wilson et al. 2013).
j No monitoring data of ambient air in Canada were identified. The 95th percentile for Cleveland, Ohio (22 pg/m3 + 1.96 x 13 pg/m3 = 47.5 pg/m3) was used for deriving upper-bounding estimates of daily intake for ambient air exposure. Concentration of DBDPE from this urban location was considered to be representative for Canada. Canadians are assumed to spend 3 hours outdoors each day (Health Canada 1998).
k A study of DBDPE measured in indoor air in 23 homes in Toronto, Canada during 2013 and reported concentrations ranging from not detected to 74 pg/m3 (0.074 ng/m3) (Venier et al. 2016). The maximum concentration of 0.074 ng/m3 reported in the Canadian residential study (Venier et al. 2016) was selected for deriving upper-bounding estimates of daily intake for indoor air exposure. Canadians are assumed to spend 21 hours indoors each day (Health Canada 1998).
l No monitoring data of drinking water in Canada were identified. The highest mean concentrations of DBDPE (10.8 pg/L), measured in Lake Ontario (Venier et al. 2014), was selected for deriving upper-bounding estimates of daily intake for drinking water exposure.
m No monitoring data on marketed foods in Canada were identified; however, data on two baby food categories were identified for samples collected in the U.S (Liu et al. 2014). DBDPE maximum concentrations in formula (28.6 pg/g ww) and cereal (48.8 pg/g ww) from the U.S. were selected for deriving upper-bounding estimates of daily intake for exposure to infant formula and cereal products, respectively. Environmental fish data were also available. The highest concentration on a fresh weight basis of 0.44 µg/kg ("fresh" or "wet" weight) based on 1/2 MDL (MDL = 0.1 ng/g lw) X 8.78% lipid in Whitefish from Lake Winnipeg (Law et al. 2006) was selected for deriving upper-bounding estimates of daily intake for exposure to all fish-related food items in the fish food group. Although, the highest concentration reported was 3.3 ng/g lw in Burbot from Lake Winnipeg (see Section 10.1.1.5), this converted to 0.011 µg/kg fish based on a 0.33 lipid % content in this species. Amounts of foods consumed on a daily basis by each age group over 12 food groups were obtained from the 1970–1972 Nutrition Canada Survey (Health Canada 1998).
n The maximum concentration of DBDPE (11070 ng/g dust) from 20 homes in Boston, Massachusetts (Stapleton et al. 2008) was selected for deriving upper-bounding estimates of daily intake for dust exposure. Recent Canadian data for 35 homes and 10 offices in Toronto showed a maximum level of 5500 ng/g DBDPE in dust (Abbasi et al. 2016). The data from Boston were still considered for deriving upper-bound estimates.
o No monitoring data of soil in North America were identified. Therefore, the maximum soil predicted environmental concentration (PEC) of 25.3 µg/g dw (25.3 mg/kg dw) was selected for deriving upper-bounding estimates of daily intake for soil exposure.
Appendix E. DBDPE concentrations in products available to consumers
| Product category | Product type | Sample size | Limit of detection | Concentration | Reference |
|---|---|---|---|---|---|
| Toys | Foam toy | 7 | 0.3% wt. in sample | ND | Health Canada 2014a, b |
| Toys | Plastic Toy | 2 | 0.3% wt. in sample | ND | Health Canada 2014a, b |
| Toys | Foam chair (children’s) | 1 | 0.3% wt. in sample | ND | Health Canada 2014a, b |
| Toys | Textile Playtent | 2 | 0.3% wt. in sample | ≥ 0.5% wt. in sample (≥ LOQ) | Health Canada 2014a, b |
| Furniture | Nursing pillow | 2 | 0.3% wt. in sample | ND | Health Canada 2014a, b |
| Furniture | Crib mattress | 1 | 0.3% wt. in sample | ND | Health Canada 2014a, b |
| Furniture | Polyurethane foam (PUF) upholstery– cars | 18 | Not determined (signal-to-noise ratio of 3 used instead) | ND | Mochungong et al. 2014 |
| Furniture | PUF upholstery – home | 9 | Not determined (signal-to-noise ratio of 3 used instead) | ND | Mochungong et al. 2014 |
| Furniture | Fabric upholstery –cars | 12 | Not determined (signal-to-noise ratio of 3 used instead) | ND | Mochungong et al. 2014 |
| Furniture | Fabric upholstery – home | 2 | Not determined (signal-to-noise ratio of 3 used instead) | ND | Mochungong et al. 2014 |
| Other Objects | Rubber/ plastic items | 5 | 0.3% wt. in sample | ND | Health Canada 2014a, b |
| Other Objects | Purple textile | 1 | 0.3% wt. in sample | ND | Health Canada 2014a, b |
| Other Objects | White foam | 1 | 0.3% wt. in sample | ND | Health Canada 2014a, b |
| Other Objects | Unknown composition (picture) | 1 | 0.3% wt. in sample | ND | Health Canada 2014a, b |
| Toys | Hard plastic toy | 30 (80% detection frequency) | "...ranged from 0.00005 to 0.050 µg/g." | ND-117 µg/g; Mean = 9.17; Median = 5.54 | Chen et al. 2009 |
| Toys | Foam toy | 18 (89% detection frequency) | "...ranged from 0.00005 to 0.050 µg/g." | ND-5.69 µg/g; Mean = 1.32; Median = 0.72 | Chen et al. 2009 |
| Toys | Rubber/Soft plastic toy | 15 (40% detection frequency) | "...ranged from 0.00005 to 0.050 µg/g." | ND-7.55 µg/g; Mean = 1.14; Median = ND | Chen et al. 2009 |
| Toys | Stuffed toy | 6 (0% or 50% detection frequency - See NOTE) | "...ranged from 0.00005 to 0.050 µg/g." | ND (or ND-0.26 µg/g); See NOTE. | Chen et al. 2009 (NOTE: Supplementary tables for Chen et al. (2009) provided conflicting info: Table S2 shows a range of ND-0.26 µg/g, whereas Table S5 shows ND for all 6 samples). |
| TVs | TV Casing | 20 | "…ranged from 0.5 to 25 ng/g" (0.0005 to 0.0025 µg/g) | ND-268.23 µg/g; Mean = 30.15 µg/g; (33.3% detection frequency) | Chen et al. 2010b |
| Computers | Computer display casing | 4 | "…ranged from 0.5 to 25 ng/g" (0.0005 to 0.0025 µg/g) | ND | Chen et al. 2010b |
| Computers | Computer component (computer printed circuit boards (n = 4) and computer accessories (key board and mouse, n = 4)) | 8 | "…ranged from 0.5 to 25 ng/g" (0.0005 to 0.0025 µg/g) | ND-66.02 µg/g; Mean = 15.06 µg/g; (50% detection frequency | Chen et al. 2010b |
| Computers | Computer monitor casing | 13 | Not determined (signal-to-noise ratio of 3 used instead) | ND-0.1 mg/g | Mochungong et al. 2014 |
| Computers | Computer accessories casing | 11 | Not determined (signal-to-noise ratio of 3 used instead) | ND | Mochungong et al. 2014 |
| Cars | Car interior (plastic interiors and seat PUF and textile coating) | 5 | "…ranged from 0.5 to 25 ng/g" (0.0005 to 0.0025 µg/g) | ND-1.41 µg/g; Mean = 0.28 µg/g; (20% detection frequency) | Chen et al. 2010b |
| Furniture | Sofa, mattress, pillow, and carpet padding | 7 | "…ranged from 0.5 to 25 ng/g" (0.0005 to 0.0025 µg/g) | ND | Chen et al. 2010 b |
| LCD TV | Rear Plastic Cover | 2 | NS | NA, 130 µg/g | Kajiwara et al. 2011 |
| LCD TV | Front Plastic Cover | 2 | NS | NA, 92 µg/g | Kajiwara et al. 2011 |
| LCD TV | Power Board | 1 | NS | 1.1 µg/g | Kajiwara et al. 2011 |
| LCD TV | Printed Circuit (PC) board for fluorescent tube (and power supply) | 2 | NS | 0.77, 2.4 µ/g | Kajiwara et al. 2011 |
| LCD TV | Other PC boards | 2 | NS | 0.036, 0.38 µg/g | Kajiwara et al. 2011 |
| LCD TV | LCD Panel | 2 | NS | NA | Kajiwara et al. 2011 |
| Laptop Computer | Chassis | 1 | NS | 0.67 µg/g | Kajiwara et al. 2011 |
| Keyboard top | 1 | NS | NA | Kajiwara et al. 2011 | |
| PC boards | 1 | NS | 0.037 µg/g | Kajiwara et al. 2011 | |
| Cooling fan and speaker | 1 | NS | 19 µg/g | Kajiwara et al. 2011 | |
| AC adapter | 1 | NS | NA | Kajiwara et al. 2011 | |
| LCD Panel | 1 | NS | NA | Kajiwara et al. 2011 | |
| Textile | Curtain | 2 | NS | NA | Kajiwara et al. 2011 |
| Electrical Outlet | Electrical Outlet | 2 | NS | 0.32, 6.1 µg/g | Kajiwara et al. 2011 |
| Insulation board | Extruded polystyrene insulation board | 2 | NS | NA | Kajiwara et al. 2011 |
| Wallpaper | PVC Wallpaper | 4 | NS | NA | Kajiwara et al. 2011 |
| TV Casing | TV Casing (Hard impact polystyrene [HIPS] plastic) | 3 (apparently, each prepared from 50 used TV casings) | 50 ng/g | Mean = 140 ± 5.7 µg/g | Kajiwara et al. 2008 |
| TV Casing | TV Monitor casing | 15 | Not determined (signal-to-noise ratio of 3 used instead) | ND-0.5 mg/g; Mean = 0.0 ± 0.1 mg/g | Mochungong et al. 2014 |
| Audio-visual Polymer Casings | “Audiovisual” | 8 | Not determined (signal-to-noise ratio of 3 used instead) | ND-0.5 mg/g; Mean = 0.0 ± 0.1 mg/g | Mochungong et al. 2014 |
Abbreviations: ND, not detected; NA, No data available; NS, Not stated
Appendix F. Human exposure estimates for products available to consumers
Intake = SA × M × ED / BW
| Symbol | Description | Value |
|---|---|---|
| SAa | Surface area of direct mouthing | 10 cm2 |
| Mb | Migration rate | 0.00769 µg/cm2 per min |
| EDc | Exposure duration | 39 min/d |
| BWd | Body weight | 15.5 kg (Toddler) |
| Intake | Intake | = 1.93 × 10⁻⁴ mg/kg bw/day |
a The contact area assumed for mouthing a plastic doll in a 7.5 month old child (Bremmer and van Veen 2002).
b Migration rate was measured in vivo using 5 volunteers who mouthed small pieces from a rubber and hard plastic toy for 15 or 30 min and then collecting saliva samples from each volunteer every 5 min for processing and analysis of flame retardants (Chen et al. 2009).
c Upper bound of the mean for children aged 0.5-4 years mouthing toys (Norris and Smith 2002 cited in US EPA 2011).
d Health Canada (1998).
Appendix G. Levels of DBDPE in human tissue
| Tissue type and location | Sampling period | Number of samples | Limit of detection (ng/g) | Mean concentration (ng/g) | Reference |
|---|---|---|---|---|---|
| Breast milk Sherbrooke, Quebec | 2008-2009 | 105 adult nursing women | 1.7 ng/g lipid weight [lw]; 8.6% d.f. | Median: ND 95th percentile: 3.3 [ND – 25] |
Zhou et al. 2014. |
| Breast milk New Zealand, 2 urban areas plus 2 rural areas | 2007-2010 | 36 first time mothers (mean age – 26.9) | 227 pg/g | 113.5 pg/g: Half of LOD [ND – 325.50] |
Mannetje et al. 2013 |
| Serum Sherbrooke, Quebec | 2008-2009 | 102 adult nursing women | 3.5 ng/g lw; 5.9% d.f. | Median: ND 95th percentile: 3.40 [ND – 123] | Zhou et al. 2014. |
| Serum Tianjin, China | 2006 | 128 (30 office cleaners, 69 university students, 29 policemen) | 15 | ND | Zhu et al. 2009 |
| Serum California, US | 1996-98; 2008-09 | 1996-98: 50 samples from Laotian immigrant women to San Francisco; 2008-09: 30 samples from adult women and 25 samples from pregnant women in California. | NS | ND or at levels below quantitation | Petreas et al. 2012 |
| Plasma Multiple cities, Sweden | NS | 5 | 1.03 ng/g lipid weight | ND | Karlsson et al. 2007 |
| Hair Guangzhou City, China | NS | 29 | LOQ: 2.01 | Median: 17.8 [6.05 – 88.7] |
Zheng et al. 2011 |
| Hair Yuantan Town, China | NS | 32 | LOQ: 2.01 | Median: 9.57 [2.32 – 128] |
Zheng et al. 2011 |
Abbreviations: d.f., detection frequency; ND, not detected; NS, not specified;
LOQ, limit of quantitation.
Appendix H. Summary of health effects information for decabromodiphenyl ethane (DBDPE) CAS RN 84852-53-9
| Endpoint | Lowest effect levelsa/results |
|---|---|
| Acute toxicity | Lowest oral LD50(rat)> 5000 mg/kg (Mallory 1988a cited in Environment Agency 2007). Lowest dermal LD50 (rabbit, 24hrs) >2000 mg/kg (Mallory 1988b cited in Environment Agency 2007). LOAEC (inhalation, rats) = 50 mg/L(no more detailed information were available)(Li et al., 2004 cited in Norwegian Pollution Control Authority (SFT) 2008) |
| Short-term repeated-dose toxicity | NOAEL (oral, rat) = 1250 mg/kg bw/day on the basis of an absence of effects on mortality, clinical signs, body weight, food consumption, body weight gain, hematology and serum chemistry values, urinalysis, ocular examinations, gross necropsy results, organ weights, and light microscopy of selected tissues (adrenals, heart, kidneys, liver, mesenteric lymph node, parathyroids, spleen, and thyroid). DBDPE was administered to Sprague-Dawley (SD) rats (6 animals/sex/group) at dose levels of 0, 125, 400 or 1250 mg/kg bw/day by gavage in corn oil for 28 consecutive days. A mild and reversible increase in relative liver weights in the high-dose females was observed without any histopathology. Further, a 14-day recovery period after administration of 1250 mg/kg bw/day for 28 days found no evidence of delayed or progressive effects (Margitich 1991cited in Environment Agency 2007). No inhalation or dermal studies were identified. |
| Subchronic toxicity | NOAEL (oral, rat) = 1000 mg/kg bw/day. DBDPE was administered to male and female Sprague-Dawley rats (10 animals/sex/group) at dose levels of 0, 100, 320 or 1000 mg/kg bw/day by gavage in corn oil for 90 consecutive days. An additional 10 animals/sex/group were added to the control and high-dose groups. All animals were sacrificed after 90 days except for 10 animals/sex randomly selected from the vehicle control and high-dose recovery groups. These rats remained on test, untreated, for an additional 28 days to determine the reversibility, persistence, or delayed occurrence of toxic effects. DBDPE exposure produced no compound-related clinical signs of systemic toxicity, ocular lesions, or alterations in urinalysis, clinical chemistry, and hematology values in the treated or recovery groups (at 30 and 90 days). No biologically or toxicologically significant differences were observed in body weights, body weight gains, and food consumption. There were statistically significant differences in mean absolute or relative liver weights at 1000 mg/kg bw/day. There were also low-grade liver changes consisting of minimal to slight hepatocellular vacuolation (high-dose males) and minimal to slight centrilobular hepatomegaly (high- and possibly mid-dose males) observed. But these effects were not seen after a 28-day recovery, which indicated an adaptive and reversible response. The authors, therefore, suggested a NOAEL of 1000 mg/kg bw/day. No treatment-related changes were found in the livers of female rats. No treatment-related histomorphological changes were present in any of the other tissues (40 organs total) examined in either sex, except for evidence of aspirated test article in individual rats (Margitich 1992 cited in Environment Agency 2007; Hardy et al. 2002). Other study: LOEL (oral, rat) = 100 mg/kg bw/day on the basis of significant alterations in serum creatinine (Cr) and total bile acid (TBA) levels, as well as aspartate aminotransferase (AST) and alkaline phosphatase (ALP) at this dose level. Male Sprague-Dawley rats (12 per group) were administered DBDPE orally in corn oil for 90 days. Thyroid hormone T3 levels were significantly increased in the exposed rats, but T4 levels did not appear to be significantly altered. Biochemical parameters, including thyroid hormone levels, 13 clinical chemistry parameters, and the mRNA expression levels of certain enzymes were also monitored from 6 animals per group. Along with the above mentioned biochemical effects, CYP3A2 liver mRNA was also significantly up-regulated at this dose level, but CYP1A1, CYP2B1, and CYP2B2 mRNA were not affected. There were, however, no significant changes in body, liver, or kidney (relative and absolute) weights (Wang et al. 2010). The results of this study were challenged by other scientists in the public literature (Banasik et al. 2011). No inhalation or dermal studies were identified. |
| Chronic toxicity/ Carcinogenicity | No empirical studies were available. (Q)SAR models: In the absence of chronic studies on DBDPE the information on its carcinogenicity potential was obtained from (Q)SAR models. For the majority of models such as CASE Ultra Tox, CAESAR and ACD Percepta the predictions obtained on DBDPE were inconclusive. One of the rodent carcinogenicity models, Leadscope Model Applier, which is built on a statistical algorithm, predicted absence of activity. No structural-alerts were flagged by the (Q)SAR model, Toxtree, for potential genotoxic and non-genotoxic carcinogenicity. On the other hand, DEREK Nexus, an Expert System, predicted positive carcinogenicity on the basis of a non-genotoxic pathway. In order to confirm if any metabolites of DBDPE could exert carcinogenic activity it was subjected to rat in vitro liver metabolism simulator using the Toolbox. None of the metabolites were flagged for the presence of structural alerts for potential non-genotoxic carcinogenicity. Majority of rodent carcinogenicity (Q)SAR models except DEREK Nexus predicted lack of carcinogenic potential for the metabolites. The prediction by DEREK Nexus was again on the basis of the non-genotoxic pathway typically found in polyhalogenated aromatics. Metabolites that were flagged for the presence of structural alert for positive genotoxicity were ruled out by (Q)SAR models for Ames mutagenicity (Leadscope Model Applier, ACD Percepta, Toxtree, hybrid model TIMES) as well as for in vivo genotoxicity (DEREK Nexus) including rodent in vivo Micronuclei (Leadscope Model Applier and TIMES). The TIMES in vivo Micronuclei model algorithm integrates the rat in vivo metabolic simulator. DBDPE was not found to metabolize in in vitro hepatic microsomal preparations from rat, and other higher mammals such as beluga whale and polar bear (McKinney et al. 2011). Given the fact that DBDPE has a large molecular weight and size in addition to its limited solubility in water and organic solvents, it is likely to result in limited uptake and systemic exposure. |
| Reproduc-tive/ toxicity | No studies identified. |
| Develop-mental toxicity | NOAEL (oral, rat) = 1250 mg/kg/day the absence of effects in both dams and foetuses at this dose level. Female Crl:CD®BR VAF/Plus® rats were mated with Sprague-Dawley Crl:CD®BR VAF/Plus® male rats. DBDPE was administered via gavage in corn oil at dose levels of 0, 125, 400, or 1,250 mg/kg bw/day to females (25 per group) from gestation day (GD) 6 through 15. Animals were observed daily for clinical signs of toxicity. Body weights and food consumption were also measured. All female rats were sacrificed on GD 20 and subjected to caesarean section. Foetuses were individually weighed, sexed, and examined for external, visceral and skeletal abnormalities. No treatment-related mortality, abortions, or clinical signs of toxicity were observed during the study. Body weights, body weight gain, and food consumption were not affected by treatment. No significant internal abnormalities (uterus) were observed in on necropsy. Caesarean section parameters were comparable between control and treated groups. No treatment-induced malformations or developmental variations occurred (there was a statistically significant increase in the number of litters with unossified hyoid bones and reduced ossification of the skull in the 400 mg/kg dose group, but not in the higher dose level) (Mercieca 1992a cited in Environment Agency 2007; Hardy et al. 2010). NOAEL (oral, rabbit) = 1250 mg/kg/day the absence of effects in both dams and foetuses at this dose level. Female New Zealand White Rabbits were artificially inseminated at 51/2 months of age. DBDPE was administered via gavage in corn oil at dose levels of 0, 125, 400, or 1,250 mg/kg-day to females (25 per group) from gestation day (GD) 6 through 18. Animals were observed daily for clinical signs of toxicity. Body weights and food consumption were also measured. All female rats were sacrificed on GD 29 and subjected to caesarean section. Foetuses were individually weighed, sexed, and examined for external, visceral and skeletal abnormalities. No treatment-related mortality, abortions, or clinical signs of toxicity were observed during the study. Body weights, body weight gain, and food consumption were not affected by treatment. No significant internal abnormalities (uterus) were observed on necropsy. Caesarean section parameters were comparable between control and treated groups. No treatment-induced malformations or developmental variations occurred (there was a statistically significant increase in the number of litters with 27 presacral vertebrae at the high-dose group, but well within historical range) (Mercieca 1992b cited in Environment Agency 2007; Hardy et al. 2010). No inhalation or dermal studies were identified. |
| Genotoxicity endpoints in vivo | No studies identified. |
| Genotoxicity and related endpoints in vitro | Mutagenicity Assay Negative: Salmonella typhimurium (TA 98, TA 100, TA 1535, TA 1537, and TA 1538 strains) and Escherichia coli (WP2 uvrA strain) when tested with and without metabolic activation at concentrations ranging from 0 to 5000 μg/plate in DMSO (Stankowski 1988; San and Wagner 1991 - all cited in Environment Agency 2007). Chromosome Aberrations Negative: in Chinese hamster lung (CHL) cells at concentrations from 0 to 625 μg/ml for 6 hours with and without metabolic activation (Putman and Morris1992 cited in Environment Agency 2007). Negative: in an independent repeat assay conducted with DBDPE suspended in carboxymethylcellulose (selected to reduce precipitation) at concentrations of 625, 1,250, 2,500 and 5,000 μg/ml with and without metabolic activation. The exposure times were the same as those used in the first assay (Putman and Morris 1992cited in Environment Agency 2007). |
| Endocrine Disruption Activity | Lowest LOEL = 100 mg/kg bw/day based on significant increase in serum thyroid hormone triiodothyronine (T3) levels at this dose level. Male Sprague-Dawley (6 per treatment) rats were orally administrated 100 mg/kg/d of DBDPE in corn oil for 90 days. Thyroid hormone levels were monitored by radioimmunoassay from blood samples collected at the same time in the day. Thyroxine (T4) levels did not appear to be significantly altered. No weight measurements or histopathological survey of the thyroid were indicated in the study (Wang et al. 2010). Also, the results of this study were challenged by other scientists in the public literature (Banasik et al. 2011). QSAR Model: A QSAR model developed by Papa et al. (2010) predicted that DBDPE would have high binding affinity to the AhR receptor. The application of the prediction of the model did show that the binding activity to AhR of the PBDEs is at least 50-100 times lower than that of the reference toxicant TCDD. The model also predicted that DBDPE would have a moderate activity as a progesterone antagonist. Among the endpoints where the model predicted DBDPE to induce low activity were: EROD, DR agonist, ER agonist, T4, and E2 sulphonyl transferase (Papa et al. 2010). It should be noted that, in some cases, DBDPE fell out of the model domain for prediction and could be less reliable. |
| Irritation | No skin irritation: New Zealand White Rabbits (3 males; 3 females) were administered a dose of 500 mg of DBDPE with saline to the shaved skin under occlusive conditions for 4 hrs. Following exposure, the application site was rinsed off with water and observed for signs of irritation (erythema and oedema) with scores recorded at 1, 24, 48, and 72 hours post-treatment. No signs of skin irritation were observed; the mean 24-72 hour score for erythema and oedema was 0 (Mallory, 1988ccited in Environment Agency 2007). Slight eye irritation: DBDPE (100 mg) was instilled into the conjunctival sac of one eye of each of six albino New Zealand rabbits (3 males; 3 females) and the eyes were examined at 1, 24, 48 and 72 hours post-application. No iridial or corneal effects were noted at any of the time points. Conjunctival redness (score 1) was noted in all of the animals at 1 hour. This persisted until 48 hours in one male only. No effects were seen in any of the animals at 72 hours. The maximum average score at 1 hour was 3.0 (Mallory, 1988dcited in Environment Agency 2007). |
| Sensitization | Inconclusive: In a guinea pig maximization test, 40 guinea pigs (10 per sex/group) were injected intradermally with 5% DBDPE, vehicle only (0.5% methylcellulose) as a negative control, or 5% hexylcinnamic aldehyde (HCA) as a positive control. After one week, animals were administered patches of the vehicle, positive control (100% HCA) or DBDPE (100%) topically to the shaved test sites under occlusive wrappings for 48 hours. After 14 days, animals were challenged with 1% DBDPE, vehicle or 50% HCA for 24 hours and observed at 24 and 48 hours. A positive response (mild erythema) was observed at 24 hours in 90% of the animals in all of the groups. After 48 hrs, only 2/10 control and 4/20 of the treated animals showed a positive response. It is predicted that DBDPE would have low potential to cause skin sensitisation given that it is generally unreactive (Newton 2003; cited in Environment Agency 2007). |
a LD50, median lethal dose; LOAEL, lowest-observed-adverse-effect level; NOAEL, no-observed-adverse-effect level
| Endpoint | Lowest effect levelsa/results |
|---|---|
| In vitro | HepG2 cells (human hepatocytes) were cultured in the presence of DBDPE (3.125‐100.0 mg/L) for 24, 48, and 72 h respectively and the toxic effect of DBDPE was studied. DBDPE inhibited HepG2 viability in a time and dose‐dependent manner within a range of 12.5 mg/L to 100 mg/L and for 48 h and 72 h. Induction of apoptosis was detected at 12.5‐100 mg/L at 48 h and 72 h by propidium iodide staining, accompanied with overproduction of reactive oxygen species (ROS) (Sun et al. 2012). The authors stated that the mechanism of cytotoxicity of DBDPE is unclear and therefore requires further study. |
| Skin sensitization | No evidence of skin sensitization properties was observed on 200 professional workers from Wei-Dong Chemical Company from a repeated application of DBDPE in petrolatum for three weeks (Li et al. 2004; cited in Norwegian Pollution Control Authority (SFT) 2008). |
a LD50, median lethal dose; LOAEL, lowest-observed-adverse-effect level; NOAEL, no-observed-adverse-effect level