
Tables of the Screening Assessment Report
Phenol, 4,4'-(1-methylethylidene) bis[2,6-dibromo-
Chemical Abstracts Service Registry Number
79-94-7
Ethanol, 2,2'-[(1-methylethylidene)bis[(2,6-dibromo-4,1-phenylene)oxy]]bis
Chemical Abstracts Service Registry Number
4162-45-2
Benzene, 1,1'-(1-methylethylidene)bis[3,5-dibromo-4-(2-propenyloxy)-
Chemical Abstracts Service Registry Number
25327-89-3
Environment Canada
Health Canada
November 2013
Table of Content
- Tables
- Table 1. Substance identity for TBBPA, TBBPA Bis(2-hydroxyethyl ether), and TBBPA Bis(allyl ether)
- Table 2. Selected measured and predicted physical and chemical properties of TBBPA, TBBPA bis(2-hydroxyethyl ether) and TBBPA bis(allyl ether)
- Table 3a. Results of the Level III fugacity modelling for TBBPA (EQC 2003)
- Table 3b. Results of the Level III fugacity modelling for TBBPA bis(allyl ether) (EQC 2003)
- Table 3c. Results of the Level III fugacity modelling for TBBPA bis(2-hydroxyethyl ether) (EQC 2003)
- Table 4. Modelled data for degradation of TBBPA
- Table 5a. Empirical data for bioaccumulation of TBBPA
- Table 5b: Modelled data for bioaccumulation for TBBPA
- Table 6. Measured concentrations of TBBPA and TBBPA bis(allyl ether) in the ambient environment and sewage sludge
- Table 7. Measured concentrations of TBBPA and TBBPA bis(allyl ether) in biota
- Table 8. Representative input values used for estimating aquatic concentrations resulting from industrial releases of TBBPA
- Table 9. Representative input values used for estimating aquatic concentrations resulting from industrial releases of TBBPA bis(allyl ether) Table 10. Summary of key toxicity studies used in the ecological effects assessment of TBBPA, TBBPA bis(2-hydroxyethyl ether) and TBBPA bis(allyl ether)
- Table 10. Summary of key toxicity studies used in the ecological effects assessment of TBBPA, TBBPA bis(2-hydroxyethyl ether) and TBBPA bis(allyl ether)
- Table 11. Predicted ecotoxicity data for TBBPA, TBBPA bis(2-hydroxyethyl ether) and TBBPA bis(allyl ether)
- Table 12. Summary of data used in the ecological risk quotient analysis of TBBPA
- Table 13. Summary of data used in the risk quotient analysis of TBBPA bis(allyl ether)
- Go to the Appendices
- Back to the Screening Assessment
| CAS RN | 79-94-7 |
|---|---|
| DSL name | Phenol, 4,4’-(1-methylethylidene)bis[2,6-dibromo- |
| National Chemical Inventories (NCI) names1 | Phenol, 4,4'-(1-methylethylidene)bis[2,6-dibromo- (TSCA, DSL, PICCS, ASIA-PAC, NZI°C) 2,2',6,6'-Tetrabromo-4,4'-isopropylidenediphenol (French) (DSL) 2,2',6,6'-tetrabromo-4,4'-isopropylidenediphenol (English, French) (EINECS) 2,2',6,6'-Tetrabrom-4,4'-isopropylidendiphenol (German) (EINECS) 2,2',6,6'-tetrabromo-4,4'-isopropilidendifenol (Spanish) (EINECS) 2, 2-Bis (4'-hydroxy-3',-5'-dibromophenyl) propane (ENCS) Phenol, 4,4'-(1-methylethylidene)bis[2,6-dibromo- (AICS) 4,4'-(1-Methylethylidene)bis[2,6-dibromophenol] (ECL) BIS(PHENOL, 2,6-DIBROMO), 4,4'-(1-METHYLETHYLIDENE) (PICCS) BISPHENOL A, TETRABROMO- (PICCS) BISPHENOL, 4,4'-(1-METHYLETHYLIDENE)TETRABROMO- (PICCS) TETRABROMOBISPHENOL-A (ABS) (PICCS) Tetrabromobisphenol A (PICCS) |
| Other names | Tetrabromobisphenol A (TBBPA); 2,2',6,6'-Tetrabromobisphenol A; 3,3',5,5'-Tetrabromobisphenol A; 3,5,3',5'-Tetrabromobisphenol A; 2,2-Bis(3,5-dibromo-4-hydroxyphenyl)propane; 2,2-Bis(4-hydroxy-3,5-dibromophenyl)propane; 4,4'-Isopropylidenebis(2,6-dibromophenol); 4,4'-(1-Methylethylidene)bis(2,6-dibromophenol); Tetrabromodiphenylolpropane; Tetrabromodian; Tetrabromobisphenol A; T 0032; BA 59; BA 59BP; BA 59P; CP 2000; Flame Cut 120G; Flame Cut 120R; GLCBA 59P; NSC 59775; PB 100; RB 100; Bromdian; FR-1524; Fire Guard FG2000; Firemaster BP 4A; Great Lakes BA-59P; Saytex CP-2000; Saytex RB 100; Saytex RB 100PC; |
| Chemical group | Brominated flame retardant |
| Chemical subgroup | Brominated aromatic phenol |
| Chemical formula | C15H12Br4O2 |
| Chemical structure |  |
| SMILESFootnote Table 11 | Oc(c(cc(c1)C(c(cc(c(O)c2Br)Br)c2)(C)C)Br)c1Br |
| Mol. Wt. | 543.88 g/mol (Ashford 1994) |
| CAS RN | 4162-45-2 |
|---|---|
| DSL name | Ethanol, 2,2'-[(1-methylethylidene)bis[(2,6-dibromo-4,1-phenylene)oxy]]bis- |
| National Chemical Inventories (NCI) names1 | Ethanol, 2,2'-[(1-methylethylidene)bis[(2,6-dibromo-4,1-phenylene)oxy]]bis- (TSCA, DSL, ENCS, PICCS, ASIA-PAC) 4,4'-Isopropylidenebis(2-(2,6-dibromophenoxy)ethanol) (French) (DSL) 4,4'-isopropylidenebis(2-(2,6-dibromophenoxy)ethanol) (English, French) (EINECS) 4,4'-Isopropylidenbis(2-(2,6-dibromphenoxy)ethanol) (German) (EINECS) 4,4'-isopropilidenobis(2-(2,6-dibromofenoxi)etanol) (Spanish) (EINECS) Ethanol, 2,2'-[(1-methylethylidene)bis[(2,6-dibromo-4,1-phenylene)oxy]]bis- (AICS) 2,2'[(1-Methylethylidene)bis[(2,6-dibromo-4,1-phenyleneoxy]]bisethanol (ECL) Tetrabromobisphenol A Bis(2-hydroxyethyl ether) (PICCS) |
| Other names | 2,2'-Isopropylidenebis[(2,6-dibromo-p-phenyleneoxy)diethanol] 2,2-Bis[3,5-dibromo-4-(b-hydroxyethoxy)phenyl]propane 2,2-Bis[3,5-dibromo-4-(2-hydroxyethoxy)phenyl]propane 2,2-Bis[4-(2-hydroxyethoxy)-3,5-dibromophenyl]propane 4,4'-Isopropylidenebis[2-(2,6-dibromophenoxy)ethanol] AFR 1011 BA 50 BA 50P Ethanol, 2,2'-[(1-methylethylidene)bis[(2,6-bromo-4,1-phenylene)oxy]bis- Ethanol, 2,2'-[isopropylidenebis[(2,6-dibromo-p-phenylene)oxy]]di- Ethoxylated tetrabromobisphenol A FG 3600 Fire Guard 3600 |
| Chemical group | Brominated flame retardant |
| Chemical subgroup | Brominated aromatic phenol |
| Chemical formula | C19H20Br4O4 |
| Chemical structure | 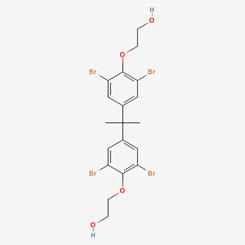 |
| SMILES1 | OCCOc1c(Br)cc(cc1Br)C(C)(C)c2cc(Br)c(OCCO)c(Br)c2 |
| Mol. Wt. | 631.98 g/mol (EPISuite 2008) |
| CAS RN | 25327-89-3 |
|---|---|
| DSL name | Benzene, 1,1'-(1-methylethylidene)bis[3,5-dibromo-4-(2-propenyloxy)- |
| National Chemical Inventories (NCI) names1 | Benzene, 1,1'-(1-methylethylidene)bis[3,5-dibromo-4-(2-propenyloxy)- (TSCA, DSL, ENCS, PICCS, ASIA-PAC, NZI°C) 1,1'-Isopropylidenebis[4-(allyloxy)-3,5-dibromobenzene] (French) (DSL, EINECS) 1,1'-isopropylidenebis[4-(allyloxy)-3,5-dibromobenzene] (EINECS) 1,1'-Isopropylidenbis[4-(allyloxy)-3,5-dibrombenzol] (German) (EINECS) 1,1'-isopropilidenbis[4-(aliloxi)-3,5-dibromobenceno] (Spanish) (EINECS) Benzene, 1,1'-(1-methylethylidene)bis[3,5-dibromo-4-(2-propenyloxy)- (AICS) 1,1'-isopropylidenebis[4-(allyloxy)-3,5-dibromobenzene] (ECL) Tetrabromobisphenol A Bis(allyl ether) (PICCS) |
| Other names | 2,2-Bis(3,5-dibromo-4-allyloxyphenyl)propane 2,2-Bis(4-allyloxy-3,5-dibromophenyl)propane BE 51 FG 3200 Fire Guard 3200 Flame Cut 122K Propane, 2,2-bis[4-(allyloxy)-3,5-dibromophenyl]- Pyroguard SR 319 See also Brominated flame retardant SR 319 Tetrabromobisphenol A allyl ether Tetrabromobisphenol A diallyl ether Tetrabromobisphenol A, bis(allyl ether) Tetrabromobisphenol-A-bisethoxylate |
| Chemical group | Brominated flame retardant |
| Chemical subgroup | Brominated aromatic phenol |
| Chemical formula | C21H20Br4O2 |
| Chemical structure |  |
| SMILESFootnote Table 12 | C=CCOc1c(Br)cc(cc1Br)C(C)(C)c2cc(Br)c(OCC=C)c(Br)c2 |
| Mol. Wt. | 624.01 g/mol (EPISuite 2008) |
| Property | TBBPA | TBBPA bis(2-hydroxyethyl ether) | TBBPA bis(allyl ether) |
|---|---|---|---|
| Physical state (20°C; 101.325 kPa) |
Crystalline or powdered white (colourless) solid (WHO 1995) |
Crystalline white-coloured powder (WHO 1995) |
Crystalline white solid (WHO 1995) |
| Water solubility (mg/L) | 0.240 (25°C, pH 6.7-7.3) 0.148–2.34 0.063 (21°C) 0.72–4.16 (15–25°C) |
0.03119 (25°C) (WSKOWWIN, version 1.43, within ECOSAR) 0.005 – 0.019 0.0001593 (25°C) |
2.05 x 10⁻⁵ (25°C) 4.07 x 10⁻⁶ (25°C) 3.40 x10⁻⁶ (25°C) 3.12 x 10⁻⁷ ( 25°C) 7.4 x10⁻⁷ – 2.83 x10⁻⁶ 1.12 x10⁻³ |
| Vapour pressure (Pa) | less than 1.19 x 10⁻⁵ 6.24 x 10⁻⁶ (25°C) 4.72 x 10⁻⁹ (25°C)
8.47 x 10⁻⁹ (298.15K) |
1.29 x 10⁻¹³ (25°C) 1.53 x 10⁻⁸ (25°C) |
2.9 x 10⁻⁹ (25°C) 2.00 x 10⁻⁸ (25°C) 2.65 x 10⁻⁷ (25°C) |
| Henry’s law constant (Pa m3/mole) |
less than 0.10 1.47 x 10⁻⁵ |
1.78 x 10⁻⁸ 5.12 x 10⁻⁷ IncompleteFootnote Table 21.1 |
1.30 x 10⁻² 40.0 Incomplete1 |
| Log Kow (Log D) |
5.903 4.540 5.1 5. 7 TBBPA0 7.2 TBBPA-1 4.52Footnote Table 24 TBBPA-2 3.18Footnote Table 25 |
5.48 5.995 6.7842 7.48 at pH 7 |
8.71 8.89 10.02 10.33 |
| Log Koc | 5.43Footnote Table 26 4.526 5.026 TBBPA0 6.8 TBBPA-1 4.1 TBBPA-2 2.8 |
3.24 3.25 |
5.87 5.85 |
| pKa | 7.5 (1st) and 8.5 (2nd) 9.40 6.79 (1st) and 7.06 (2nd) |
-3.16 – 14.41 (PALLAS, version 4.0) |
| Substance released to: | Air | Water | Soil | Sediment |
|---|---|---|---|---|
| Air (100%) | 0.10 | 0.07 | 97.6 | 2.22 |
| Water (100%) | 7.42 x 10⁻⁴ | 2.84 | 0.75 | 96.4 |
| Soil (100%) | 2.68 x 10⁻⁵ | 6.85 x 10⁻³ | 99.8 | 0.23 |
| Substance released to: | Air | Water | Soil | Sediment |
|---|---|---|---|---|
| Air (100%) | 0.48 | 0.31 | 81.1 | 18.1 |
| Water (100%) | 1.57 x 10⁻⁷ | 1.7 | 2.64 x 10⁻⁵ | 98.29 |
| Soil (100%) | 3.74 x 10⁻⁹ | 0.002 | 99.9 | 0.12 |
| Substance released to: | Air | Water | Soil | Sediment |
|---|---|---|---|---|
| Air (100%) | 0.35 | 0.93 | 89.8 | 8.95 |
| Water (100%) | 1.99 x 10⁻⁶ | 9.43 | 5.03 x 10⁻⁴ | 90.57 |
| Soil (100%) | 8.02 x 10⁻⁷ | 0.01 | 99.89 | 0.10 |
| Fate Process | Model and model basis |
Model Result and Prediction | Extrapolated Half-life (days) |
|---|---|---|---|
| Atmospheric oxidation | AOPWIN 2008Footnote Table 41.2 | t 1/2 = 3.615 days | greater than or equal to 2 |
| Ozone reaction | AOPWIN 20081 | n/aFootnote Table 42.2 | n/a |
| Fate Process | Model and model basis |
Model Result and Prediction | Extrapolated Half-life (days) |
|---|---|---|---|
| Hydrolysis | HYDROWIN 20081 | n/a2 | n/a |
| Fate Process | Model and model basis |
Model Result and Prediction | Extrapolated Half-life (days) |
|---|---|---|---|
| Biodegradation (aerobic) | BIOWIN 20081 Sub-model 4: Expert Survey (qualitative results) |
2.37Footnote Table 43.1 “biodegrades slowly” |
less than 182 |
| Fate Process | Model and model basis |
Model Result and Prediction | Extrapolated Half-life (days) |
|---|---|---|---|
| Biodegradation (aerobic) | BIOWIN 20081 Sub-model 3: Expert Survey (qualitative results) |
1.353 “recalcitrant” |
greater than or equal to 182 |
| Biodegradation (aerobic) | BIOWIN 20081 Sub-model 5: MITI linear probability |
-0.01Footnote Table 44.1 “biodegrades slowly” |
greater than or equal to 182 |
| Biodegradation (aerobic) | BIOWIN 20081 Sub-model 6: MITI non-linear probability |
0.014 “biodegrades very slowly” |
greater than or equal to 182 |
| Biodegradation (aerobic) | TOPKAT 2004 Probability |
04 “biodegrades very slowly |
greater than or equal to 182 |
| Biodegradation (aerobic) | CATABOL 2004-2008 % BOD (biological oxygen demand) |
3.5% BOD = “biodegrades very slowly” |
greater than or equal to 182 |
| Test organism | Endpoint | Value wet weight (L/kg) | Reference |
|---|---|---|---|
| Fish Pimephales promelas |
BCF | 1200 Footnote Table 51.3 1300 Footnote Table 52.3 |
Brominated Flame Retardants Industry Panel 1989cFootnote Table 53.2 |
| Fish Lepomis macrochirus |
BCF | 20 (edible tissue) 1 170 (visceral tissue)1 |
Velsicol Chemical Corporation 1978d |
| Fish Carp |
BCF | 30 – 485 1 | CITI 1992 |
| Marine Invertebrate Crassostrea virginica |
BCF | 720 1 780 2 |
Brominated Flame Retardants Industry Panel 1989b |
| Freshwater Invertebrate Chironomus tentans |
BCF | 240 -510 high organic carbon (OC), 490 - 1100 medium OC 650 - 3200 low OC |
Brominated Flame Retardants Industry Panel 1989h |
| Terrestrial earthworm, Eisenia fetida |
BAF studyFootnote Table 54.2 |
0.24 - 0.019, |
ACCBFRIP 2003 |
| Test organism | logKow | kM (days-1) |
BCF (L/kg) | Value wet weight (L/kg) | Reference |
|---|---|---|---|---|---|
| Fish | 5.9 | 1.12Footnote Table 5b1.4 | BCF | 150 | BCFBAF 2008; Sub-model 2: Arnot-Gobas mass balance, |
| Fish | 5.9 | 1.121 | BAF | 174.1 | BCFBAF 2008; Sub-model 3: Arnot-Gobas mass balance. |
| Fish | 5.9 | 0.07Footnote Table 5b2.4 | BCF | 347.9 | CPOPs 2008; BBM with Mitigating Factors 2008 |
| Medium | Location; year | TBBPA ConcentrationFootnote Table 6 * | Samples | TBBPA bis(allyl ether) concentration |
Reference |
|---|---|---|---|---|---|
| Air | United States; 1977 | less than 0.01–1.8 µg/m3 | 8 | Zweidinger et al. 1979a | |
| Air | United Kingdom; 2007 | 8 x 10⁻⁷ (0.8 pg/m3) |
5 | Abdallah et al. 2008 | |
| Air | Russian Arctic; 1994 to 1995 | 0.00007 µg/m3 | in 1 of 4 | Alaee et al. 2003 | |
| Air | Arctic (northeast Atlantic); 2004 | less than 4.0 x 10⁻⁸–1.7 x 10⁻⁷ µg/m3 | in 2 of 7 | Xie et al. 2007 | |
| Air | Wadden Sea; 2005 | 2.1 x 10⁻⁷, 5.0 x 10⁻⁷ µg/m3 (vapour) 1.0 x 10⁻⁷, 1.9 x 10⁻⁷ µg/m3 (particle) |
in 2 of 2 | Xie et al. 2007 | |
| Air | Northern Germany; 2005 and 2006 | less than 4.0 x 10⁻⁸–2.5 x 10⁻⁷ µg/m3 (vapour) 1.6 x 10⁻⁷–8.5 x 10⁻⁷ µg/m3 (particle) |
in 6 of 7 in 7 of 7 |
Xie et al. 2007 | |
| Air/Precipitation | The Netherlands; 2000 to 2001 | 0.0000001–0.000002 µg/m3 0.0002–0.0041µg/L |
n.s. Footnote Table 6a | Duyzer and Vonk 2003 | |
| Air | Suburban area, Stockholm, Sweden | n.d.Footnote Table 6b | 0/2 | Sjödin et al. 2001 | |
| Air | Berlin,; Germany | n.d. | Multiple, n.s. | Kemmlein 2000 | |
| Air | Southern Arkansas, USA near two organobromine chemical manufacturing facilities | n.d. - 0.028 (facility 1) [n.d. - 1.8] |
8, 4 high volume samples at each facility | Zweidinger et al. 1979a | |
| Precipitation | Germany, Belgium, the Netherlands; no year | less than 0.0005–0.0026 µg/L | in 8 of 50 | Peters 2003 | |
| Water | France. Predecelle river near Paris n= 5 stations; June 2008 | less than 3 x 10⁻⁵- 6 x 10⁻⁵ µg/L ( less than 35-64 pg/L) |
n.s. | Labadie et al. 2010 | |
| Water | England, Lakes n=9; July –Aug 2008; Nov 2008 andJan 2009 |
1 x 10⁻⁴ - 3 x 10⁻³ µg/L (140-3200 pg/L) |
3 per site x 9 sites=27 | Harrad et al. 2009 | |
| Water | Japan, multiple locations; 2000 | n.d. (detection limit: 0.09) |
0/27 | MOE Japan 2003 | |
| Water | Japan, multiple locations; 1988 | n.d. (detection limit: 0.04) |
0/150 | MOE Japan 2003 | |
| Water | Japan, multiple locations; 1987 | 0.05. (detection limit: 0.03) |
Detected in 1 of 75 | MOE Japan 2003 | |
| Water | Japan, multiple locations; 1977 | n.d. (0.02 to 0.04) |
0/15 | MOE Japan 2003 |
| Medium | Location; year | TBBPA Concentration* | Samples | TBBPA bis(allyl ether) concentration |
TBBPA Concentration* |
|---|---|---|---|---|---|
| Water | Germany; 2000 | less than 0.0002–0.0204 µg/L (TBBPA) less than 0.0002–0.00106 µg/L (Me-TBBPAFootnote Table 6c) |
in 7 of 30 in 3 of 30 |
Kuch et al. 2001 | |
| Water | Japan; 1977 to 1989 | less than 0.02–0.05 µg/L | in 1 of 240 | Environment Agency Japan 1989, 1991 | |
| Water | South China, Liuyang river; 2009 | 18 samples | n.d. to 0.0491 µg/L (49.1 ng/L) (instrument detection limit:40 pg/L) |
Qu et al. 2011 | |
| Landfill leachage | Canada; 2009-2010 | 0.049 mg/L (49 ng/L) | 50 | CRA 2011 | |
| Landfill leachate | Finland; no year | less than 0.2–0.9 µg/L | 2 | Peltola 2002 | |
| Landfill leachate (solid phase) |
The Netherlands; no year | less than 5.5–320 µg/kg dw | in 3 of 9 | de Boer et al. 2002 | |
| Landfill leachate (solid phase) |
The Netherlands; 2002 | less than 0.3–320 µg/kg dw | 11 | Morris et al. 2004 | |
| Sediment | Lake Ontario; 2003 | n.d. to 0.063 mg/kg dw | 8 | Quade 2003 | |
| Sediment | Detroit River; 2000 | 0.60–1.84 µg/kg dw | 8 | Quade 2003 | |
| Sediment | United States; 1977 | less than 100–330,000 µg/kg dw | 7 | Zweidinger et al. 1979b | |
| Sediment | France, Predecelle river near Paris Sediments, n=5 stations |
0.07-0.3 µg/kg dw (65-280 pg/g dw) |
18 | Labadie et al. 2010 | |
| Sediment | United Kingdom, English lakes; July –Aug 2008; Nov 2008 and Jan 2009 | 0.3-3.8 µg/kg dw (330 – 3800 pg/g dw) |
7 cores / site= 63 | Harrad et al. 2009 | |
| Sediment | United Kingdom; 1998 | less than 1.07–2.3 µg/kg ww | in 1 of 50 | CEFAS 2002 | |
| Sediment | United Kingdom; no year | less than 2.4–9753 µg/kg dw | in 10 of 22 | de Boer et al. 2002 | |
| Sediment | Ireland; no year | less than 0.1–3.7 µg/kg dw | in 4 of 13 | de Boer et al. 2002 | |
| Sediment | England; 2000 to 2002 | less than 2.4–9750 µg/kg dw | 22 | Morris et al. 2004 | |
| Sediment | The Netherlands; 2000 | less than 0.1–6.9 µg/kg dw | 28 | Morris et al. 2004 | |
| Sediment | Belgium; 2001 | less than 0.1–67 µg/kg dw | 20 | Morris et al. 2004 | |
| Sediment | Sweden; 1988 | 34–270 µg/kg dw (TBBPA) 24–1500 µg/kg dw (Me-TBBPAc) |
n.s | Sellström and Jansson 1995 | |
| Sediment | Finland; 2000 | less than 0.2–21 µg/kg dw | in 2 of 5 | Peltola 2002 | |
| Sediment | Germany; 2001 | n.d. to 4.6 µg/kg dw | in 7 of 20 | Heemken et al. 2001 | |
| Sediment | Germany; no year | n.d.to 18.68 µg/kg dw | 13 | Kemmlein 2000 | |
| Sediment | Germany; no year | less than 0.2–1.83 µg/kg dw | in 8 of 19 | Kuch et al. 2001 |
| Medium | Location; year | TBBPA Concentration* | Samples | TBBPA bis(allyl ether) concentration |
Reference |
|---|---|---|---|---|---|
| Sediment | China; 2009-2010 Zhujiang River Beijiang River Xijiang River Shunde tributaries Dayanhe River Pearl River Estuary |
Surface sediment samples n.d.-82.3 µg/kg dw (mean=15.158 µg/kg dw) 0.103-127 µg/kg dw (mean=28.365 µg/kg dw) 0.537-6.20 µg/kg dw (mean=2.804 µg/kg dw) n.d.-1.33 µg/kg dw (mean=0.510 µg/kg dw) 0.264-27.1 µg/kg dw (mean=4.589 µg/kg dw) 0.741-304 µg/kg dw (mean=13.375 µg/kg dw) 0.06-1.39 µg/kg dw (mean=0.471 µg/kg dw) |
42 19 14 13 13 8 12 |
Feng et al. 2012 | |
| Sediment | Qinghe canal in Beijin, China; May-July, 2011 | 0.3 – 22 mg/kg dw | 13 | Xu et al. 2012 | |
| Sediment | Norway; 2003 | 0.02–39 µg/kg dw | 11 | Schlabach et al. 2004 | |
| Sediment | Norway; no year | 1.92–44.4 µg/kg dw (TBBPA) n.d. 3 to1.23 µg/kg dw (Me-TBBPAc) |
in 12 of 12 in 11 of 12 |
SFT 2002 | |
| Sediment | Norway; no year | 1.24 µg/kg dw | n.s. | Fjeld et al. 2004 | |
| Sediment | The Netherlands; no year | less than 0.1–32 µg/kg ww (TBBPA) less than 0.1–0.4 µg/kg ww (Me-TBBPAc) |
in 35 of 47 in 6 of 47 |
de Boer et al. 2002 | |
| Sediment | Japan; 1981 | 20 µg/kg dw | 1 | Watanabe et al. 1983 | |
| Sediment | Japan; 1981 to 1983 | less than 0.5–140 µg/kg dw (TBBPA) less than 0.5–1.8 µg/kg dw (Me-TBBPAc) |
in 14 of 19 in 5 of 19 |
Watanabe et al. 1983 | |
| Sediment | Japan; 1987 | less than 2–150 µg/kg dw | in 14 of 66 | Watanabe and Tatsukawa 1989 | |
| Sediment | Japan; 1988 | less than 2–108 µg/kg dw | in 20 of 130 | Environment Agency Japan 1996 | |
| Sediment | Japan; 1999 | 0.68–12 µg/kg dw | 6 | Ohta et al. 2002 | |
| Sediment | Japan; 2003 | 0.08–5.0 µg/kg dw | 17 | Ohta et al. 2004 | |
| Sediment | China; October 2006 | 3.8-230 µg/kg dw | 17 (15 surface and 2 cores) | Zhang et al. 2009 | |
| Sediment | South China, Liuyang river; 2009 | 18 samples | 143.4 to 10183.41 µg/kg (ng/g) (instrument detection limit:40 pg) |
Qu et al. 2011 | |
| Soil | China, Beijin; May-July 2011 | 26 – 104 mg/kg dw (e-waste recycling site) Not detected – 5.6 mg/kg dw (farmlands) |
4 11 |
Xu et al. 2012 |
| Medium | Location; year | TBBPA Concentration* | Samples | TBBPA bis(allyl ether) concentration |
TBBPA Concentration* |
|---|---|---|---|---|---|
| Soil | Spain; no year | 3.4-32.2 µg/kg dw (industrial) | n.s. | Sanchez-Brunete et al. 2009 | |
| Soil | United States; no year | 222 000 µg/kg Footnote Table 6d | n.s | Pellizzari et al. 1978 | |
| Soil | Israel; no year | 450 000 µg/kg d | n.s | Arnon 1999 | |
| Soil | South China, Liuyang river; 2009 | 18 samples | n.d. to 41.7µg/kg (ng/g) (instrument detection limit:40 pg) |
Qu et al. 2011 | |
| Sewage sludge | Canada; 2010 to 2011 | 53–195 mg/kg dw | in 4 of 40 | Smyth 2013 | |
| Sewage sludge | Quebec dried sludge; Oct 2003 | 330 ug/kg dw; 310 µg/kg dw (330 ng/g dw and 310 ng/g dw) |
1 sample, 8 analyses (2 mean values with n=3 and 5) | Saint-Louis and Pelletier 2004 | |
| Sewage sludge | Canada; 1994 to 2001 | less than 1–46.2 µg/kg dw | in 34 of 35 | Lee and Peart 2002 | |
| Sewage sludge | Ontario; 2002 | 9.04–43.1 µg/kg dw | 7 | Quade 2003 | |
| Sewage sludge | Spain (Catalonia); 2009 | nd – 472 mg/kg dw (mean = 104 mg/kg dw; median = 96.7 mg/kg dw) |
17 | 3.00 mg/kg (ng/g) dw | Gorga et al. 2013 |
| Sewage sludge Municipal wastewater treatment plants Industrial wastewater treatment plant |
Korea, Busan city; n.s. Korea, Ulsan city; n.s. |
67.1 – 618 mg/kg dw
4.01 - 144 mg/kg dw |
4
7 |
Hwang et al. 2012 | |
| Sewage sludge | United States; 1999 to 2001 | 2.98–196 µg/kg dw | 7 | Quade 2003 | |
| Sewage sludge Influent (liquid) Influent (solid) |
United Kingdom; no year | 54–112 µg/kg dw less than 0.015–0.0852 µg/L 21.7 µg/kg dw |
in 5 of 5 in 4 of 5 in 1 of 5 |
de Boer et al. 2002 | |
| Sewage sludge Influent (solid) Influent (liquid) Effluent |
Southeast England; 2002 | 15.9–112 µg/kg dw less than 3.9–21.7 µg/kg dw 0.0026–0.085 µg/L less than 3.9 µg/kg dw |
5 5 5 5 |
Morris et al. 2004 | |
| Sewage sludge | Ireland; no year | less than 0.1–192 µg/kg dw | in 5 of 6 | Morris et al. 2004 |
| Medium | Location; year | TBBPA Concentration* | Samples | TBBPA bis(allyl ether) concentration |
TBBPA Concentration* |
|---|---|---|---|---|---|
| Sewage sludge | Sweden; 1988 | 31–56 µg/kg dw | 2 | Sellström and Jansson 1995 | |
| Sewage sludge | Sweden; 1997 to 1998 | 3.6–45 µg/kg dw | n.s | Sellström 1999; Sellström et al. 1999 |
|
| Sewage sludge | Sweden; 1999 to 2000 | less than 0.3–220 µg/kg ww | 57 | Öberg et al. 2002 | |
Sewage sludge Influent Effluent |
Germany; no year | less than 0.2–34.5 µg/kg dw (TBBPA) less than 0.2–11.0 µg/kg dw (Me-TBBPA2) 0.00086–0.0174 µg/L (TBBPA) less than 0.0002–0.025 µg/L (TBBPA) less than 0.0002–0.00145 µg/L (Me-TBBPAc) |
in 11 of 12 in 7 of 12 in 5 of 19 |
Kuch et al. 2001 | |
| Sewage sludge | Germany; no year | 0.6–62 µg/kg dw | 32 | Metzger and Kuch 2003 | |
| Wastewater Influent (filtered) Influent raw (unfiltered) Effluent |
South Africa, Vereeniging region; n.s. |
6,629 mg/L (TBBPA) 6.806 mg/L (TBBPA) |
1 (250 mL) 1 (250 mL) |
Chokwe et al. 2012 | |
Sewage sludge Effluent (solid phase) |
The Netherlands; no year | 2.8–600 µg/kg dw (TBBPA) less than 0.1–5.5 µg/kg dw (Me-TBBPAc) 37–62 µg/kg dw (TBBPA) less than 0.1–0.6 µg/kg dw (Me-TBBPAc) |
in 10 of 10 in 5 of 5 |
de Boer et al. 2002 | |
| Sewage sludge Influent Effluent |
The Netherlands; 2002 | 2–600 µg/kg dw less than 6.9 µg/kg dw 3.1–63 µg/kg dw |
8 5 5 |
Morris et al. 2004 |
| Organism | Location; year | TBBPA Concentration* | Samples | TBBPA bis(allyl ether) concentration |
Reference |
|---|---|---|---|---|---|
| Bottlenose dolphin Bull shark Atlantic sharpnose shark |
Florida; 1991 to 2004 | 0.056–8.48 μg/kg lw 0.035–35.6 μg/kg lw 0.495–1.43 μg/kg lw |
in 15 of 15 in 13 of 13 in 3 of 3 |
Johnson-Restrepo et al. 2008 | |
| Harbour porpoise | United Kingdom; 1996 to 2000 | 3.9–376 µg/kg ww | 4 | Law et al. 2003 | |
| Starfish Whiting Cormorant |
United Kingdom; 1999 to 2000 | 4.5 µg/kg ww less than 4.8–3.3 µg/kg ww Footnote Table 71.6 0.07–0.28 µg/kg ww |
1 in 1 of 2 in 5 of 5 |
de Boer et al. 2002 | |
| Harbour porpoise Cormorant |
United Kingdom; no year | 0.05–376 µg/kg ww 0.07–10.9 µg/kg ww |
in 8 of 25 in 7 of 28 |
CEFAS 2002 | |
| Harbour porpoise Cormorant Sea star Hake |
United Kingdom; 1998 to 2001 | 0.1–418 µg/kg lw 2.5–14 µg/kg lw 205 µg/kg lw less than 0.2 µg/kg lw |
5 5 1 1 |
Morris et al. 2004 | |
| Cod Whiting Hermit crab Sea star Whelk Harbour porpoise |
North Sea; 1999 to 2000 | less than 0.1–0.8 µg/kg ww less than 97–245 µg/kg lw less than 1–35 µg/kg lw less than 1–10 µg/kg lw 5–96 µg/kg lw 0.05–376 µg/kg ww |
in 1 of 2 in 2 of 3 in 5 of 9 in 2 of 3 in 3 of 3 in 5 of 5 |
de Boer et al. 2002 | |
| Whelk Hermit crab Whiting Cod Harbour porpoise Harbour seal |
North Sea; 1999 | 5.0–96 µg/kg lw less than 1–35 µg/kg lw less than 97–245 µg/kg lw less than 0.3–1.8 µg/kg lw less than 11 µg/kg lw less than 14 µg/kg lw |
3 9 3 2 4 2 |
Morris et al. 2004 | |
| Baltic salmon | Finland; 1993 to 1999 | 2.0–5.0 µg/kg ww | in 2 of 10 | Peltola 2002 | |
| Predatory birds’ eggs | Norway; 1992 to 2002 | less than 0.004–0.013 µg/kg ww | in 8 of 8 | Herzke et al. 2005 | |
| Eel | Norway; 2003 | 0.3 µg/kg lw | n.s Footnote Table 72.5 | Schlabach et al. 2004 | |
| Blue mussel Cod Moss |
Norway; no year | 0.01–0.03 µg/kg ww 0.08–0.16 µg/kg ww 0.019–0.89 µg/kg ww |
in 6 of 6 in 6 of 6 in 11 of 11 |
SFT 2002 | |
| Atlantic cod | Norway; no year | 0.5–2.5 µg/kg lw | 2 | Fjeld et al. 2004 | |
| Eel Perch Pike |
Germany; 1998 to 1999 | 0.045–0.10 µg/kg ww 0.033 µg/kg ww 0.021 µg/kg ww |
2 1 1 |
Kemmlein 2000 | |
| Eel | Belgium; 2000 | less than 0.1–13 µg/kg ww | 19 | Morris et al. 2004 | |
Common tern eggs Eel |
The Netherlands; 1999 to 2000 | NDFootnote Table 73.3 (TBBPA) 0.4–0.8 µg/kg ww (Me-TBBPAFootnote Table 74.3) less than 0.1–2.6 µg/kg ww (TBBPA) less than 0.1–2.5 µg/kg ww (Me-TBBPA4) |
10 in 6 of 18 in 7 of 18 |
de Boer et al. 2002 | |
| Common tern Eel |
The Netherlands; 1999 to 2001 | less than 2.9 µg/kg ww less than 0.1–1.3 µg/kg ww |
10 11 |
Morris et al. 2004 | |
| Mussel (Mytilus edulis) |
Japan; 1981 | n.d. 3 (TBBPA) 5 µg/kg ww (Me-TBBPA4) |
n.s 2 | Watanabe et al. 1983 | |
| Fish and shellfish | Japan; 1983 | n.d. 3 to 4.6 µg/kg ww (Me-TBBPA4) |
in 2 of 19 | Watanabe and Tatsukawa 1989 | |
| Sea bass | Japan; 1986 to 2000 | 3.4–23 µg/kg lw | n.s 2 | Ohta et al. 2004 | |
| Lake trout | Lake Ontario; 1997 to 2004 | in 5 of 30 | 0.2 – 1.7 µg/kg ww (ng/g ww) |
Ismail et al. 2006 | |
| Gull herring eggs | Eastern Great lakes and St. Lawrence River; 2008 to 2009 | 83% of samples (concentrations reported for 8 samples) | 0.08 – 0.56 µg/kg ww (ng/g ww) | Letcher and Chu 2010 |
| Input | Value Scenario #1 | Value Scenario #2 |
Justification and reference |
|---|---|---|---|
| Quantity (kg) | 1,000,000 | 10,000 - 100,000 | Lower and upper range of mass in commerce |
| Loss to wastewater (%) | No water discharge | 0.21% | Loss to water based on company activities. ESD on Plastic Additives, Chapter 15 (OECD 2004) |
| Wastewater system removal efficiency (%) | Not Applicable | 93% | Standard sewage treatment plants in Canada have primary or secondary treatment in place. |
| Number of annual release days (days) |
Not Applicable |
250 | Site specific information (Environment Canada 2013) |
| Dilution factor (–) | Not Applicable | 10 | Site specific information (Environment Canada 2013) |
| Input | Value Scenario #1 | Value Scenario #2 |
Justification and reference |
|---|---|---|---|
| Quantity (kg) | 1,000,000 | 100,000 | Upper and lower range of mass in commerce |
| Loss to wastewater (%) | 0.21% | 0.21% | Loss to water based on company activities. ESD on Plastic Additives, Chapter 15 (OECD 2004) |
| Wastewater system removal efficiency (%) | 59.8 | 93 | Standard sewage treatment plants in Canada have primary or secondary treatment in place. |
| Number of annual release days (days) | 250 | 250 | 250 days considered “worst case” for HPV substance. (European Commission 2003) |
| Dilution factor (–) | 10 | 10 |
| Species, life stage | Test material | Study design | Effect leve (endpoint and value) | Reference |
|---|---|---|---|---|
| Crassostrea virginica, eastern oyster | TBBPA: 100% active ingredient |
|
|
Brominated Flame Retardants Industry Panel 1989a |
| Mytilus edulis, common mussel | TBBPA: purity 99.2% |
|
|
ACCBFRIP 2005b, c |
| Daphnia magna, water flea (less than 24 hours old at test initiation) | TBBPA: 100% active ingredient |
|
|
Brominated Flame Retardants Industry Panel 1989g |
| Daphnia magna, water flea (less than 24 hours old at test initiation) | TBBPA: composition from 3 manufacturers; purity 99.17% |
|
|
Wildlife International 2003 |
| Acartia tonsa, copepod (adults used for acute test; eggs and juveniles used for chronic test) | TBBPA: composition and purity not given |
|
|
Wollenberger et al. 2005; Breitholtz et al. 2001 |
| Skeletonema costatum, Thalassiosira pseudonana, marine algae | TBBPA: composition and purity not given |
|
|
Walsh et al. 1987 |
| Pimephales promelas, fathead minnow (embryos and larvae) | TBBPA: 100% active ingredient |
|
|
Brominated Flame Retardants Industry Panel 1989i |
| Oncorhynchus mykiss, rainbow trout (juvenile) | TBBPA: composition and purity not given |
|
|
Ronisz et al. 2001 |
| Oncorhynchus mykiss, rainbow trout (immature, 80–120 g) | TBBPA: composition and purity not given |
|
|
Christiansen et al. 2000 |
| Species, life stage | Test material | Study design | Effect level (endpoint and value) | Reference |
|---|---|---|---|---|
| Danio rerio, zebrafish (adults and eggs) | TBBPA: 99.17% purity |
|
|
Kuiper et al. 2007 |
| Lumbriculus variegatus, oligochaete (adult) | TBBPA: 98.91% active ingredient |
|
For 2.5% OC sediment:
For 5.9% OC sediment:
|
ACCBFRIP 2002c, d |
| Chironomus tentans, midge (second instar larvae at test initiation) | TBBPA: 99.15% active ingredient |
|
|
Brominated Flame Retardants Industry Panel 1989h |
| Species, life stage | Test material | Study design | Effect level (endpoint and value) | Reference |
|---|---|---|---|---|
| Chironomus tentans, midge (second instar larvae at test initiation) | TBBPA: 99.15% active ingredient |
|
|
Brominated Flame Retardants Industry Panel 1989h |
| Chironomus riparius, midge (first instar larvae at test initiation) | TBBPA: 99.2% purity |
|
|
ACCBFRIP 2005d |
| Species, life stage | Test material | Study design | Effect level (endpoint and value) | Reference |
|---|---|---|---|---|
| Hyalella azteca | TBBPA: composition with a purity of 99.2% |
|
|
Wildlife International 2006c |
| Eisenia fetida, earthworm (adult) | TBBPA: 98.91% active ingredient |
|
|
ACCBFRIP 2003 |
| Eisenia fetida, earthworm (adult) | TBBPA: 99.2% purity |
|
|
ACCBRIP 2005a |
| Species, life stage | Test material | Study design | Effect level (endpoint and value) | Reference |
|---|---|---|---|---|
Zea mays, corn Allium cepa, onion Lolium perenne, ryegrass Cucumis sativa, cucumber Glycine max, soybean Lycopersicon esculentum, tomato |
TBBPA: 99.17% active ingredient |
|
|
ACCBFRIP 2002e |
| Trifolium pratense, red clover | TBBPA: composition and purity not given (purchased from Fluka, Germany) |
|
|
Sverdrup et al. 2006 |
| Enchytraeus crypticus, earthworm (sexually mature adult) | TBBPA: composition and purity not provided (purchased from Fluka, Germany) |
|
|
Sverdrup et al. 2006 |
| Species, life stage | Test material | Study design | Effect level (endpoint and value) | Reference |
|---|---|---|---|---|
|
TBBPA: composition and purity not provided (purchased from Fluka, Germany) |
|
|
Sverdrup et al. 2006 |
|
TBBPA: composition, greater than 99% purity |
|
|
Wildlife International 2005 |
Gallus domesticus, domestic chicken (fertilized eggs) |
TBBPA: greater than 99% active ingredient |
|
|
Berg et al. 2001 |
|
TBBPA: 98.91% active ingredient |
|
|
Wildlife International 2002 |
|
TBBPA bis(2-hydroxyethyl ether): composition and purity not given |
|
|
CITI 1992 |
| Organism | Effect level (endpoint and value) |
TBBPA (Log Kow= 5.9)Footnote Table 11* |
TBBPA bis(2-hydroxyethyl ether) (Log Kow = 5.48)* |
TBBPA bis(allyl ether) (Log Kow = 8.71)* |
Model |
|---|---|---|---|---|---|
| Fish |
96-hour LC50 14-day LC50 chronic no-effect level |
0.140 mg/LFootnote Table 11 1, Footnote Table 112.6 – 0.21 mg/L |
0.389 mg/L1,2 0.477 mg/L2 0.056 mg/L2 |
0.000483 mg/L1,2 – 0.000098 mg/L 1,2 – |
ECOSAR 2011, version 1.10 |
| Daphnid | 48-hour LC50 chronic no-effect level |
0.156 mg/L2 0.030 mg/L |
0.302 mg/L1,2 0.073 mg/L2 – |
0.000912 mg/L 1,2 – 0.000278 mg/L 1,2 |
ECOSAR 2011, version 1.10 |
| Mysid shrimp | 96-hour LC50 | – | 0.035 mg/L1,2 | – | ECOSAR 2011, version 1.10 |
| Green algae | 96-hour EC50 chronic no-effect level |
0.148 mg/L2 0.220 mg/L2 |
0.377 mg/L1,2 0.459 mg/L1,2 – – |
0.000879 mg/L 1,2 0.005 mg/L 1,2 – |
ECOSAR 2011, version 1.10 |
| Fish | 96-hour LC50 | – | 1.614 mg/L | – | ASTER 1999 |
| Fish | 96-hour LC50 | 0.0115 mg/L | 4.29 mg/L | 1.05 mg/L | AIEPS (2003–2007) |
| Daphnid | 48-hour LC50 | 2.85 mg/L | 0.041 mg/L | 0.154 mg/L | AIEPS (2003–2007) |
| Green algae | 72-hour EC50 | 5.51 mg/L | 11.25 mg/L | 4.01 mg/L | AIEPS (2003–2007) |
| Fish | 96-hour LC50 | 0.1413 mg/L | 0.0015 mg/L | 0.0097 mg/LFootnote Table 113.4 | TOPKAT 1998, Fathead Minnow LC50 v3.2 |
| Daphnid |
EC50 | 0.6803 mg/L | 21.2 mg/L | 0.0000102 mg/L3 | TOPKAT 2004, Daphnia EC50 v3.1 |
| Fish | 96-hour LC50 | 0.194 mg/L | 0.3919 mg/LFootnote Table 114.4 | 2.0163 mg/L4 | OASIS Forecast 2005 (CPOPs 2008) -Acute Toxicity v.01 |
| Daphnid | 48-hour LC50 | 0.1225 mg/L | 0.2180 mg/L4 |
3.4868 mg/L4 | OASIS Forecast 2005 (CPOPs 2008) -Acute Toxicity v.01 |
| Earthworm | 14-day LC50 | – | 478.664 mg/L2 | – | ECOSAR 2011, version 1.10 |
| Measure | Pelagic organisms | Benthic organisms | Soil organisms | Fish-consuming Wildlife |
|---|---|---|---|---|
| Predicted exposure concentration (PEC) |
0.000719 – 0.00719Footnote Table 121.9 |
42.08 – 420.75 |
0.000057 mg/kg dwFootnote Table 128.1 | 0.007 mg/kg bw-dayFootnote Table 1211 |
| Critical toxicity value (CTV) | 0.31 mg/LFootnote Table 122.7 |
151 mg/kg dwFootnote Table 125.1 |
0.12 mg/kg dwFootnote Table 129.1 |
1.64 mg/kg bw-dayFootnote Table 1212 |
| Application factor | 100Footnote Table 123.5 | 100Footnote Table 126.1 | 1006 | 10Footnote Table 1213 |
| Predicted no-effects concentration (PNEC) | 0.0031 mg/L | 60.4 mg/kg dw (normalized 100% OC)Footnote Table 127.1 | 0.0005 mg/kg dwFootnote Table 1210 | 0.164 mg/kg bw-day |
| Risk quotient (PEC/PNEC) | 0.23 – 2.3 | 0.7 – 7.0 | 0.11 | 0.043 |
| Measure | Pelagic organisms | Benthic organisms | Fish-consuming Wildlife |
|---|---|---|---|
| Predicted exposure concentration (PEC) | 0.0000204 mg/LFootnote Table 131.10 | 3.29 mg/kg (normalized 100% OC)Footnote Table 134.6 | 0.00005Footnote Table 137.2 mg/kg bw day |
| Critical toxicity value (CTV) | 0.000098 mg/LFootnote Table 132.8 | 151 mg/kg dwFootnote Table 135.2 | 1.635 mg/kg bw dayFootnote Table 138.2 |
| Application factor | 1Footnote Table 133.6 | 100Footnote Table 136.2 | 10Footnote Table 139.2 |
| Predicted no-effects concentration (PNEC) | 0.000098 mg/L | 60.4 mg/kg dw (normalized 100% OC)g | 0.1635 mg/kg bw dayFootnote Table 1310.1 |
| Risk quotient (PEC/PNEC) | 0.21 | 0.054 | 0.00031 |