Phosphorus in aquatic ecosystems: chapter 2
Tracking nutrients in Canadian waters
Recently, a first-ever national level assessment of nutrient levels in Canadian watersheds was completed based on nation-wide data from water quality monitoring stations operated by Environment Canada and jointly by Environment Canada and federal, provincial or territorial partners.
Different forms of phosphorus were measured and include:
- Total phosphorus (TP): a measure of all forms of phosphorus in water (including phosphorus found in organic matter, bound to suspended sediments and dissolved in the water).
- Total dissolved phosphorus (TDP): total phosphorus for a water sample that has been filtered through a membrane (0.45 µm). This fraction can be readily taken up by plants and is often referred to as the bioavailable fraction.
Across Canada, up to 102 stations in rivers and 7 Great-Lakes basins were used to measure concentrations of total phosphorus and total dissolved phosphorus between 1990 and 2006 in order to determine the recent status and trends related to nutrients in aquatic ecosystems.
| Trophic Status | Total Phosphorus (mg/L) | Description | Effects in lakes | Effects in streams |
|---|---|---|---|---|
| Ultra-oligotrophic | <0.004 | Very Low nutrients and plant growth, high water clarity |  |
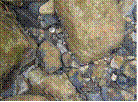 |
| Oligotrophic | 0.004-0.010 | Very Low nutrients and plant growth, high water clarity |  |
 |
| Mesotrophic | 0.010-0.020 | Moderate levels of nutrients and plant growth, reduced water clarity |  |
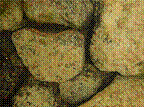 |
| Meso-eutrophic | 0.020-0.035 | Moderate levels of nutrients and plant growth, reduced water clarity |  |
 |
| Eutrophic | 0.035-0.100 | High levels of nutrients and plant growth, low water clarity | 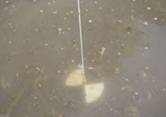 |
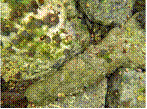 |
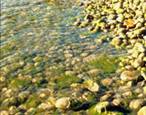
| Hyper-eutrophic | >0.100 | Very high levels of nutrients and plant growth, very limited water clarity |  |
 |
*Please note that in rivers and lakes, water clarity is not only determined by algal growth but also to other suspended particles, such as silt.
Did you know?
Trophic status of an aquatic ecosystem represents its level of nutrients (typically phosphorus) and plant growth. A lake or river with high phosphorus and plant growth is considered eutrophic. Note that eutrophic ecosystems are not always due to a human source of nutrients but can be representative of its natural state.