
Tropical cyclone season summary: 2012
In 2012, five tropical cyclones entered the Canadian Hurricane Centre (CHC) Response Zone (RZ) with two of those storms staying on the very edge of the zone. The CHC issued bulletins on four storms, two of which affected land while the other two were purely offshore events. On September 11th former Hurricane Leslie struck Newfoundland as a post-tropical storm, causing minor to moderate wind damage over the eastern peninsulas of the island. Then, on October 29th and 30th the far-reaching influence of Post-Tropical Storm Sandy was felt over southern Ontario and other parts of Eastern Canada. Regions of Ontario near the Great Lakes experienced minor to moderate wind and wave impacts.
The offshore events included Post-Tropical Storm Chris, skirting the Southeastern Grand Banks on June 22nd, and Post-Tropical Storm Rafael, racing across the southern fringe of the Grand Banks on October 18th. Tropical Storm Michael transitioned to a post-tropical storm over the extreme southeastern portion of the RZand did not require bulletins being issued because of its small size and its distance from the Canadian marine forecast district.

Unnamed tropical storm-force disturbance on the edge of the Grand Banks off Newfoundland.
| BULLETIN SUMMARIES | 2012 | 2011 | 2010 | 2009 | 2008 | 2007 | 2006 | 2005 | 2004 | 2003 |
|---|---|---|---|---|---|---|---|---|---|---|
| Unique Hurricane Information Statements (WOCN3X/4X CWHX) | 64 | 99 | 79 | 37 | 90 | 48 | 93 | 87 | 104 | 113 |
| Number of Storms represented by these Bulletins | 4 | 8 | 4 | 2 | 6 | 4 | 5 | 7 | 8 | 8 |
In addition to the conventional tropical events, there was one additional noteworthy cyclone which tracked over the outer fringe of the Grand Banks on July 25th. The low was not named, but exhibited sub-tropical characteristics on satellite (below) and a compact wind field. As a precaution, the Newfoundland and Labrador Weather Office, in coordination with the CHC, issued gale-force wind warnings for a small portion of the marine forecast district.
Below is a summary of the four primary events of tropical origin that affected Canadian territory in 2012.
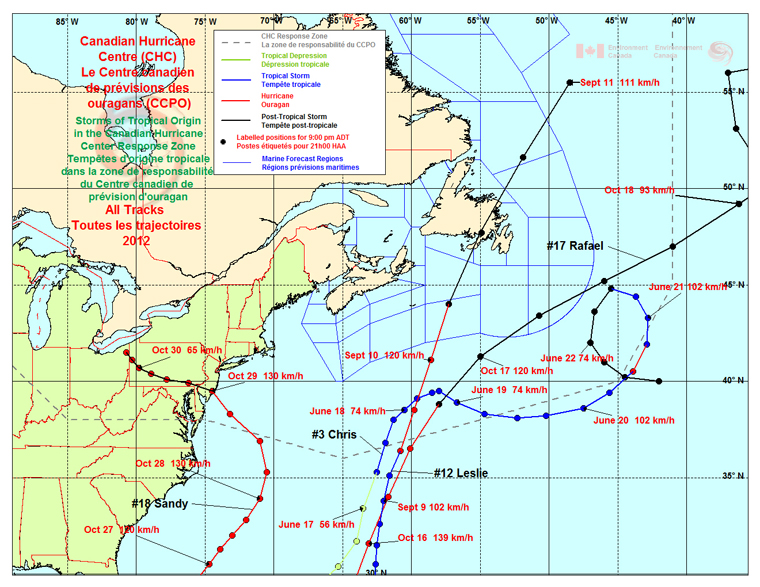
Summary for all Hurricane Tracks and Map Legend. Click for more details
Five storms of tropical origin affected Canadian territory in 2012. Three of these storms affected only offshore waters on the Grand Banks. Two storms affected land areas. Post-tropical Storm Leslie made landfall on the Burin Peninsula of Newfoundland giving hurricane force wind gusts to eastern Newfoundland and heavy rain to Nova Scotia as moisture from the storm fed into a front. Post-tropical storm Sandy affected southern Ontario the most in Canada with damage to homes and vehicles from falling trees. Two fatalities in Canada were attributed to Sandy. A pedestrian was hit by a falling sign and a hydroelectric worker was electrocuted during the post storm cleanup. The Canadian Hurricane Centre (CHC) messaged on two of the three marine storms. Hurricane Chris had no land impacts and minimal impacts over the eastern Grand Banks. Post-tropical Storm Rafael on the other hand had significant marine and coastal impacts. Large long period waves reached the south coast of Newfoundland with Trepassey bearing the largest impact. In addition, higher than normal water levels were reported in St. Johns harbour as a result of the tidal effects of a rapid crossing over the tail of the Grand Banks. There was one other unnamed subtropical storm that gave gales to the Grand Banks on July 25th. The Newfoundland and Labrador Weather Office (NLWO) and CHC coordinated on issuing gale warnings for this storm but the CHC didn’t produce bulletins for the storm.
Map Legend Details

Grey dashed line: represents the perimeter for Canadian Hurricane Centre Response Zone
Green line: represents the path of a Tropical Depression
Thick Blue line: represents the path of Tropical Storm
Red line: represents the path of a Hurricane
Black line: represents the path of a Post-Tropical Storm
Black dot: represents the labelled positions for 9:00 pm Atlantic Daylight Time (ADT).
Thin Blue line: represents the perimeters of the Marine Forecast Regions.
#3 - Chris
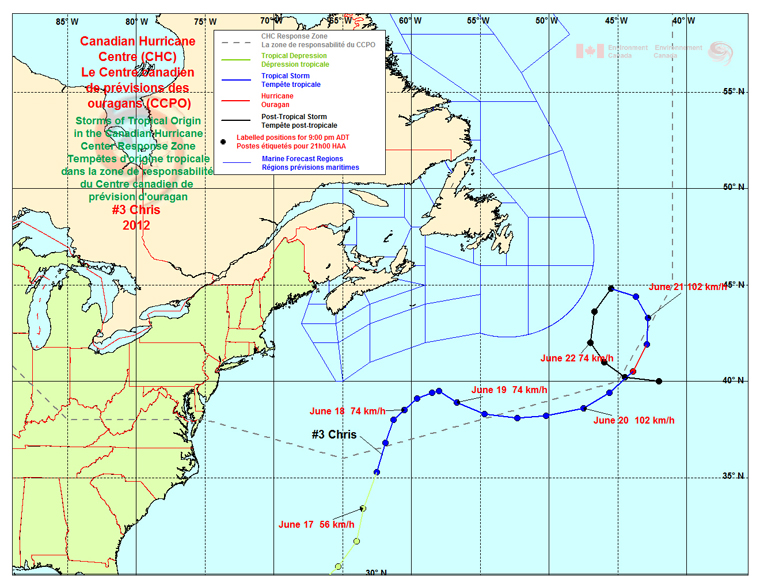
Track readings for Hurricane #3 Chris by the Canadian Hurricane Centre within the Canadian Response Zone. Click for more details.
Hurricane Chris #3
June 16. 2012, 9 PM ADT, wind speed 56 km/h (33.4 N/63.5 W).
Status: Tropical Depression, as indicated by a black dot on a yellow track line.
June 17. 2012, 9 PM ADT, wind speed 74 km/h (38.5 N/60.5 W).
Status: Tropical Storm, as indicated by a black dot on a blue track line.
June 18. 2012, 9 PM ADT, wind speed 74km/h (38.9 N/56.7 W).
Status: Tropical Storm, as indicated by a black dot on a blue track line.
June 19. 2012, 9 PM ADT, wind speed 102 km/h (38.6 N/47.5 W).
Status: Tropical Storm, as indicated by a black dot on a blue track line
June 20. 2012, 9 PM ADT, wind speed 102 km/h (43.3 N/42.8 W).
Status: Tropical Storm, as indicated by a black dot on a blue track line.
June 21. 2012, 9 PM ADT, wind speed 74 km/h (42.0 N/47.0 W)
Status: Post-Tropical Storm, as indicated by a black dot on a black track line.
Storm
Hurricane Chris was a short lived storm that formed on June 17th near 35 degrees north from a non-tropical low. It then tracked eastward and then did a loop to the north. As the storm started the loop it briefly attained hurricane status before becoming Post-Tropical on June 21st. On June 21st and 22nd Post-Tropical Storm Chris completed the loop tracking west and then south on the 21st and then east on the 22nd. No land impacts occurred and impacts on the marine areas of the Grand Banks were minimal. The tail of the banks buoy reported only moderate (15 Knot) north to northeast winds.
Conditions
Because Chris was a purely marine storm, there were no impacts over land. Only moderate north and northeast winds (15 knots) were measured at the Tail-of-the-Bank buoy at 42.9oN 51.5oW.
Impacts
There were no known impacts on land or to offshore infrastructure.
Warnings & Information Statements
The CHC issued five unique information statements for this event. Three to four metre waves were predicted and gale warnings were issued for the extreme southeastern portion of the Grand Banks off Newfoundland.
Coordination and Communications Effort
The CHC and Newfoundland and Labrador Weather Office (NLWO) maintained close communication during the short life of Hurricane Chris.
#12 - Leslie
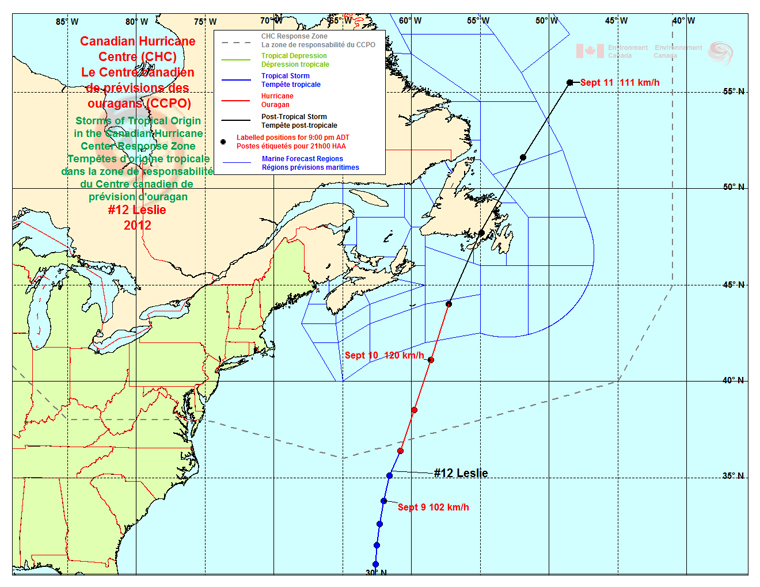
Track readings for Hurricane #12 - Leslie by the Canadian Hurricane Centre within the Canadian Response Zone. Click for more details.
Hurricane Leslie #12
Sept. 8. 2012, 9 PM ADT, wind speed 102 km/h (33.8 N/62.0 W).
Status: Tropical Storm, as indicated by a blue dot on a blue track line.
Sept. 9. 2012, 9 PM ADT, wind speed 120km/h (41.1 N/58.6 W).
Status: Hurricane, as indicated by a black dot on a red track line.
Sept. 10. 2012, 9 PM ADT, wind speed 111 km/h (55.5 N/48.5 W).
Status: Post-Tropical Storm, as indicated by a black dot on a black track line.
Storm
Tropical Storm Leslie formed from a disturbance in the deep tropical Atlantic in early September and travelled well northeast of the Caribbean Islands. Over a five-day period from September 4th to the 9th the tropical storm/weak hurricane spent a prolonged period of time moving very slowly northward. During this time, Leslie travelled about 500 km with a forward speed of only 4-5 km/h, impeded by a large high pressure system to the north. When a front moved off the U.S. Eastern Seaboard on September 9th, Leslie finally began to approach Atlantic Canada. Then the front stalled over Nova Scotia as it approached Leslie. Moisture converging along the front streamed across central Nova Scotia. On September 11th, the tropical storm and front merged and tracked into eastern Newfoundland. The official status of Leslie at landfall was ‘post-tropical’ with maximum sustained winds of 65 knots (120 km/h). The landfall of the very broad centre was over the southern tip of the Burin Peninsula.
Conditions
Although it was not directly related to Leslie, the stalled front over Nova Scotia caused serious flooding with observed rainfall rates of 25 mm/hr. This resulted in flash-type flooding around Truro, Stewiacke and Shubenacadie. The rain fell in an area where flooding was exacerbated by return flow up the tidal rivers connected to the Minas Basin and Bay of Fundy. The greatest total rainfall from the Leslie-stalled front was 165 mm (6.5”) at Shubenacadie, Nova Scotia.
Wind impacts were felt over eastern Newfoundland with greater than hurricane-force wind gusts from the south and southeast measured at several stations. The highest gust of 137 km/h was observed at the very-exposed Cape Pine private station on the southern Avalon Peninsula. A summary of wind and rainfall data appears below.
| Station | Wind Gusts (km/h) |
|---|---|
| Cape Pine, NL* | 137 |
| St. John’s, NL | 132 (94 sust.) |
| Bell Island, NL | 132 |
| Bonavista, NL | 124 |
| Long Pond, NL | 124 |
| Argentia, NL | 120 |
| Station | Rainfall (mm) |
|---|---|
| Cow Head, NL | 108 |
| Englee, NL | 80 |
| Stephenville, NL | 77 |
| Upper Humber, NL | 72 |
| Daniel’s Harbour, NL | 64 |
| Corner Brook, NL | 63 |
Fortunately storm surge was not an issue during Leslie’s landfall in Newfoundland. This was due to local low tide and a neap phase in the tidal cycle. The highest measured surge was 1.1 m in the communities of Argentia and St. Lawrence.
Impacts
Noteworthy impacts included uprooted trees, snapped power poles, damaged roofing and building cladding, broken signage, toppled fences and overturned trucks. Some flooding occurred over western Newfoundland resulting in undermined roadways, lowland inundation and some stream overflows. Coastal impacts seemed to be related to over-wash and wave-breaking causing minor damage to breakwaters and small structures.
Warnings & Information Statements
The CHC issued 23 unique information statements for this long-lived event. Several of these statements were issued while Leslie was nearly stalled to the southeast of Bermuda. Tropical Storm and Hurricane Watches were posted for the eastern half of Newfoundland late on September 9th. Tropical Storm Watches were upgraded to warning level during the morning of September 10th, while Hurricane Watches were held until the center of the storm exited the northern coast of Newfoundland. There were 12 public forecast zones under the warning, with all but one (~90%) experiencing warning-level winds. Rainfall warnings verified correctly for 15 out of 19 (~80%) public forecast regions in Newfoundland.
Coordination and Communications Effort
The CHC and the NLWOmaintained close communication during the long evolution of Hurricane Leslie. Media interest was elevated over a prolonged period given the slow pace of the storm, and it was particularly challenging to communicate the forecast given the much greater-than-normal uncertainty. The approach and subsequent stalling of a front well to the northwest of the hurricane also presented a communications challenge. Many were confused as to which weather system was affecting their area, despite clear descriptions of the differences in the CHC reports. This is a common challenge, given that the boundary between tropical and non-tropical systems is rarely well-defined.
#17 - Rafael
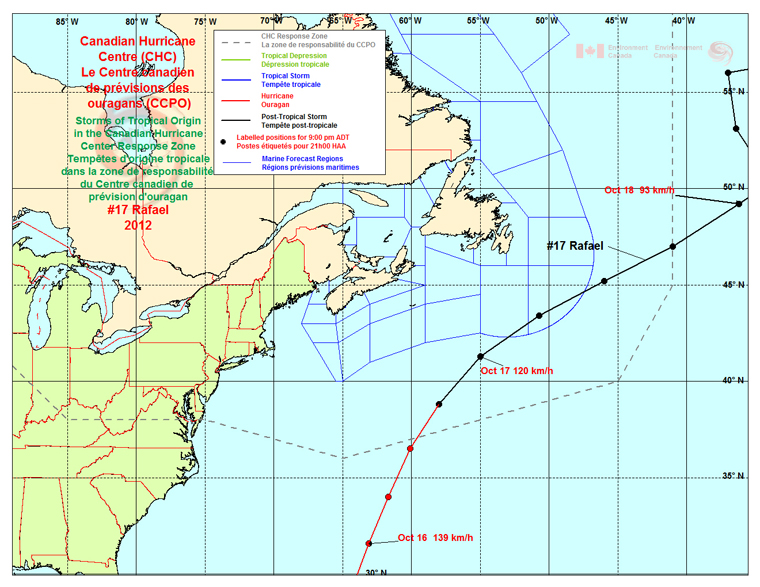
Track readings for Hurricane #17 Rafael by the Canadian Hurricane Centre within the Canadian Response Zone. Click for more details
Hurricane Rafael #17
Oct. 15, 2012, 9 PM ADT, wind speed 139 km/h (31.6 N/63.1 W).
Status: Hurricane, as indicated by a black dot on a red track line.
Oct. 16, 2012, 9 PM ADT, wind speed 120km/h (41.3 N/55.0 W.
Status: Post-Tropical Storm, as indicated by a black dot on a black track line.
Oct. 17, 2012, 9 PM ADT, wind speed 93 km/h (49.2 N/36.2 W).
Status: Post-Tropical Storm, as indicated by a black dot on a black track line.
Storm
Rafael formed in the eastern Caribbean late on October 12th and moved slowly northward, attaining hurricane status late on the 15th. Extratropical transition started almost as soon as Rafael became a hurricane and was complete by late on October 17th as the storm’s cloud shield rapidly fanned-out while tracking about 200 km east of Bermuda. Forward acceleration occurred on October 18th while the hurricane-strength post-tropical storm traversed the southern Grand Banks off Newfoundland.
Conditions
The southern coast of the Avalon Peninsula of Newfoundland experienced heavy surf generated by waves travelling northward as the storm moved along a straight north-northeastward trajectory. Four to seven metre waves with a 16-second period were measured at the Nickerson Bank Buoy about 35 km offshore south of Trepassey, Newfoundland. Elevated water levels were witnessed in St. John’s Harbour, likely from the rapid-tide effect described in special bulletins issued by the CHC and the NLWO (see ‘Warnings and Statements’).
There were few weather impacts over land. The high cloud shield from extratropically-transitioning Rafael overspread Nova Scotia and Newfoundland. Heavy rain associated with a front extending well north of Rafael passed not far offshore late on October 17th. Cape Race measured some moderate rainfall for a brief period, amounting to 6 mm.
Waves were estimated to have been above 10 metres well offshore to the right of Rafael’s track. No detailed information was available for analysis of the waves from this storm during the extratropical transition.
Impacts
Large waves and run-up were the primary impacts along some southern coastline communities of Newfoundland. In Trepassey, about 110 km south-southwest of the capital city of St. John’s, heavy surf tore apart a 10-metre section of a breakwater connecting two parts of the community and heavily damaged an additional 500-metre portion of coastal roadway. More than $1 million in damages was estimated to have occurred in the area as a result of the far-reaching wave impacts.
Warnings & Information Statements
The CHC issued 18 unique information statements for Rafael. During its post-tropical phase, Rafael travelled rapidly across the southern Grand Banks with a forward speed near 45 knots (80-85 km/h). Special statements were issued to alert the coastal communities in southeastern Newfoundland of rapid changes in water levels and ocean currents. This unique effect occurs when sharp wind and pressure features rapidly cross shallow offshore waters. Fortunately these fluctuations occurred before the local high tide, so there were no reports of flooding. Hurricane-force wind warnings were posted for the southernmost portion of the Grand Banks.
Coordination and Communications Effort
The CHC and NLWO maintained close communications during this event. Although there was very little media interest in this event given the far-offshore track, a local newspaper reported on the unusual water level alerts on Thursday, October 18th.
#18 - Sandy
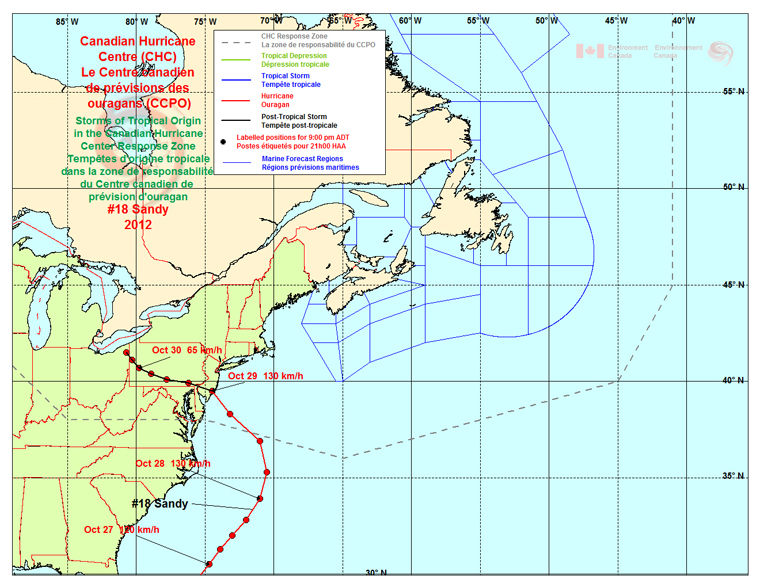
Track readings for Hurricane #18 Sandy by the Canadian Hurricane Centre within the Canadian Response Zone. Click for more details
Hurricane Sandy #18
Oct. 26, 2012, 9 PM ADT, wind speed 120 km/h (30.5 N/74.7 W).
Status: Hurricane, as indicated by a black dot on a red track line.
Oct. 27, 2012, 9 PM ADT, wind speed 130km/h (33.9 N/71.0 W).
Status: Hurricane, as indicated by a black dot on a red track line.
Oct. 28, 2012, 9 PM ADT, wind speed 130 km/h (39.5 N/74.5 W).
Status: Post-Tropical Storm, as indicated by a black dot on a black track line.
Oct. 29, 2012, 9 PM ADT, wind speed 65 km/h (40.7 N/79.8 W).
Status: Post-Tropical Storm, as indicated by a black dot on a black track line.
Storm
Tropical Storm Sandy formed in the southern Caribbean Sea from a very large area of cloudiness on October 22nd. Over the next two days the storm moved northward and became a hurricane as it approached eastern Jamaica. Early on October 25th, Sandy intensified to category three storm and made landfall in eastern Cuba. After leaving Cuba, Sandy tracked through the Bahamas after weakening to a category one storm. Although a category one storm, Sandy was a very large storm as it tracked northeastward well off the Carolina coast on October 27th. This very large storm interacted with several troughs of low pressure on October 28th and 29th, resulting in further deepening and a turn to the north and then northwest. Sandy became a very powerful Post-Tropical storm just prior to landfall near Atlantic City, New Jersey during the evening of October 28th. Post-Tropical Storm Sandy weaken rapidly after landfall and tracked west-northwestward into Pennsylvania on October 30th then dissipated on the 31st.
Conditions
The intense post-tropical storm caused extensive damage over a large portion of the Eastern Seaboard of the United States near and well outside of the landfall point in New Jersey. The circulation extended well into Eastern Canada and the Great Lakes. High winds gusted from the north and northeast over southern Quebec and Ontario. Warm southeast winds blew into Atlantic Canada. Wind blowing down the length of Lake Huron resulted in high waves and storm surge, with seas of five to seven metres measured at buoy 45149 in the southern end of the lake.
Select wind and rainfall data from Canada appear in the table below:
| Station | Wind Gusts (km/h) |
|---|---|
| Western Island, ON | 106 |
| Kitchener, ON | 87 |
| Burlington, ON | 95 |
| Oshawa, ON | 87 |
| Point Petre, ON | 93 |
| London, ON | 80 |
| Toronto Island, ON | 91 |
| Toronto (Pearson), ON | 80 |
| Quebec (Orleans), QC | 87 |
| Brier Island, NS | 78 |
| Montreal (Laval), QC | 87 |
| Blue Water Bridge, ON* | 121 |
*Bridge connecting Canada and the U.S. at Sarnia, ON.
Note however that the wind instruments are atop the bridge, around 60 m - six times higher than the accepted standard 10-metre height for wind measuring instruments.
Rainfall was not a significant issue in Canada. The greatest measured amount was 55 mm in Charlevoix, Quebec, while all other primary reporting stations received less than 50 mm.
Waves approaching the south shore of Nova Scotia were in the range of five to eight metres (e.g. buoy 44150). These waves resulted in elevated water levels up to 60 cm along parts of the Atlantic coast in western Nova Scotia.
Impacts
High wind gusts downed tree limbs and whole trees leading to numerous power outages across southern Ontario. There were a few reports of trees falling on vehicles and homes causing significant damage. Sandy implicated in two fatalities in Canada - one in Toronto when a large sign was blown down and struck a pedestrian. The second occurred in Sarnia, Ontario, when a hydroelectric worker was electrocuted during the post-storm cleanup. The Sarnia area was hit particularly hard as a result of strong north winds off Lake Huron in addition to storm surge and heavy surf. The city was littered with downed trees and power poles, with some reported structural damage to buildings including part of a roof blown off a hotel. Over $10 million in private property damage was estimated to have occurred. Fierce winds and record-high waves disrupted cargo ship travel through Lake St. Clair and the adjacent waterways connecting Lake Erie and Lake Huron.
Warnings and Information Statements
Wind warnings were posted for many portions of southern Ontario and parts of Quebec near the St. Lawrence River. Warning-level winds materialized in Ontario. Rainfall warnings were not issued except for the Charlevoix region of Quebec. Various marine warnings were issued including storm-force winds over Lake Huron.
The CHC issued 18 unique information statements for Sandy, commencing on the afternoon of Thursday, October 25th. Another statement was issued on Friday, followed by regular statements issued every six hours beginning on Saturday morning, well ahead of the worst of the weather (which arrived in Ontario during the early hours of Tuesday, October 30th). The final summary bulletin from the CHC was issued at 3 pm ADT on October 30th. There were no official tropical-type watches or warnings since much of Sandy’s transformation to a post-tropical storm began before landfall in the U.S.
Coordination and Communications Effort
There was an unprecedented amount of media interest and interoffice communications due to the broad expanse of the storm’s impact. The challenge in Canada was to effectively communicate the threat and how it differed from what was happening in the U.S. This was not unlike the challenge that existed in 1985 with Hurricane Gloria tracking into Canada from the U.S. - interestingly, the weather event that served as the catalyst for the creation of the CHC. Hurricane Sandy’s extratropical transition and uncharacteristic northwestward track into New England was very well predicted by the numerical weather models, well in advance. This permitted very early communication (five to seven days ahead of the event) to occur between the CHC, all of the Meteorological Service of Canada’s eastern and national centres and emergency management partners. The threat of rainfall was communicated earlier during the evolution of Sandy, but as time elapsed, the threat of rain-related flooding decreased. Details about wind impacts were emphasized closer to the event. On Monday, October 29th, the CHC and Ontario Storm Prediction Centre alerted areas around southern Ontario of specific wind-related impacts such as falling trees and power outages.