
Blanding’s turtle (Emydoidea blandingii) select populations COSEWIC assessment and status report 2016: chapter 3
Wildlife species description and significance
Name and classification
Blanding’s Turtle (Emydoidea blandingii) was originally named and described by Holbrook (1838) as a member of the genus Cistuda based on morphological characteristics resembling the European Pond Turtle, Emys orbicularis (then Cistuda europea), and the Eastern Box Turtle, Terrapene carolina (then Cistuda carolina). Blanding’s Turtle was then grouped in the genus Emys with E. orbicularis based on morphological similarities such as unkeeled carapaces, kinetic shells, and colouration (Feldman and Parham 2002). It remained as such until separated into the genus Emydoidea as the sole member (McCoy 1973). Some taxonomists have recommended that the genus Emydoidea be reclassified within Emys (Feldman and Parham 2002; Spinks and Shaffer 2005) based on morphological and ecological traits as described by Loveridge and Williams (1957), thus eliminating the genus Emydoidea. Crother (2012) recommended that both the genus Emydoidea and the polyphyletic genus Emys be maintained for the sake of current stability and in consideration of monotypic genera as being valuable for providing phylogenetic information.
Morphological description
Adults
Relative to other North American freshwater turtles, Blanding’s Turtles are of medium size with a smooth domed carapace (upper shell) that is black with yellowish spots and flecks (see Cover Photo). The bright yellow chin and throat are this species’ most characteristic features. The scales and skin are black and yellow. The neck is long and the mouth curves upward in the form of a smile (Figure 1). The plastron exhibits an anterior hinge and a dark rectangular blotch on the outer edge of each scute (Figure 2), although entirely dark plastrons are sometimes observed. Male Blanding’s Turtles have a moderately concave plastron and a vent that extends beyond the posterior edge of the carapace; males also tend to have a dark upper beak. Female Blanding’s Turtles have a flatter plastron, a shorter and narrower tail, a vent that does not extend past the posterior edge of the carapace and an upper beak streaked with yellow.
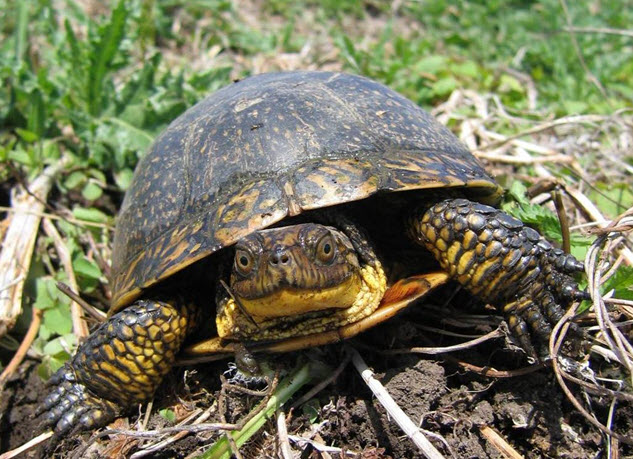
Long description for Figure 1
Photo of a Blanding’s Turtle, facing the camera. The carapace is smooth and domed with yellowish spots and flecks on a black background. The bright yellow chin and throat are this species’ most characteristic features. The scales and skin are black and yellow.

Long description for Figure 2
Photo of the underside of an adult female Blanding’s Turtle, showing a dark rectangular blotch on the outer edge of each yellowish-brown scute.
Reported carapace lengths (CL) of Canadian Blanding’s Turtle adults range from 12.6 cm to 26.7 cm, with southwestern Ontario subpopulations averaging smaller sizes than those reported in Québec, southcentral Ontario and Nova Scotia (mean CL 20 cm, 24 cm, 23 cm and 21 cm respectively) (Gillingwater and Brooks 2001; Gillingwater and Piraino 2004; Gillingwater 2009; Caverhill et al. 2011; St-Hilaire et al. 2013; Nova Scotia Blanding’s Turtle Database 2014; Québec Turtle Recovery Team unpub. data; Edge unpub. data; Gillingwater unpub. data; Paterson unpub. data). In Nova Scotia, adult size varies significantly among at least two of the subpopulations (McNeil 2002) and sexual size dimorphism is evident, with adult males tending to be larger than adult females (McNeil 2002; Caverhill 2003; Lefebvre et al. 2011).
Hatchlings
Reported hatchling Blanding’s Turtle sizes range from 24 mm to 40 mm CL (Standing et al. 2000; Gillingwater and Brooks 2001; Riley et al. 2012; Nova Scotia Blanding’s Turtle Database 2014) and 6 to 12 g in weight (Gillingwater and Brooks 2001). The carapace of hatchlings is often plain brown-grey with faint spots or streaks; however, some individuals may display a more obvious pattern (Figure 3). The tail is approximately one-half to two-thirds the length of the carapace and is proportionally much longer than that of the adult. The plastron is characterized by a central greyish spot. The throat and chin are creamy yellow. The pattern of spots and streaks on the carapace typically begins to develop around 8-10 months (McNeil pers. obs.) and the plastral hinge does not become fully functional until approximately 5 years of age (at ~100 mm CL; Gillingwater unpub. data).
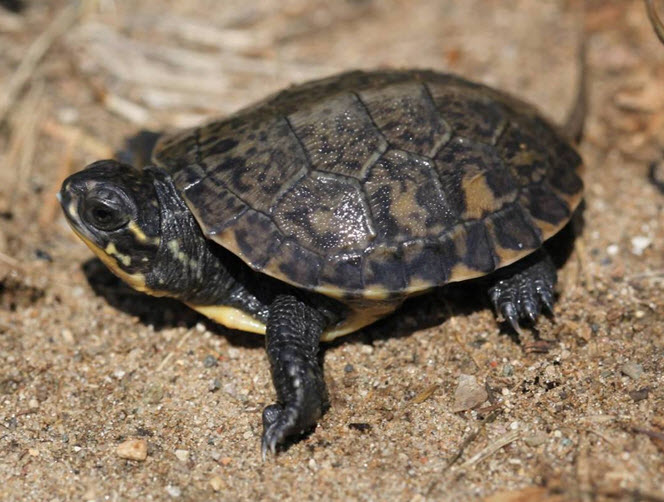
Long description for Figure 3
Photo of a hatchling Blanding’s Turtle showing dark grey and dull beige patterning on the carapace. The throat and chin are creamy yellow.
Population spatial structure and variability
In Ontario, a recent study (Davy et al. 2014) was carried out to investigate the level of population structure and genetic diversity among subpopulations given that atlas data for this species have revealed a discontinuous distribution across the province. The study amplified samples at four microsatellite loci developed for Blanding’s Turtle and 13 loci developed for Bog Turtle Glyptemys muhlenbergii that cross-amplified with Blanding’s Turtle. Overall, 97 individuals were genotyped from eight geographically disjunct Ontario subpopulations spread approximately 150-500 km apart. The study revealed a minimum of two genetically distinct populations and four subpopulations in Ontario (Lake Erie/Golden Horseshoe and Georgian Bay/Eastern Ontario) with assignment tests identifying individuals to area of origin with high accuracy (69-79%). The results also suggested that the Ontario Blanding’s Turtle subpopulation is not immediately threatened by loss of genetic diversity given that levels of genetic variation (e.g., heterozygosity, allelic diversity) were comparable to those reported for other turtle populations. The authors did suggest, however, that long generation times may have slowed the loss of genetic variation in Blanding’s Turtle across the study area, which in turn may be further exacerbated by significant habitat fragmentation and continuing population decline (Davy et al. 2014). No genetic analyses have been conducted for the Québec subpopulation.
Blanding’s Turtles were only recently (1952) discovered to exist in Nova Scotia (Bleakney 1958). The Nova Scotia population is restricted to a few watersheds in southwest Nova Scotia and is geographically isolated from the rest of the species’ range (Herman et al.1995). Genetic studies indicate that this population has diverged significantly from other populations in the species’ range (Mockford et al. 1999). Despite its small size and isolation, the Nova Scotia population contains a relatively high degree of genetic variation (Mockford et al. 1999). Within the Nova Scotia population, three main subpopulations have been identified which are genetically distinguishable. The estimates of gene flow are very low (1.8 – 5.8 individuals per generation), despite proximity (15-25 km) of the three subpopulation centres (Mockford et al. 1999,2005). Mockford et al. (2005) reported that microsatellite analysis of five loci resulted in Fst values of 0.042-0.124 (p<0.05) in pairwise comparisons between the subpopulations. Analysis suggests that this population structure likely pre-dates European influence on the landscape and there is no evidence of a recent population bottleneck (Mockford et al. 2005). Genetic variation is likely maintained by small but significant migration of individuals among these subpopulations (Toews 2004); however, genetic structuring is evident within one subpopulation between streams separated by as little as 5 km (Toews 2004; Mockford et al. 2005). A seemingly sizable subpopulation was discovered in 2016 (NS7); its relationship to the other three main subpopulations is not yet known.
Designatable units
There are two designatable units (DUs) that meet the criteria for discreteness and significance. The Canadian population of Blanding’s Turtles is divided into two geographically separated units and exists in two different faunal provinces. The first unit is the Nova Scotia population, in the Appalachian/Atlantic Coast Terrestrial Amphibian and Reptile Faunal Province as well as in the Atlantic Ecological Area, and occurs at the northeastern periphery of the species’ range. This unit is separated from the rest of the range by several hundred kilometres. Because of its isolation, there is no reasonable likelihood of dispersal from other populations in Canada or the U.S.A. The Nova Scotia population has significantly diverged genetically from the tested populations in the main range (Mockford et al. 1999; Rubin et al. 2001) and may be an evolutionarily significant unit at the subspecies or species level (Mockford et al. 2007). The second Canadian designatable unit occurs in the Great Lakes/St. Lawrence Terrestrial Amphibian and Reptile Faunal Province, and in the Great Lakes Plains Ecological Area. It exists within Ontario and Québec.
Special significance
The Blanding’s Turtle is of biological significance because it is one of the longest-lived freshwater turtles (Congdon et al. 1993,2001; Rubin et al. 2001), with a lifespan exceeding 83 years (University of Michigan News May 25, 2016). Thus, the Blanding’s Turtle has been used in models of conservation and demography (Congdon et al. 1993), and to test competing hypotheses on why and how organisms age (Congdon et al. 2001). It is also the only living representative of the genus Emydoidea and has one of the smallest global ranges compared to most other North American turtles. It has been proposed that the Nova Scotia population be recognized as an evolutionarily significant unit because of its isolation and potential for continued genetic divergence from the species’ main range (Mockford et al. 2007). This turtle is at risk across its global range (NatureServe 2014) and as such, has been widely adopted as a “poster” species for conservation research. To its detriment, the Blanding’s Turtle has become an increasingly popular species in the pet, food and traditional medicine trades.
Distribution
Global range
The global range of the Blanding’s Turtle’s is centred in and around the Great Lakes Basin (Figure 4), with approximately 20% of the range contained within Canada. In the United States, the species’ range extends from Nebraska and South Dakota, eastward through Iowa, Minnesota, Missouri, Wisconsin, Illinois, Indiana, Michigan, Ohio, and Pennsylvania. There are also small subpopulations in New York, Massachusetts, New Hampshire and Maine.
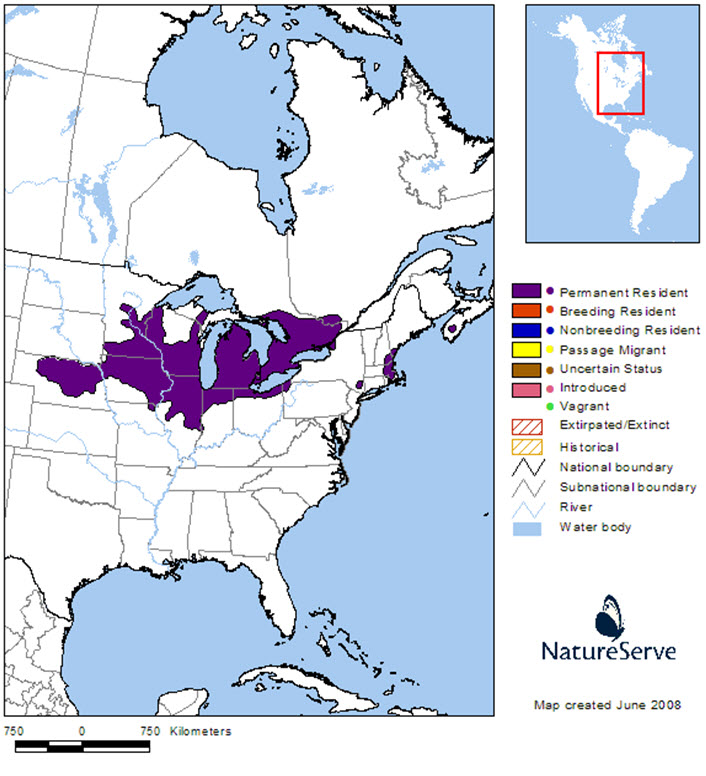
Long description for Figure 4
Map of the global range of the Blanding’s Turtle, centred in and around the Great Lakes Basin in North America. Approximately 20 percent of the range occurs in Canada, Ontario, Quebec, and Nova Scotia. In the United States, the species’ range extends from Nebraska and South Dakota, eastward through Iowa, Minnesota, Missouri, Wisconsin, Illinois, Indiana, Michigan, Ohio, and Pennsylvania. There are small subpopulations in New York, Massachusetts, New Hampshire and Maine.
Canadian range
In Canada, the Blanding’s Turtle is primarily found within the southern portions of Ontario, Québec and Nova Scotia (Atlas des Amphibians et des Reptiles du Québec (AARQ); Ontario Reptile and Amphibian Atlas (ORAA); Nova Scotia Blanding’s Turtle Database).
In Ontario, Blanding’s Turtle mainly occurs from extreme southwestern Ontario, east to Ottawa and northwest to Sault-St. Marie; however, a handful of isolated records occur as far north as Timmins district (OMNRF Timmins District pers. comm. 2014). The Ontario distribution is not continuous and there are large portions of the province with few to no records, including the area from north of Sudbury to Timmins; the area from Grey and Bruce counties south to Waterloo County and east to Lake Simcoe; extreme southeastern Ontario; and the areas west and south of Algonquin Provincial Park. Interestingly, models predicted these zones as maintaining lower habitat suitability for Blanding’s Turtle (Millar and Blouin-Demers 2012); thus, low numbers of records in these zones may reflect low abundances rather than inadequate survey efforts.
In Québec, the main subpopulation occurs within the Outaouais region; however, individuals have also been reported from the Abitibi-Témiscamingue region, the Montérégie region and the Capitale-Nationale region (Bernier 2014).
In Nova Scotia, the majority of the known turtles occur in three main subpopulations on two watersheds. Three additional small concentrations of individuals (3-8 adults), which may or may not be part of one of the three main subpopulations, were confirmed in 2012, including one on a previously undocumented watershed. A forth subpopulation was discovered in spring 2016; its size and extent are not yet known. Additional undiscovered populations may occur in the province and anecdotal sightings have been reported from several areas (McNeil 2002; Herman et al. 2003; Nova Scotia Blanding’s Turtle Database 2014), though most have not been verified through images or specimens. A few photo-verified sightings of single individuals outside the known range have been documented but follow-up surveys have failed to find additional turtles. It is unknown if Blanding’s Turtles inhabit these areas or if these were isolated sightings of vagrants, possibly moved there by people.
Extent of occurrence and area of occupancy
The extent of occurrence (EOO) for this species within the Great Lakes/St. Lawrence population is 405,273 km2. Although this estimate suggests that the EOO has increased by ~331,000 km2 since the 2005 status report, this is not representative of the actual level of increase in EOO, but rather, partly due to differences in calculation methods. EOO was previously calculated by removing areas of unsuitable habitat; however, the present method of EOO estimation is based on a minimum convex polygon around all known, inferred or projected sites of present occurrence of the species, with areas outside Canada’s jurisdiction removed; therefore, the previous and new estimates cannot be compared (Wu pers. comm. 2014). Recalculation of the 2005 EOO according to the new guidelines, provides an estimate of ~282,170 km2, so the actual increase in EOO from 2005 is ~123,103 km2. This increase in EOO since 2005 is largely the result of a handful of isolated sightings in northern Ontario and Québec as well as the Capitale-Nationale region of Québec, that greatly extended the polygon. If these isolated sightings were removed, it would reveal that the bulk of the Great Lakes/St. Lawrence population lies within an area of ~222,000 km2 (i.e., approximately half the size of the current estimated EOO). In 2005, the index of area occupancy (IAO) for the Great Lakes/St. Lawrence population was estimated at 9852 km2 (based on 2463 ‘2 km x 2 km’ grids) and is currently estimated at > 9900 km2 (based on 2475 grids); so there has been very little change in IAO since 2005. If the isolated sightings to the far north and east are removed from the estimate, the IAO decreases to > 9880 km2 (based on 2470 grids).
The EOO of the Nova Scotia population is ~1354 km2 and the IAO is 392 km2 (based on 98 ‘2 km x 2 km’ grids). These calculations include the area encompassing the seven subpopulations and concentrations, but do not include unconfirmed sightings or confirmed isolated sightings of single individuals for which follow up studies failed to detect additional individuals. Critical habitat has been identified for the Nova Scotia subpopulations (Parks Canada 2012). Identified critical habitat encompasses the known geographic limit of each subpopulation and includes the known seasonal habitats used by all life stages as well as aquatic and terrestrial areas that connect these habitats (Parks Canada 2012). Within critical habitat, high use areas have been identified that include the specific seasonal sites occupied by Blanding’s Turtles, excluding travel routes. These high-use polygons comprise 57 km2, which can be considered the minimum biological area of occupancy for the Nova Scotia population. Critical habitat identified in the recovery strategy does not include the subpopulation discovered in 2016 (NS7) or the smaller concentrations discovered in 2012 (NS4, NS5, NS6). Critical habitat in these areas will be included in the species’ action plan currently in development.
Search effort
This section describes the qualitative (i.e., distributional) search effort used to locate Blanding’s Turtles at potential sites (new or historical) in order to aid in determining the species’ Canadian range. For a discussion of sampling efforts and methods used to estimate sizes and demography of known subpopulations see Population Sizes and Trends – Sampling Effort and Methods and Table 1.
Much of what we know about the distribution of Blanding’s Turtle across Canada has been collected over the last 30 years by the following volunteer reporting programs: the Ontario Herpetofaunal Summary (since 1984); the Atlas des amphibiens et reptiles du Québec (since 1988); the Toronto Zoo’s Ontario Turtle Tally Program (since 2003); the Ontario Reptile and Amphibian Atlas (since 2009); and the Nova Scotia Blanding’s Turtle Database (since 1996).
| Subpopulation | Size of Study Site | Male : Female ratio & Adult : Juvenile ratio | Adult population estimate OR # of adults found | Density (adults/ha) | Study period (# of seasons) | Sampling effort | Survey methods | Sources |
|---|---|---|---|---|---|---|---|---|
| SW Ontario 1 | 3300 ha | 1M : 1.2F 20.6A : 1J | 690 Schnabel Method (modified closed-capture model) | 0.21 | 9 seasons (2000-2001; 2008-2014) | >650 person-days | Hand/dip net captures while conducting visual surveys in wetlands and nesting areas | Gillingwater and Brooks 2001; Davy unpub. data |
| SW Ontario 2 | 607 ha | 1.35M : 1F 9.4A : 1J | 818 based on an estimated 341 ±214 adult females (Jolly-Seber method in program JOLLY using model A and mark-recapture data from 2003-2006) and an average sex ratio of 1.4M:1F. | 1.35 | 21 seasons (1973; 1979; 1980; 1982; 1992-1994; 2003-2016) | >680 person-days; ~500 trap days | Hand/dip net captures while conducting visual surveys in wetlands and nesting areas; hoop net traps | Weller 1973; Hubbs 1979; Purves 1980; Ashenden 1983; Saumure 1995; Gillingwater and Piraino 2004, 2007; Piraino and Gillingwater 2005, 2006; Gillingwater 2009, 2013; Enneson 2009 |
| SW Ontario 3 | 800 ha | 1M : 3.2F 10A : 1J | 138 Lincoln Index where N=MC/R (using data from 2010-2011) | 0.17 | 5 seasons (2010-2014) | 1317 person-hours; 2200 trap days | Hand/dip net captures while conducting radio-telemetry surveys, road mortality surveys and visual surveys in wetlands and nesting areas; hoop net traps | Caverhill et al. 2011; Toronto Zoo unpub. data |
| SW Ontario 4 | 1500 ha | 1M : 2.32F 14.5A : 1J | 82 found | ~ | 2 seasons (2001-2002) | >200 person-days; 2280 trap days | Hand/dip net captures while conducting visual surveys in wetlands and nesting areas; basking, hoop net and live traps | Browne and Hecnar 2007 |
| SW Ontario 5 | 68 ha | 1M : 1F 6A : 1J | 5 found (this # is considered representative of the total adult population size due to the large sampling efforts) | ~ | 10 seasons (2005-2014) | 1855 person-hours | ?? | Toronto Zoo unpub. data |
| SE Ontario 1 | 3724 ha | ?M : ?F 5.2A : 1J | 26 found | ~ | 3 seasons (2012-2014) | >27 trap days (2013); >4500 trap hours (2014) | Hand/dip net captures while conducting radio-telemetry surveys and visual surveys in wetlands; hoop net traps | Carstairs 2014, unpub. data |
| SE Ontario 2 | 690 ha | 1M : 2F 4.3A : 1J | 99 (95% CI: 89-124) | 0.14 | 4 seasons (2010-2013) | 5300 person-hours; 2360 trap days | Hand/dip net captures while conducting radio-telemetry surveys, road mortality surveys and visual surveys in wetlands; hoop net traps | Dillon Consulting Ltd. 2014 |
| SE Ontario 3 | 900 ha | 1.3M : 1F 30.3A : 1J | 114 (95% CI: 103-136) Closed capture model in MARK | 0.13 | 3 seasons (2007-2009) | Wetlands surveyed every day from April-Sept every season. Hoop traps were also set all season. | Hand/dip net captures while conducting radio-telemetry surveys and visuals surveys in wetlands; hoop net traps | Millar 2009, unpub. data; Millar and Blouin-Demers 2012 |
| SE Ontario 4 | 238 ha | 1M : 1F ?A : ?J | 85 (95% CI: 53-206) Schnabel Method (modified closed-capture model) | 0.36 | 5 seasons (2010-2014) | ~68 person- days ~54 trap days | Hand/dip net captures while conducting visual surveys in wetlands; hoop net and basking traps | Middleton 2014; Ontario Nature unpub. data |
| SC Ontario 1 | 340 ha | 0.6M : 1F 6.3A : 1J | 41 (95% CI: 39-50) | 0.12 | 5 seasons (2006-2008; 2009-2010) | Wetlands surveyed several days between April-May every season. Nightly nest site patrols from 7-11pm for 3-4 weeks/season. Several incidental captures during telemetry and at communal hibernacula. | Hand/dip net captures while conducting visual surveys in wetlands and nesting areas | Edge et al. 2009, 2010, unpub. data; Paterson et al. 2014, unpub. data |
| SC Ontario 2 | 1,100 ha | 1.4M : 1F 9.5A : 1J | 19 found | ~ | 2 seasons (2011-2012) | 150 person-hours; 210 trap days | Hand/dip net captures while conducting radio-telemetry surveys and visual surveys in wetlands; hoop net traps | Markle and Chow-Fraser 2014, unpub. data |
| SC Ontario 3 | 90 ha | 1M : 1.2F 5.9A : 1J | 57 Lincoln Peterson N=n1*n2/m2 | 0.63 | 2 seasons (2013-2014) | 134 person-hours (2013); 1128 person-hours (2014) | Hand/dip net captures while conducting visual surveys in wetlands | Sheppard 2013, 2014, unpub. data |
| SC Ontario 4 | 250,000 ha | 1M : 2.1F 13A : 1J | 102 found | ~ | 2 seasons (2013-2014) | ?? hours (2013) >2500 hours (2014) | Hand/dip net captures while conducting radio-telemetry surveys, road mortality surveys and visual surveys in wetlands | Scales Nature Park unpub. data |
| Québec | >60,000 ha | 1M : 1.1F 4.9A : 1J | 188 found | ~ | 6 seasons (1996-1997; 2009-2011; 2013) | 1500 person-hours; >2600 trap days | Hand/dip net captures while conducting radio-telemetry surveys and visual surveys in wetlands; fyke net and crab pot traps | NCC 2007; Dubois 2009; Fortin and Dubois 2010; Dubois et al. 2011, 2012, unpub. data; Bernier 2013, unpub. data; St.-Hilaire et al. 2013. |
| Nova Scotia 1 | 942 ha | 1.2M : 1F 1.5A : 1J (wild juveniles only) 1A : 2.2J (incl. all released headstarts) | 131 (129-134) Jolly Seber (using data from 1987-2013 excluding 1990-1991) | 0.14 | 46 seasons (Primarily 1971-72; 1977-79; 1987-88; 1992-2016) | 5212 trap nights (>3300 field hours); ~2100 person-hrs visual surveys; > 10000 hrs nesting surveys; ~4000 hrs radio-telemetry | Hand captures while conducting radio-telemetry and visual surveys in wetlands and nesting areas; hoop net traps | Power 1989; Green and McNeil 2014; Nova Scotia Blanding’s Turtle Database 2014 |
| Nova Scotia 2 | 260 ha | 1M: 1.1F 1.7A: 1J | 79 (60-116) Schnabel (using data from 1997-2002) | 0.30 | 21 seasons (1995-2016) | >2400 trap nights (>500 hrs field effort); > 300 hrs person-hours visual surveys; 1000 hrs radio-telemetry; >3500 hrs nesting surveys | Hand/dip net captures while conducting radio-telemetry and visual surveys in wetlands and nesting areas; hoop net traps | McNeil 2002; Nova Scotia Blanding’s Turtle Database 2014 |
| Nova Scotia 3 | 877 ha | 1M : 1F 1.5A : 1J | 118 (106-139) | 0.13 | 19 seasons (1997-2015) | 6892 trap nights (2172 field hours); 1254 hrs radio-telemetry; 296 hrs visual surveys; >3000 hrs nesting surveys | Hand/dip net captures while conducting radio-telemetry and visual surveys in wetlands and nesting areas; hoop net traps | Nova Scotia Blanding’s Turtle Database 2014 |
| Nova Scotia 4 | 58 ha | 1M : 2F 2.2A : 1J | 8 found | 0.16 | 4 seasons (2012-2015) | 200 trap nights (105 hrs field effort); 325 hrs radio-telemetry; >116 hrs visual surveys; 67 hrs nesting surveys | Hand/dip net captures while conducting radio-telemetry and visual surveys in wetlands and nesting areas; hoop net traps | Nova Scotia Blanding’s Turtle Database 2014 |
| Nova Scotia 5 | 37 ha | 2M : 1F 3A : 0J | 3 found | 0.08 | 2 seasons (2004-2005) | 246 trap nights (77 field hours); 1.7 hrs visual surveys | Hoop net traps | Nova Scotia Blanding’s Turtle Database 2014 |
| Nova Scotia 6 | 66 ha | 2M : 1F 3A : 1J | 3 found | 0.05 | 3 seasons (2007-2009) | 590 trap nights (318 field hours); 79.5 hrs visual surveys; 122 hrs radio-telemetry; 4 hrs nesting surveys | Hand/dip net captures while conducting radio-telemetry and visual surveys in wetlands and nesting areas; hoop net traps | Nova Scotia Blanding’s Turtle Database 2014 |
| Nova Scotia 7 | 306 ha* *full extent not yet known | 0.6M:1F (No J yet found) | 31 found | 0.10 | 1 season (2016) | >600 hrs tracking and visual surveys | Hand/dip net captures while conducting radio-telemetry and visual surveys in wetlands and nesting areas | Nova Scotia Blanding’s Turtle Database 2014 |
It is difficult to know how many targeted searches for new or historical Blanding’s Turtle sites have been conducted in Ontario because these efforts are not coordinated. In the early 2000s, limited searches (~140 person-hours across 10 sites) were conducted at some of the best remnant wetlands in southwestern Ontario’s Oxford, Middlesex and Perth counties (Gillingwater and Piraino 2002; Gillingwater unpub. data); only two specimens were found at two different Middlesex sites, each of which were fragmented and surrounded by agriculture. Herpetofaunal surveys in the Niagara region between 2006-2008 confirmed the presence of Blanding’s Turtles at only four of 11 historical sites (Yagi et al. 2009). Although extensive herpetofaunal surveys were conducted throughout the Bruce Peninsula from 2007-2014, no Blanding’s Turtles were observed despite the availability of suitable habitat in the region, and it seems likely that isolated reports in the region are of released individuals (Environment Canada 2014). It is not known if targeted searches for additional sites in northern Ontario have been conducted since the isolated reports in the region began in 2007. It seems that most searches for this species in Ontario are often associated with sampling efforts at known sites (primarily within protected areas) as part of turtle research studies. See Population Sizes and Trends – Abundance and Table 1 for more information on the findings of these studies.
In Québec, searches for new subpopulations have been conducted within the Abitibi-Témiscamingue and Montérégie regions where isolated records were reported (Bernier 2014). Follow-up search effort in the Montérégie region included a total of 338 person-hours and 852 fyke net trap days between 2011 and 2013; one individual was observed (Rouleau and Giguère 2012; Rouleau and Bourgeois 2014). Search efforts led by two Anishinabe Bands and in collaboration with the provincial government in the Abitibi-Témiscamingue region, were conducted based on non-redundant historical and recent observations. Search efforts were carried out with 14,514 baited hoop net hours and 252 basking trap hours during 2013 and 2014 (Lapointe and Fournier 2014; Déry 2014, 2015); no Blanding’s Turtles were captured. Additionally, extensive basking surveys as well as 6,744 hours of ATK informed targeted surveys using baited hoop nets at various localities in the region were also conducted by the First Nation Bands. Although other turtle species were captured (Snapping and Painted turtles), no Blanding’s Turtles were captured or observed (Déry 2014, 2015). Most searches for this species in Québec are associated with sampling efforts for research studies on the main subpopulation in the Outaouais region. The area of occupancy for the Outaouais region subpopulation is extended with each new study (Fortin pers. comm. 2016). See Population Sizes and Trends – Abundance and Table 1 for more information on the findings of these studies.
Search effort in Nova Scotia is coordinated by the Nova Scotia Blanding’s Turtle Recovery Team. From 1996 to 2016, 7870 trap nights and > 850 hours of visual survey effort have gone into the search for new subpopulations. Trapping efforts included 95 waterbodies (lakes, streams or segments of rivers) on 13 watersheds (Nova Scotia Blanding’s Turtle Database 2014). Through these efforts, combined with public sighting reports, ~150 Blanding’s Turtles were captured, with three new subpopulations (see Population Sizes and Trends – Sampling Effort and Methods) and three smaller concentrations discovered outside the main study area. Despite 200 to > 700 trap nights over 2-4 years, only 3-8 adults have been found within the areas surrounding the three concentrations (NS4-NS6; Nova Scotia Blanding’s Turtle Database 2014; see Population Sizes and Trends – Sampling Effort and Methods). The three adults in the NS6 concentration all appear to be older individuals and it is not known if recruitment is occurring in this area. The presence of a juvenile (approximately age 13) in the NS5 concentration suggests at least some recruitment in this area. The newest subpopulation (NS7) was discovered in 2016; > 600 hours of visual survey effort at this site have thus far found 31 adults (Nova Scotia Blanding’s Turtle Database 2014). Despite ongoing efforts, only a very small proportion of the potential habitats in Nova Scotia have been surveyed.
Habitat
Habitat requirements
The Blanding’s Turtle is a largely aquatic turtle that occurs in a variety of habitats including swamps, bogs, fens, marshes, marshy meadows, lakes, ponds, Beaver-regulated wetland complexes, slow flowing creeks, river sloughs, human-made channels and coastal areas of lake bays (Power et al. 1994; Herman et al. 1995; Gillingwater and Brooks 2001; Gillingwater and Piraino 2004; 2007; Ernst and Lovich 2009; Edge et al. 2010; Dubois et al. 2012). In the Great Lakes/St. Lawrence population, the most preferred habitats are wetlands that are eutrophic, with shallow water (typically < 100cm, range 0-200cm), an organic substrate, a high density of aquatic vegetation and slow to no flow (Herman et al. 1995; Gillingwater and Piraino 2004; 2007; Ernst and Lovich 2009; Edge et al. 2010; Duclos and Fink 2013; St-Hilaire et al. 2013). Swamp, pond, marsh, lake, fen and bog habitats are significantly preferred over lotic or ephemeral habitats (Edge et al. 2010). In Nova Scotia, Blanding’s Turtles are often associated with acidic streams having peaty soils and tannin-rich waters as these areas maintain higher secondary productivity than clear waters in this region (Power et al. 1994; Bourque 2006).
Upland forest is a strong predictor for the presence of Blanding’s Turtle in a landscape (Quesnelle et al. 2013). Upland habitat is extensively used as a travel corridor (Edge et al. 2010) and for hatchling dispersal to overwintering sites (Paterson et al. 2012). Wet forest, vernal pools, Beaver ponds and shallow-water wetlands, are also often used by Blanding’s Turtles when travelling between residence wetlands and during nesting forays (Edge et al. 2010; Markle and Chow-Fraser 2014). Vernal pools and ephemeral wetlands are important foraging sites for Blanding’s Turtles during spring as they provide rich sources of amphibian and insect eggs and larvae (Beaudry et al. 2009). Blanding’s Turtle habitat suitability is positively correlated with air temperature and wetland area and negatively correlated with cropland area (Millar and Blouin-Demers 2012).
Adult Blanding’s Turtles make extensive inter- and intra-wetland movements (Rubin et al. 2001; Edge et al. 2010; Seburn 2010; Christensen 2013; Markle and Chow-Fraser 2014) and may travel > 2000 m between wetlands (Edge et al. 2010), using multiple bodies of water throughout the active season (mean 5; range 1-20) (Beaudry et al. 2009; Edge et al. 2010). Despite these seasonal movements, Blanding’s Turtles have strong site fidelity (McNeil 2002; Herman et al. 2003; Markle and Chow-Fraser 2014) and spend the majority of the season within a single residence wetland (Congdon et al. 2011; Christensen and Chow-Fraser 2014; Markle and Chow-Fraser 2014). Individuals only utilize a few residence wetlands over their lifetime and may spend decades in a specific locality (Congdon et al. 2011). Juvenile Blanding’s Turtles use the same water bodies as adults (McMaster and Herman 2000; Paterson et al. 2012; Gillingwater unpub. data) where they are typically found in areas of dense aquatic vegetation (McMaster and Herman 2000; McNeil 2002; Caverhill 2003; Gillingwater unpub. data). Hatchlings use a variety of terrestrial and wetland habitats upon emergence from the nest (Standing et al. 1997; McNeil et al. 2000; Camaclang 2007) and have been most commonly found on or in forest leaf litter, grass, Sphagnum sp., water or buried under the soil (Camaclang 2007). Hatchlings may extensively use open upland habitats during dispersal from nests to overwintering sites (Paterson et al. 2012).
Home range
In Canada, mean home range areas (based on minimum convex polygon (MCP) or equivalent minimum polygon method) generally fall between 10 - 60 ha (range 0.2-382 ha) and mean home range lengths generally fall between 1000 - 2500 m (range 37-7000 m; McNeil 2002; Caverhill 2003; Edge et al. 2010; Kydd 2010; Caverhill et al. 2011; Millar and Blouin-Demers 2011; Dubois et al. 2012; Fortin et al. 2012; Lefebvre et al. 2012; St-Hilaire et al. 2013; Christensen 2013; Baxter-Gilbert 2014; Christensen and Chow-Fraser 2014; Dillon Consulting 2014; Woods 2014; Markle and Chow-Fraser 2014b, unpub. data; Cameron unpub. data; Edge unpub. data; OMNRF Timmins District unpub. data; Riley et al. unpub. data; Rouse unpub. data; Scales Nature Park unpub. data).
Several studies have found that movement data which exclude long-distance nesting migrations, or which are obtained solely from non-daily radio-tracking regimes and/or over a single or partial active season, greatly underestimate the home range size and habitat requirements for this highly mobile species (Power 1989; McNeil et al. 2000; Herman et al. 2003; Caverhill et al. 2011; Congdon et al. 2011; Christensen 2013; Christensen and Chow-Fraser 2014; Markle and Chow-Fraser 2014b; Millar and Blouin-Demers 2011; Woods 2014). The use of GPS loggers, especially over more than one season, seems to be the most accurate method for estimating Blanding’s Turtle home range size (Christensen and Chow-Fraser 2014; Markle and Chow-Fraser 2014b).
Hibernation habitat
Adult and juvenile Blanding’s Turtles overwinter in permanent or temporary waterbodies, including bogs, fens, forest and shrub swamps, marshes, graminoid shallow meadow marshes, streams, shorelines of lakes and ponds, and flooded borrow pits or roadside ditches (Power 1989; McNeil 2002; Caverhill 2003; Hartwig 2004; Penny 2004; Edge et al. 2009, 2010; Newton and Herman 2009; Seburn 2010; Caverhill et al. 2011; Dubois et al. 2012; Paterson et al. 2012; Carstairs 2014; Dillon Consulting 2014; Woods 2014; Nova Scotia Blanding’s Turtle Database 2014; Markle and Chow-Fraser 2014b; Gillingwater unpub. data; Rouse unpub. data). Reported winter water depths at hibernation sites vary from 0 to >100 cm (Edge et al. 2009; Newton and Herman 2009; Thiel and Wilder 2010; St-Hilaire et al. 2013) and hibernation sites often occur within the same areas used for summer activity (Joyal et al. 2001; Seburn 2010; Dubois et al. 2012; Christensen 2013; Dillon Consulting 2014; Markle and Chow-Fraser 2014). Hatchlings choose both aquatic and terrestrial sites for hibernation and may successfully overwinter within the nest cavity (Paterson et al. 2012; Nova Scotia Blanding’s Turtle Database 2014). Blanding’s Turtles may hibernate singly (Seburn 2010; Gillingwater unpub. data; Markle unpub. data) or communally (McNeil 2002; Caverhill 2003; Herman et al. 2003; St-Hilaire 2003; Edge et al. 2009; Newton and Herman 2009; Paterson et al. 2012; St-Hilaire et al. 2013; Gillingwater unpub. data; Markle unpub. data) with up to 16 individuals observed in a single hibernaculum (Herman et al. 2003). This species often shows fidelity to hibernation areas (Herman et al. 2003; Edge et al. 2009; Newton and Herman 2009; Dubois et al. 2012).
Nesting habitat
Suitable nesting habitat occurs in sun-exposed areas with low vegetation cover and loose soils. Blanding’s Turtles are known to nest in a variety of habitats including sand beaches and dunes, soil-filled crevices in rock outcrops, Muskrat lodges, Canada Goose mounds, wetland berms, gardens, yards, agricultural fields, pastures, railway embankments, gravel pits, as well as sand or gravel roads, road shoulders and trails (Gillingwater and Brooks 2001; Gillingwater and Piraino 2004; Caverhill 2006; 2007; Congdon et al. 2008; Ernst and Lovich 2009; Beaudry et al. 2010; Caverhill et al. 2011; Markle and Chow-Fraser 2014; Woods 2014; Gillingwater unpub. data; NHIC data). Females in Nova Scotia often also utilize cobble lakeshore beaches (Standing et al. 1999). Nearly 50% of nesting sites for the Nova Scotia population (Caverhill 2006; Nova Scotia Blanding’s Turtle Database 2014) and ~90% of nesting sites for the Québec subpopulation (Dubois et al. 2012) occur in human-altered landscapes.
Females often show fidelity to nesting areas; however, nests may be laid up to 2 km from the previous nesting site (McNeil 2002; Congdon et al. 2008; Dubois et al. 2012). Females may travel up to 7500 m prior to nesting (mean ~1000-2000 m; Standing et al. 1999; St-Hilaire 2003; Congdon et al. 2008; Edge et al. 2010; Millar and Blouin-Demers 2011; Caverhill et al. 2011; Dubois et al. 2012; Christensen and Chow-Fraser 2014; Markle and Chow-Fraser 2014a, 2014b; Nova Scotia Blanding’s Turtle Database 2014). Reported mean distances between nesting sites and nearest wetland habitats were 100-242 m (range 10 to > 1000 m); however, nests may be laid up to 2580 m from the female’s residence wetland (Beaudry et al. 2010; Congdon et al. 2008; 2011; Dubois et al. 2012; Paterson et al. 2012; Équipe de rétablissement des tortues du Québec unpub. data). Females may make large overland movements of 2.5 to > 10 km during the nesting season (Power 1989; Nova Scotia Blanding’s Turtle Database 2014). In areas where nesting habitat is limited, several females may aggregate at the few sites that are available (Davy unpub. data; Gillingwater unpub. data).
Habitat trends
This section only discusses historical landscape changes and associated impacts to habitat; for a discussion of current and projected future habitat trends see ‘Threats and Limiting Factors’.
Prior to European settlement (ca. 1800), there were ~2 million ha of wetland in southern Ontario (25% of the total area) but by 2002, approximately 1.4 million ha or 72% of pre-settlement wetlands ≥ 10 ha in size were lost (Ducks Unlimited 2010) (resulting in an estimated > 60% decline for the Blanding’s Turtle, Great Lakes/St. Lawrence population; see Appendix 1). This is a very conservative estimate of wetland loss in southern Ontario given that wetlands < 10 ha were not considered in the analysis (Ducks Unlimited 2010). Most counties experienced losses of 45 - 85%; however, some experienced losses as high 89 - 98% (i.e., Essex, Kent, Lambton, Middlesex, Perth and Russell; Ducks Unlimited 2010); these are the same counties with few to no Blanding’s Turtle records. Forestry, agriculture, urban fields and the development of roads and hydro corridors have accounted for 94% of this wetland loss (Ducks Unlimited 2010). Since 1951, coastal wetlands in southern Georgian Bay have undergone losses of 16 - 68% in some regions (Severn Sound Remedial Action Plan 1993b) due to shoreline modification, road construction and residential and marina development (Severn Sound Remedial Action Plan, 1993a). From the 1980s to early 2000s, habitat losses were observed at 17 Lake Huron coastal wetlands, and > 50% of coastal wetlands along Georgian Bay and the Bruce Peninsula have been affected due to agriculture and cottage development (Environment Canada and OMNRF 2003). In southern Ontario, the average wetland loss from 1982 to 2002 was estimated at 0.17% annually; however, this estimate is extremely conservative given that only wetlands ≥ 10 ha were considered in the calculation (Ducks Unlimited 2010). Coastal wetland habitat along Lake Erie was also incrementally lost throughout the 1990s because of cottage and marina development, and is expected to continue into the future (Petrie 1998).
Habitat suitability mapping for Blanding’s Turtle in Ontario has revealed a sharp divide between northern and southern subpopulations, with southern cohorts seemingly facing a much higher extinction risk due to higher rates of habitat loss and fragmentation in this part of the range (Millar and Blouin-Demers 2012).
Little information exists on historical wetland loss in the Outaouais region of Québec; however, wetland loss along the Ontario side of the Ottawa River in that region ranged from 65-100% (Ducks Unlimited 2010). Furthermore, a review of Google Earth aerial imagery reveals that ~50% of the area that overlaps with the current known range of the Blanding’s Turtle in that region has been converted to agriculture.
Similarly, there is little information on the amount of historical wetland loss in the southwest region of Nova Scotia. Despite this, a review of Google Earth aerial imagery reveals that there has been a significant amount of logging outside protected areas throughout the province which has likely resulted in loss of Blanding’s Turtle habitat. The two principal changes in habitat in Nova Scotia since European colonization have been increased fragmentation of forests and alteration of water flow regimes (primarily for power generation; Herman et al. 2003).
Biology
Since the last status assessment, more research has been conducted on Blanding’s Turtles in Ontario and Québec, and study of the Nova Scotia population has remained ongoing. These studies have greatly increased our knowledge of Blanding’s Turtle biology in terms of breeding behaviours; annual movements; reproductive success; population demographics; hibernation behaviours and conditions; and the survivorship of adults, juveniles and hatchlings.
Life cycle and reproduction
Annual life cycle
Blanding’s Turtles emerge from hibernation sites in the early spring shortly after ice melt begins (McMaster and Herman 2000; McNeil 2002; Gillingwater unpub. data). In Canada, mating activity often occurs when turtles are congregated at hibernacula (McNeil 2002; Dubois et al. 2012) but has been observed in every season (Power 1989; Gillingwater and Brooks 2001; McNeil 2002; Newton and Herman 2009; Dubois et al. 2012). During early spring (pre-nesting period), males may move from residence wetlands into ephemeral habitats (Christensen 2013; Markle and Chow-Fraser 2014). Prior to nesting, gravid females may spend several days in terrestrial areas (Congdon et al. 2000) or up to a few days or weeks in aquatic “staging areas” within close proximity to nesting habitat (Congdon et al. 2008; Christensen and Chow-Fraser 2014; Markle and Chow-Fraser 2014). Round-trip nesting migrations may take nearly a month to complete (Markle and Chow-Fraser 2014b). The nesting period begins as early as late May and continues through to early July, peaking in early to mid-June (Standing et al. 1999; Gillingwater and Brooks 2001; Millar and Blouin-Demers 2011; Christensen 2013; Nova Scotia Blanding’s Turtle Database 2014; Équipe de rétablissement des tortues du Québec unpub. data; Gillingwater unpub. data). Hatchlings emerge from early August to late October (incubation days = 56 - 133; Standing et al. 1999; Herman et al. 2003; Gillingwater and Piraino 2004; Caverhill et al. 2011; Riley et al. 2011, 2012; Nova Scotia Blanding’s Turtle Database 2014; Gillingwater unpub. data). Some individuals may become dormant for a few days or weeks during the summer period, remaining inactive either within wetlands or buried terrestrially beneath forest litter or dead cattails (Dubois et al. 2012; Woods 2014). In Canada, adults typically move to hibernation sites between late August to early November (Hartwig 2004; Edge et al. 2009; Newton and Herman 2009; Seburn 2010; Caverhill et al. 2011; Markle and Chow-Fraser 2014). Hatchlings in southcentral Ontario enter hibernacula between mid-September to mid-October (Paterson et al. 2011, 2012).
Reproductive ecology
Blanding’s Turtles are polygamous and individuals may mate more than once with one or multiple partners within and among years (Dubois et al. 2012; McGuire et al. 2013, 2015; Anthonysamy et al. 2014). Females have the ability to store sperm and clutches may have multiple sires (Patterson 2007; McGuire et al. 2013, 2015; Anthonysamy et al. 2014). Mating attempts are often unsuccessful and reproductive success among males within a subpopulation may be strongly skewed (Anthonysamy et al. 2014). Over an eight year study, the mean number of offspring sired per male was 11 (SD=9, range=1-40, N=32; McGuire et al. 2015). Clutch size, egg size, multiple paternity and female reproductive frequency are positively correlated to age (Congdon et al. 1983, 2001, 2008; McGuire et al. 2015) and older females have a higher probability of mating with non-resident males; making older females particularly important for maintaining genetic connectivity between wetlands (McGuire et al. 2013). The Blanding’s Turtle’s ability to make extensive movements facilitates gene flow among wetlands and may substantially increase reproductive success; small subpopulations are able to maintain genetic diversity through long-distance sojourns and nesting forays that bring increased mating opportunities with non-residence individuals and allow hatchlings to disperse to wetlands other than their parents’ residences (McGuire et al. 2013). Therefore, population persistence is dependent on habitat connectivity which facilitates these long-distance movements between wetlands (McGuire et al. 2013, 2015).
Blanding’s Turtle has a highly iteroparous reproductive strategy, having multiple reproductive cycles over the course of a lifetime. At maturity, one clutch of eggs is produced at a frequency of once every 1 - 3 years (Congdon et al. 1983). Across the range, reported mean clutch size falls between 6 - 13 eggs (range 1 - 25 eggs; Standing et al. 1999; Gillingwater and Brooks 2001; McNeil 2002; Caverhill 2006; Congdon et al. 2008; Caverhill et al. 2011; Riley et al. 2012; Nova Scotia Blanding’s Turtle Database 2014). In Nova Scotia, clutch size differs among the subpopulations (Herman et al. 2004). Predation on Blanding’s Turtle eggs is often extremely high (see Threats and Limiting Factors – Subsidized Predators). Nest monitoring studies in Ontario and Nova Scotia reported a 59% to 68% mean hatch success of eggs protected with caging to prevent mammalian predation (Gillingwater and Brooks 2001; Nova Scotia Blanding’s Turtle Database 2014). Although sarcophagid fly larvae often predate live hatchlings before they can successfully emerge from the nest, the larvae largely consume rotting eggs (Gillingwater and Brooks 2001) and have no significant impact on hatching success (Bolton et al. 2008).
Hybridization
Intergeneric hybridization has been observed in rare cases, both in the wild and in captivity, between Blanding’s Turtle and Wood Turtle (Glyptemys insculpta) where their ranges overlap within Ontario and the U.S.A. (Harding and Davis 1999; Knudson pers. comm. 2004). Viable hybrid offspring are produced (Harding and Davis 1999).
Longevity and development
Blanding’s Turtles can live in excess of 83 years (University of Michigan News May 25, 2016) and are one of the latest maturing species of freshwater turtles. Annual rates of growth are greatest in the first year and decrease steadily until sexual maturity; once maturity is attained, the rate of growth declines drastically (Congdon et al. 2008). Sexual maturity has been estimated to occur between 14-26 years of age, with individuals at more northerly latitudes reaching maturity later (Congdon and van Loben Sels 1991, 1993; Congdon et al. 2001; McNeil 2002; Herman et al. 2003; Nova Scotia Blanding’s Turtle Database 2014; McGuire et al. 2015). The minimum Straight Carapace Length (SCL) recorded for nesting females was 15.8 cm in southwestern Ontario (MacCulloch and Weller 1987; Gillingwater unpub. data) and 18 cm in Nova Scotia (Nova Scotia Blanding’s Turtle Database 2014).
The mean generation time for Canadian Blanding’s Turtles is estimated to be 40 years (range 37-42 years), based on an age of maturity at 20-25 years (Congdon et al. 2001; Herman et al. 2003), a mean annual adult survivorship of 0.94 (calculated from mean estimates reported from Congdon et al. 2008, 0.94; Dillon Consulting 2014, 0.89; Green and McNeil 2014, 0.98) and using the equation [Generation time = Age of first reproduction + 1/adult mortality] (IUCN 2014).
Population structure and demographics
Some Canadian studies have reported female biased sex ratios while others have reported male biased sex ratios or ratios of 1:1 (Table 1). The reported adult to juvenile ratios for Canadian subpopulations range from approximately 1.5 to 30 adults for every juvenile; studies that sampled using traps versus those that sampled using hand captures have both reported high ratios of adults to juveniles (Table 1).
Feeding and diet
Blanding’s Turtles are omnivorous. Their diet includes aquatic and terrestrial invertebrates, aquatic vegetation, crayfish, bivalves, fish and fish eggs, carrion, frogs, toads and tadpoles (Ernst and Lovich 2009; Gillingwater unpub. data; Herman unpub. data). Feeding typically takes place under water (Harding 1997).
Mortality
Reported sources of natural mortality for adult Blanding’s Turtles include predation by mammals, disease, and overwintering deaths resulting from harsh environmental conditions (Gillingwater and Brooks 2001; Parks Canada 2012; Nova Scotia Blanding’s Turtle Database 2014; Woods 2014; Davy unpub. data; Gillingwater unpub. data). One southwestern Ontario study reported 2-12 dead individuals per spring resulting from natural mortality factors (or 0.25 to 1.5% of the estimated subpopulation size; Gillingwater unpub. data); this would be a significant underestimate of annual adult mortality given that surveys were only conducted in April and May and that several areas of the wetland were not accessible for researchers to survey. It is suspected that other subpopulations throughout the range experience similar mortality rates due to natural factors. See Threats and Limiting Factors for more information on anthropogenic sources of mortality.
Instances of mass mortality for this species have been reported from Ontario. In the early 1990s, dozens of Blanding’s Turtles were observed washed up on shore at a protected southwestern Ontario site in early spring and were suspected winter kills (McCracken pers. comm. 2014). More recently, 52 dead Blanding’s Turtles (9 juveniles and 43 adults) were found between May to June of 2013 within a protected area in southcentral Ontario (Sheppard 2014a). This mass mortality event appears to have removed almost half of the breeding population (Litzgus pers. comm. 2016) and is believed to have been caused by increased predator access into the wetland because of unseasonal drought conditions (Sheppard 2014a). In small subpopulations, such unexpected stochastic events could have a devastating effect.
Annual survivorship estimates for adults range from 0.89 - 0.98 (Congdon et al. 1993; Herman et al. 2004; Enneson 2009; Dillon Consulting 2014; Green and McNeil 2014). Most recent average annual survivorship estimates for juveniles in one subpopulation in Nova Scotia were calculated as follows: 0.90 for large individuals (10-18.5 cm CL), 0.73 for small individuals (5 - 9.99 cm CL) and 0.09 for hatchlings (Green and McNeil 2014). The observed morality rate for 2 to 3 year old headstarted (N=22) and wild-caught (N=5) juveniles averaged 30% for individuals tracked over three years (range 0 - 80% annually; Carstairs 2014). No differences in mortality rates have been observed between headstarted and wild-caught individuals (Arsenault 2011; Carstairs 2014). Of 48 radio-tracked hatchlings from southcentral Ontario, a minimum of 42% survived until winter; of the remainder, 16% were found depredated, 2% were found desiccated, 2% were found dead on road and 38% had an unknown fate because of signal loss (Paterson et al. 2012). Hatchlings that were more likely to survive were smaller in size, emerged from nests later (thereby having a reduced exposure period to predators) and spent less time in open uplands (Paterson et al. 2014).
Physiology and adaptability
Thermoregulation and thermal tolerance
Blanding’s Turtle has one of the lowest critical thermal maxima, compared to other North American Emydid turtles, at an upper maximum of 39.5°C (Hutchinson et al. 1966). The mean preferred temperature is 22.5°C for males and 24.8°C for females (Nutting and Graham 1993). The fitness of ectotherms is tightly linked to thermoregulation, as all physiological processes are temperature dependent (Millar et al. 2012); basking increases energy gain and optimizes metabolism, digestion, growth and egg development (Avery et al. 1993; Sarkar et al. 1996; Koper and Brooks 2000; Steyermark and Spotila 2001; Carrière et al. 2008; Dubois et al. 2009; Millar and Blouin-Demers 2011; Millar et al. 2012). Basking may be particularly important at northern latitudes where the active season is short and reproductive output is constrained by cooler temperatures (Rollinson and Brooks 2007). A study in southeastern Ontario found that environmental temperatures were rarely within the optimal body temperature range for this species, so turtles had to actively thermoregulate during the early and late portions of the active season (Millar et al. 2012). Alternatively, the Blanding’s Turtle may aestivate during the summer when temperatures are too high (see Biology – Annual Life Cycle). The thermal tolerance range for egg incubation is 22-32°C; this high thermal requirement results in high nest failure rates in the northern portion of the species’ range (Ewert and Nelson 1991).
Temperature-dependent sex determination
This species displays temperature-dependent sex determination (TSD); males are produced when the eggs are incubated at or below 28°C and females are produced at temperatures above 30°C (Ewert and Nelson 1991).
Hibernation
A study of hibernation conditions for Blanding’s Turtles in southcentral Ontario found that individuals selected sites that were thermally stable, with water temperatures close to 0°C, and that body temperatures were 1 - 3°C colder than water temperatures at haphazard stations (Edge et al. 2009). Across both years of study, ice cover prevented access to atmospheric oxygen for > 101 to > 136 days and individuals chose to hibernate in wetlands with ubiquitously low levels of dissolved oxygen (Edge et al. 2009), supporting the hypothesis that this species is anoxia-tolerant (Ultsch 2006). In Nova Scotia, median winter water temperatures of selected overwintering sites ranged from 0.8°C to 8.6°C; although most sites formed ice cover each winter, one warm site remained ice-free (Newton and Herman 2009; Nova Scotia Blanding’s Turtle Database 2014). Reported levels of dissolved oxygen at hibernacula fall between 0.8 - 11.3mg/L (Edge et al. 2009; Newton and Herman 2009; St-Hilaire et al. 2013).
Dispersal and migration
The recognized separation distances (i.e., distances over which individuals would not normally travel and which are based on typical movements or home ranges for the species) between Blanding’s Turtle subpopulations are:
- 10 km in areas of continuous undeveloped aquatic or aquatic/terrestrial habitats;
- 5 km in areas of continuous undeveloped upland terrestrial habitats; and
- 2 km in areas with a mosaic of upland terrestrial habitat and development (NatureServe 2014).
According to IUCN (2014) "a taxon can be considered severely fragmented if most (>50%) of its total area of occupancy is in habitat patches that are
- smaller than would be required to support a viable population and
- separated from other habitat patches by a large distance".
Given this definition and the estimated dispersal distances of this species, neither the Great Lakes/St. Lawrence population nor the Nova Scotia population appears to meet the criteria for severe fragmentation given that the majority of the area of occupancy in both populations occurs within large areas of contiguous habitat. It is likely that subpopulations in southwestern Ontario would meet the criteria for severe fragmentation if they were considered in isolation from the rest of the Great Lakes/St. Lawrence population, given the lack of habitat remaining in that portion of the province.
Interspecific interactions
Known mammalian predators of turtles and turtle nests across Canada include American Mink (Neovison vison), Black Bear (Ursus americanus), Coyote (Canis latrans), Raccoon (Procyon lotor), Red Fox (Vulpes vulpes), River Otter (Lontra canadensis), Striped Skunk (Mephitis mephitis), Virginia Opossum (Didelphis virginiana) and Short-tailed Shrew (Blarina brevicauda) (Brooks et al. 1991b; Standing and Herman 2000; Browne and Hecnar 2007; Ernst and Lovich 2009; Davy unpub. data; Gillingwater unpub. data). Other potential small mammal predators of Blanding’s Turtle nests in Canada include chipmunks, voles and moles (Congdon et al. 2000). Raccoons and foxes, in particular, are the primary predators of nests (Congdon et al. 2008). Because of their small size, hatchling and small juvenile turtles are also susceptible to predation by American Kestrel (Falco sparverius), crows, Eastern Chipmunk (Tamias striatus), Northern Short-tailed Shrew, Red Squirrel (Tamaisciurus hudsonicus), fish, frogs, snakes and wading birds (Camaclang 2007; Ernst and Lovich 2009; Paterson et al. 2012, 2014; Green pers. comm. 2014).
Throughout the Canadian range, Blanding’s Turtles are often associated with Beaver-influenced wetlands (Herman et al. 2003; Millar 2009; Dubois et al. 2012; Bernier 2013; Duclos and Fink 2013; Markle and Chow-Fraser 2014; OMNRF Timmins District unpub. data). The Blanding’s Turtle is also positively associated with Muskrat (Kiviat 1978b; Gillingwater 2013). Muskrat lodges and mounds provide turtle hibernation, nesting and basking habitat while the cleared aquatic channels created by Muskrats provide movement corridors for turtles (Kiviat 1978b; Gillingwater 2013). Beaver lodges and channels likely also provide nesting, basking and movement opportunities. Therefore, the removal of these mammals from wetlands is likely to have a negative impact on Blanding’s Turtles, through eliminating the important habitat features that these aquatic mammals create for turtles (Kiviat 1978b; Gillingwater 2013). Furthermore, the removal of Beaver dams also poses a threat to Blanding’s Turtles (see Threats and Limiting Factors – Natural System Modifications). See Biology – Reproductive Ecology’ for discussion of nest parasitism by fly larvae. See Biology – Feeding and Diet for a list of Blanding’s Turtle prey species.
Population sizes and trends
Sampling effort and methods
Although the known Blanding’s Turtle subpopulations in Québec and Nova Scotia have been thoroughly sampled, relatively few mark-recapture studies have been conducted for known Blanding’s Turtle subpopulations in Ontario.
In southwestern Ontario, 2 - 21 years of sampling efforts have been conducted for five subpopulations and are ongoing for two. In southeastern Ontario, 2 - 5 years of sampling efforts have been conducted for five subpopulations. In southcentral Ontario, 2 - 5 years of sampling efforts have been conducted for three subpopulations. In the Outaouais region of Québec, where the main subpopulation in the province occurs, nine years of sampling efforts have been conducted since 1996 and are ongoing. In Nova Scotia, 1 - 46 years of sampling efforts have been conducted for seven subpopulations/concentrations and are ongoing. See Table 1 for a summary of sampling effort and methods for various subpopulations across the Canadian range.
Abundance
It is difficult to estimate the abundance of Blanding’s Turtles in the Great Lakes/St. Lawrence population, as there has been very little research on abundance or subpopulation trends throughout Ontario, where the majority of the population occurs. Although two southwestern Ontario subpopulations are estimated to maintain ~700 - 800 adults each (based on sampling efforts of > 650 person-days at each site), large sampling efforts for six other subpopulations across the Great Lakes/St. Lawrence region yielded low subpopulation estimates of 41 - 138 adults (based on > 2200 trap days and/or 1000-5300 person-hours at each site) (Table 1). Even subpopulations that occur in protected areas with suitable habitat and large abundances of other sympatric turtle species seem to maintain small numbers of Blanding’s Turtles. For example, five seasons of sampling efforts at a protected southeastern Ontario site (~68 person days and ~54 trap days of effort) provided a Blanding’s Turtle subpopulation estimate of 85 (the recapture rate was 75%); however, Eastern Musk Turtle (Sternotherus odoratus), Midland Painted Turtle (Chrysemys picta marginata) and Snapping Turtle estimates were much higher (1403, 1343 and 684, respectively) despite the same survey efforts for these species (Middleton 2014). North of Sudbury, the species appears to only occur very rarely; indeed, only five records are known for all of northern Ontario and only one individual was observed across a three-year radio-tracking study in Timmins district (OMNRF Timmins District unpub. data). Based on evidence from all sampling efforts across the Great Lakes/St. Lawrence range, it appears that most subpopulations are small (< 150 adults) and occur at low densities, especially at more northerly latitudes (see Appendix 1 and Table 1). If the number of Blanding’s Turtle atlas squares from the ORAA are used as a proxy for subpopulations (which seems reasonable given that each atlas square represents a 10 km2 x 10 km2 area and that the largest recognized separation distance between Blanding’s Turtle subpopulations is 10 km; see ‘Dispersal and Migration’) then a rough estimate of total population size could be achieved by multiplying the number of ORAA squares within each ecoregion by the average subpopulation size in each ecoregion (SC=49, SW=72 and SE=99). If the two southwestern Ontario subpopulations with atypically large sizes are considered in the total population size but excluded as outliers from the average subpopulation size estimate for the Lake Erie/Lake Ontario ecoregion, and depending on whether historic ORAA squares are excluded or included in the calculation (396 to 643 squares), a very crude estimate for the Great Lakes/St. Lawrence population (including the ~200 currently known adults from Québec) is approximately 25,000-45,000 adults.
The total number of mature individuals in Nova Scotia is not known but is believed to be < 500 based on currently known subpopulations, each of which is unlikely to exceed 200 adults. The current estimate for the NS1 subpopulation is 131 (95% CI: 129 - 134) and is based on mark-recapture data from 1987-2013, excluding 1990-1991 (Green and McNeil 2014). The NS2 subpopulation is estimated to contain 79 adults (95% CI: 60-116), based on mark-recapture data from 1997 to 2002 (McNeil 2002). An estimate for the NS3 subpopulation as a whole has not yet been calculated; however, an estimate of 88 individuals (95% CI: 79-102) was calculated for the BA-KB concentration within the subpopulation (Lefebvre et al. 2012). This estimate includes individuals of all age classes (Lefebvre 2009). In Lefebvre’s analysis, 58% of the individuals encountered were mature adults (40 of 69 turtles); assuming this ratio remains constant, this would result in an adjusted estimate of 51 adults (46-60) in the concentration. The concentration represents approximately 43% of the total marked turtles in the entire subpopulation. Extrapolation of the estimate for the concentration across the entire NS3 subpopulation would yield an estimate of approximately 118 (106-139) mature individuals, though differences in habitat and survey effort are not taken into account using this method. Initial analysis from two studies using limited sample sizes (n= 23 & 21 nests) and a small number of microsatellite loci (n= 5 & 3) have indicated that the Nova Scotia population may have a low number of males that are successfully reproducing and lower incidence of multiple-sired clutches than reported elsewhere (Beckett 2006; Patterson 2007). If this is true, it would mean that the effective population (Ne) size may be considerably lower than the actual population size (Parks Canada 2012). The NS7 subpopulation was discovered in April 2016; 31 adult turtles were found in the first two months of sampling, suggesting this could be a sizable subpopulation. See Table 1 for a summary of sampling effort and adult population estimates for various subpopulations across the Canadian range.
Fluctuations and trends
The estimated decline in the total number of mature individuals for the Great Lakes/St. Lawrence population over the last three generations is > 60% due to large-scale wetland loss after European arrival (see Appendix 1). It is inferred that most pre-settlement Blanding’s Turtles lived in the Lake Erie/Lake Ontario ecoregion (based on higher densities of individuals reported from monitored subpopulations there; Appendix 1); as most of the wetlands in southern Ontario were lost, an increasing proportion of the remaining Blanding’s Turtles were found in more northerly, less productive ecoregions (Appendix 1). Because wetland loss has been most severe in southern Ontario, where subpopulation densities were inferred to be higher, the decline in overall abundance has likely been steeper than the rate of wetland conversion (Appendix 1). Given that the Québec subpopulation occurs in a predominantly agricultural landscape, it is inferred that the subpopulation there also experienced historical decline after European settlement (see Habitat Trends).
High levels of continuing decline for the Great Lakes/St. Lawrence population are inferred and projected based on observed trends from monitored Ontario subpopulations (no current trends have yet been identified for subpopulations in Québec; Bernier 2014). For instance, large declines in Blanding’s Turtle numbers have been observed at six protected areas in Ontario (based on extensive survey efforts and/or anecdotal evidence from expert naturalists), with up to 50-95% declines reported at some sites over the last 10 - 30 years (< 1 generation; Table 2, specifically sites SW Ontario2, SW Ontario4; SW Ontario6, SW Ontario7, SC Ontario3, SE Ontario6). Large declines are also inferred and projected for subpopulations across Ontario based on observed high levels of annual road mortality (6-23% of estimated subpopulation sizes), or worse, a lack of road kill observations in recent years at sites that were once road mortality hotspots for this species into the early 2000s (Table 2, specifically sites SW Ontario2, SW Ontario3, SE Ontario1, SC Ontario4, SC Ontario5, SC Ontario6). Road mortality models based on the lowest road kill rate Footnote1 (estimated from four monitored subpopulations along major roadways in Ontario) and the highest estimated total population size of 45,000 adults, project that the Blanding’s Turtle, Great Lakes/St. Lawrence population will decline by 40% in the next 80 years (i.e., 2 generations) and by 50% in the next 117 years (i.e., < 3 generations; Appendix 3). Therefore, based on these conservative models (i.e., 40-50% declines over 2-3 generations respectively, due to road mortality alone) and the observed/inferred trends and high levels of annual adult road mortality reported from monitored sites (i.e., 50-95% declines in < 1 generation and high annual adult road mortality rates of 6-23% of estimated subpopulation sizes), the projected decline of the Great Lakes/St. Lawrence population is > 40% over the next 2 generations and > 50% over the next 3 generations (Table 2 and Appendix 3).
The lowest road kill rate was chosen to compensate for the fact that road kill rates are likely lower on smaller roads. This provides a conservative estimate of Blanding's Turtle annual road mortality and projected decline.
| Location | Subpopulation trend | Main observed, inferred and projected threats Road / Rail mortality |
Main observed, inferred and projected threats Poaching |
Main observed, inferred and projected threats Invasive species |
Main observed, inferred and projected threats Subsidized predators |
Main observed, inferred and projected threats Development |
Main observed, inferred and projected threats Wetland drainage and/or alterations |
Main observed, inferred and projected threats Aggregate activities |
Main observed, inferred and projected threats Forestry activities |
Main observed, inferred and projected threats Agricultural activities |
Main observed, inferred and projected threats Recreational activities |
|---|---|---|---|---|---|---|---|---|---|---|---|
| SW Ontario 1 | Inferred decline resulting from large-scale habitat degradation from invasive European Reed, heavy nest predation from subsidized predators, easy access for poachers and observed boating injuries (Gillingwater and Brooks 2001; Ontario Parks unpub. data; Davy unpub. data). | I | I | O | O | - | - | - | - | I | O |
| SW Ontario 2 | Observed and projected decline. 1) ~85% decline in CPUE -- In the late 1980s, three 1-day visual surveys, with binoculars from the edge of the wetland, found 102 to 130 Blanding’s Turtles per survey (~6 person-hours/survey; NHIC data; McCracken pers. comm. 2014). In comparison, intensive spring surveys at this site from 2003 to 2006 (~70-120 person-days/per spring spent wading through the wetlands on foot) only found a maximum of 31 individuals/survey (~15 person-hours per survey; Gillingwater unpub. data). Between 2003 and 2013, the average number of spring captures/day fell from 14 to 2 despite similar amounts of person effort between the years (Gillingwater 2013, unpub. data). 2) ~95% decline in # of nesting females -- In 1982, 257 adult female Blanding’s Turtles were captured on the main nesting beach over 22 days between June 7-29 (Ashenden 1983) while only 14 females were located during a 20 day nesting survey along the same nesting beach between late May to early July 2012 (one was road-killed; Gillingwater 2013). 3) Between 2003-2014, 64 dead adults were found (Gillingwater unpub. data). This represents ~8% of the estimated adult population size. This is a gross underestimate of actual adult loss during that time, since surveys were only conducted during spring rather than across an entire active season. 4) Models predict: (i) a 7% annual loss of adult females due to all causes; (ii) a loss of 123 adult females in 50 years; and (iii) the extirpation of all adult females (~46% of the estimated subpopulation size) in <150 years (i.e., <4 generations; Enneson 2009). | O | O | O | O | - | O | - | - | O | O |
| SW Ontario 3 | Inferred decline. 8 DOR adults were incidentally observed by a passerby on April 16, 2008. This represents a ~6% loss of the estimated adult subpopulation size over the first couple weeks of one active season (Caverhill et al. 2011; Toronto Zoo unpub. data). | O | I | O | I | - | I | - | - | O | - |
| SW Ontario 4 | Observed decline. Blanding’s Turtle was once considered abundant at this site in the early 1900s (Patch 1919) but now only persists in small numbers. CPUE fell from 0.054 to 0.010 and a significant shift to a larger and presumably older age structure was observed over 30 years between the early 1970s to early 2000s (Rivard and Smith 1973a,b; Browne and Hecnar 2007). | I | I | O | O | - | - | - | - | I | I |
| SW Ontario 5 | Subpopulation is considered functionally extinct. Only 5 adults found in over 1855 person-hours of survey effort. Headstarting efforts and wetland rehabilitation activities have begun (Toronto Zoo unpub. data) | I | I | O | O | - | - | - | - | - | I |
| SW Ontario 6 | Observed decline. Incidental observations since the mid-1990s have declined >50% of the long-term average recorded over the previous 30 years (Mackenzie et al. 2014). A mass mortality event occurred in the early 1990s where dozens of individuals were observed washed up on shore (McCracken pers. comm. 2014). Between 1999-2006, invasive Phragmites rapidly spread through this site at ~34-48% annually (Badzinski et al. 2008). | - | I | O | O | - | O | - | - | - | O |
| SW Ontario 7 | Observed decline. BLTU was once commonly observed in the Park as recently as the late 1990s; however, only 1 was found during 5 years of targeted turtle surveys (~2000 person-hours) during the early 2000s (Davy unpub. data; Mackenzie pers. comm. 2014). | I | I | O | O | - | O | - | - | I | I |
| SW Ontario 8 | Inferred decline. Only found in 4 of 11 historical sites during targeted surveys in the Niagara region conducted from 2006 to 2008 (Yagi et al. 2009). | I | I | O | O | - | I | - | - | I | I |
| SW Ontario 9 | Inferred decline. Since 1994, there have been very few reported sightings of the Blanding’s Turtle in the counties of Elgin, Middlesex and Oxford (NHIC data). In the early 2000s, surveys at some of the best remnant wetlands in Middlesex, Oxford and Perth (~140 person-hours across 10 sites) only found 2 individuals at 2 different sites in Middlesex; both sites were fragmented and surrounded by agriculture (Gillingwater and Piraino 2002). | O | I | O | O | O | I | - | - | O | I |
| SE Ontario 1 | Inferred decline due to large numbers of road kills in the region annually. Large search efforts at this protected site have found very few adults. Eggs from road-killed females are incubated and the young are headstarted and released at the site (Carstairs 2014, unpub. data). 103 DOR individuals observed over 100 km of highways in the region between 2011-2014. This is a very conservative estimate given that road mortality survey effort was only 1-29 days annually (Davy unpub. data; Seburn et al. 2014). | O | I | P† | - | - | - | - | - | I | - |
| SE Ontario 2 | Inferred decline due to surrounding roads, railway, agricultural and urban development. Average annual adult survivorship estimated at 0.89 (Dillon Consulting Ltd. 2014). | O | I | P† | O | O | I | - | - | O | - |
| SE Ontario 3 | No trends identified (Millar and Blouin-Demers 2012). | - | I | P† | I | - | - | - | - | - | I |
| SE Ontario 4 | No trends identified (Middleton 2014). | O | I | P† | I | O | - | - | - | - | O |
| SE Ontario 5 | Inferred decline. According to several expert naturalists familiar with the Park, BLTU densities were much higher ~10 years ago (i.e., mid-2000s; Boyle pers. comm. 2014). | O | I | P† | I | - | - | - | - | - | I |
| SC Ontario 1 | No trends identified. Very few Blanding’s Turtles occur in the Park so it is difficult to assess trends (Brooks pers. comm. 2014). | O | - | P† | - | - | - | - | O | - | I |
| SC Ontario 2 | No trends identified (Markle and Chow-Fraser 2014). | - | I | P† | I | O | - | - | - | - | I |
| SC Ontario 3 | Inferred decline due to mass mortality event with > 50 adults lost in 2013 (Sheppard unpub. data 2014); this is believed to represent nearly 50% of the breeding population (Litzgus pers. comm. 2016). | I | I | P† | - | P | - | - | - | I | I |
| SC Ontario 4 | Inferred decline due to large numbers of road kills in the region annually. Between 2013-2014, 15% of Blanding’s Turtle records (N=123) during surveys in the region were of individuals found dead on roads and railways (N=19; including two juveniles; Scales Nature Park unpub. data). | O | I | P† | I | - | - | - | - | I | I |
| SC Ontario 5 | Inferred decline due to high road mortality. Between 2012-2014, 112 DOR adults and juveniles were recorded for one subpopulation along a highway with at least 23 DOR adults in 2014 alone (Morin et al. unpub. data; Riley et al. unpub. data). If this subpopulation hypothetically maintained 100-300 adults (larger than the avg subpopulation size), then 8-23% of adults were lost over 1 year. | O | I | P† | - | O | - | O | O | - | - |
| SC Ontario 6 | Inferred decline. There used to be 3 major road mortality hotspots for BLTU in the Pembroke district up until ~5 years ago. Since 2012, no nesting females have been observed and as of 2014, no road kills have been reported at these hotspots, suggesting that these subpopulations may now be functionally extirpated (Kruschenske pers. comm. 2014; NHIC data). | O | I | P† | - | O | - | I | O | - | - |
| Québec: Outaouais region | Inferred decline due to historical habitat loss for agriculture and projected decline due to continuing threats, especially continued habitat loss from increased dismantling of Beaver dams in the region (NCC 2007; Dubois 2009; Fortin and Dubois 2010; Dubois et al. 2011, 2012, unpub. data; Bernier 2013, unpub. data; St.-Hilaire et al. 2013). | O | I | P† | I | - | O | O | - | O | O |
| Nova Scotia 1 | Inferred and projected decline. Historic museum collection may have reduced the adult female abundance by 10-20%. Without management intervention, this subpopulation faces a 42% risk of extinction over 400 years and an average 68% risk of decline over 100 years (Green and McNeil 2014). | O | I | P‡ | O | - | - | - | - | - | O |
| Nova Scotia 2 | Projected decline. This subpopulation faces a 44% risk of decline over 100 years (Bourque et al. 2006). | I | I | P‡ | O | I | - | O | O | - | O |
| Nova Scotia 3 | This subpopulation has a relatively high proportion of juvenile and young adults, a positive sign for recruitment (Caverhill 2006; Lefebvre 2012). | O | I | P‡ | O | I | - | O | O | O | O |
| Nova Scotia 4 | No trends identified. May be an extension of the ML subpopulation. | O | I | P‡ | I | I | - | O | O | - | - |
| Nova Scotia 5 | No trends identified but only 3 adults found. | - | - | P‡ | - | - | - | - | - | - | - |
| Nova Scotia 6 | No trends identified but only 3 adults found. | - | I | P‡ | - | - | - | - | - | - | - |
| Nova Scotia 7 | No trends identified. Subpopulation only discovered in April 2016; 31 adults found as of August 1st, 2016. | I | - | - | - | - | - | - | O | - | O |
It is difficult to discuss historical trends for the Nova Scotia population over the last three generations given that the species was only discovered in the province in the 1950s; however, adult female abundance in the NS1 subpopulation may have been reduced by 10-20% from the 1950s to 1980s due to collection for museum specimens (> 10) and road mortality (at least 3). Though this mortality occurred 30 - 60 years ago, this represents slightly more than one generation, likely insufficient time for population recovery, especially because annual adult recruitment and natural mortality in turtle populations are often nearly balanced (e.g., Shoemaker et al. 2013). The most recent Population Viability Analysis (PVA) model projects that, without any management intervention, the NS1 subpopulation faces a 42% risk of extinction over 400 years (i.e., 10 generations) and an average decline of 68% over 100 years. Extinction rates were not calculated for the 100-year time frame as they were considered meaningless in a population where individuals are capable of living nearly that long. While this and previous model results appear sobering, it is not known if the predicted trends reflect knowledge gaps in survivorship and abundance parameters, violations of the model’s key assumptions or true population trends (Green and McNeil 2014). The NS Blanding’s Turtle Recovery Team recommends caution in the use and interpretation of these models particularly given the apparent high adult survivorship in this population (Herman pers. comm. 2015). Recovery efforts for the NS1 subpopulation have included an annual nest protection program which has resulted in the release of over 1800 hatchlings since 1992 (Standing et al. 2000; Parks Canada 2012) and a headstarting program which has resulted in the release of 212 captive-reared 1- to 2-year-old juveniles since 2002 (Penny 2004; Arsenault 2011; Nova Scotia Blanding’s Turtle Database 2014). These large-scale recovery efforts have the potential to affect future population trends for the NS1 subpopulation. An initial unpublished PVA model developed for the NS2 subpopulation in Nova Scotia indicated a 44% risk of decline over 100 years (Bourque et al. 2006). Genetic analysis using Bayesian statistics suggest that the magnitude and direction of gene flow among Nova Scotia subpopulations may have shifted (1 - 3 generations) from trends seen over the long term. The NS2 subpopulation appears to have shifted from being a net exporter to being a net importer of genes (Howes et al. 2009). The reason for this is unclear. Population trends may have been influenced by the installation of a power dam in 1943 (McNeil 2002). There are few data on population trends in the NS3 subpopulation in Nova Scotia; however, it has a relatively high proportion of juvenile and young adult turtles, a positive sign for recruitment (Caverhill 2006; Lefebvre et al. 2012). Little is known about the three small concentrations (NS4-NS6), though current data suggest they may not be viable since they are composed of very few individuals (< 10 adults at each site). The NS7 subpopulation was only discovered in 2016, so trends are not yet known.
Rescue effect
Rescue effect for the Great Lakes/St. Lawrence population from U.S.A. subpopulations is highly unlikely. Although there are some narrower sections of the Detroit, St. Clair, St. Mary’s and St. Lawrence Rivers where Ontario borders Michigan and New York, there is no evidence that turtles are crossing over in these regions and it is doubtful that this species, which is not known to be a strong swimmer, could successfully cross deep open waters of large waterways with heavy boat traffic; or at least not in numbers large enough to provide rescue. Rescue from outside Canada is not possible for the Nova Scotia population given that the province is geographically isolated by the surrounding Atlantic Ocean.
Threats and limiting factors
The main threats to the Blanding’s Turtle include: road/rail mortality and associated road effects; habitat loss from invasive European Reed; increased mortality of individuals and nests from subsidized predators; illegal collection for the pet, food and traditional medicine trades; and habitat loss from various types of development and wetland modifications. Additional potential threats include mortality of individuals from agricultural and recreational activities; forestry and energy production; climate change; wetland pollution and the introduction of other invasive plant and animal species, especially predatory fish. See Appendix 2a – Threats Calculator for details regarding the predicted scope and severity of each threat for each population. The most serious threats to Blanding’s Turtle subpopulations are those which decrease the number of adults or significantly limit movement opportunities between residence wetlands. Therefore, population stability and persistence are critically dependent on high adult survivorship and habitat connectivity.
As with other turtles in Canada, one of the main limiting factors for this species is its slow life-history (extreme longevity, late age of maturity, low juvenile recruitment and a dependency on high annual adult survival). This life history strategy makes turtles highly vulnerable to extinction due to even small increases (<5%) in annual mortality of adults (Congdon et al. 1993). The needed recovery time for turtle subpopulations to rebound from periods of increased adult mortality is expected to be lengthy (Congdon et al. 1994) due to late maturity and low recruitment; this has been corroborated by some studies that reported no evidence of recovery even 16-35 years later (Brooks et al. 1991b; Pitt and Nickerson 2012; Howey and Dinkelacker 2013; Keevil et al. 2015 in prep.). However, this vulnerability to increased adult mortality would be exacerbated for Blanding’s Turtle given its excessively late age of maturity and low reproductive frequency, thus making it much more susceptible to chronic increases in mortality compared to other Canadian turtles.
The other main limiting factor for Canadian turtles is the short, cool summer at the northern periphery of the range which reduces reproductive potential and nest success (Brooks et al. 1991a). Turtle embryo development rates are strongly correlated with ambient temperatures; if temperatures are too low, the embryos will not complete development (Obbard and Brooks 1981b). Furthermore, hatchlings exposed to low temperatures during the incubation period exhibit poor growth and viability (Brooks et al. 1991a). Egg and hatchling survival are poorest for subpopulations at the more northerly latitudes in Canada (Brooks et al. 1991a) and thus recruitment in these areas is exceptionally low. Alternatively, its narrow thermal tolerance range (see ‘Physiology and Adaptability – Thermoregulation’), makes it more sensitive to the effects of climate change at the southern periphery of its Canadian range compared to other turtle species (King and Niiro 2013; see Threats – Climate Change).
Another potential limiting factor for this species is that subpopulation persistence seems to hinge on the propensity of adults to make long-distance movements which maintain genetic diversity within residence wetlands (McGuire et al. 2013; see ‘Biology – Reproductive Ecology’). This makes the Blanding’s Turtle particularly vulnerable to decline due to habitat loss and fragmentation, and increases the risk of collection and mortality along transportation corridors during extensive overland journeys.
Lastly, because Blanding’s Turtles may aggregate together during certain times of the year, including at wintering, spring basking and nesting sites (see Habitat – Habitat Requirements and Biology – Life Cycle and Reproduction), Blanding’s Turtles are particularly vulnerable to collectors, localized increases in predation, habitat disturbance or climate-related events (Parks Canada 2012), as several individuals could be lost at once.
Roads and railways
Overall threat impact: GLSL = high; NS = Low-medium
Because Blanding’s Turtles travel large distances over land, they are particularly susceptible to being struck and killed crossing roads and railways. Turtles (and snakes) in particular, are often intentionally targeted by drivers (Ashley et al. 2007; Gillingwater pers. comm. 2016; Piraino pers. obs.; McNeil pers. obs.). One road mortality study at a known Blanding’s Turtle site in southern Ontario found that ~2.7% of drivers purposely aimed for reptile decoys on the road and that these targeted efforts occurred at a rate of approximately every 15 minutes (Ashley et al. 2007). Given that adult female turtles nest along road shoulders and cross roads more often than males or juveniles during the nesting season, they are at a greater risk of road mortality (Gibbs and Steen 2005; Steen et al. 2006; Walston et al. 2015), which may lead to male-biased sex ratios for subpopulations adjacent to roadways (Saumure 1995; Gibbs and Steen 2005; Piraino and Gillingwater 2006; Steen et al. 2006). Nesting along roadways also increases the mortality risk for hatchlings, many of which are observed dead on roads annually during spring or fall emergence (Parks Canada 2012; Baxter-Gilbert et al. 2013; Gillingwater 2013, unpub. data; Nova Scotia Blanding’s Turtle Database 2014; NHIC data), and roadside nests are sometimes destroyed by graders (which has been observed at one site; Edge unpub. data). Blanding’s Turtles may also hibernate in flooded roadside ditches or borrow pits along forest access roads (Riley et al. unpub. data; Rouse unpub. data; Steinberg pers. comm. 2014), which puts them at increased risk of mortality from encounters with vehicles and heavy machinery. The impacts of roads and railways on wildlife not only include direct mortality from vehicle collisions but also barriers to movement as well as the loss, degradation and fragmentation of habitat (Proulx et al. 2014). Furthermore, because Blanding’s Turtles cross roads significantly less than expected than if they moved randomly in relation to roads (Proulx et al. 2014) and because extensive movements by Blanding’s Turtle adults are important for maintaining gene flow between residence wetlands (McGuire et al. 2013), reduced connectivity between wetlands may decrease genetic diversity of subpopulations in fragmented landscapes (McGuire et al. 2013; Proulx et al. 2014).
Though there are few documented incidents of road mortality in Nova Scotia, road mortality is still considered a significant and increasing threat and is identified as a high level of concern in the Recovery Strategy (Parks Canada 2012). There have been six documented incidents of road mortality of adults in Nova Scotia and > 15 documented mortalities of juveniles and hatchlings (Nova Scotia Blanding’s Turtle Database 2014); additional mortalities may have gone undetected. Because some of the subpopulations in Nova Scotia are very small (i.e., < 10 adults), even a slight increase in the adult mortality rate can have an impact on their viability. Many adults and older juveniles are known to regularly cross roads during their movements to and from nesting and overwintering sites. It is likely that the annual nest protection program has helped lower mortality on roads as volunteers often move or direct traffic around turtles at risk.
In Québec, there is a high density of roads in the Ottawa Valley (up to 2.9 km of road/km2; Duclos and Fink 2013) which present a significant threat to this population. Several road-killed Blanding’s Turtles have been found in the area (Desroches and Picard 2005; Dubois et al. 2012; St-Hilaire et al. 2013). Of 72 sites in the Outaouais region, the road mortality risk rate for a Blanding’s Turtle crossing the road was considered high at 37 sites (51%), moderate at 27 sites (38%), low at 7 sites (10%) and null at one site (1%) based on the distance separating the wetland perimeter and the closest road (Dubois 2009).
In southern Ontario the number of major roads has greatly increased over the past 40 years (Fenech et al. 2001) and is continuing. An average of ~900 km of forest roads are constructed in Ontario annually (Ontario MNRF 2014a) and several large-scale road development/improvement projects have been recently completed or are currently underway within confirmed Blanding’s Turtle habitats in Kemptville, Parry Sound, Pembroke and Sudbury districts. Between 2010-2016, there were four ESA Overall Benefit permit applications (three approved and one proposed) for road developments within Blanding’s Turtle habitat; each project has proposed installing ecopassages as the primary method to compensate for the loss of habitat (Government of Ontario 2016). Several other recent or ongoing large-scale road development projects do not appear on the Ontario Environmental Registry, meaning that they did not require an Overall Benefit Permit to proceed. This suggests that the type of ESA approval for these road developments was a Regulatory Exemption; since Blanding’s Turtle habitat only became protected under the ESA in 2013, road infrastructure projects could apply for Regulatory Exemption if they were approved to a certain stage by January 2015 (Ontario MNRF 2013b) See Protection, Status and Ranks – Legal Protection and Status – Ontario for an explanation of the various types of ESA approvals and associated requirements for species protection.
Although the majority of Blanding’s Turtle road mortality records in Ontario have been reported from major roadways, many observations have also been reported from Provincial Park roads, rural county roads, gravel forestry access roads and even ATV trails (NHIC data). Once logging roads and gravel county roads are also considered, there may be few Blanding’s Turtle subpopulations in southern Ontario that do not occur within 10 km of a road. Within Parry Sound district, the level of Blanding’s Turtle road mortality is considered high; most individuals are killed on larger paved roads, some on smaller cottage roads and a few on forest access roads (Rouse pers. comm. 2015). Public use of most forest access roads in this region is not regulated and therefore the level of road mortality risk on public access logging roads is likely similar to that of cottage roads. Furthermore, a large portion of the females in Parry Sound district nest on roads and the rate of new roads being built in the region is high (Rouse pers. comm. 2015). Similarly, within Pembroke district, several to dozens of new forestry access roads are created annually; these logging roads attract nesting females and continue to add new population sinks (Kruschenske pers. comm. 2014). Railway mortality is also a threat for this species, with several observations of live and dead individuals on railway tracks reported from across the Great Lakes/St. Lawrence population, including the Outaouais region of Québec and the Ontario counties of Muskoka, Parry Sound, Ottawa, Simcoe and Sudbury (Dubois et al. 2012; Dillon Consulting 2014; Keevil pers. comm. 2014; Marks pers. comm. 2014; Mills pers. comm. 2014; Woods 2014; Scales Nature Park unpub. data; NHIC data). Based on estimated road kill rates of 0.2-0.3 turtles/km from standardized surveys along four major roadways across Ontario, it is estimated that ~265 to 400 Blanding’s Turtles (> 15 cm PL) are killed on roads annually in the province (Appendix 3).
Invasive species
Overall threat impact: GLSL = medium-high; NS = Low-high
European Reed is an invasive plant that can rapidly displace natural vegetation communities with dense mono-cultural stands (attaining heights of >5m, densities of >95% and expansion rates of ~10 cm/day (Wilcox et al. 2003; Jodoin et al. 2008; Gilbert 2012). Although turtles may occasionally use the flooded edges of European Reed stands when they initially occur as small pockets within larger habitat mosaics, once the stands become extensive impenetrable monocultures (which is usually inevitable given that it is a highly competitive and aggressive plant; Wilcox et al. 2003; Gilbert 2012), the wetland habitat becomes unsuitable for turtles (Gillingwater 2009; 2013). Indeed, surveys within dense European Reed stands have found few to no turtles within them compared to open wetland areas surveyed with similar effort (Davy unpub. data; Gillingwater 2009; 2013). The height and density of European Reed stands limits turtle basking and movement opportunities (Misfud 2013; Gillingwater 2009; 2013; Markle unpub. data) Individuals have even been observed stuck and/or dead within dense stands (Mackenzie et al. 2014; Davy unpub. data; Markle unpub. data). Loss of nesting habitat is another issue; European Reed can invade a nesting site over the course of a few weeks, resulting in lowered hatching success due to spreading roots or reduced incubation temperatures from shading (Bolton and Brooks 2010). Greater vegetation cover also increases hatchling overwintering mortality by limiting snow accumulation which is needed to insulate the nest against winter temperatures (Weisrock and Janzen 1999). Pervasive lowered incubation temperatures resulting from shading also threaten to skew population sex ratios for TSD species such as Blanding’s Turtles (Janzen 1993; Janzen and Morjan 2001). Dense stands of dead European Reed also present a mortality risk due to fire hazard (Gilbert 2012).
European Reed has been rapidly spreading throughout southeastern Canada since the 1990s and was reported in central Ontario (the Canadian stronghold for Blanding’s Turtle) by 2010. By 2030 it is expected to substantially increase its distribution throughout all of southern Canada (Catling and Mitrow 2011; Figure 5), and will overlap entirely with the Canadian range of Blanding’s Turtle. Since the mid-2000s, there have been large alterations to Blanding’s Turtle habitats at some sites within southwestern Ontario and observations of turtles at a couple of these sites have declined substantially in recent years (MacKenzie et al. 2014; Gillingwater unpub. data). Rates of spread at these sites between 1999-2006 were estimated at 34-48% annually (Badzinski et al. 2008) and this has likely only increased since then given the rapid alterations observed over the last seven years alone (Gillingwater unpub. data). One of these southwestern Ontario sites is largely isolated (mostly surrounded by water, with little human intrusion and at least 10 km away from the nearest road) and thus, it seems that even relatively undisturbed areas are prone to invasion. Furthermore, there is no open wetland habitat type that is immune to invasion by European Reed (Gilbert pers. comm. 2013). The continuing expansion of roads and extensive logging activities throughout central Ontario will likely facilitate the spread of European Reed through the region. Based on all this information, it is anticipated that Blanding’s Turtle habitat in Ontario may decline by 11% - 70%, over the next 120 years (i.e., three generations) due to the continued spread of invasive European Reed(see Appendix 2b. Threats Calculator). Although European Reed is present in the Outaouais and Montérégie regions of Québec it has not yet posed a threat to Blanding’s Turtle habitat (Giguère pers. comm. 2014; Toussaint pers. comm. 2014). Similarly, although European Reedwas first documented in Nova Scotia in the early 1900s (Catling and Mitrow 2011), researchers have not yet observed this invasive plant within or near Blanding’s Turtle habitat in the province (Nova Scotia Blanding’s Turtle Database 2014). Invasive European Reed is, however, predicted to spread throughout all of southern Canada by 2030 (Catling and Mitrow 2011); thus habitat losses in both Québec and Nova Scotia are anticipated in the near future. Other invasive species known to occur in Blanding’s Turtle habitat within the Great Lakes/St. Lawrence region include Reed Canary Grass (Phalaris a. arundinacea), Rough Mannagrass (Glycerian maxima), Common Carp (Cyprinus carpio) and Red-Eared Slider (Trachemys scripta elegans). In Nova Scotia, other invasive species which are expanding their distribution include predatory fish such as Smallmouth Bass (Micropterus dolomieu) and Chain Pickerel (Esox niger; Parks Canada 2012). While the level of threat for each of these additional invasive species on Blanding’s Turtle subpopulations is not known, they have the potential to affect habitat quality, food availability and may also pose a predatory threat to turtle hatchlings.
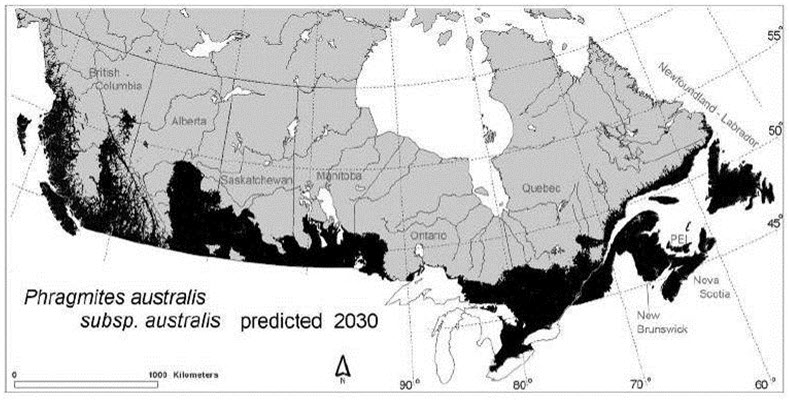
Long description for Figure 5
Map showing minimal predicted distribution of invasive European Reed, Phragmites a. australis, in Canada by 2030.
Subsidized predators
Overall threat impact: GLSL = medium; NS = medium
In human-dominated landscapes, subsidized predators (i.e., those that occur in higher abundances resulting from increased food resources from human sources; Garrott et al. 1993; Mitchell and Klemens 2000) can cause unnaturally high predation rates of turtles at all life stages (see BIOLOGY – Mortality). Reported predator-related injury rates for monitored Blanding’s Turtle subpopulations range from 17% - 31% (Kofron and Schreiber 1985; Gillingwater and Brooks 2001; Dubois et al. 2012; Gillingwater unpub. data). Abnormally high levels of predators on the landscape can also result in much higher predation rates on nests and hatchlings. Studies in southwestern Ontario have reported 55-100% mammalian predation rates of nests that were not protected with caging (Saumure 1995; Gillingwater and Brooks 2001; Browne 2003; Gillingwater 2013). Limited juvenile recruitment, due to elevated predation rates, has been considered the likely cause of a shift to a larger size and presumably older age structure of one Blanding’s Turtle subpopulation in southwestern Ontario (Browne and Hecnar 2007). Although the level of this threat in Ontario is likely highest in the heavily developed areas south of the Canadian Shield, increasing cottage and road development are expected to expand the scope of this threat to subpopulations in some areas on the Shield (see Appendix 2b. Threats Calculator). In Nova Scotia, predation on unprotected nests and hatchlings can be very high in human-dominated landscapes (Herman et al. 1995) and nests along lakeshores and roadsides appear to have higher predation rates than inland nests that occur away from areas of high disturbance (McNeil pers. obs.; Herman pers. comm. 2015). An annual nest protection program has been implemented in these areas to counter the high predation rates (Standing et al. 2000). Graham (in Congdon et al. 2008) found that mammal trapping/removal to protect turtle nests required considerable effort and yielded poor results and that nest caging was a much more effective means of improving hatchling recruitment.
Pet, food and traditional medicine trades
Overall threat impact: GLSL = medium; NS = Low-medium
Recent evidence indicates that Canadian Blanding’s Turtles are being illegally harvested to supply the Asian food and traditional medicine trades both in Canada and abroad (Miller pers. comm. 2014). Reptiles are a prime target in the illegal wildlife trade and there are black market brokers in Ontario that are smuggling rare turtles both into and out of the country on a regular basis (Miller pers. comm. 2014). Demand for turtle products is expected to rise in Ontario as the number of cultural consumers and practitioners of Traditional Asian Medicine continue to grow (Miller pers. comm. 2014). There is also demand for Blanding’s Turtles in the pet trade. In 2012, Reptiles Magazine advocated the Blanding’s Turtle as one of the best species for collectors to keep in captivity due to its "engaging and interesting" character (CITES 2013). As species become rarer and difficult to obtain, the market value increases and they also become more sought after in the black market (CITES 2013; Miller pers. comm. 2014). In 2007, a Wallaceburg man was arrested along with two Toronto practitioners for possessing 26 live Blanding’s Turtles and one Spotted Turtle from a southwestern Ontario subpopulation (Chatham Daily News September 11, 2008). In August 2014, a Windsor man was arrested at the Detroit-Windsor border with 51 turtles in his pants; just a few weeks later he was detained after his Toronto courier attempted to fly out of Detroit Metro Airport with 970 turtles hidden in his luggage (the shipment consisted of 700 Diamondback Terrapins (Malaclemys terrapin) as well as Blanding’s Turtles and Wood Turtles that were destined for Chinese pet and food markets (The Detroit News September 26, 2014). Federal agents discovered that this one trafficker peddled thousands of turtles over many years (The Detroit News September 26, 2014); in April 2016, he received an unprecedented sentence of 5 years in federal prison (The Globe and Mail April 12, 2016).
In addition to commercial collection for the pet trade, local community members often take wild individuals as personal pets or move them to "better" areas such as rural/cottage properties far removed from the turtle’s place of origin (CITES 2013; Gillingwater pers. comm. 2014; Marks pers. comm. 2014; Woods 2014; McNeil pers. obs.). Likewise, there are reports of increased non-commercial collection of turtles from within protected natural areas in the U.S.A. (Lovich 1987; Garber and Burger 1995; Graham 1995). From conversations with local citizens in Nova Scotia, it appears that temporary removal of turtles for children’s pets is relatively commonplace and tends to occur opportunistically (McNeil pers. obs.). These turtles are often returned to the wild though not necessarily to their place of origin. One Blanding’s Turtle was found on an island, many kilometres from its home range (Nova Scotia Blanding’s Turtle Database 2014), and a Blanding’s Turtle was photographed on the Haines Road in Southwest Yukon (Bruce Bennett, pers. comm. 2016). Blanding’s Turtle localities in Nova Scotia are widely known among community members and are described in literature and media sources, which could put them at risk of directed collection in the future. The magnitude of these occurrences and their relative effects on subpopulations across the range is not known. The removal of turtles from the wild is equivalent to mortality from a population viability perspective. Removal of adults decreases the number of sexually mature individuals available for reproduction and may reduce the reproductive success of the remaining adults. Since females are often targeted for collection, this may skew sex ratios and stability of subpopulations (Congdon et al. 2008).
Residential and commercial development
Overall threat impact: GLSL = medium; NS = Low
Besides direct removal of wetland habitat, development can also lead to habitat fragmentation and degradation of remaining habitat (see Threats and Limiting Factors – Roads and Railways for discussion of associated habitat fragmentation effects). Blanding’s Turtles extensively use upland forests (see Habitat) and the removal of forest habitat makes the landscape less suitable for Blanding’s Turtles (Quesnelle et al. 2013). Movement of Blanding’s Turtles through developed areas increases the risk of vehicle collisions, predation and harm from machinery or other anthropogenic hazards (Findlay and Bourdages 2000; Gibbs and Shriver 2002; Steen and Gibbs 2004; Aresco 2005; Ryan et al. 2008; McGuire et al. 2013). Furthermore, disturbed areas often attract Blanding’s Turtles (and other turtles) in search of nesting habitat (see Habitat – Habitat Requirements – Nesting Habitat), but nesting in these areas likely creates an ecological trap because it exposes females and hatchlings to the anthropogenic hazards mentioned above. Congdon et al. (2011) suggest that terrestrial protection zones of 450 m around all wetlands (residence and temporary) and 2000 m around residence wetlands are necessary to protect 100% of Blanding’s Turtles nests and adults, respectively; however, habitat protection at this scale is rarely implementable as mitigation for development (see Legal Protection and Status – Ontario for a discussion of habitat protection requirements under the provincial Endangered Species Act).
By the early 2000s southern Georgian Bay was noted as the fastest developing area in Ontario (Watters 2003) with high density developments commonly replacing low density, non-intensive land use areas (MacKinnon et al. 2005). Shoreline cottage development is currently resulting in habitat loss in the region (Enneson and Litzgus 2009; Brooks pers. comm. 2014) and within confirmed Blanding’s Turtle habitat (Government of Ontario 2016). In the Sudbury district, there is at least one subpopulation that occurs within an active housing development surrounded by lands also proposed for development (Woods 2014). In Kemptville district, habitat continues to be threatened by residential and other land development and in 2014 alone, there were several proposed developments within Blanding’s Turtle General Habitat (Thompson pers. comm. 2014). Between 2010-2014, there were several ESA approvals for developments within Blanding’s Turtle habitat which did not require a permit to proceed, including 11 Regulatory Exemption Registrations and three Agreements (these numbers include both development and road infrastructure projects; see Protection, Status and Ranks – Legal Protection and Status – Ontario for explanation of the various types of ESA approvals and associated requirements for species protection). Because Blanding’s Turtle habitat only became protected under the ESA in 2013, development projects could receive Regulatory Exemption if they were approved to a certain stage by January 2015 (Ontario MNRF 2013b). Thus it is assumed that there were additional Exemption Registrations in 2015 for development projects affecting Blanding’s Turtle; however, this number was not obtained in time for inclusion in this report. Between 2015 - 2016, there were three ESA Overall Benefit Permit applications for proposed residential developments within Blanding’s Turtle habitat; there will be a net loss of ~20-124 ha of habitat per project and the primary proposed compensation measures include installing fencing, reducing road mortality and enhancing remaining habitat through riparian restoration or creating nesting and overwintering microhabitats (Government of Ontario 2016).
In Québec, the majority of Blanding’s Turtle habitat occurs within protected areas and agricultural zones where the threat of residential and commercial development is low (Dubois pers. comm. 2014; Giguère pers. comm. 2014). In Nova Scotia, two subpopulations occur in working landscapes that are affected by residential and cottage development (McNeil 2002; Caverhill 2003; Lefebvre 2009).
Natural system modifications
Overall threat impact: GLSL = Low-medium; NS = Unknown
Dredging of wetlands, especially during the hibernation period, presents a mortality risk for turtles. At a protected wetland in southwestern Ontario, researchers observed seven dead adult Blanding’s Turtles in early spring partially buried in sediment that had been dredged during the winter; many others were likely completely buried out of view (Gillingwater and Piraino 2004). Since at least 2009 and continuing into 2016, large-scale dredging has occurred within adjacent protected areas to create waterfowl habitat and has resulted in the loss of confirmed Blanding’s Turtle habitat; shallow wet meadows with abundant vegetation were replaced with deep, open-water, sand-bottomed ponds devoid of cover and foraging opportunities (Gillingwater pers. comm. 2016). Another threat is the use of aquatic weed mowers to clear boat channels; this has resulted in injury and mortality to turtles in coastal wetlands where Blanding’s Turtle is known to occur (Bolton pers. comm. 2015). Wetland dredging, aquatic vegetation mowing and waterfowl habitat creation likely occur within many wildlife management areas and could potentially be a significant source of mortality for Blanding’s Turtles.
Beaver dam trimming or removal during the winter also presents a mortality risk for Blanding’s Turtles. In 2010, the “trimming” of a dam within an Ontario Provincial Park resulted in accidental destruction of the dam and an immediate water level drop of 2 m. Overwintering habitat was completely destroyed, many dead turtles were located and there was no mitigation to deal with the impact (Davy unpub. data). Blanding’s Turtles are often associated with Beaver-influenced wetlands across their range and thus, Beaver dam removal during the winter has the potential to impact this species throughout its range. In the Outaouais region of Québec, dismantling of Beaver dams was observed to be a significant threat to the population; many dams were dismantled at the end of November 2010 which resulted in a significant loss of Blanding’s Turtle habitat and likely mortality given the timing of the removals (Dubois et al. 2012). Many citizens in this region have expressed desires to remove Beaver dams from their properties (Dubois et al. 2012) and since 2006, citizens within certain Regional County Municipalities (RCM) of Québec have been obliged to dismantle dams that may represent a threat to human safety (Duclos and Fink 2013).
In Nova Scotia, water level manipulation resulting from the installation of dams and/or the removal of beaver dams has been identified as a significant threat (McNeil 2002; Mockford et al. 2005; Parks Canada 2012). In addition to increased mortality risk to overwintering turtles, changes to water levels could increase nest flooding events and result in sub-optimal moisture retention in eggs, affecting hatching success and hatchling fitness (Packard 1999; Standing et al. 2000; Parks Canada 2012). Blanding’s Turtle eggs are not highly susceptible to drought or drowning (Packard et al. 1982); however, prolonged flooding can lead to nest failure. In lakeshore sites in Nova Scotia, nest flooding occurs frequently and in 2003, all lakeshore nests in one subpopulation were lost as a result of late summer flooding (Nova Scotia Blanding’s Turtle Database 2014). Since this time, researchers have attempted to move nests at risk of imminent flooding to higher ground along the lakeshore. Furthermore, changes in water flow regimes may impede seasonal movements and affect the turtles’ ability to nest, feed, and access overwintering sites (Herman et al. 2003).
Logging and wood harvesting
Overall threat impact: GLSL = Low; NS = Low
In Ontario, Blanding’s Turtles are known to occur extensively throughout Crown forests where forest management activities are conducted (Environment Canada 2014; Crowley pers. comm. 2015); at least half of the Blanding’s Turtle Ontario range (i.e., the entire Georgian Bay ecoregion and northern Ontario) overlaps with the Area of the Undertaking (AOU), where forest management on Crown land takes place. Forestry operations can cause direct mortality of turtles due to being crushed by logging equipment and can also cause destruction of vernal pool and hibernation habitat (Natural Heritage and Endangered Species Program 2007). Therefore, many specific guidelines have been implemented into the Stand and Site Guide under the Ontario Crown Forest Sustainability Act (S.O. 1994, c. 25) to better protect Blanding’s Turtles from forestry operations. For instance, heavy equipment is not permitted within suitable winter habitat (in any season), within 300 m of suitable summer habitat during the nesting season (June 1-30), within 150 m of suitable summer habitat during other periods of the active season when Blanding’s Turtles are terrestrial (i.e., May 1-30, July 1-15 and Sept 1-30), or within 30 m of suitable summer habitat during the rest of the active season when Blanding’s Turtles are less terrestrial (i.e., April 15-30, July 15-Aug 31, Oct 1-15; Ontario MNRF 2016). There is still a risk of encounters with vehicles and heavy machinery during long-distance terrestrial forays away from wetlands. Furthermore, because these restrictions are only applied to the 1 km ‘area of concern’ (AOC) surrounding suitable habitat within 2 km of a known occurrence or recent (< 20 years) “reliable sighting” (Ontario MNRF 2016), it is possible that some unknown or unconfirmed subpopulations do not receive any protections from forestry operations. Furthermore, forestry ditch cleaning operations are permitted in October (Ontario MNRF 2016) and this could harm turtles hibernating in flooded ditches. In addition to direct mortality that may result from heavy equipment operations, logging roads can result in road mortality and are considered the primary forestry-related threat to the species (see Threats and Limiting Factors – Roads and Railways). To mitigate against this threat, the Stand and Site Guide requires driver awareness training and the development of a strategy to reduce traffic speeds and volume on logging roads, and within the 1 km AOC, it prevents construction of new roads within 30 m of nesting sites or suitable summer habitat, unless using techniques that will avoid road mortality (Ontario MNRF 2016). Therefore, the Stand and Site Guide provides several important mitigation measures to protect Blanding’s Turtle and thus, it is assumed that the ‘Overall Threat Impact’ from forestry operations is ‘Low’ for the Great Lakes/St. Lawrence population despite widespread overlap of Blanding’s Turtles within provincial Crown forests where large-scale logging activities occur. However, there is no evidence to prove or disprove whether implementation of these mitigation measures has significantly reduced the level of threat to Blanding’s Turtle from forestry operations.
Forestry is not a threat for the Québec subpopulation because Blanding’s Turtle habitat in the province is situated within protected areas or agricultural landscapes (Dubois pers. comm. 2014; Giguère pers. comm. 2014). In Nova Scotia, three subpopulations are surrounded by provincial Crown and private lands where land use activities include forestry (Caverhill 2003; Mockford et al. 2005; Lefebvre et al. 2012).
Energy production and mining
Overall threat impact: GLSL = Unknown; NS = Low
Besides direct loss of habitat from mining developments due to wetland drainage and land conversion, the operation of heavy machinery within Blanding’s Turtle habitat increases the risk of injury and mortality of individuals. In addition, roads associated with mines and energy developments increase the risk for road mortality and other road related impacts (see Threats and Limiting Factors – Roads and Railways). Furthermore, pollution from mines has been confirmed in some Blanding’s Turtle habitats and may be a potential source of mortality, decreased fitness, and reduced nesting success (see Threats and Limiting Factors – Pollution). Evidence of Blanding’s Turtles using mining areas has been reported from across the Canadian range. In Nova Scotia, individuals have been observed nesting in mine tailings and using mining ponds as habitat (Caverhill 2006) and one subpopulation occurs in a landscape where gravel mining currently occurs (Caverhill 2003; Mockford et al. 2005; Lefebvre et al. 2012). Furthermore, existing mineral extraction rights threaten to delay protection of several areas containing critical habitat for Blanding’s Turtles in Nova Scotia, including a vital overwintering site (The Province of Nova Scotia 2013). In Québec, some radio-tracked Blanding’s Turtles reportedly crossed through quarries during overland movements and 32% of nests were laid in quarries (Dubois et al. 2012). In Ontario, the home range of a radio-tracked Blanding’s Turtle had a large overlap with an active gold mine (OMNRF Timmins District unpub. data) and individuals have been observed using gravel pit ponds as habitat (Schueler pers. comm. 2015).
In Ontario, there are a multitude of active mining claims (Ministry of Northern Development and Mines 2014), 29 active gold and base metal mines (Ontario Mining Association 2014) and hundreds of active pits and quarries (Ontario MNRF 2012) that occur within the range of Blanding’s Turtle. Between 2013 - 2016, there were three ESA Overall Benefit permit applications for mining developments (one approved and two proposed) within Blanding’s Turtle habitat (Ontario Government 2016). Each will result in a net loss of habitat (16-23 ha habitat removals for two projects and an unspecified amount for a third project on 472 ha of Crown land); however, one proponent granted a 259 ha conservation easement and this will increase the amount of protected habitat for Blanding’s Turtle (Ontario Government 2016). Other compensatory measures for these habitat removals include installing fencing, ecopassages, and enhancing remaining habitat by installing a wetland outlet or nesting microhabitat and basking structures (Government of Ontario 2016).
In southwestern Ontario, between 2011 - 2016 there were five Renewable Energy Approvals (REA) for wind energy projects to be built within Blanding’s Turtle habitat (Government of Ontario 2016). Only one of these five projects required an ESA Overall Benefit Permit to obtain a REA (Government of Ontario 2016). Each of these REAs has been appealed based on “serious and irreversible harm to Blanding’s Turtle” due to the potential for increased road mortality risk and increased predator/poacher access into habitat from constructing/upgrading access roads, as well as the potential for increased nest predation (because turtles may begin to nest in easily accessible areas such as access roads, crane pads and turbine bases). The Environmental Review Tribunal (ERT) upheld two wind energy approvals (for insufficient evidence of potential harm to Blanding’s Turtle or for raising the issue too late in the proceedings to permit the appeal based on potential harm to Blanding’s Turtle; Government of Ontario 2016). Two other wind energy projects are still under appeal while approval for a fifth wind farm was decisively revoked in June 2016 after four years of appeals (Government of Ontario 2016; The Toronto Star June 6, 2016); the ERT concluded that the potential threats to Blanding’s Turtle from this proposed 324 ha wind farm could not be effectively mitigated (Aware Simcoe July 5, 2013). This decision could potentially influence the outcome of the two remaining wind energy projects under appeal. A 14-year study of a Desert Tortoise (Gopherus agassizii) subpopulation at a large wind energy facility in California found evidence that wind energy activities and construction contributed directly to habitat destruction and mortality of tortoises but that the subpopulation seemed stable overall with no significant differences in mortality, density, growth, maturity, demography or nesting ecology when compared to other subpopulations in more natural areas; however, these results were only correlative because the study was not a Before-After-Control-Impact (BACI) study with comparative pre-construction data on the subpopulation to establish a cause and effect relationship (Lovich et al. 2011; Ennen et al. 2012). Impacts to freshwater turtles from wind energy developments have not been studied and thus it is uncertain whether wind farms would cause serious harm to Blanding’s Turtle or its habitat.
Human intrusions and disturbance
Overall threat impact: GLSL = Low; NS = Low
At two southwestern Ontario lakeshore sites, dead and live Blanding’s Turtles have been observed with boat propeller strikes to the carapace (Gillingwater and Brooks 2001; Davy unpub. data; Gillingwater unpub. data) with approximately 10% of captures at one site displaying carapacial scarring indicative of propeller strikes (Davy unpub. data). It is likely that boat mortality also presents a threat for other subpopulations where recreational boating is common. The extent of this threat in Nova Scotia is not known but one turtle is believed to have died as a result of motor boat impact (Nova Scotia Blanding’s Turtle Database 2014).
Throughout their Canadian range, Blanding’s Turtles are known to move along, cross or nest on active all-terrain vehicle (ATV) or bicycle trails and in old quarries used by ATVs (Dubois et al. 2012; Nova Scotia Blanding’s Turtle Database 2014; Gillingwater unpub. data; NHIC data). This presents a mortality risk to individuals and potential for damage to nests and habitat. Live and dead individuals have been reported on active ATV trails in Ontario (NHIC data). In the Sudbury district, ATVs and 4x4 trucks frequently drive through shallow aquatic ditches or flooded trail ruts used by juveniles and adults, and over nesting sites along a railway embankment; it is suspected that females in this subpopulation may also nest on or in close proximity to a bicycle path, putting the hatchlings at risk of bicycle mortality (Woods 2014). In Nova Scotia, several nests have been disturbed or destroyed by ATV and dirt bike users who frequent the old quarries (Nova Scotia Blanding’s Turtle Database 2014) and off-road vehicle mortality is considered a significant and increasing threat that has been identified as a high level of concern in the Recovery Strategy (Parks Canada 2012).
Agriculture
Overall threat impact: GLSL = Low; NS = Negligible
Large-scale wetland conversion for agriculture occurred in the Great Lakes/St. Lawrence region from the early 1800s to the mid-1900s (see Habitat Trends); therefore, although agricultural expansion is incrementally continuing, it is not anticipated to cause large declines in Blanding’s Turtle habitat over the next 10 years. However, agricultural operations and machinery still pose a mortality risk to individuals, nests and hatchlings given that Blanding’s Turtles are often observed crossing through or nesting in farm fields and even using flooded fields as staging areas prior to nesting (Caverhill 2003; Mockford et al. 2005; Dubois et al. 2012; Lefebvre et al. 2012; Dillon Consulting 2014; Environment Canada 2014). Indeed, there are records of adults that have been killed by farm machinery (NHIC data). Christmas tree farming adjacent to one of the Nova Scotia subpopulations may lead to habitat fragmentation, and vehicles operating on the farms may pose a mortality risk to turtles, especially adult females that are attracted to these areas for nesting (Caverhill 2006; Appendix 2a. Threats Calculator). Agricultural runoff can also degrade wetlands through pollution and sedimentation (see Threats and Limiting Factors – Pollution).
Climate change
Overall threat impact: GLSL = Unknown; NS = Low
A recent study investigating climate change-induced distributional shifts for Great Lakes region reptiles reported that Blanding’s Turtle appears to be highly sensitive to climate change (King and Niiro 2013), potentially due to its low critical thermal maxima (Hutchinson et al. 1966). The study used ecological niche modelling to characterize the association between climatic variables and current species’ distributions. Current distributions were well predicted by the models and this information was then used to project future areas of high climatic suitability. For Blanding’s Turtle, seven climatic variables were incorporated into the models (Annual Mean Temperature, Mean Diurnal Range, Isothermality, Temperature Seasonality, Annual Precipitation, Precipitation of Wettest Month, Precipitation of Driest Month). To quantify change in climatic suitability based on these variables,
- the known Blanding’s Turtle localities were compared against the area exceeding the threshold values for high climatic suitability and
- the size of the area satisfying a given threshold value was compared to the size of the geographic background to allow for increases in the size of the area deemed climatically suitable.
Models based on high versus moderate greenhouse gas emissions scenarios predicted that by the year 2050, only 25-50% of current known Blanding’s Turtle localities across the range would still be climatically suitable and that this number would fall below 25% by the year 2080. Under the ‘high emissions’ scenario, most of the currently occupied area within Ontario was predicted to provide low climatic suitability for this species by 2080, with extreme southwestern Ontario providing zero suitability. Even under the more conservative ‘moderate emissions’ scenario, most of southwestern Ontario was still predicted to become an area of low suitability by 2080. Given that the landscape in southwestern Ontario is highly fragmented, it will not be possible for individuals to migrate north with warming temperatures and translocation efforts may be necessary to preserve them.
Sustained low water levels have already been reported in the coastal wetlands of Lake Erie and Lake Huron since the late 1990s and early 2000s respectively (Great Lakes Wetlands 2011; Mackenzie et al. 2014). A further 1 m water level drop within the Great Lakes is predicted to occur by 2036, threatening the existence of these dynamic coastal habitats and the species that utilize them (Great Lakes Wetlands 2011).
Pollution
Overall threat impact: GLSL = Unknown; NS = Unknown
The effects of pollution on Blanding’s Turtles have not been studied and are poorly understood; however, studies on the sympatric Snapping Turtle (a species that shares many of the same habitats and dietary habits with Blanding’s Turtle) reported reduced hatching success and increased deformity rates due to high concentrations of contaminants such as PCBs and organochlorines (Bishop et al. 1991, 1998; de Solla et al. 2008). Furthermore, several studies on North American freshwater turtles have reported declines or absences of turtles from areas with degraded water quality and high levels of urban, industrial and agricultural pollutants (Moll and Moll 2004), suggesting that heavy pollution may result in mortality and/or habitats becoming unsuitable.
Lake Erie in southwestern Ontario receives the bulk of its water input from the St. Clair, Detroit, Sydenham, Thames and Grand Rivers, all of which lie within the most heavily utilized agricultural landscape in Canada, resulting in a significant influx of pesticide residues and nutrient loading from both animal and plant agriculture (Environment Canada and United States Environmental Protection Agency 2008; Lake Erie LaMP 2011; UTRCA 2012; International Joint Commission 2014). Chemical contamination is likely also pronounced within inland wetlands in the heavily urbanized and agricultural landscapes of southwestern Ontario and southwestern Québec. In the Sudbury district of Ontario, logging and mining have carried sulphuric acid and heavy metals into local waterways used by Blanding’s Turtles; four of five tributaries are treated mine effluent or are contaminated by surface drainage, and one section of a creek bed was heavily contaminated with creosote until it was removed in 2007 (Woods 2014). Gold mines and associated mine tailings in Ontario and Nova Scotia pose the risk of water and soil contamination within Blanding’s Turtle habitats. Studies along tributaries of the St. Lawrence River found heavy metals in Snapping Turtle eggs, including mercury in all samples (Bonin et al. 1995; Bishop et al. 1998). Wetlands in Nova Scotia, including those with Blanding’s Turtles, have unusually high mercury content resulting from atmospheric deposition interacting with the geology of the area (Sicliano et al. 2003); high mercury levels have been documented in the Common Loon (Gavia immer) in this area (Sicliano et al. 2003). Other potential sources of pollution in Nova Scotia include a fish hatchery and Christmas tree farms in areas adjacent to Blanding’s Turtle habitat (see Appendix 2a. Threats Calculator).
Number of locations
The term ‘location’ defines a geographically or ecologically distinct area in which a single threatening event can rapidly affect all individuals of the taxon present. The size of the location depends on the area covered by the threatening event and may include part of one or many subpopulations. Where a taxon is affected by more than one threatening event, location should be defined by considering the most serious plausible threat (IUCN 2014).
It is very difficult to determine a precise number of locations since threats to Blanding’s Turtles are many and can occur at a variety of spatial scales. However, if we consider a watershed as the base scale at which a single threatening event (e.g., the creation of a major highway or a very harsh winter) could lead to local extinction, the number of Blanding’s Turtle locations is likely 50-100 in Ontario, 2-5 in Québec and 3-5 in Nova Scotia.
Protection, status and ranks
Legal protection and status
Canada
In Canada, the Great Lakes/St. Lawrence population is designated as Threatened and the Nova Scotia population is designated as Endangered; both populations receive protection under Schedule 1 of the federal Species at Risk Act, 2002 (S.C. 2002, c. 29) which makes it an offence to kill, harm, harass or capture this species or to destroy its residences on federal lands. A SARA-compliant Proposed Recovery Strategy for the Great Lakes/St. Lawrence population (Environment Canada 2016) was posted on the SARA website for public review on March 29, 2016; it identifies areas of critical habitat and recovery actions for this species (Environment Canada 2016). In Nova Scotia, a SARA-compliant Recovery Strategy is already in place (Parks Canada 2012) and a draft action plan is in development. Critical habitat has been identified for the known subpopulations, with the exception of the newly discovered NS4 and NS7 subpopulations and a recently documented extension to the NS1 subpopulation (Parks Canada 2012; Nova Scotia Blanding’s Turtle Database 2014). Critical habitat in the NS1 subpopulation occurs on federal lands; seasonal special management practices are implemented at these sites to reduce risks to the turtles (Parks Canada 2010). A number of recovery actions are ongoing in the Nova Scotia population and include habitat protection, an annual nest protection program, a headstarting program, road signage, stewardship and awareness programs (Caverhill 2006; Parks Canada 2012).
Ontario
In Ontario, the Blanding’s Turtle is listed as Threatened under the Endangered Species Act, 2007 (S.O. 2007, c.6) (ESA). As a Threatened species, it is illegal to kill, harm, harass, capture, collect, transport, possess, buy, sell or trade a Blanding’s Turtle. In 2013, Blanding’s Turtle received general habitat protection under the ESA and the Ontario Ministry of Natural Resources and Forestry published a General Habitat Description (Ontario MNRF 2013a) to provide guidance on the identification of Blanding’s Turtle habitat and implementation of ESA habitat protection for this species. The General Habitat Description identifies the habitat of this species as suitable wetlands within 2 km of an occurrence (as long as these wetlands are not separated by distances greater than 500 m), as well as a 250 m buffer around these wetlands. In order to develop within protected species’ habitat developers must obtain an ESA approval (i.e., a ‘Permit’, ‘Agreement’ or ‘Regulatory Exemption’). All types of ESA approvals require implementation of mitigation measures (Ex. timing windows to avoid sensitive periods or temporary fencing around construction zones) to reduce adverse effects on the species that will be impacted (Ontario MNRF 2014b). Overall Benefit Permits go a step further in requiring the developer to perform an activity that will either increase the number of individuals, distribution, population viability or habitat quality/quantity for the species (i.e., provide an “overall benefit”); the conditions of the permit also require impact and effectiveness monitoring as well as scheduled reporting to the MNRF to show compliance (Ontario MNRF 2014b, 2014c). The Regulatory Exemptions (Ontario Regulation 242/08) adopted in 2013 are applicable to several types of industries and developments; MNRF oversight is greatly reduced and proponents are responsible for determining eligibility and interpreting the rules outlined on the MNRF website (Ontario MNRF 2014b). These regulatory changes to the ESA are currently being challenged in court (Ontario Nature 2015). Blanding’s Turtle habitat is also afforded protections under the Provincial Policy Statement of the Ontario Planning Act, 1990 (R.S.O. 1990, c. P.13) and the species is listed as a Specially Protected reptile under the Ontario Fish and Wildlife Conservation Act, 1997 (S.O. 1997, c. 41). The Stand and Site Guide under the Crown Forest Sustainability Act (S.O. 1994, c. 25) also provides timing windows and other conditions for minimizing risks to Blanding’s Turtles and their habitat during forestry operations (see Threats – Logging and Wood Harvesting).
Québec
In Québec, the Blanding’s Turtle is listed as Threatened under the Loi sur les espèces menacées ou vulnérables, 1989 (RLRQ, c. E-12.01) (LEMV) (Act Respecting Threatened or Vulnerable Species; CQLR, c. E-12.01. As a Threatened species, it receives protection under the Loi sur la conservation et la mise en valeur de la faune, 2002 (RLRQ, c. C-61.1) (LCMVF) (Act Respecting the Conservation and Development of Wildlife; CQLR , c. C-61-1). Under article 26 of the LCMVF, it is illegal to disturb, destroy, or damage the eggs or nest of an animal. It is illegal to capture, hunt, and/or keep in captivity any species of turtle that is native to Québec. The aquatic habitat of turtles in Québec is also indirectly protected by Article 128.6 of the LCMVF. Because this turtle is primarily an aquatic species, its habitat is generally protected under the Loi sur la qualité de l’environnement (RLRQ, c. Q-2) (Environment Quality Act) (CQLR, C. Q-2) and more specifically under the Politique de protection des rives, du littoral et des plaines inondables (RLRQ, c. Q-2, a. 2.1) (Protections Policy for Lakeshores, Riverbanks, Littoral Zones and Floodplains) (CQLR, c. Q-2, a. 2.1).
Nova scotia
In Nova Scotia, the Blanding’s Turtle was designated as Endangered by the province in 2000 and receives protection under the provincial Endangered Species Act (NSESA 1998, c. 11, s. 1), which prohibits killing, injuring, disturbing, buying selling and trading listed species and destroying or disturbing their dwelling places. The Act also contains provisions for the minister to designate core habitat and set regulations within that habitat. There are several additional legislative tools which may afford protection to turtles or their habitat including: Provincial Parks Act, Crown Lands Act, Wildlife Act, Environment Act, Forests Act, Special Places Protection Act, Nova Scotia Wetland Conservation Policy and Wilderness Areas Protection Act.
U.S.A.
In the U.S.A., the Blanding’s Turtle is considered a Candidate for Listing (Category 2) under the federal Endangered Species Act (Congdon et al. 2008); however, it is protected to varying degrees under state regulations in all states in which it occurs (CITES 2013).
International
In March 2013, the Convention on the International Trade in Endangered Species (CITES) included Blanding’s Turtle in Appendix II; its international trade is now regulated (CITES 2013).
Non-legal status and ranks
COSEWIC designated the Nova Scotia population as Threatened in 1993 and up-listed it to Endangered upon status reassessment in 2005. At that time, COSEWIC also designated the Great Lakes/St. Lawrence population as Threatened (no status prior to 2005). The General Status Rank of Blanding’s Turtle in Canada was changed from ‘Secure’ in 2000, to ‘May be at risk’ in 2005’, then to ‘At Risk’ in 2010 (Wild Species 2010). Conservation Status Ranks for this species are: ‘Critically Imperilled’ (S1) in Nova Scotia and Québec, and ‘Vulnerable’ in Ontario (S3) and Canada (N3; NatureServe 2014). Interestingly, the Blanding’s Turtle is listed as ‘Apparently Secure’ in the U.S.A. (N4) and across the global range (G4) despite the fact that it is listed at some level of peril (i.e., S1 to S3) in 14 of 15 states where it occurs; within 13 of these states, Blanding’s Turtle is considered a ‘Species of Greatest Conservation Need’ (see Table 3 for a complete list of Conservation Status Ranks). It is only considered ‘Secure’ (S4) in one of the 18 North American jurisdictions in which it occurs; Nebraska maintains an exceptionally large subpopulation of >130,000 adults within a large wildlife refuge (~29,000 ha) that has been protected for nearly a century (U.S. Fish and Wildlife Service 2014). The population size in Nebraska reflects historical abundances that are characteristic of undisturbed subpopulations of turtles; a situation which is now becoming extremely rare. Other subpopulations across the species’ range are often small and localized, maintaining a few dozen to a hundred turtles (Congdon et al. 2008; van Dijk and Rhodin 2013; this report). In 2010, the IUCN Red List status of Blanding’s Turtle was up-listed from ‘Lower Risk (near threatened)’ to ‘Endangered’ based on criteria ‘A2cde+4ce’, meaning that there is evidence of extensive decline for most subpopulations and a slow rate of potential recovery (van Dijk and Rhodin 2013); according to this assessment, the Blanding’s Turtle has undergone a global population reduction ≥80% over the last three generations.
| Type | Jurisdiction | Status | Conservation rank |
|---|---|---|---|
| blank | Global | Endangered (IUCN) | G4 |
| Countries | Canada | Threatened (Great Lakes/St. Lawrence); Endangered (Nova Scotia) | N3 |
| Countries | United States | Candidate for Listing (Category 2) | N4 |
| Provinces | Ontario | Threatened | S3 |
| Provinces | Nova Scotia | Endangered | S1 |
| Provinces | Québec | Threatened | S1 |
| States | Illinois | Endangered; SGCN | S3 |
| States | Indiana | Endangered; SGCN | S2 |
| States | Iowa | Threatened; SGCN | S3 |
| States | Maine | Endangered; SGCN | S2 |
| States | Massachusetts | Threatened; SGCN | S2 |
| States | Michigan | Protected; SGCN | S3 |
| States | Minnesota | Threatened; SGCN | S2 |
| States | Missouri | Endangered; SGCN | S1 |
| States | Nebraska | Protected; SGCN | S4 |
| States | New Hampshire | Endangered; SGCN | S1 |
| States | New York | Threatened; SGCN | S2S3 |
| States | Ohio | Protected | S2 |
| States | Pennsylvania | Protected; SGCN | S1 |
| States | South Dakota | SGCN | S1 |
| States | Wisconsin | Threatened; SGCN | S3S4 |
Sources:
CITES 2013; NatureServe 2014
Legend:
G = Global Rank; N = National Rank; S = State or Provincial Rank;
1 = Critically Imperiled; 2 = Imperiled; 3 = Vulnerable; 4 = Apparently Secure; 5 = Secure
SGCN = State designation of Species of Greatest Conservation Need
Habitat protection and ownership
In Ontario, the Blanding’s Turtle occurs in at least 119 protected areas including 53 Provincial/National Parks, 34 Conservation Areas, eight Provincial/National Wildlife Areas, six Nature Reserves, five DND properties, five First Nations Reserves, three Sanctuaries, two National Historic Sites, one Game Reserve, one Wildlife Reserve and one Wildlife Management Area. Overall, there are >1,000,000 ha of protected lands in Ontario where Blanding’s Turtles occur at least within certain portions of those lands.
In Québec, approximately 21,000 ha of Blanding’s Turtle habitat is protected within provincial, federal and conservation agency owned lands, including one Regional Park, one National Wildlife Area and one First Nations Reserve (Bernier pers. comm. 2014; Environment Canada 2014).
In Nova Scotia, the NS1 subpopulation is located primarily within the boundaries of a protected area, with the exception of a recently documented extension maintaining a small concentration of turtles (Parks Canada 2012; Nova Scotia Blanding’s Turtle Database 2014). The NS2 and NS3 subpopulations occur in a mix of private and provincial Crown lands (McNeil 2002; Caverhill 2006; Lefebvre 2009). Between 2008 and 2013, the Nova Scotia Nature Trust formally protected an additional six habitats for these subpopulations totalling 103 ha (Porter pers. comm. 2014). In 2003, a substantial portion of critical habitat (102 ha) was protected by the local forestry company that owned it. This habitat has since been purchased by the Province of Nova Scotia. Several large tracts of provincial crown land containing Blanding’s Turtle habitat, including the piece purchased from the forestry company, were proposed for protection under the province’s obligation to protect at least 12% of provincial lands by 2015 (The Province of Nova Scotia 2013). As of December 29, 2015, the tract that includes some land around NS4 was formally designated. The tracts around the larger subpopulations, NS2 and NS3, are listed as pending, subject to addressing mineral rights. If successful, the designation of these protected areas will significantly increase the proportion of Blanding’s Turtle habitat that is protected in Nova Scotia, including areas that maintain some of the most significant overwintering and summering sites.
The ability for these Canadian protected areas to serve as refugia for Blanding’s Turtle is questionable since high road densities and large numbers of recreational visitors to many of these areas result in an increased threat of road mortality and poaching (see Threats and Limiting Factors). Indeed, most of the documented threats and observed declines discussed throughout this report were recorded from within protected areas. Crowley and Brooks (2005) found that the average road density of Provincial Parks within the distribution of Ontario’s reptiles was nearly double the provincial average, which may cause these areas to act as regional population sinks rather than safe havens. Phillips and Murray (2005) found that density of subsidized predators was four times higher in a southwestern Ontario protected Park than the overall average for rural Ontario. Most subpopulations of Blanding’s Turtles that have been studied occur within protected areas; however, there is strong evidence that Blanding’s Turtles at several protected sites across the Canadian range are declining due to various threats (see Threats and Limiting Factors and Fluctuations and Trends).
Acknowledgements and authorities contacted
Teresa Piraino would like to greatly thank the Toronto Zoo for providing funds to have two Quantitative Analyses prepared in support of this status report, to estimate past and future decline of Blanding’s Turtle in Ontario. Many thanks are also extended to Matt Keevil, David Seburn and Kari Gunson for preparing these analyses. She is also extremely thankful to the Canadian Wildlife Service/ Environment and Climate Change Canada for providing a contract to P. A. Bernier to prepare a comprehensive English summary report of Blanding’s Turtle research conducted in Québec; this supportive document was immensely helpful towards incorporating the results of Québec studies into the status report. Teresa would also like to thank Ontario Nature for taking the time to provide a detailed records summary for this species per ecoregion. She also extends thanks to MMM Group Ltd. for allowing her to pursue this contract and for providing in-kind funds towards its completion. Lastly, Teresa would like to gratefully acknowledge the Quebec Turtle Recovery Team, Dr. Jackie Litzgus, Dr. Ron Brooks, Joe Crowley and Scott Gillingwater for providing extensive information, commentary and/or guidance in preparing this report.
Jeffie McNeil would like to thank the Nova Scotia Blanding’s Turtle Recovery Team for their advice and support in developing this report and preparing the threats calculator. She would also like to acknowledge the many volunteers, students, interns and staff who contributed to Blanding’s turtle research and recovery over the years; their data was invaluable in preparing this report.
Last but not least, Teresa and Jeffie would like to acknowledge Tom Herman, Terry Power and Brian Eaton for preparing the initial 1993 COSEWIC status report on the Blanding’s Turtle in Canada as well as Chris Edge and Steve Jones for writing the 2005 update status report. These previous reports provided the basis for the 2015 update status report.
Authorities contacted
Algar, Dave
Resource Conservation Manager (retired)
Parks Canada
Maitland Bridge, NS
Andrews, Carolyn
Permits and Agreements Analyst
Species At Risk Branch
Ontario Ministry of Natural Resources and Forestry
Peterborough, ON
Barkley, Erica
Assistant Ecologist
Ontario Parks - Southeast Zone
Kingston, ON
Baxter-Gilbert, James
Ph.D. Candidate
Department of Biological Sciences
Macquarie University
Sydney, Australia
Bennett, Amanda
Post-doctoral Researcher
Integrative Wildlife Conservation Lab
Trent University
Peterborough, ON
Benvenuti, Jodi
Management Biologist
Ontario Ministry of Natural Resources and Forestry
Midhurst, ON
Bernier, Pierre-André
Biologiste
Équipe de rétablissement des tortues du Québec
Québec, QC
Blaney, Sean
Botanist / Assistant Director
Atlantic Canada Conservation Data Centre
Sackville, NB
Blouin-Demers, Gabriel. Ph.D.
Professeur titulaire de biologie
Université d’Ottawa
Ottawa, ON
Boates, Sherman
Wildlife Manager, Biodiversity
Wildlife Division, NS Department of Natural Resources
Kentville, NS
Brdar, Corina
Zone Ecologist
Ontario Ministry of Natural Resources and Forestry
Southeast Parks Zone
Kingston, ON
Brooks, Ron
Professor Emeritus
University of Guelph
Guelph, ON
Brownell, Vivian
Senior SAR Biologist
Ontario Ministry of Natural Resources and Forestry
Species At Risk Recovery Section
Peterborough, ON
Cairns, Melody
Zone Ecologist
Ontario Ministry of Natural Resources and Forestry
Southwest Parks Zone
London, ON
Cameron, Graham
Management Biologist
Ontario Ministry of Natural Resources and Forestry
Bancroft, ON
Carstairs, Sue
Executive and Medical Director
Kawartha Turtle Trauma Centre
Peterborough, ON
Churchill, James
Data Manager
Atlantic Canada Conservation Data Centre
Sackville, NB
Clapp, Diane
Volunteer
Smith’s Cove, NS
Clapp, Harold
Volunteer
Smith’s Cove, NS
Copeland, Todd
Species At Risk Specialist
Northeast Regional Resources Section
Ontario Ministry of Natural Resources and Forestry
Timmins, ON
Crowley, Joe
Herpetology Species at Risk Specialist
Species at Risk Branch
Ontario Ministry of Natural Resources and Forestry
Peterborough, ON
Crowley, Megan
Resource Management Officer
Parks Canada
Maitland Bridge, NS
Davy, Christina
Liber Ero Postdoctoral Fellow
Natural Resources DNA Profiling & Forensic Centre
Trent University
Peterborough, ON
Desroches, Jean-François
Biologiste
Enseignant en techniques de Bioécologie
Cégep de Sherbrooke
Sherbrooke, QC
Dubois, Yohann
Coordonnateur dossiers amphibiens et reptiles
Direction de la biodiversité et des maladies de la faune
Ministère des Forêts, de la Faune et des Parcs, secteur Faune et Parcs
Québec, QC
Edge, Chris
Post-doctoral Fellow
University of Toronto
Toronto, ON
Elderkin, Mark
Species at Risk Biologist
Wildlife Division, NS Department of Natural Resources
Kentville, NS
Feltman, Josh
Course Instructor
Sir Sandford Fleming College
Lindsay, ON
Fortin, Gabrielle
Species at Risk Recovery Biologist
Canadian Wildlife Service
Environment Canada
Québec, QC
Frech, Troy
Volunteer
Granville Centre, NS
Gauthier, Isabelle
Biologiste
Coordinatrice provinciale, espèces fauniques menacées et vulnérables
Ministère des Forêts, de la Faune et des Parcs
Québec, QC
Giguère, Sylvain
Species at Risk Biologist
Canadian Wildlife Service
Environment Canada
Québec, QC
Gillingwater, Scott
Species at Risk Biologist
Upper Thames River Conservation Authority
London, ON
Gray, Colin
Volunteer
Lunenburg, NS
Gould, Ron
Protected Areas Specialist
Ontario Ministry of Natural Resources and Forestry
Southwest Parks Zone
London, ON
Green, Norm
Volunteer
Hammonds Plains, NS
Green, Sue
Volunteer
Hammonds Plains, NS
Hathaway, Jeff
Owner/Operator
Scales Nature Park
Orillia, ON
Herman, Tom
Professor and Vice President Academic
Acadia University
Wolfville, NS
Jeremy, Sarah
SAR Assistant Coordinator
Kespukwitk Mi’kmaw Communities, NS
Joudry, Shalan
SAR Project Manager
Kespukwitk Mi’kmaw Communities, NS
Kingston, Steve
Zone Ecologist
Ontario Ministry of Natural Resources and Forestry
Northwest Parks Zone
Thunder Bay, ON
Keevil, Matt
Ph.D. Candidate
Department of Biology
Laurentian University
Sudbury, ON
Kruschenske, Lauren
Species at Risk Biologist
Ministry of Natural Resources
Pembroke, ON
Litzgus, Jacqueline
Professor
Department of Biology
Laurentian University
Sudbury, ON
Mackenzie, Alistair
Natural Heritage Education & Resource Management Supervisor
Ontario Parks
Grand Bend, ON
Markle, Chantal
Ph.D. Candidate
McMaster University
Hamilton, ON
Marks, Steve
Species At Risk Reptile Specialist
AMEC Foster-Wheeler
Windsor, ON
McCarthy, Chris
Resource Conservation Manager
Parks Canada
Maitland Bridge, NS
McCracken, Jon
Director of National Programs
Bird Studies Canada
Port Rowan, ON
McKnight, Julie
Biologist, Species at Risk Recovery
Canadian Wildlife Service, Environmental Stewardship Branch
Dartmouth, NS
Millar, Catherine
Course Instructor
Collège La Cité
Ottawa, ON
Miller, Victor
Conservation Officer/ Intelligence, Investigations Specialist
Special Investigations Services Unit
Enforcement Branch
Ontario Ministry of Natural Resources
Peterborough, ON
Mockford, Steve
Associate Professor
Biology Department, Acadia University
Wolfville, NS
Morin, Ryan
Species At Risk Biologist
Burlington, ON
Morris, Edward
Zone Ecologist
Ontario Ministry of Natural Resources and Forestry
Northeast Zone
Sudbury, ON
Nantel, Patrick
Conservation Biologist
Species at Risk Program
Ecological Integrity Branch
Parks Canada
Gatineau, QC
Nernberg, Dean
D Env S 4
Species at Risk Officer
Director General of Environment
Directorate of Environmental Stewardship
National Defence Headquarters
Ottawa, ON
O’Grady, Sally
Information Management Specialist
Parks Canada
Maitland Bridge, NS
Oldham, Michael
Botanist/Herpetologist
Ontario Natural Heritage Information Centre (NHIC)
Ontario Ministry of Natural Resources and Forestry
Peterborough, ON
Paquet, Annie
Technicienne de la faune
Direction de la biodiversité et des maladies de la faune
Direction générale de l’expertise sur la faune et ses habitats
Ministère des Forêts, de la Faune et des Parcs
Québec, QC
Patterson, James
Ph.D. Candidate
Department of Biology
University of Ottawa
Ottawa, ON
Phillips, Julia
Adopt-A-Pond Coordinator
Toronto Zoo
Toronto, ON
Pulfer, Tanya
Conservation Science Manager
Ontario Nature
Toronto, ON
Rasmussen, Megan
A/Sudbury Area Biologist
Ontario Ministry of Natural Resources and Forestry
Sudbury, ON
Riley, Julia, PhD Candidate
Department of Biological Sciences
Macquarie University
Sydney, Australia
Robinson, Jeff
Protected Areas Co-ordinator
Environment Canada
Canadian Wildlife Service
London, ON
Robinson, Suzanne
Species At Risk Biologist
Ontario Ministry of Natural Resources and Forestry
Midhurst, ON
Rouleau, Sébastien
Research and Conservation Coordinator
Zoo Ecomuseum
St-Lawrence Natural History Society
Ste-Anne-de-Bellevue, QC
Rouse, Jeremy
Species At Risk Biologist
Ontario Ministry of Natural Resources and Forestry
Parry Sound, ON
Salo, John
Zone Manager
Ontario Ministry of Natural Resources and Forestry
Southwest Parks Zone
London, ON
Sam, Donald
Wildlife Biologist
Western Region, NS Department of Natural Resources
Lunenburg, NS
Seburn, David
Ecological Consultant
Seburn Ecological Services
Ottawa, ON
Sheppard, Anna
Assistant Zone Ecologist
Ontario Parks, Northeast Zone
Ontario Ministry of Natural Resources and Forestry
Sudbury, ON
Steinberg, Brad
Management Biologist
Ontario Ministry of Natural Resources and Forestry
Algonquin Park, ON
Taylor, Shawn
Aquatic Biologist
Dillon Consulting Limited
Oakville, ON
Tessier, Nathalie
Species At Risk Coordinator
Ministère des Forêts, de la Faune et des Parcs
Montreal, QC
Thompson, Shaun
District Ecologist,
Ontario Ministry of Natural Resources and Forestry
Kemptville, Ontario
Toms, Brad
Wildlife Biologist
Mersey Tobeatic Research Institute
Kempt, NS
Toussaint, Daniel
Biologiste
Direction de la gestion de la faune de l’Outaouais
Ministère des Forêts, de la Faune et des Parcs
Gatineau, QC
Urquhart, John
Ecologist/Principal
Blazing Star Environmental
Oshawa, ON
Woods, Sarah
Research Manager
Junction Creek Stewardship Committee
Sudbury, ON
Information sources
Andrews, C., pers. comm. 2014. Email correspondence to T. Piraino. December 2014. Permits & Agreements Analyst, Species At Risk Branch, Ontario Ministry of Natural Resources and Forestry, Government of Ontario, Peterborough, Ontario.
Anthonysamy, W.J.B., M.J. Dreslik, M.R. Douglas, N.K. Marioni and C.A. Phillips. 2014. Reproductive ecology of an endangered turtle in a fragmented landscape. Copeia 2014(3):437-446.
Arnold, G. W., D.E. Steven, J.R. Weeldenburg, and E.A. Smith. 1993. Influences of remnant size, spacing pattern and connectivity on population-boundaries and demography in Euros macropus-robustus living in a fragmented landscape. Biological Conservation, 64: 219-230.
Arsenault, L. 2011. Headstarting Blanding’s turtles (Emydoidea blandingii) in Nova Scotia: an investigation of artificial incubation, captive-rearing and release to natural habitats. MSc thesis. Acadia University, Wolfville, NS. 90pp.
Ashenden, J.E. 1983. Honours B.Sc. Thesis, University of Waterloo, Waterloo, Ontario, Canada. 54 pp.
Ashley, E.P. and J.T. Robinson. 1996. Canadian Field Naturalist. 110:403-412.
Ashley, P.E., A. Kosloski, and S.A. Petrie. 2007. Incidence of intentional vehicle-reptile collisions. Human Dimensions of Wildlife 12:137-143.
Avery, H.W., J.R. Spotila, J.D. Congdon, R.U. Fischer, E.A. Standora and S.B. Avery 1993. Roles of diet protein and temperature in the growth and nutritional energetics of juvenile slider turtles, Trachemys scripta. Physiological Zoology 66: 902-925.
Badzinkski, S., S. Proracki, S. Petrie, and D. Richards. 2008. Changes in the distribution and abundance of common reed (Phragmites australis) between 1999 and 2006 in marsh complexes at Long Point - Lake Erie. Report submitted to the OMNRF. 19 pp.
Baxter-Gilbert, J.H. 2014. The long road ahead: understanding road-related threats to reptiles and testing if current mitigation measures are effective at minimizing impacts. M.Sc. Thesis. Laurentian University. Sudbury, Ontario, Canada. 96 pp.
Baxter-Gilbert, J.H., J.L. Riley and J.D. Litzgus. 2013. Chrysemys picta marginata (Midland Painted Turtle) and Emydoidea blandingii (Blanding’s Turtle): Hatchling mortality. Herpetological Review 44(2): 303-304.
Beaudry, F., P.G. DeMaynadier and M.L. Hunter Jr. 2010. Nesting movements and the use of anthropogenic nesting sites by Spotted Turtles (Clemmys guttata) and Blanding’s Turtles (Emydoidea blandingii). Herpetological Conservation and Biology 5(1): 1-8.
Beaudry, F., P.G. DeMaynadier, and M.L. Hunter Jr. 2009. Seasonally dynamic habitat use by Spotted (Clemmys guttata) and Blanding’s Turtles (Emydoidea blandingii) in Maine. Journal of Herpetology 43(4): 636-645.
Beckett, J. 2006. Genetic analysis of multiple paternity and male reproductive success in a small peripheral population of Blanding’s turtle, Emydoidea blandingii. MSc thesis. Acadia University, Wolfville, NS, Canada. 44pp.
Bennett, B.A. pers. comm. 2016. COSEWIC Vascular Plants Co-chair.
Bernier, P.A. 2013. Localisation et caractérisation des habitats essentiels de la tortue mouchetée – Rapport des travaux de 2012. Conservation de la nature Canada, pour la Commission de la capitale nationale. 28 pp. and 5 appendixes.
Bernier, P.A. 2014. Report on various aspects of studies and reports on Blanding’s Turtle in Québec in the context of the preparation of a COSEWIC Status Report. Report prepared for COSEWIC. 52 pp.
Bernier, P.A., pers. comm. 2014. Email correspondence to T.Piraino. Biologiste, Équipe de rétablissement des tortues du Québec. Québec, Québec.
Bishop, C.A., R.J. Brooks, J.H. Carey, P. Ng, R.J. Norstrom and D.R.S. Lean. 1991. The case for a cause-effect linkage between environmental contamination and development in eggs of the Common Snapping Turtle Chelydra serpentina from Ontario, Canada. Journal of Toxicology and Environmental Health 33:512-547.
Bishop, C.A., P. Ng, K.E. Pettitt, S.W. Kennedy, J.J. Stegeman, R.J. Norstrom and R.J. Brooks. 1998. Environmental contamination and developmental abnormalities in eggs and hatchlings of the common Snapping Turtle (Chelydra serpentina serpentina) from the Great Lakes-St. Lawrence River basin (1989-91). Environmental Pollution 101: 143-156.
Bleakney, J.S. 1958. A Zoogeographical Study of the Amphibians and Reptiles of Eastern Canada. National Museum of Canada Bulletin No. 155. 119pp.
Bolton, R.M. and R.J. Brooks. 2010. Impact of the seasonal invasion of Phragmites australis (Common Reed) on turtle reproductive success. Chelonian Conservation and Biology 9(2): 238-243.
Bolton, R.M., S.A. Marshall and R.J. Brooks. 2008. Opportunistic exploitation of turtle eggs by Tripanurga importuna (Walker) (Diptera: Sarcophagidae). Canadian Journal of Zoology 86:151-160.
Bolton, R.M., pers. comm. 2015. Email correspondence to T.Piraino. October 2015. Conservation Biologist, The Art of Conservation, Bradford, Ontario.
Bonin, J., J.-L. DesGranges, C.A. Bishop, J. Rodrigue, A. Gendron and J.E. Elliot. 1995. Comparative study of contaminants in the mudpuppy (Amphibia) and the common snapping turtle (Reptilia), St. Lawrence River, Canada. Archives of Environmental Contamination and Toxicology 28: 184-194.
Bourque, G. 2006. Investigating variables affecting Blanding’s turtle (Emydoidea blandingii) patch occupancy and trapping success in Nova Scotia. MSc thesis. Acadia University, Wolfville, NS. 78pp.
Bourque, G., T. Herman and J. McNeil. 2006. Nova Scotia Blanding’s turtle (Emydoidea blandingii) PVA: history and development. Presentation to the Blanding’s turtle recovery team. March 2006.
Boyle, S., pers. comm. 2014. Email correspondence to T. Piraino. September 2014. Ph.D. candidate, Laurentian University, Sudbury, Ontario.
Brooks, R.J., D.A. Galbraith, E.G. Nancekivell and C.A. Bishop. 1988. Developing management guidelines for Snapping Turtles. In R.C. Szaro, K.E. Severson and R. David ton (eds.), Management of Amphibians, Reptiles and Small Mammals in North America; Proceedings of the symposium, pp. 174-179. U.S. Dept. agriculture Forest Service. Gen. Tech. Rep. RM-166.
Brooks, R.J., M.L. Bobyn, D.A. Galbraith, J.A. Layfield and E.G. Nancekivell. 1991a. Maternal and environmental influences on growth and survival of embryonic and hatchling snapping turtles (Chelydra serpentina). Canadian Journal of Zoology 69: 2667-2676.
Brooks, R.J., G.P. Brown, and D.A. Galbraith. 1991b. Effects of a sudden increase in natural mortality of adults on a population of the Common Snapping Turtle (Chelydra serpentina). Canadian Journal of Zoology 69:1314-1320.
Brooks, R.J., D. Strickland, and R.J. Russell. 2003. Reptiles and Amphibians of Algonquin Provincial Park. The Friends of Algonquin Park. 48 pp.
Brooks, R.J., pers. comm. 2014. Email correspondence to T. Piraino. May and September 2014. Professor Emeritus, University of Guelph, Ontario.
Browne, C.L. 2003. M.Sc. Thesis, Lakehead University, Thunder Bay, Ontario, Canada. 122 pp.
Browne, C.L. and S.J. Hecnar. 2007. Species loss and shifting population structure of freshwater turtles despite habitat protection. Biological Conservation 138: 421-429.
Bulté, G., M. Carrière and G. Blouin-Demers. 2010. Impact of recreational power boating on two populations of Northern Map Turtles (Graptemys geographica). Aquatic Conservation: Marine and Freshwater Ecosystems 20: 31-38.
Camaclang, A. 2007. Science, management and policy in conservation biology: protecting post-emergent hatchling Blanding’s turtles in Nova Scotia. MES Thesis. Dalhousie University, Halifax, NS.
Carrière, M.A., N. Rollinson, A.N. Suley and R.J. Brooks. 2008. Thermoregulation when the growing season is short: sex-biased basking patterns in a northern population of painted turtles (Chrysemys picta). Journal of Herpetology 42: 206–209.
Carstairs, S. 2014. Direct mitigation of threats to At-Risk turtles at a road mortality hotspot. Final report submitted to the Species at Risk Stewardship Fund. 7 pp.
Catling, P.M. and G. Mitrow. 2011. The recent spread and potential distribution of Phragmites australis in Canada. The Canadian Field-Naturalist 125: 95-104.
Caverhill, B. 2003. BSc. Honours Thesis. Acadia University, Wolfville, NS.
Caverhill, B. 2006. Blanding’s turtle conservation in Nova Scotia: Linking science and stewardship through public education. MSc. Thesis. Acadia University, Wolfville, NS.
Caverhill, B., B. Johnson, J. Phillips, E. Nadeau, M. Kula and R. Holmes. 2011. Report to Environment Canada and the Ministry of Natural Resources. 92 pp.
Christensen, R.J. 2013. The movement patterns and home ranges of Blanding’s Turtles (Emydoidea blandingii) in two protected areas in Ontario Canada. M.Sc. Thesis. McMaster University, Hamilton, Ontario, Canada. 94 pp.
Christensen, R.J. and P. Chow-Fraser. 2014. Use of GPS loggers to enhance radio-tracking studies of freshwater turtles. Herpetological Conservation and Biology 9: 18-28.
CITES (Convention on the International Trade in Endangered Species). 2013. Sixteenth meeting of the Conference of Parties: Proposals for Amendment of Appendices I and II. fdfdf [accessed March 2013].
Congdon, J.D. and R.C. van Loben Sels. 1991. Growth and body size in Blanding’s turtles (Emydoidea blandingi): relationships to reproduction. Canadian Journal of Zoology 69:239-245.
Congdon, J.D. and R.C. van Loben Sels. 1993. Relationships of reproductive traits and body size with attainment of sexual maturity and age in Blanding’s turtles (Emydoidea blandingii). Journal of Evolutionary Biology 6:547-557.
Congdon, J.D., A.E. Dunham and R.C. van Loben Sels. 1993. Delayed sexual maturity and demographics of Blanding’s Turtles (Emydoidea blandingii): Implications for conservation and management of long-lived organisms. Conservation Biology 7:826-833.
Congdon, J.D., A.E. Dunham and R.C. van Loben Sels. 1994. Demographics of common Snapping Turtles Chelydra serpentina: Implications for conservation and management of long-lived organisms. American Zoologist 34:397-408.
Congdon, J.D., D.W. Tinkle, G.L. Breitenbach and R.C. van Loben Sels. 1983. Nesting ecology and hatching success in the turtle Emydoidea blandingii. Herpetologica. 39:417-429.
Congdon, J.D., O.M. Kinney and R.D. Nagle. 2011. Spatial ecology and core-area protection of Blanding’s Turtle (Emydoidea blandingii). Canadian Journal of Zoology 89:1098-1106.
Congdon, J.D., R.D. Nagel, O.M. Kinney and R.C. van Loben Sels. 2001. Hypotheses of aging in a long-lived vertebrate, Blanding’s Turtle (Emydoidea blandingii). Experimental Gerontology 36:813-827.
Congdon, J.D., R.D. Nagel, O.M. Kinney, M. Osentoski, H.W. Avery, R.C. van Loben Sels, and D.W. Tinkle. 2000. Nesting ecology and embryo mortality: Implications for hatchling success and demography of Blanding’s Turtles (Emydoidea blandingii). Chelonian Conservation and Biology 3:569-579.
Congdon, J.D., T.E. Graham, T.B. Herman, J.W. Lang, M.J. Pappas and B.J. Brecke. 2008. Emydoidea blandingii (Holbrook 1838) Blanding’s turtle. In: Rhodin, A.G.J., P.C.H. Pritchard, P.P van Dijk, R.A. Saumure, K.A. Buhlmann, and J.B. Iverson. (Eds.). Conservation Biology of Freshwater Turtles and Tortoises: A Compilation Project of the IUCN/SSC Tortoise and Freshwater Turtle Specialist Group. Chelonian Research Monographs No. 5, pp. 015.1-015.12
Crother, B. I. (ed.). 2012. Scientific and standard English names of amphibians and reptiles of North America North of Mexico, with comments regarding confidence in our understanding. 7th Edition. Herpetological Circulars. Society for the Study of Amphibians and Reptiles, St. Louis, Missouri.
Crowley, J.F. and R.J. Brooks. 2005. Protected areas and the conservation of Ontario’s Reptile Species at Risk: Safe havens or false hopes? Proceedings of the Parks Research Forum of Ontario, pp. 139-152.
Davy, C.M., P.H. Bernardo and R.W. Murphy. 2014. A Bayesian approach to conservation genetics of Blanding’s Turtle (Emys blandingii) in Ontario, Canada. Conservation Genetics 15:319-330.
Davy, C.M., pers. comm. 2014. Email correspondence to T. Piraino. April 2014. Liber Ero Postdoctoral Fellow, Trent University. Peterborough, Ontario.
Déry, J. F. 2014. Résumé des activités effectuées en vertu du permis 2013-03-13-024-08-SF. En collaboration avec les premières nations Anishinabeg de Lac Simon, Kitcisakik et Timiskaming, Québec. Rapport présenté à la Direction de l’expertise Énergie-Faune-Forêts-Mines-Territoire de l’Abitibi-Témiscamingue, Ministère des Ressources naturelles, Québec. 13 pp.
Déry, J.F. 2015. Rapport de campagne de recherche de la tortue mouchetée (Emydoidea blandingii) – Été 2014. En collaboration avec le Conseil de la Nation Anishinabe du Lac Simon. Rapport présenté à Tourbières Berger, Ltée. 18 pp.
de Solla S.R, K.J. Fernie and S. Ashpole 2008. Snapping Turtles Chelydra serpentina as bioindicators in Canadian Areas of Concern in the Great Lakes Basin. II. Changes in hatching success and hatchling deformities in relation to persistent organic pollutants. Environmental Pollution 153: 529-536.
Desroches, J.F. and I. Picard. 2005. Mortalité des tortues sur les routes de l’Outaouais. Le Naturaliste Canadien. 129: 35-41.
Dillon Consulting. 2014. Blanding’s Turtle population estimate, distribution and range study, 2013 Year 4 of 4; Final Summary. Report submitted to the City of Ottawa. 121 pp.
Dubois, Y. 2009. Conservation de la nature Canada, pour la Commission de la capitale nationale. 56 pp.
Dubois, Y., Blouin-Demers, G., Shipley, B. and Thomas, D. 2009. Thermoregulation and habitat selection in Wood Turtles Glyptemys insculpta: chasing the sun slowly. Journal of Animal Ecology, 78: 1023-1032.
Dubois, Y., A. Orjikh and S. Pelletier. 2011. Conservation de la nature Canada, pour la Commission de la capitale nationale. 31 pp + 6 appendixes.
Dubois, Y., G. Fortin and S. Pelletier. 2012. Conservation de la nature Canada, pour la Commission de la capitale nationale. 71 pp. + 7 appendixes.
Dubois, Y., pers. comm. 2014. Email correspondence to T.Piraino. Biologiste, Ministère des Forêts, de la Faune et des Parcs. Québec, Québec.
Ducks Unlimited Canada. 2010. Southern Ontario wetland conversion analysis: final report. Ducks Unlimited. Barrie, Ontario. 23 pp.
Duclos, I. and J. Fink. 2013. Rapport final. 55 pp + 9 appendixes.
Edge, C. B., B.D. Steinberg, R.J. Brooks, and J.D. Litzgus. 2009. Temperature and site selection by Blanding’s turtles (Emydoidea blandingii) during hibernation near the species’ northern range limit. Canadian Journal of Zoology 87:825-834.
Edge, C. B., B.D. Steinberg, R.J. Brooks, and J.D. Litzgus. 2010. Habitat selection by Blanding’s turtles (Emydoidea blandingii) in a relatively pristine landscape. Ecoscience 17:90-99.
Ennen, J.R., J.E. Lovich., K.P. Meyer, C. Bjurlin and T.R. Arundel. 2012. Nesting Ecology of a Population of Gopherus agassizii at a Utility-Scale Wind Energy Facility in Southern California. Copeia 2012: 222-228.
Enneson, J.J. and J.D. Litzgus. 2009. Stochastic and spatially explicit population viability analyses for an endangered freshwater turtle, Clemmys guttata. Canadian Journal of Zoology 87: 1241-1254.
Enneson, J.J. 2009. Report submitted to the Canadian Wildlife Service. 35 pp.
Environment Canada and Ontario Ministry of Natural Resources. 2003. The Ontario Great Lakes Coastal Wetland Atlas: A Summary of Information (1983-1997).
Environment Canada and United States Environmental Protection Agency. 2008. Lake Erie Lakewide Management Plan Updated April 2008. Prepared for the Governments of Canada and the United States of America.
Environment Canada. 2016. Recovery strategy for the Blanding’s Turtle (Emydoidea blandingii) Great Lakes/St. Lawrence population in Canada [Proposed]. Species at Risk Act recovery strategy series. Environment Canada, Ottawa, vii + 49 pp.
Équipe de rétablissement des tortues du Québec, données non publiées. Données de captures récoltées dans le cadre du projet «Cartographie des habitats essentiels et identification des menaces au maintien des populations de tortues mouchetées – phase II». Printemps 2009 et 2010.
Ernst, C.H. and J.E. Lovich. 2009. Turtles of the United States and Canada, 2nd Edition. The Johns Hopkins University Press, Baltimore, Maryland. 827 pp.
Feldman C.R., and Parham J.F. 2002. Molecular phylogenetics of Emydine Turtles: Taxonomic revision and the evolution of shell kinesis. Molecular Phylogenetics and Evolution 22:388-398.
Fenech, A., B. Taylor, R. Hansell and G. Whitelaw. 2001. Major Road Changes in Southern Ontario 1935 – 1995: Implications for Protected Areas. Pp. 365-383, in S. Bondrup-Nielsen, N.W.P. Munro, G. Nelson, J.H.M. Willison, T.B. Herman, and P.F.J. Eagles (eds.). Proceedings of the Fourth International Conference on the Science and Management of Protected Areas, University of Waterloo, Waterloo, Ontario, Canada.
Fortin G., G. Blouin-Demers and Y. Dubois. 2012. Landscape composition weakly affects home range size in Blanding’s turtles (Emydoidea blandingii). Écoscience 19:191-197.
Fortin, G. and Y. Dubois. 2010. Cartographie des habitats essentiels et identification des menaces au maintien des populations de tortues mouchetées – phase I, Rapport d’étape - Résultats préliminaires suite à la première année des travaux de terrain. Conservation de la nature Canada, pour la Commission de la capitale nationale. 35 pp + 6 appendixes.
Garbary, D.J., G. Bourque, T.B. Herman, and J.A. McNeil. 2007. Epizoic algae from freshwater turtles in Nova Scotia. Journal of Freshwater Ecology 22:677-685.
Garber, S.D. and J. Burger. 1995. A 20-yr study documenting the relationship between turtle decline and human recreation. Ecological Applications 5:1151-1162.
Garrot, R., P. White and C. Vanderbilt White. 1993. Overabundance: An issue for conservation biologists? Conservation Biology 7:946-949.
Gibbs, J. and D. Steen. 2005. Trends in sex ratios of turtles in the United States: implications of road mortality. Conservation Biology 19:552-556.
Gibbs, J.P and W.G. Shriver. 2002. Estimating the effects of road mortality on turtle populations. Conservation Biology 16: 1647-1652.
Giguère, S., pers. comm. 2014. Email correspondence to T. Piraino. November 2014. Species At Risk Biologist, Canadian Wildlife Service, Québec.
Gilbert, J.M. 2012. Phragmites australis Management in Ontario. Presentation at the 6th Bi-national Lake St. Clair Conference. November 29, 2012.
Gilbert, J.M., pers. comm. 2013. Email correspondence to T. Piraino. November 2013. Wetland Ecologist, Langton, Ontario.
Gillingwater, S.D. 2009. Unpublished report submitted to Ontario Ministry of Natural Resources, Lake Erie Management Unit. 20 pp.
Gillingwater, S.D. 2013. Unpublished report submitted to Canadian Wildlife Service. 48 pp.
Gillingwater, S.D. and R.J. Brooks. 2001. Report to Endangered Species Recovery Fund (WWF). 94 pp.
Gillingwater, S.D. and T.J. Piraino. 2002. Final report submitted to the Endangered Species Recovery Fund. 48 pp.
Gillingwater, S.D. and T.J. Piraino. 2004. Final report submitted to the Canadian Wildlife Service. 65+pp.
Gillingwater, S.D. and T.J. Piraino. 2007. Final report submitted to the Canadian Wildlife Service. 32pp.
Gillingwater, S.D., pers. comm. 2014. Email and verbal correspondence to T. Piraino. Many dates in 2014. Species At Risk Biologist, Upper Thames River Conservation Authority. London, Ontario.
Government of Ontario. 2016. Environmental Registry [accessed July 2016].
Graham, T.E. 1995. Habitat use and population parameters of the spotted turtle, Clemmys guttata, a species of special concern in Massachusetts. Chelonian Conservation and Biology 1: 207-214.
Great Lakes Wetlands. 2011. Great Lakes Wetlands: Wetland Inventories
Green, N., pers. comm. 2014. Email correspondence to J. McNeil. December 2014. Blanding’s Turtle Recovery Team member and volunteer nest protection coordinator. Hammonds Plains, NS.
Green. N. and J. McNeil. 2014. Updating the Population Viability Analysis model for Blanding’s turtles in Nova Scotia. Unpublished report to Parks Canada, March 2014. 13 pp.
Harding, J. H. 1997. Amphibians and Reptiles of the Great Lakes Region. University of Michigan, Ann Arbor, MI. 378 pp.
Harding J.H., and Davis S.K. 1999. Clemmys insculpta (Wood Turtle) and Emydoidea blandingii (Blanding’s Turtle) hybridization. Herpetological Review. 30: 225-226.
Hartwig, T. S. 2004. Habitat selection of Blanding’s turtle (Emydoidea blandingii): a range-wide review and microhabitat study. MSc thesis. Bard College. Annandale-on-Hudson, New York. 127pp.
Heppell, S.S. 1998. Application of life-history theory and population model analysis to turtle conservation. Copeia 1998:367-375.
Her Majesty the Queen, in Right of Canada. 2014. The Canada Gazette, Part 1, May 3, 2014. 148 (18): 1116.
Herman, T.B. and F.W. Scott. 1992. Global changes at the local level: assessing the vulnerability of vertebrate species to climatic warming. Pages 353-367 in J.M.H. Willison, S. Bondrup-Nielsen, C.D.Drysdale, T.B. Herman, N.W.P Munro, and T.L. Pollocks (eds.). Science and Management of Protected Areas. Developments in Landscape Management and Urban Planning Series. Elsevier, Amsterdam.
Herman, T.B., J.A. McNeil and D.D. Hurlburt. 2004. Blanding’s turtle population viability analysis (PVA): Development and application of a stage-classified transition matrix. Final Report to Parks Canada SARRAEF 03- KEJ03-004, October 2004. 25 pp.
Herman, T.B., J.S. Boates, C. Drysdale, S. Eaton, J. McNeil, S. Mockford, E. Alcorn, S. Bleakney, M. Elderkin, J. Gilhen, C. Jones, J. Kierstead, J. Mills, I. Morrison, S. O’Grady, D. Smith. 2003. National Recovery Plan for the Blanding’s Turtle (Emydoidea blandingii) Nova Scotia Population. January 2003. 63 pp.
Herman, T.B., pers. comm. 2015.Email correspondence to J. McNeil. September 2015. Blanding’s Turtle Recovery Team Co-Chair, Acadia University, Wolfville, Nova Scotia.
Herman, T.B., T.D. Power, and B.R. Eaton. 1995. Status of Blanding’s Turtles, Emydoidea blandingii, in Nova Scotia, Canada. Canadian Field-Naturalist. 109: 182-191.
Howes, B., J. Brown, L.Gibbs, T. Herman, S. Mockford, K. Prior, and P. Weatherhead. 2009. Directional gene flow in disjunct populations of the black ratsnake (Pantheropis obsoletus) and the Blanding’s turtle (Emydoidea blandingii). Conservation Genetics 10:407-417.
Howey, A.F. and S.A. Dinkelacker. 2013. Characteristics of a historically harvested Alligator Snapping Turtle (Macrochelys temminckii) population. Copeia 1: 58-63.
Hubbs, F.T. 1979. Unpublished report to the Canadian Wildlife Service. London, Ontario. 44p.
Hutchison, V.H., A. Vinegar and R.J. Kosh. 1966. Critical thermal maxima in turtles. Herpetologica 22:32-41.
International Joint Commission. 2014. A Balanced Diet for Lake Erie: Reducing Phosphorous Loadings and Harmful Algal Blooms. Report of the Lake Erie Ecosystem Priority.
IUCN Standards and Petitions Subcommittee. 2014. Guidelines for Using the IUCN Red List Categories and Criteria (PDF version; 1.1 MB). Version 11. Prepared by the Standards and Petitions Subcommittee.
Janzen, F.J. 1993. The influence of incubation temperature and family on eggs, embryos, and hatchlings of the Smooth Softshell Turtle (Apalone mutica). Physiological Zoology 66:349–373.
Janzen, F.J. and Morjan, C.L. 2001. Repeatability of microenvironment-specific nesting behaviour in a turtle with environmental sex determination. Animal Behaviour 62:73–82.
Jodoin, Y., C. Lavoie, P. Villeneuve, M. Theriault, J. Beaulieu, and F. Belzile. 2008. Highways as corridors and habitats for the invasive common reed Phragmites australis in Quebec, Canada. Journal of Applied Ecology 45:459-466.
Keevil, M.G., Brooks, R.J., Litzgus, J.D. 2015. Patterns of long-term abundance and survival of a long-lived vertebrate before and after a population catastrophe. in prep.
Keevil, M.G., pers. comm. 2014. Email correspondence to T. Piraino. October 2014. Ph.D. Candidate, Department of Biology, Laurentian University, Sudbury, ON.
King, R.B. and M.L. Niiro. 2013. Predicting climate-change induced distributional shifts in Great Lakes region reptiles. Ilinois Department of Natural Resources. 76 pp.
Kiviat, E. 1978b. Vertebrate use of muskrat lodges and burrows. Estuaries 1:196-200.
Knudson, B., pers. comm. 2004. Email correspondence to C. Edge and S. Jones. Technician, Ontario Ministry of Natural Resources, Algoma District, Sault-Ste-Marie, Ontario.
Kofron, C.P., and A.A. Schreiber. 1985. Ecology of two endangered aquatic turtles in Missouri: Kinosternon flavescens and Emydoidea blandingi. Journal of Herpetology 19: 27-40.
Koper, N. and R.J. Brooks. 2000. Environmental Constraints on Growth of Painted Turtles (Chrysemys picta) in Northern Climates. Herpetologica, 56: 421-432.
Kruschenske, L., pers. comm. 2014. Email correspondence to T. Piraino. September 2014. Species At-Risk Biologist, Ontario Ministry of Natural Resources and Forestry, Pembroke District, Ontario.
Kydd, P. 2010. Movement rates, movement patterns and home ranges of endangered Blanding’s turtles (Emydoidea blandingii) in Nova Scotia. MSc thesis. Acadia University, Wolfville, NS, Canada. 110pp.
Lake Erie LaMP. 2011. Lake Erie Binational Nutrient Management Strategy: Protecting Lake Erie by Managing Phosphorus. Prepared by the Lake Erie LaMP Work Group Nutrient Management Task Group.
Lapointe, J. and P. Fournier. 2014. Inventaire de la tortue mouchetée (Emydoidea blandingii) en Abitibi, été 2013. Direction régionale de l’abitibi-Témiscamingue, Secteur de la faune, ministère du développement durable, de l’environnement, de la faune et des parcs, Rouyn-Noranda. 11 pp and appendixes.
Lefebvre, J. 2009. Marrying Conservation and Exploitation: Combining Integrated Resource Management Plans (IRMs) and the Blanding’s Turtle (Emydoidea blandingii) to Conserve and Manage Wetland Ecosystems in Nova Scotia. MSc Thesis. Acadia University, Wolfville, NS, Canada. 86 pp.
Lefebvre, J., S.W. Mockford and T. B. Herman. 2012. Canadian Field-Naturalist 126: 89–94.
Lefebvre, J., T.S. Avery and T.B. Herman. 2011. Size dimorphism and growth rates in distinct populations of Blanding’s turtles (Emydoidea blandingii) in Nova Scotia in relation to environment. Herpetological Conservation and Biology 6:465:472.
Loveridge, A. and E.E. Williams. 1957. Revision of the African tortoises and turtles of the suborder Cryptodira. Bulletin of the Museum of Comparative Zoology Harvard 115: 163-557.
Lovich. J. 1987. The spotted turtles of Cedar Bog: historical analysis of a declining population. Cedar Bog Symposium II. Columbus (OH): Ohio Historical Society. November 1987.
Lovich, J.E., R.E. Ennen, S. Madrak, K. Meyer, C. Loughran, C. Bjurlin, T.R. Arundel, W. Turner, C. Jones and G.M. Groenendaal. 2011. Effects of wind enegry production on growth, demography and survivorship of a Desert Tortoise (Gopherus agassizii) population in southern California with comparisons to natural populations. Herpetological Conservation and Biology 6: 161-174.
MacCulloch, R. D. and W. F. Weller. 1988. Some aspects of reproduction in a Lake Erie population of Blanding’s turtle, Emvdoidea blandingii. Canadian Journal of Zoology 66: 2317-2319.
Mackenzie, A., pers. comm. 2014. Email correspondence to T. Piraino. October 2014. Natural Heritage Education and Resource Management Supervisor, Pinery Provincial Park, Ontario Parks, Grand Bend, Ontario.
Mackenzie, S., D. LeClair, A. Timpf, P. Catling and J. McCracken. 2014. Report submitted to OMNRF. 65 pp.
MacKinnon, C.A., L.A. Moore, and R.J. Brooks. 2005. Why did the reptile cross the road? Landscape factors associated with road mortality of snakes and turtles in the South Eastern Georgian Bay area. pp. 153-166 in G. Nelson, T. Nudds, M. Beveridge, and B. Dempster (eds.), Protected Areas and Species and Ecosystems at Risk: Research and Planning Challenges. Proceedings of the Parks Research Forum of Ontario (PRFO) and Carolinian Canada Coalition (CCC) Annual General Meeting May 2005, University of Guelph.
Markle, C.E. and P. Chow-Fraser. 2014a. Habitat selection by the Blanding’s Turtle (Emydoidea blandingii) on a protected island in Georgian Bay, Lake Huron. Chelonian Conservation and Biology 13: 216-226.
Markle, C.E. and P. Chow-Fraser. 2014b. Progress Report for 2014. 19 pp.
Marks, S., pers. comm. 2014. Email correspondence to T. Piraino. September 2014. Species At-Risk Biologist, AMEC Foster-Wheeler, Windsor, Ontario.
McCoy, C.J. 1973. Emydoidea, E. blandingii. Catalogue of American amphibians and reptiles. 136: 1-4.
McCracken, J., pers. comm. 2014. Email correspondence to T. Piraino. May 2014. Director of National Programs, Bird Studies Canada, Port Rowan, Ontario.
McDowell, S.B. 1964. Partition of the genus Clemmys and related problems in the taxonomy of aquatic Testudinidae. Proceedings of the Zoological Society of London 143:239-279.
McGuire, J.M., K.T. Scribner and J.D. Congdon. 2013. Spatial aspects of movements, mating patterns and nest distributions influence gene flow among population subunits of Blanding’s Turtles (Emydoidea blandingii). Conservation Genetics 14:1029-1042.
McGuire, J.M., J.D. Congdon, O.M. Kinney, M. Osentoski and K.T. Scribner. 2015. Influences on male reproductive success in long-lived Blanding’s Turtles (Emydoidea blandingii). Canadian Journal of Zoology 93:487-497.
McMaster, N.L. and T.B. Herman. 2000. Chelonian Conservation and Biology. 3: 602-610.
McNeil, J.A., T.B. Herman and K.L. Standing. 2000. Movement of hatchling Blanding’s Turtles (Emydoidea blandingii) in Nova Scotia in response to proximity to open water: a manipulative experiment. Chelonian Conservation and Biology. 3: 611-617.
McNeil, J.M. 2002. Distribution, movements, morphology and reproduction in a population of Blanding’s turtle (Emydoidea blandingii) in an unprotected landscape in southwest Nova Scotia. MSc Thesis. Acadia University, Wolfville, NS, Canada. 218 pp.
Middleton, J. 2014. Long-term reptile and amphibian research on Ontario Nature properties. Report prepared for the Environment Canada Science Horizons Youth Internship Program. 17 pp.
Millar, C. 2009. Report to Parks Canada. 25 pp.
Millar, C. and G. Blouin-Demers. 2011. Spatial ecology and seasonal activity of Blanding’s Turtles (Emydoidea blandingii) in Ontario, Canada. Journal of Herpetology 45:370-378.
Millar, C. and G. Blouin-Demers. 2012. Habitat suitability modelling for species at risk is sensitive to algorithm and scale: A case study of Blanding’s Turtle, Emydoidea blandingii, in Ontario, Canada. Journal for Nature Conservation 20:18-29.
Millar, C., J.P. Graham and G. Blouin-Demers. 2012. The effects of sex and season on patterns of thermoregulation in Blanding’s Turtles (Emydoidea blandingii) in Ontario, Canada. Chelonian Conservation and Biology 11:24-32.
Miller, V., pers. comm. 2014. Email correspondence to T. Piraino. February 2014. Conservation Officer, Ontario Ministry of Natural Resources. Peterborough, Ontario.
Mills, P., pers. comm. 2014. Email correspondence to T. Piraino. September 2014. Naturalist, Algonquin Provincial Park Museum and Visitor Centre. Nipissing District, Ontario
Ministry of Northern Development and Mines. 2014. Ontario active claims map. [accessed October 2014].
Mockford, S.W., L. McEachern, T.B. Herman, M. Snyder and J.M. Wright. 2005. Population genetic structure in a disjunct population of Blanding’s turtle (Emydoidea blandingii) in Nova Scotia, Canada. Biological Conservation 123: 373-380.
Mockford, S.W., M. Snyder and T.B. Herman. 1999. A preliminary examination of genetic variation in a peripheral population of Blanding’s Turtle, Emydoidea blandingii. Molecular Ecology 8:323-327.
Mockford, S.W., T.B. Herman, M. Snyder, and J.M. Wright. 2007. Conservation genetics of Blanding’s turtle and its application in the identification of evolutionarily significant units. Conservation Genetics 8: 209-219.
Moll, D. and E.O. Moll. 2004. The Ecology, Exploitation and Conservation of River Turtles. Oxford University Press, New York, New York, U.S.A.
Morrison, I. 1996. A study of headstarting Blanding’s Turtle (Emydoidea blandingii) hatchlings. Parks Canada – Ecosystem monitoring and data reports. Report no. 001.
Morrison, I. and J. McNeil. 2003. Development of a monitoring protocol for juvenile Blanding’s turtles (Emydoidea blandingii) in Nova Scotia. Report to Parks Canada.36pp.
Natural Heritage and Endangered Species Program. 2007. Massachusetts Forestry Conservation Management Practices for Spotted Turtles. Version 2007.1. Natural Heritage and Endangered Species Program, Massachusetts Division of Fisheries and Wildlife, Westborough, Massachusetts
NatureServe. 2014. NatureServe Explorer: An online encyclopedia of life [web application]. Version 7.1. NatureServe, Arlington, Virginia. [accessed August 2014].
NCC. 2007. Commission de la Capitale Nationale. 35 pp.
Nernberg, D., pers. comm. 2014. Email correspondence to T. Piraino. March 2014. Species at Risk officer, National Defence, Ottawa, Ontario.
Newton, E. and T. Herman. 2009. Habitat, movements and behaviour of overwintering Blanding’s Turtles (Emydoidea Blandingii) in Nova Scotia. Canadian Journal of Zoology 87: 299-309.
NHIC (Natural Heritage Information Centre) data. Data provided by the Ontario MNRF (Ministry of Natural Resources and Forestry.
Nova Scotia Blanding’s Turtle Database. 2014. Accessed September 11, 2014.
Nutting, W.L. and T.E. Graham. 1993. Preferred body temperatures in five nearctic freshwater turtles: A preliminary study. Comparative Biochemistry and Physiology Part A: Physiology 104:243–246.
Obbard, M.E. 1983. Population ecology of the common Snapping Turtle, Chelydra serpentina, in north-central Ontario. Ph.D. Dissertation, University of Guelph, Guelph, Ontario, Canada. 184 pp.
Obbard, M.E. and R.J. Brooks. 1981. Fate of overwintered clutches of the common Snapping Turtle Chelydra serpentina in Algonquin Park, Ontario. Canadian Field-Naturalist 95: 350-352.
Ontario Mining Association. 2014. Ontario mining operations map [accessed October 2014].
Ontario Nature. 2015. Campaigns: endangered species [accessed September 2015].
Ontario MNRF (Ministry of Natural Resources and Forestry). 2012. Find pits and quarries map [acessed October 2014].
Ontario MNRF (Ministry of Natural Resources and Forestry). 2013a. General Habitat Description for the Blanding’s Turtle (Emydoidea blandingii) (PDF version; 299 KB)
Ontario MNRF (Ministry of Natural Resources and Forestry). 2013b. Regulation exemption for development and infrastructure projects and endangered or threatened species [accessed July 2016].
Ontario MNRF (Ministry of Natural Resources and Forestry). 2014a. Key facts about Ontario’s forests [accessed September 2015].
Ontario MNRF (Ministry of Natural Resources and Forestry). 2014b. How to get an Endangered Species Act permit or authorization [accessed July 2016].
Ontario MNRF (Ministry of Natural Resources and Forestry). 2014c. Species at risk overall benefit permits [accessed July 2016].
Ontario MNRF (Ministry of Natural Resources and Forestry). 2016. 2016 Revisions to forest management: conserving biodiversity at the stand and site scales [accessed July 2016).
Packard, G.C. 1999. Water relations of chelonian eggs and embryos: is wetter better? Amer. Zool. 39: 289-303.
Packard, G.C., M.J. Packard and T.J. Boardman. 1982. An experimental analysis of the water relations of eggs of Blanding’s Turtles (Emydoidea blandingii). Zoological Journal of the Linnaean Society. 75: 23-34.
Parks Canada. 2010. Parks Canada, Maitland Bridge, NS, Canada. 87pp.
Parks Canada. 2012. Recovery Strategy for the Blanding’s turtle (Emydoidea blandingii), Nova Scotia population, in Canada. Species at Risk Act Recovery Strategy Series. Parks Canada, Ottawa. vii + 34 pp.
Patch, C.L., 1919. Canadian Field-Naturalist 33: 60–61.
Paterson, J.E., M. McDermott, B. Steinberg and J. Litzgus. 2011. Emydoidea blandingii (Blanding’s Turtle): Hatchling behaviour. Herpetological Review 42: 418-419.
Paterson, J.E., B. Steinberg and J. Litzgus. 2012. Revealing a cryptic life-history stage: differences in habitat selection and survivorship between hatchlings of two turtle species at risk (Glyptemys insculpta and Emydoidea blandingii). Wildlife Research 39: 408-418.
Paterson, J.E., B. Steinberg and J. Litzgus.2014. Effects of body size, habitat selection and exposure on hatchling turtle survival. Journal of Zoology (October 2014): 1-8.
Patterson, A. 2007. Multiple paternity and male reproductive success in the Blanding’s turtle (Emydoidea blandingii) in Nova Scotia. BScH Thesis. Acadia University, Wolfville, NS, Canada. 34pp.
Penny, L. 2004. BScH Thesis. Acadia University, Wolfville, NS.
Petrie, S. 1998. Report to the Norfolk Land Stewardship Council. 206 pp.
Phillips, J. and D. Murray. 2005. Contract report for Parks Canada.
Piraino, T. J. and S.D. Gillingwater. 2005. Unpublished report submitted to the Canadian Wildlife Service. 17pp.
Piraino, T. J. and S.D. Gillingwater. 2006.. Unpublished report submitted to to the Canadian Wildlife Service. 12pp.
Pitt, A.L. and M.A. Nickerson. 2012. Reassessment of the turtle community in the North Fork of White River, Ozark County, Missouri. Copeia 2012: 367-374.
Porter, K., pers.comm. 2014. Email correspondence to J. McNeil. October 2014. Conservation Coordinator, Nova Scotia Nature Trust, Halifax, NS.
Power T.D., T.B. Herman and J. Kerekes. 1994. Water colour as a predictor of local distribution of Blanding’s Turtles, Emydoidea blandingii, in Nova Scotia. Canadian Field-Naturalist 108:17-21.
Power, T.D. 1989. Seasonal movements and nesting ecology of a relict population of Blanding’s turtle (Emydoidea blandingii (Holbrook)) in Nova Scotia. M.Sc. Thesis. Acadia University, Wolfville, Nova Scotia, Canada.
Proulx, C.L., G. Fortin and G. Blouin-Demers. 2014. Blanding’s Turtles (Emydoidea blandingii) avoid crossing unpaved and paved roads. Journal of Herpetology 48:267-271.
Province of Nova Scotia. 2013. Province of Nova Scotia. 2013. Our Parks and Protected Areas: A Plan for Nova Scotia. The Department of Natural Resources and Nova Scotia Environment, Nova Scotia, 57 pp.
Purves, S. 1980. Unpublished report to Canadian Wildlife Service. London, Ontario. 22pp.
Quesnelle P.E, L. Fahrig and K.E. Lindsay. 2013. Effects of habitat loss, habitat configuration and matrix composition on declining wetland species. Biological Conservation 160: 200-208.
Riley, J., M. Keevil, P. Moldowan and J. Litzgus. 2011. Emydoidea blandingii (Blanding’s Turtle): Record egg size. Herpetological Review 42: 417-418.
Riley, J., J. Paterson and J. Litzgus. 2012. Emydoidea blandingii (Blanding’s Turtle): Record clutch size. Herpetological Review 43: 326.
Rivard, D.H., Smith, D.A., 1973a. Report of Contract No. 72-30 to Parks Canada.
Rivard, D.H., Smith, D.A., 1973b. Report of Contract No. 73-23 to Parks Canada.
Rollinson, N. and R.J. Brooks. 2007. Proximate constraints on reproductive ouput in a northern population of Painted Turtles (Chrysemys picta): an empirical test of the bet-hedging paradigm. Canadian Journal of Zoology 85: 177–184.
Rouleau, S. and P.A. Bourgeois. 2014. Société d’histoire naturelle de la vallée du Saint-Laurent. Sainte-Anne de Bellevue, Québec. 36 pp.
Rouleau, S. and S. Giguère. 2012. Société d’histoire naturelle de la vallée du Saint-Laurent. Sainte-Anne de Bellevue, Québec. 27 p.
Rouse, J. pers. comm. 2015. Email correspondence to T. Piraino. September 2015. Species At Risk Biologist, Ontario Ministry of Natural Resources and Forestry, Parry Sound District, Parry Sound, Ontario.
Rubin, C.S., R.E. Warner, J.L. Bouzat. and K.N. Page. 2001. Population genetic structure of Blanding’s turtles (Emydoidea blandingii) in an urban landscape. Biological Conservation 99: 323-330.
Sarkar, S.N., K. Sarkar, P. Das and B.R. Maiti. 1996. Photothermal eVects on ovarian growth and function in the soft-shelled turtle Lissemys punctata punctata. Journal of Experimental Zoology 274: 41–55.
Saumure, R.A. 1995. Report to the Canadian Wildlife Service. 82 pp.
Schueler, F.W. pers. comm. 2015. Email correspondence to T. Piraino. September 2015. Biologist, Bishop Mills Natural History Centre, Bishop Mills, Ontario.
Seburn, D. 2010. Blanding’s Turtle, Emydoidea blandingii, habitat use during hibernation in Eastern Ontario. Canadian Field-Naturalist 24: 263-265.
Seburn, D., K. Gunson and D. Lesbarrères. 2014. Report submitted to Species at Risk Stewardship Fund. 7 pp.
Seidel, M.E., and A.D. Adkins. 1989. Variation in turtle myoglobins (subfamily Emydinae: Testudines) examined by isoelectric focusing. Comparative Biochemistry and Physiology B. 94B: 569-573.
Severn Sound Remedial Action Plan. 1993. Severn Sound Remedial Action Plan Stage 2 Report.
Sheppard, A.C. 2014a. Emydoidea blandingii (Blanding’s Turtle): Mass mortality. Herpetological Review 45: 312-313.
Sheppard, A.C. 2014b. Report to Ontario Parks, Northeast Zone. 36 pp.
Shoemaker, K. T., A.R. Breisch, J.W. Jaycox and J.P. Gibbs. 2013. Reexamining the minimum viable population concept for long-lived species. Conservation Biology 27: 542-551.
Sicliano, S.D., A. Sangster, C.J. Dauhney, L. Loseto, J.L. Germida, A.N. Rencz, N.J. O’Driscoll, D.R. Lean. 2003. Are mercury concentrations in the wetlands of Kejimkujik National Park, Nova Scotia, Canada, dependent on geology? Journal of Environmental Quality 32: 2085-2094.
Spinks P.Q., Shaffer H.B. 2005. Rangewide molecular analysis of the western pond turtle (Emys marmorata): cryptic variation, isolation by distance, and their conservation implications. Molecular Ecology 14: 2047-2064.
Standing, K.L., T.B. Herman and I.P. Morrison. 1999. Nesting ecology of Blanding’s Turtle (Emydoidea blandingii) in Nova Scotia, the northeastern limit of the species range. Canadian Journal of Zoology 77: 1609-1614.
Standing, K.L., T.B. Herman, D.D. Hurlburt and I.P. Morrison. 1997. Postemergence behaviour of neonates in a northern peripheral population of Blanding’s turtle, Emydoidea blandingii, in Nova Scotia. Canadian Journal of Zoology 75: 1387-395.
Standing, K.L., T.B. Herman, M. Shallow, T. Power and I.P. Morrison. 2000. Chelonian Conservation and Biology 3:637-642.
Steen, D.A., M.J. Aresco, S.G. Beilke, B.W. Compton, E.P. Condon, C.K. Dodd Jr., H. Forrester, J.W. Gibbons, J.L. Greene, G. Johnson, T.A. Langen, M.J. Oldham, D.N. Oxier, R.A. Saumure, F.W. Schueler, J.M. Sleeman, L.L. Smith, J.K. Tucker, and J.P. Gibbs. 2006. Relative vulnerability of female turtles to road mortality. Animal Conservation 9:269-273.
Steinberg, B. pers. comm. 2014. Email correspondence to T. Piraino. October 2014. Species at Risk Biologist, Ontario Ministry of Natural Resources and Forestry, Algonquin Provincial Park, Whitney, Ontario.
Steyermark, A.C. and J.R. Spotila. 2001. Effects of maternal identity and incubation temperature on Snapping Turtle (Chelydra serpentina) growth. Functional Ecology 15: 624-632.
St-Hilaire, D. 2003. Rapport sur la situation de la tortue mouchetee (Emydoidea blandingii blandingii) au Québec. Société de la faune et des parcs du Québec,Direction de l’aménagement de la faune de l’Outaouais. 27 pages.
St-Hilaire, D., J. Caron and Y. Dubois. 2013. Données de 1996 à 1999 sur la capture, la morphométrie, les déplacements et les habitats fréquentés par la tortue mouchetée (Emys blandingii). Ministère des Ressources naturelles, Direction de l’expertise Faune – Forêts, région de l’Outaouais. 65 pp.
The Province of Nova Scotia. 2013. Our Parks and Protected Areas: A Plan for Nova Scotia. The Department of Natural Resources and Nova Scotia Environment, Nova Scotia, 57 pp.
Thompson, S. pers. comm. 2014. Email correspondence to T. Piraino. October 2014. District Ecologist, Ontario Ministry of Natural Resources and Forestry, Kemptville District, Kemptville, Ontario.
Toews, D. 2004. Quantification of fine scale genetic structure in a peripheral populations of Blanding’s turtle (Emydoidea blandingii) in Nova Scotia. BScH Thesis Acadia University, Wolfville NS. 38 pp.
Toussaint, D., pers. comm. 2014. Email correspondence to T.Piraino. Biologiste, Ministère des Forêts, de la Faune et des Parcs. Gatineau, Québec.
Upper Thames River Watershed Report Cards. 2012. Upper Thames River Conservation Authority.
U.S. Fish and Wildlife Service. 2015. Valentine National Wildlife Refuge, Nebraska. [accessed August 2015].
van Dijk, P.P. & Rhodin, A.G.J. 2013. Emydoidea blandingii. The IUCN Red List of Threatened Species 2013: e.T7709A12843518.
Walston, L., S.J. Najjar, K.E. LaGory and S.M. Drake. 2015. Spatial ecology of Blanding’s Turtles (Emydoidea blandingii) in southcentral New Hampshire with implications to road mortality. Herpetological Conservation and Biology 10:284-296.
Watters, D. 2003. Wasaga Beach 2002 building activity highest yet.
Weisrock, D.W. and Janzen, F.J. 1999. Thermal and fitness-related consequences of nest location in Painted Turtles (Chrysemys picta). Functional Ecology 13:94–101.
Weller, W.F. 1973. Unpublished data from Canadian Wildlife Service. London, Ontario.
Wilcox, K.L., S.A. Petrie, L.A. Maynard and S.W. Meyer. 2003. Historical distribution and abundance of Phragmites australis at Long Point, Lake Erie, Ontario. Journal of Great Lakes Research 29:664-680.
Wild Species. 2010. The general status of species in Canada. [accessed September 2015].
Woods, S. 2014. Report submitted to Ontario Ministry of Natural Resources Species at Risk Stewardship Fund. 75 pp.
Wu, J. pers. comm. 2014. Email correspondence to T. Piraino. September 2014. Scientific Project Officer, COSEWIC Secretariat, Canadian Wildlife Service, Environment Canada. Gatineau, Québec.
Yagi A.R, A.Brant and R.Tervo. 2009. Niagara Region Natural Areas Inventory Reptile and Amphibian Study 2006 to 2008. Ontario Ministry of Natural Resources and Land Care Niagara unpublished report for the Natural Areas Inventory prepared for the Niagara Peninsula Conservation Authority 78pp incl. separate Map Appendix.
Yagi, A., pers. comm. 2013. Email correspondence to T. Piraino. September 2013. Management Biologist, Ontario Ministry of Natural Resources. Vineland, Ontario.
Biographical summary of report writer(s)
Teresa Piraino is an ecological consultant with MMM Group Limited (a WSP Company) in Kitchener, Ontario. She has 17 years of field experience conducting Species At Risk research and wildlife surveys throughout Ontario. Over the years she has gained in-depth field research experience with many of Ontario’s reptiles, including the Blanding’s, Spotted, Spiny Softshell, Northern Map, Snapping and Midland Painted Turtles, as well as the Eastern Foxsnake, Eastern Hog-nosed Snake and Queensnake. Teresa sits as an advisor to the Ontario Turtle Conservation Group and has authored the COSEWIC Spotted Turtle (2015) and Northern Map Turtle (2012) Update Status Reports. She is also a co-author for the upcoming IUCN Chelonian Research Monographs: Spotted Turtle Species Account (in prep.).
Jeffie McNeil is the Species at Risk Biologist and Research Coordinator at the Mersey Tobeatic Research Institute. She is a co-chair of the Nova Scotia Blanding’s Turtle Recovery Team and has 20 years of field experience with the species. Jeffie graduated with an M.Sc. in biology from Acadia University in 2002 with a thesis focusing on Blanding’s Turtle ecology in Nova Scotia. She was the lead author for the Blanding’s Turtle (Nova Scotia population) Recovery Strategy (2012), the Eastern Ribbonsnake (Atlantic population) Recovery Strategy (2008), the Nova Scotia Action Plan for Mainland Moose (2007), and the COSEWIC Update Status Report for Eastern Ribbonsnake (2012).