
Bluntnose sixgill shark (Hexanchus griseus) COSEWIC assessment and status report: chapter 7
Interactions with Fisheries
The bluntnose sixgill shark has been the focus of at least three known directed fisheries in Canadian waters. The first occurred in the early 1920s around the waters of Mayne Island in the southern Strait of Georgia with a focus on ‘mudshark’ skins used to make shark leathers (see Appendix 1). The success of this venture in terms of sharks caught and duration is unknown. Newspaper articles from the time report an experimental fishery capturing 357 sharks over a 24-day period (Times, May 4 1922, p. 13).
The second directed fishery for these sharks took place between 1937 and 1946 throughout British Columbia. The fishery primarily targeted the livers of the sharks, which were processed for vitamin A. Fishing was conducted in depths between 20 and 100 m using longlines with between 300 and 500 hooks (Sunderland 1937). Landing statistics for this species did not appear in government records until 1942 when it was recorded under the heading ‘mudshark livers landed’. Between 1942 and 1946, 276 t of bluntnose sixgill shark liver was marketed in British Columbia (Table 1).
| Year | Pounds of liver | Tonnes of liver | Estimated number of sharks |
|---|---|---|---|
| 1942 |
124219
|
56
|
776
|
| 1943 |
245444
|
111
|
1534
|
| 1944 |
140800
|
64
|
880
|
| 1945 |
84200
|
38
|
526
|
| 1946 |
15100
|
7
|
94
|
| Total |
609763
|
276
|
3810
|
Non-scientific publications at the time reported that an average size liver was 72 kilograms (kg) (160 pounds) (Anonymous 1943). The liver of bluntnose sixgill shark comprises between 10-20% of its round weight (Bailey 1952). If the 72 kg estimate is accurate, then the average size shark would have been ~360-720 kg, which corresponds to an approximate length of 370-450 cm based on the length-weight equation Wkg = (7.80X10⁻⁷) * TLcm3.38 (Gallucci et al. 2005). (Note this equation was derived from smaller animals). This estimated length range is high relative to the other known lengths observed in Canada’s Pacific waters of ~200 to 250 centimetres (cm) (Dunbrack and Zielinksi 2003; this report see Habitatsection). The estimated liver weight of 72 kg per shark is likely high unless the fishery was able to consistently target adults or large juveniles.
A rough estimate of the number of sharks captured can be calculated by dividing the total weight of the livers (276 tonnes [t]) by the reported average weight of the liver (72 kg) for a conservative catch of ~3800 animals (Table 1) from 1942-1946. Assuming that the ratio of liver to body weight is correct; between 1380 t and 2760 t of round weight shark may have been landed during this period. If the liver weight is overestimated, then the number of sharks taken in the fishery (Table 1) would be underestimated.
Similar liver-directed fisheries for bluntnose sixgill sharks were occurring in adjacent Washington State waters during this same time period (Bargmann pers. comm. 2006). The combined long-term effect of these fisheries on the northeast Pacific population has never been investigated. If the population structure observed today in shallow waters was similar during the 1930s and 1940s then the fishery would have caught primarily juvenile animals. The segregation between adults and juveniles may have provided some resilience given the presumed longevity of this species and the relatively brief fishery (ten years). However, if the fishery was capturing both mature and juvenile sharks then the impact to the population and their subsequent recovery would likely have been much greater.
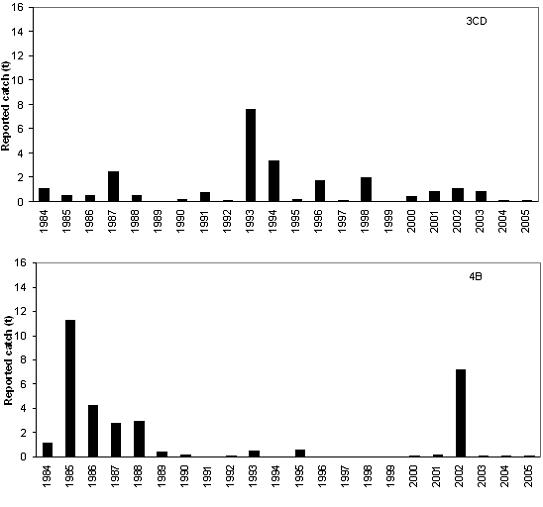
The third commercial fishery for bluntnose sixgill sharks commenced on an experimental basis in the late 1980s to early 1990s but was terminated due to conservation concerns (McFarlane et al. 2002). Between 1985 and 2005 a total of 75 t of “cowshark” and “sixgill” was recorded in federal fisheries catch databases with the peak year occurring in 1985 at 14.6 t (Figure 9). The Strait of Georgia and west coast of Vancouver Island account for 75% (55.7 t) of the recorded catch (Figure 10; Appendix 2).
Figure 9. Reported coast-wide catch of bluntnose sixgill sharks fromCanada’s Pacific waters from 1984 to 2005. Source: PacHarv database.
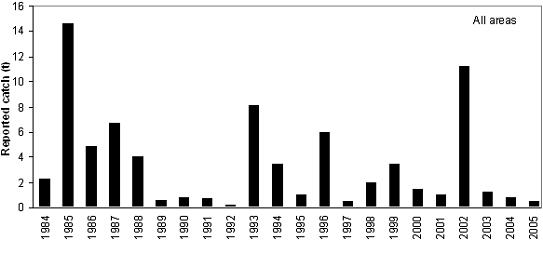
Figure 10. Reported catch of bluntnose sixgill catch in management areas 3CD-West Coast Vancouver Island(top panel) and 4B-Strait of Georgia (bottom panel).Source: PacHarv database.
Throughout the history of commercial fishing on British Columbia’s coast, bluntnose sixgill sharks were caught as bycatch primarily by longline and to a lesser degree trawl fisheries, while in the pursuit of other commercial species. Present-day catch (1996-2005) is composed exclusively of bycatch and therefore the recorded amounts are a function of the bycatch reporting systems in place in the various fisheries. The relative spatial distribution of reported catch is shown in Figure 3.
Since 1996 the commercial groundfish trawl has received 100% at-sea observer coverage and therefore catches of bluntnose sixgill sharks reported from this fishery are considered accurate. A total of 10.8 t are reported between 1996 and October 2005 or approximately 1.1 t/yr. The number of sharks this represents is unknown. If we assume an average size of 205 cm (~50 kg) as was found in a tagging study along the west coast, then about 22 bluntnose sixgill sharks a year are being caught by trawl gear. Catches are greatest fromPacific Marine Fisheries Commission (PMFC) areas3C/D along the west coast of Vancouver Island, representing about 40% of the total catch (Table 2).
| Year | Area and Catch (kg) 3C |
Area and Catch (kg) 3D |
Area and Catch (kg) 4B |
Area and Catch (kg) 5A |
Area and Catch (kg) 5B |
Area and Catch (kg) 5C |
Area and Catch (kg) 5E |
Total (kg) | Estimated number of sharks |
|---|---|---|---|---|---|---|---|---|---|
| 1996 |
|
82
|
|
252
|
23
|
|
|
357
|
7
|
| 1997 |
107
|
34
|
|
84
|
130
|
|
|
355
|
7
|
| 1998 |
1816
|
14
|
14
|
11
|
408
|
|
2268
|
4531
|
91
|
| 1999 |
308
|
34
|
|
194
|
38
|
|
581
|
1155
|
23
|
| 2000 |
14
|
50
|
91
|
|
91
|
|
|
246
|
5
|
| 2001 |
794
|
248
|
441
|
68
|
|
|
|
1551
|
31
|
| 2002 |
57
|
136
|
68
|
|
231
|
544
|
|
1036
|
21
|
| 2003 |
103
|
576
|
193
|
27
|
291
|
|
|
1190
|
24
|
| 2004 |
|
68
|
|
23
|
68
|
91
|
45
|
295
|
6
|
| 2005 |
|
|
65
|
|
|
|
|
65
|
1
|
| Total (kg) |
3199
|
1242
|
872
|
659
|
1280
|
635
|
2894
|
10781
|
216
|
Hook and line fisheries, including fisheries for spiny dogfish, lingcod, rockfish, halibut and sablefish have only recently (2001-present) been subject to at-sea observers with typically between 10-15% coverage per fleet (DFO 2003, 2004, 2005a). In addition to at-sea observer data, some fishers have also reported bluntnose sixgill shark catches in their logbooks. From 2001 to 2004 the at-sea observer program has recorded 7.2 t (Table 3) and from 2001 to 2005 fisher logbooks have recorded 4.7 t (Table 4). Since fishers have not been obligated to report catches of bluntnose sixgill shark in their logbooks, the actual catch is not known but would be higher. The halibut fishery and the spiny dogfish fishery (also called Schedule II) capture the largest amounts of bluntnose sixgill sharks (Appendix 3).
| Year | Area and Reported Catch (kg) 3C |
Area and Reported Catch (kg) 3D |
Area and Reported Catch (kg) 4B |
Area and Reported Catch (kg) 5A |
Area and Reported Catch (kg) 5B |
Area and Reported Catch (kg) 5C |
Area and Reported Catch (kg) 5D |
Area and Reported Catch (kg) 5E |
Area and Reported Catch (kg) Unknown |
Total (kg) | Estimated number of sharks |
|---|---|---|---|---|---|---|---|---|---|---|---|
| 2001 |
18
|
|
363
|
|
|
|
|
295
|
|
676
|
14
|
| 2002 |
|
2267
|
37
|
562
|
141
|
|
95
|
|
|
3102
|
62
|
| 2003 |
262
|
295
|
1031
|
|
182
|
113
|
91
|
286
|
|
2260
|
45
|
| 2004 |
45
|
816
|
104
|
|
|
|
|
|
181
|
1146
|
23
|
| Total |
325
|
3378
|
1535
|
562
|
323
|
113
|
186
|
581
|
181
|
7184
|
144
|
| Year | Area and Reported Catch (kg) 3C |
Area and Reported Catch (kg) 3D |
Area and Reported Catch (kg) 4B |
Area and Reported Catch (kg) 5E |
Area and Reported Catch (kg) Unknown |
Total (kg) | Estimated number of sharks |
|---|---|---|---|---|---|---|---|
| 1986 |
|
|
|
|
67
|
67
|
1
|
| 1989 |
|
|
|
|
240
|
240
|
5
|
| 1990 |
|
|
|
|
186
|
186
|
4
|
| 1992 |
|
145
|
|
|
|
145
|
3
|
| 1996 |
|
|
|
|
13
|
13
|
0
|
| 2001 |
548
|
|
110
|
|
|
658
|
13
|
| 2002 |
|
|
2631
|
987
|
329
|
3947
|
79
|
| 2003 |
92
|
|
|
|
|
92
|
2
|
| 2004 |
14
|
|
|
|
|
14
|
0
|
| 2005 |
|
|
18
|
|
|
18
|
0
|
| Total |
654
|
145
|
2759
|
987
|
835
|
5380
|
108
|
There is presently no reliable method of expanding observer data in order to derive an actual catch. Expansions of lesser-caught species such as the bluntnose sixgill shark should be viewed with caution; nonetheless, an expansion does provide a basis for understanding true catch. It should also be noted that observer coverage in the hook and line fisheries is not equally distributed by vessel type (i.e., smaller vessels are unable to carry additional people), which causes an additional source of error as smaller vessels tend to fish in more protected and shallower waters. Under the assumption that the observed catch of bluntnose sixgill sharks is directly proportional to the fleet as a whole, actual catch may be closer to 12 t/yr (~240 sharks) between 2001 and 2004 based on assumed observer coverage of 15%.
Another method of estimating the actual total bycatch is to look at the ratio of observed bluntnose sixgill shark as a proportion of the retained target species. For spiny dogfish and Pacific halibut, the observed ratio is 7.0 kg and 1.9 kg per tonne of retained spiny dogfish and Pacific halibut respectively (Appendix 4). From 2001 to 2005, on average approximately 4100 t of spiny dogfish and 5100 t of Pacific halibut were retained annually in British Columbia resulting in a possible estimated catch of 38 t/yr (~760 sharks) of bluntnose sixgill shark (Appendix 4).
Overall the catch of bluntnose sixgill sharks in British Columbia is poorly known. Recent observer data indicates that bluntnose sixgill sharks are caught regularly by fisheries pursuing halibut and spiny dogfish. Beginning in 2006 all hook and line fisheries became subjected to 100% at-sea observer coverage using electronic monitoring (i.e., video surveillance) which will help determine the actual bycatch of bluntnose sixgill shark. At the time of writing this report, these data were not yet available. There may also be sharks that become hooked but are able to break free of the hook before being brought to the surface. Mortality associated with the bycatch of bluntnose sixgill sharks has not been investigated. According to one spiny dogfish fisherman, the occasional bluntnose sixgill shark is brought up dead if it happens to get wrapped up in the groundline, but usually they are lively at the surface and when released they swim away quite strongly (Edwards pers. comm. 2006).