
Caribou (Rangifer tarandus) Eastern Migratory population and Torngat Mountains population: COSEWIC assessment and status report 2017
Caribou
© Eastern Migratory Caribou, Steeve Côté.
Eastern Migratory population - Endangered
April 2017
Torngat Mountains - Endangered
November 2016
Table of contents
- Table of contents
- COSEWIC assessment summary - Eastern Migratory population
- COSEWIC assessment summary - Torngat Mountains
- COSEWIC Executive summary
- Technical summary - Eastern Migratory population
- Technical summary - Torngat Mountains
- Preface
- Wildlife species description and significance
- Distribution
- Habitat
- Biology
- Threats and limiting factors
- Limiting factors
- Threats
- Mining (iucn 3.2); threat score was negligible for torngat mountains, high-low for eastern migratory
- Linear features (roads, utility lines; iucn 4.1, 4.2); threat score was unranked for torngat mountains, low for eastern migratory
- Hunting (iucn 5.1); threat score was high for torngat mountains, medium for eastern migratory
- Number of locations
- Protection, status and ranks
- Acknowledgements and authorities contacted
- Information sources
- Biographical summary of report writers
- Collections examined
List of figures
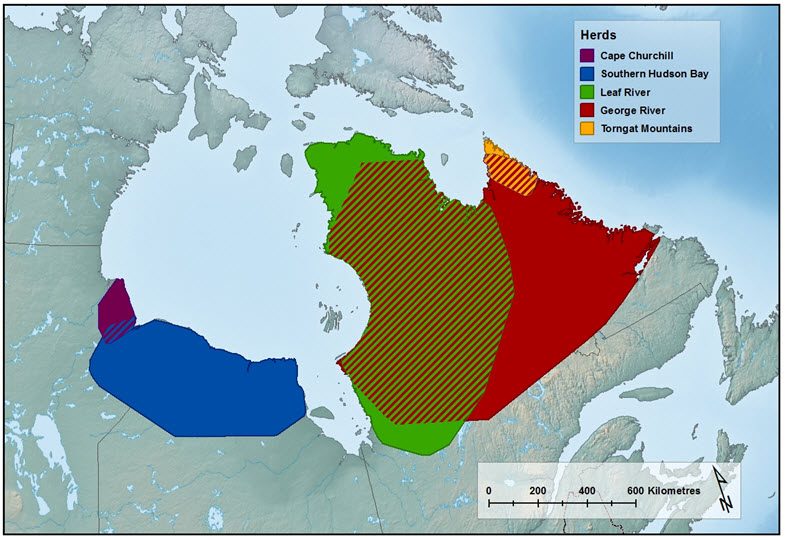
- Figure 1. Approximate range of the Torngat Mountains Caribou population and the four subpopulations of the Eastern Migratory Caribou.
- Figure 2. Range of the George River subpopulation in the late 1990s based on 100% MCP polygons of satellite-tagged animals, compared to range between 2010 – 2014, indicating a range decrease of approximately 85% .
- Figure 3. Location of calving grounds of the George River subpopulation from 1974 – 2010, shown in light grey.
- Figure 4. Estimated range of the Torngat Mountains Caribou population (red polygon), based on 100% minimum convex polygon of locations of 35 satellite-tagged adult Caribou monitored between 2011 and 2015.
- Figure 5. Spring and fall migrations of satellite-tagged Caribou from the Leaf River (Rivière-aux-Feuilles) and George River (Rivière-George) subpopulations, 2009-2011.
- Figure 6. Log transformed population estimates from aerial surveys for all ages of Caribou in the George River (RG) and Leaf River (RAF) Caribou subpopulations, 1963-2016.
- Figure 7. Estimated survival rates of radio-collared adult female Caribou in the George River (Rivière-George) and Leaf River (Rivière-aux-Feuilles) subpopulations with SE.
- Figure 8. Proportion of males (including all size classes) and of large males seen during autumn classified counts in the George River (TRG) and Leaf River (TRAF) Caribou subpopulations.
- Figure 9. Ratio of calves to 100 adult females observed during classified counts in autumn in the George River (TRG) and Leaf River (TRAF) Caribou subpopulations.
- Figure 10. Example of expansion in growth of shrub vegetation over a 20-year period, Torngat Mountains National Park.
List of tables
- Table 1. Most recent population estimates available for all ages of Caribou from Eastern Migratory Caribou subpopulations.
List of appendices
- Appendix 1. Threats Classification Table for Eastern Migratory Caribou DU 4)
- Appendix 2. Threats Classification Table for Torngat Mountains Caribou (DU 10)
Document information
COSEWIC assessment and status report on the Caribou (Rangifer tarandus) Eastern Migratory population, Torngat Mountains population in Canada, 2017
COSEWIC
Committee on the Status
of Endangered Wildlife
in Canada

COSEPAC
Comité sur la situation
des espèces en péril
au Canada
Committee on the Status of Endangered Wildlife in Canada (COSEWIC) status reports are working documents used in assigning the status of wildlife species suspected of being at risk. This report may be cited as follows:
COSEWIC. 2017. COSEWIC assessment and status report on the Caribou Rangifer tarandus, Eastern Migratory population and Torngat Mountains population,in Canada. Committee on the Status of Endangered Wildlife in Canada. Ottawa. xvii + 68 pp. (Species at Risk Public Registry website).
Production note:
COSEWIC would like to acknowledge Steeve D. Côté and Marco Festa-Bianchet for writing the status report on Caribou, Eastern Migratory population and Torngat Mountains population (Rangifer tarandus) in Canada, prepared under contract with Environment and Climate Change Canada. This report was overseen and edited by Graham Forbes, Co-chair of the COSEWIC Terrestrial Mammals Specialist Subcommittee.
For additional copies contact:
COSEWIC Secretariat
c/o Canadian Wildlife Service
Environment Canada
Ottawa, ON
K1A 0H3
Tel.: 819-938-4125
Fax: 819-938-3984
E-mail: COSEWIC E-mail
Website: COSEWIC
Également disponible en français sous le titre Évaluation et Rapport de situation du COSEPAC sur le Caribou (Rangifer tarandus), population migratrice de l'Est et population des monts Torngat, au Canada.
Cover illustration/photo:
Torngat Mountains Caribou, Photo credit: Charles Jutras, MFFP.
Eastern Migratory Caribou, Photo credit: Steeve Côté.
COSEWIC assessment summary - Eastern Migratory population
Assessment summary - April 2017
- Common name
- Caribou - Eastern Migratory population
- Scientific name
- Rangifer tarandus
- Status
- Endangered
- Reason for designation
- This migratory caribou population exists as four subpopulations from coastal western Hudson Bay to Labrador. The present population estimate of 170,636 mature animals indicates there has been an 80% overall decline in number over three generations (18-21 years). The decline is predicted to continue because of overharvest, and a decrease in habitat quality associated with climate change and development. Two declining subpopulations contain about 99% of the Eastern Migratory population; the George River has declined by 99% over 3 generations, and the Leaf River by 68% over two generations. Although migratory caribou populations fluctuate in abundance, there is concern that recent and predicted threats will limit population growth in a population that presently is at its lowest recorded level. Threats appear to be less prevalent in the two western subpopulations which represent only about 4% of the existing total population. Most of the remaining caribou reside in the Leaf River subpopulation, which continues to decline.
- Occurrence
- Manitoba, Ontario, Quebec, Newfoundland and Labrador
- Status history
- Designated Endangered in April 2017.
COSEWIC assessment summary - Torngat Mountains population
Assessment summary - November 2016
- Common name
- Caribou - Torngat Mountains population
- Scientific name
- Rangifer tarandus
- Status
- Endangered
- Reason for designation
- This population is restricted to the Ungava Peninsula of eastern Québec, northern Labrador, and Nunavut (Killiniq and adjacent islands). A quantitative trend is not available because survey data are limited, but the total population was estimated to be 5,000 individuals in 1980 and 930 individuals in 2014, suggesting a significant decline. Aboriginal Traditional Knowledge also indicates a decline. The population meets Endangered status because the estimated 698 mature animals exist in a single population, a population decline is evident, and a decline is predicted to continue because of harvest and a decrease in habitat quality associated with climate change. The population may be facing imminent extinction because of the low numbers remaining.
- Occurrence
- Nunavut, Quebec, Newfoundland and Labrador
- Status history
- Designated Endangered in November 2016.
Executive summary
Caribou
Rangifer tarandus
Eastern Migratory population
Torngat Mountains population
Wildlife species description and significance
Caribou (Rangifer tarandus) are a medium-sized member of the deer family. Their relatively long legs and large hooves facilitate living in deep snow associated with northern environments. Caribou are central to the culture, spirituality, and subsistence of many northern Aboriginal communities, and are also important to non-Aboriginal people across Canada. Caribou exhibit high variability in morphology, ecology, and behaviour across their circumpolar range. In 2011, COSEWIC recognized 12 designatable units (DUs); this report assesses the Eastern Migratory population (EM; DU4), and the Torngat Mountains population (TM; DU 10).
Distribution
The EM contains four subpopulations: Cape Churchill, which is found along the Hudson Bay coast at the Manitoba-Ontario border; Southern Hudson Bay, found in a similar area, but mainly further south and east into northern Ontario; Leaf River (in French; Rivière-aux-Feuilles), in northern Quebec; and George River (Rivière-George), in Quebec and Labrador. The combined range is over 1.5 million km2. The TM Caribou exist as one population and occupy a range of approximately 28,000 km2 in the Torngat Mountains in upper Labrador, Quebec, and Nunavut (Killiniq and adjacent islands).
Habitat
Eastern Migratory Caribou mainly use tundra during calving and summer periods, and use taiga and mainly boreal forest during winter. The TM use alpine areas on mountain plateaus and adjacent valleys in the Torngat Mountains, and seashore areas. Caribou use hillsides, islands, and alpine plateaus for calving.
Biology
Typical longevity in Caribou is < 10 years for males and < 15 years for females. Most females ≥ 3 years old give birth to a single calf annually, resulting in a lower reproductive rate than other North American Cervid species. Primiparity can occur at 2 years of age in good habitat conditions. Generation length is estimated as a range of 6 - 7 years.
Population sizes and trends
The minimum population size for the EM is 227,513 Caribou of all ages, based on the most recent total estimates for the Leaf River (2016) and George River (2016) subpopulations, and most recent minimum estimates for the Cape Churchill (2007) and Southern Hudson Bay (2011) subpopulations. The estimated number of mature animals is 170,636. The population estimate for mature Caribou of the EM three generations (18 – 21 years) ago is 833,774 Caribou, suggesting a decline of 80% over three generations. ATK supports that a decline has occurred in the George River subpopulation.
The subpopulations in eastern EM range are known to fluctuate (based on ATK, and historical data) but it is unclear if the populations will increase again because of novel threats. Caribou in these DUs associate with lichen and grass-dominated tundra but the tundra landscape is changing due to climate warming. The number of George River subpopulation Caribou (until recently, the largest-sized subpopulation in the EM) is lower than previously recorded and threats are considered to be significant for the George River and Leaf River subpopulations.
The population of the TM was estimated as approximately 5,000 Caribou in the 1980s, and at 930 Caribou (698 mature animals) in spring 2014, an estimated reduction of >80% in approximately 35 years (approximately 4 – 5 generations). ATK supports that a decline has occurred. Data do not exist on population changes over a three-generation time period.
Threats and limiting factors
Caribou are sensitive to disturbance. Industrial development, particularly mining and associated road networks, present threats to EM Caribou. Human overharvest of EM and TM Caribou is contributing to population declines. Populations generally are limited by food availability, but subsistence and sport hunting can be limiting at low population size, or in a declining population. A parasite, Besnoitia tarandi, became evident in the eastern subpopulations of the EM in the mid-2000s and may impact Caribou productivity. Climate change, through impacts on habitat quality and resource availability, also appears to be a threat for Caribou populations as the amount of shrubs increase on tundra landscapes. The threats calculator exercise concluded that the threat level was ‘Very High to High’ for the EM and ‘High’ for the TM Caribou.
Protection, status, and ranks
COSEWIC assessed the conservation status of the EM Caribou (Endangered) in April 2017, and TM Caribou (Endangered) in November 2016. In 2016, the IUCN changed its assessment for the global population of Caribou from Least Concern to Vulnerable. The global NatureServe rank for Caribou is G5 (Secure; last updated in 2012) but ranks have not been determined for separate DUs recognized by COSEWIC. The draft 2015 rank for Caribou in Labrador (mainly the George River subpopulation) is S1S2 (critically imperilled to imperilled).
Technical summary – eastern migratory population (designatable unit 4)
- Scientific name:
- Rangifer tarandus
- English name:
- Caribou – Eastern Migratory population (Designatable Unit 4)
- French name:
- Caribou – Population migratrice de l’Est (Unité désignable 4)
- Range of occurrence in Canada (province/territory/ocean):
- Newfoundland & Labrador, Quebec, Ontario, Manitoba
Demographic information
| Summary items | Information |
|---|---|
Generation time (usually average age of parents in the population; indicate if another method of estimating generation time indicated in the IUCN guidelines (2011) is being used). Based on a sample of known-age breeding females. |
Range of 6 - 7 years |
| Is there an observed continuing decline in number of mature individuals? | Yes |
| Estimated percent of continuing decline in total number of mature individuals within 2 generations Ongoing declines expected; declines of 97% for last two generations, and 59% for last generation in combined Leaf River and George River subpopulations (which contain most (99%) of the population). | Unknown |
Estimated percent reduction in total number of mature individuals over the last 3 generations. Decline mainly due to a 99% decline of George River subpopulation in three generations, the previously most abundant subpopulation (74% of the EM), and 68% (25% of the EM) decline in the Leaf River subpopulation in two generations. |
80% |
Projected percent reduction or increase in total number of mature individuals over the next 3 generations (18 - 21 years). Percent reduction difficult to predict because of highly variable demographics among subpopulations but declines expected to continue; threats exercise predicts continued decline. |
Unknown, but decline predicted |
Percent change in total number of mature individuals over any 3 generations (18 - 21 years) period, over a time period including both the past and the future. Total mature population size for EM has declined by 97%, mainly due to declines in George River and Leaf River subpopulations in last 2 generations. No proven increases for any subpopulation in last generation length (6 – 7 years); declines unquantified but predicted to continue in future, particularly in eastern subpopulations. |
Unknown, but likely > 90% decline |
Are the causes of the decline clearly reversible, understood, ceased? Populations could rebound because decline likely is initiated through density-dependent factors, with overharvest contributing to the decline. However, causes have not ceased and novel threats may limit recovery; decline continues for George River and Leaf River subpopulations. |
Possibly reversible and understood, but ongoing |
Are there extreme (i.e., > 10x) fluctuations in number of mature individuals? Leaf River and George River subpopulations evidently fluctuate; George River subpopulation has declined 99% over the last 3 generations, and Leaf River by 68% over two generations. Novel threats suggest recent declines may not recover. |
Unknown |
Extent and occupancy information
| Summary items | Information |
|---|---|
| Estimated extent of occurrence Some subpopulations overlap in certain seasons; total value reflects single, combined ranges. | > 2 million km2 George River: 937,395 km2 (maximum since the early 1990s) Leaf River: 663,810 km2 Cape Churchill: 27,192 km2 Southern Hudson Bay: 310,000 km2 Total = 1.5 million km2 |
Index of area of occupancy (IAO) (Always report 2x2 grid value). Size of calving areas unknown. |
Unknown |
| Is the population “severely fragmented”? | No |
| Number of “locations” See Definitions and Abbreviations on COSEWIC website and IUCN (Feb 2014) for more information on this term. (use plausible range to reflect uncertainty if appropriate) No single threat of equal impact exists; threats such as overharvest and impact of development vary across large area. |
Many |
Is there an observed continuing decline in extent of occurrence? Likely reduction on eastern edge but the approximately 85% decline in range of the George River subpopulation since 1999 is partially offset by presence of Leaf River subpopulation in much of same area, for part of the year. |
Partially |
Is there an observed continuing decline in index of area of occupancy? Decline in range of the George River subpopulation of approximately 85% since 1999 is partially offset by presence of Leaf River subpopulation in much of same area for part of the year. |
Partially |
Is there an observed continuing decline in number of subpopulations? Four subpopulations are recognized, and persist but persistence of George River subpopulation less apparent. |
No |
| Is there an observed continuing decline in Number of “locations” See Definitions and Abbreviations on COSEWIC website and IUCN (Feb 2014) for more information on this term.? Range of George River subpopulation size has declined by 70%, which would include an unknown number of locations. |
Yes |
Is there an observed continuing decline in extent and/or quality of habitat? Climate change effects are becoming more evident in the tundra; quantified impacts to population are not well understood. |
Yes |
| Are there extreme fluctuations in number of subpopulations? | No |
| Are there extreme fluctuations in number of “locations” | Unknown |
| Are there extreme fluctuations in extent of occurrence? | No |
Are there extreme fluctuations in index of area of occupancy? AOO of George River subpopulation has declined by 70% since 1999 but uncertainty exists whether such is a fluctuation or if population will not recover due to overharvest and habitat change. |
Possibly |
Number of mature individuals (in each subpopulation)
| Summary items | Information |
|---|---|
| Subpopulations (give plausible ranges) Number of mature individuals is based on 75% of estimated population size in 2016 (or nearest year), which excludes animals ≤2 years old. | Number of Mature Individuals |
| George River | 6,704 |
| Leaf River | 149,250 |
| Southern Hudson Bay | 12,479 |
| Cape Churchill | 2,203 |
| Total | 170,636 |
Quantitative analysis
| Summary items | Information |
|---|---|
Probability of extinction in the wild is at least 20% within 5 generations (30 years). PVA has not been conducted for subpopulations in the DU. |
NA |
Threats (direct, from highest impact to least, as per iucn threats calculator)
| Summary items | Information |
|---|---|
| Overall threat score was ‘Very High to High’, based on concerns over proposed mining development and roads in the eastern subpopulation range, overharvest by people, increased fire events, and an expected decrease in tundra habitat quality associated with climate change. | The main limiting factor is summer forage availability. |
Rescue effect (immigration from outside Canada)
| Summary items | Information |
|---|---|
| Status of outside population(s) most likely to provide immigrants to Canada. | NA; this DU does not exist outside Canada |
| Is immigration known or possible? | NA |
| Would immigrants be adapted to survive in Canada? | NA |
| Is there sufficient habitat for immigrants in Canada? | NA |
| Are conditions deteriorating in Canada? See Table 3 (Guidelines for modifying status assessment based on rescue effect). |
Partially |
| Are conditions for the source population deteriorating? See Table 3 (Guidelines for modifying status assessment based on rescue effect). |
NA |
| Is the Canadian population considered to be a sink? See Table 3 (Guidelines for modifying status assessment based on rescue effect). |
No |
| Is rescue from outside populations likely? | NA |
Data sensitive species
| Summary items | Information |
|---|---|
| Is this a data sensitive species? | No |
Status history
| Summary items | Information |
|---|---|
| COSEWIC: | Designated Endangered in April 2017. |
Status and reasons for designation:
| Summary items | Information | |
|---|---|---|
| blank cell | Status | Endangered |
| Alpha-numeric codes | A2acd+4acd | |
| Reasons for designation | This migratory Caribou population exists as four subpopulations from coastal western Hudson Bay to Labrador. The present population estimate of 170,636 mature animals indicates there has been an 80% overall decline in number over three generations (18-21 years). The decline is predicted to continue because of overharvest, and a decrease in habitat quality associated with climate change and development. Two declining subpopulations contain about 99% of the Eastern Migratory population; the George River has declined by 99% over 3 generations, and the Leaf River by 68% over two generations. Although migratory Caribou populations fluctuate in abundance, there is concern that recent and predicted threats will limit population growth in a population that presently is at its lowest recorded level. Threats appear to be less prevalent in the two western subpopulations which represent only about 4% of the existing total population. Most of the remaining Caribou reside in the Leaf River subpopulation, which continues to decline. |
Applicability of criteria
| Summary items | Information |
|---|---|
| Criterion A (Decline in Total Number of Mature Individuals) | Meets Endangered A2acd+4acd due to a decline of 80% over three generations (based on aerial surveys, harvest, and change in quality of habitat). An ongoing decline is predicted. |
| Criterion B (Small Distribution Range and Decline or Fluctuation) | Not applicable. Range exceeds criteria thresholds. |
| Criterion C (Small and Declining Number of Mature Individuals) | Not applicable. Population size exceeds criteria thresholds. |
| Criterion D (Very Small or Restricted Population) | Not applicable. Population size exceeds criteria thresholds. |
| Criterion E (Quantitative Analysis) | Not applicable. Population viability analysis not conducted. |
Technical summary – torngat mountains population (designatable unit 10)
- Scientific name:
- Rangifer tarandus
- English name:
- Caribou – Torngat Mountains population (Designatable Unit 10)
- French name:
- Caribou – Population des monts Torngat (Unité désignable 10)
- Range of occurrence in Canada (province/territory/ocean):
- Newfoundland & Labrador, Quebec, Nunavut
Demographic information
| Summary items | Information |
|---|---|
Generation time (usually average age of parents in the population; indicate if another method of estimating generation time indicated in the IUCN guidelines (2011) is being used) Based on a sample of known-age breeding-age females of the Eastern Migratory population. |
Range of 6 - 7 years |
| Is there an observed continuing decline in number of mature individuals? Estimate of approximately 5000 (all ages) in 1980, to 930 (698 mature) Caribou in 2014. Mortality of radio-collared adults ca. 40% in 2011-2013 (n=35). | Yes |
Estimated percent of continuing decline in total number of mature individuals within 2 generations. Continued decline expected based on demographic data and threats. |
Unknown, but decline expected |
| Estimated percent reduction in total number of mature individuals over the last 3 generations. The decline from 1980 to 2014 is approximately 81%, over 34 years, a period of approximately 4 – 5 generations (3-generation length range = 18 – 21 years). | Unknown, but decline evident |
| Projected percent reduction or increase in total number of mature individuals over the next 3 generations (18 - 21 years). | Unknown, but increase not expected |
Percent change in total number of mature individuals over any 3 generations (18 - 21 years) period, over a time period including both the past and the future. Decline is evident but difficult to quantify because of limited estimates during generation periods; future decline is predicted, but not readily quantified. |
Unknown, but decline evident; increases are unlikely |
Are the causes of the decline clearly reversible, understood, and ceased? Some causes are understood but have not ceased; mortality rates appear unsustainable and climate change effects continue. |
Partially |
Are there extreme (i.e., >10X) fluctuations in number of mature individuals? Decline over 35 years has been approximately 5X but there are only two population estimates. |
Unknown |
Extent and occupancy information
| Summary items | Information |
|---|---|
| Estimated extent of occurrence AOO considered same as EO due to extensive use of range. | 28,000 km2 |
Index of area of occupancy (IAO) (Always report 2x2 grid value). Size of calving area unknown. |
Unknown |
| Is the population “severely fragmented” Population exists as a single subpopulation. | No |
| Number of “locations” See Definitions and Abbreviations on COSEWIC website and IUCN (Feb 2014) for more information on this term. (use plausible range to reflect uncertainty if appropriate) Threats such as overharvest and impact of development vary across large area. |
Many |
| Is there an observed decline in extent of occurrence? Range has contracted towards the north, probably by <20%. | Yes |
Is there an observed continuing decline in index of area of occupancy? Area of calving unknown but general population decline suggests loss of locations. |
Not observed, but expected |
Is there an observed continuing decline in number of subpopulations? There is a single subpopulation. |
No |
Is there an observed continuing decline in Number of “locations” Fate of specific locations unknown but general population decline suggests loss of locations. |
Not observed, but expected |
Is there an observed continuing decline in extent and/or quality of habitat? Climate change effects are becoming more evident in the tundra; impact not well understood. |
Yes |
| Are there extreme fluctuations in number of subpopulations? | No |
| Are there extreme fluctuations in Number of “locations” See Definitions and Abbreviations on COSEWIC website and IUCN (Feb 2014) for more information on this term.? |
Unknown |
| Are there extreme fluctuations in extent of occurrence? | No |
| Are there extreme fluctuations in index of area of occupancy? | Unknown |
Number of mature individuals (in each subpopulation)
| Summary items | Information |
|---|---|
| Subpopulations (give plausible ranges) | N Mature Individuals |
| Torngat Mountains Number of mature individuals is based on 75% of estimated population size in 2014 (930), which excludes animals ≤2 years old. | 698 |
| Total | 698 |
Quantitative analysis
| Summary items | Information |
|---|---|
Probability of extinction in the wild is at least 20% 5 generations (30 years). PVA has not been conducted. |
Unknown |
Threats (direct, from highest impact to least, as per iucn threats calculator)
| Summary items | Information |
|---|---|
| Overall threat score was ‘High’, based on concerns over overharvest by people and an expected decrease in tundra habitat quality associated with climate change. | The main limiting factor would be summer forage availability. |
Rescue effect (immigration from outside Canada)
| Summary items | Information |
|---|---|
| Status of outside population(s) most likely to provide immigrants to Canada. | This DU does not exist outside Canada |
| Is immigration known or possible? | NA |
| Would immigrants be adapted to survive in Canada? | NA |
| Is there sufficient habitat for immigrants in Canada? | NA |
| Are conditions deteriorating in Canada? See Table 3 (Guidelines for modifying status assessment based on rescue effect). |
Partially |
| Are conditions for the source population deteriorating? See Table 3 (Guidelines for modifying status assessment based on rescue effect). |
NA |
| Is the Canadian population considered to be a sink? See Table 3 (Guidelines for modifying status assessment based on rescue effect). |
NA |
| Is rescue from outside populations likely? | NA |
Data sensitive species
| Summary items | Information |
|---|---|
| Is this a data sensitive species? | No. |
Status history
| Summary items | Information |
|---|---|
| COSEWIC | Designated Endangered in November 2016. |
Status and reasons for designation
| Summary items | Information |
|---|---|
| Status | Endangered |
| Alpha-numeric codes | C2a(ii) |
| Reasons for designation: | This population is restricted to the Ungava Peninsula of eastern Quebec, northern Labrador, and Nunavut (Killiniq and adjacent islands). A quantitative trend is not available because survey data are limited, but the total population was estimated to be 5,000 individuals in 1980 and 930 individuals in 2014, suggesting a significant decline. Aboriginal Traditional Knowledge also indicates a decline. The population meets Endangered status because the estimated 698 mature animals exist in a single population, a population decline is evident, and a decline is predicted to continue because of harvest and a decrease in habitat quality associated with climate change. The population may be facing imminent extinction because of the low numbers remaining. |
Applicability of criteria
| Summary items | Information |
|---|---|
| Criterion A (Decline in Total Number of Mature Individuals) | Not applicable. An 80% population decline exists over 4-5 generations but % decline is not known for shorter periods. |
| Criterion B (Small Distribution Range and Decline or Fluctuation) | Not applicable. Range exceeds criteria thresholds. |
| Criterion C (Small and Declining Number of Mature Individuals) | Meets Endangered C2a(ii); mature population is contained in a single population estimated at 698 Caribou. |
| Criterion D (Very Small or Restricted Population) | Meets Threatened D1; < 1000 mature animals. |
| Criterion E (Quantitative Analysis) | Not applicable. Population viability not conducted. |
Preface
Six “nationally significant populations” of Woodland Caribou were identified by COSEWIC in 2002 and listed under SARA (Species at Risk Act) as: Northern Mountain population (Special Concern), Southern Mountain population (Threatened), Boreal population (Threatened), Forest-tundra population (not assessed), Atlantic-Gaspésie population (Endangered), and the insular Newfoundland population (Special Concern; 2014) (COSEWIC 2002). In 2011, COSEWIC adopted a designatable unit structure for all Caribou in Canada (COSEWIC 2011); the Eastern Migratory population (DU4), and the Torngat Mountains population (DU 10) are assessed in this report for the first time.
COSEWIC acknowledges Steeve D. Côté and Marco Festa-Bianchet for writing the provisional status report, prepared under contract with Environment and Climate Change Canada. The contractors’ involvement with the writing of the status report ended with the acceptance of the provisional report. Modifications to the status report were overseen by Graham Forbes, Co-chair of the COSEWIC Terrestrial Mammals Specialist Subcommittee (TM SSC), based on comments from jurisdictions, external experts, the TM SSC, and COSEWIC members.
COSEWIC history
The Committee on the Status of Endangered Wildlife in Canada (COSEWIC) was created in 1977 as a result of a recommendation at the Federal-Provincial Wildlife Conference held in 1976. It arose from the need for a single, official, scientifically sound, national listing of wildlife species at risk. In 1978, COSEWIC designated its first species and produced its first list of Canadian species at risk. Species designated at meetings of the full committee are added to the list. On June 5, 2003, the Species at Risk Act (SARA) was proclaimed. SARA establishes COSEWIC as an advisory body ensuring that species will continue to be assessed under a rigorous and independent scientific process.
COSEWIC mandate
The Committee on the Status of Endangered Wildlife in Canada (COSEWIC) assesses the national status of wild species, subspecies, varieties, or other designatable units that are considered to be at risk in Canada. Designations are made on native species for the following taxonomic groups: mammals, birds, reptiles, amphibians, fishes, arthropods, molluscs, vascular plants, mosses, and lichens.
COSEWIC membership
COSEWIC comprises members from each provincial and territorial government wildlife agency, four federal entities (Canadian Wildlife Service, Parks Canada Agency, Department of Fisheries and Oceans, and the Federal Biodiversity Information Partnership, chaired by the Canadian Museum of Nature), three non-government science members and the co-chairs of the species specialist subcommittees and the Aboriginal Traditional Knowledge subcommittee. The Committee meets to consider status reports on candidate species.
Definitions (2016)
- Wildlife species
- A species, subspecies, variety, or geographically or genetically distinct population of animal, plant or other organism, other than a bacterium or virus, that is wild by nature and is either native to Canada or has extended its range into Canada without human intervention and has been present in Canada for at least 50 years.
- Extinct (X)
- A wildlife species that no longer exists.
- Extirpated (XT)
- A wildlife species no longer existing in the wild in Canada, but occurring elsewhere.
- Endangered (E)
- A wildlife species facing imminent extirpation or extinction.
- Threatened (T)
- A wildlife species likely to become endangered if limiting factors are not reversed.
-
Special concern (SC)
(Note: Formerly described as “Vulnerable” from 1990 to 1999, or “Rare” prior to 1990.) - A wildlife species that may become a threatened or an endangered species because of a combination of biological characteristics and identified threats.
-
Not at risk (NAR)
(Note: Formerly described as “Not in any category”, or “No designation required.”) - A wildlife species that has been evaluated and found to be not at risk of extinction given the current circumstances.
-
Data deficient (DD)
(Note: Formerly described as “Indeterminate” from 1994 to 1999 or “ISIBD” [insufficient scientific information on which to base a designation] prior to 1994. Definition of the [DD] category revised in 2006.) - A category that applies when the available information is insufficient (a) to resolve a species’ eligibility for assessment or (b) to permit an assessment of the species’ risk of extinction.
The Canadian Wildlife Service, Environment and Climate Change Canada, provides full administrative and financial support to the COSEWIC Secretariat.
Wildlife species description and significance
Name and classification
Class: Mammalia
Order: Artiodactyla
Family: Cervidae
Scientific name: Rangifer tarandus (Linnaeus 1758)
Common Names: Caribou (English and French); Minunasawa atikw (Innu Aimun); Ahtik/Atik (Cree); Tuttu (Inuktitut) (see COSEWIC 2012 regarding Aboriginal names).
Caribou are important socially, culturally, and economically for many Aboriginal cultures (e.g., Gordon 2003, 2005; Polfus et al. 2016) and have names in many languages. COSEWIC (2012) maintains an extensive list of Caribou names, used with permission from Aboriginal Traditional Knowledge (ATK) collections. Reindeer is the common name in Eurasia. Reindeer have been introduced to parts of Alaska, the Northwest Territories, Newfoundland, and the Belcher Islands (Røed et al., in press). Only non-introduced Caribou are assessed in this report.
Taxonomic terminology in Caribou living in non-Arctic regions is confusing because similar terms (e.g., woodland, boreal, and forest-dwelling) have been used to describe ecotypes and subspecies interchangeably. This report follows the designatable unit (DU) structure outlined in COSEWIC (2011) that identified 12 DUs (one extinct) of Caribou in Canada. DU delineation was based on five lines of evidence: (1) phylogenetics; (2) genetic diversity and structure; (3) morphology; (4) movements, behaviour, and life history strategies; and (5) distribution (COSEWIC 2011). Morphological, behavioural, and genetic differences among Caribou have been explained by large spatio-temporal processes associated with glacial advances, refugia, and re-colonization. Climate-driven range fluctuations during the Pleistocene re-shaped Rangifer distribution after the last glaciation (Grayson and Delpeche 2005; Sommer et al. 2011; Yannic et al. 2014). Røed et al. (1991) concluded that Caribou re-colonized North America and Eurasia from at least two refugia: one north of the Beringia-Eurasia ice sheet and one south of the North American ice sheet (Yannic et al. 2014). Postglacial expansion of Caribou from south of the North American ice sheets likely dates back 14,000 - 22,000 years from three refugia: the Rocky Mountains, east of the Mississippi, and the Appalachians (Klütsch et al. 2012). These refugia corresponded to distinct genotypic lineages that diverged before the last glacial maximum (38,000 - 48,000 years ago).
This report assesses the status of two DUs: the Eastern Migratory population (EM) and the Torngat Mountains population (TM) (Figure 1). The EM is identified based on behaviour and genetic distinctiveness, being the only group of migratory Caribou that originated mostly from the North American lineage (COSEWIC 2011). The TM population is identified as a DU based on their distinct morphology, and especially their behavioural patterns; movement behaviours resemble other ‘mountain’ Caribou in western Canada (i.e., DUs 7, 8), including use of seasonal elevational migrations to distinct ranges, and forming dispersed (rather than aggregated) distribution during calving (COSEWIC 2011).
Long description for Figure 1
Map illustrating the approximate range of the Torngat Mountains Caribou population and the four subpopulations of the Eastern Migratory Caribou. Areas where populations overlap are indicated. The Torngat Mountains Caribou are confined to the northern tip of a peninsula bounded by Ungava Bay and the Labrador Sea and which includes parts of Quebec, Newfoundland and Labrador, and Nunavut. The Eastern Migratory Caribou range from the Manitoba-Ontario border to Labrador, except for a gap along the western coast of James Bay.
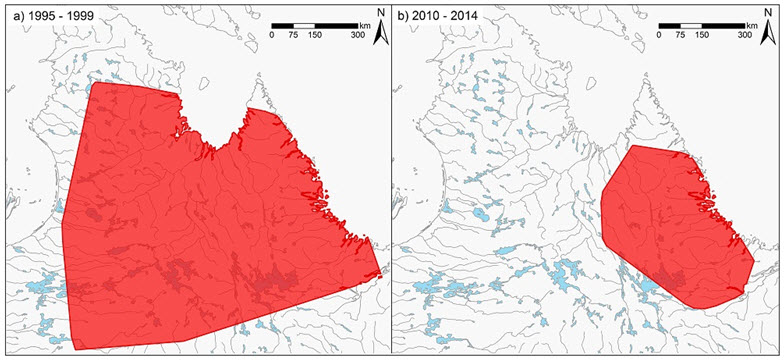
Long description for Figure 2
Two maps illustrating the range of the George River subpopulation of the Eastern Migratory Caribou in the late 1990s (map a) and between 2010 and 2014 (map b), based on satellite tagging. The maps reveal a range contraction of approximately 85 percent.
Although there is some gene flow between adjacent DUs (e.g., Boulet et al. 2007; Yannic et al. 2016), recent genetic analyses has supported the DU designations. Klutsch et al. (2016) analyzed 10 microsatellite loci of >1300 Caribou from northern Ontario and northeastern Manitoba and concluded that the migratory ecotype (i.e., EM; DU4) originated from genetic introgression of Barren-ground Caribou during the Late Pleistocene (approximately 14,000 ybp), and then further differentiation in the Holocene, following glacial retreat (approximately 7,000 ybp), and revegetation of the landscape. As well, genetic analyses using 16 microsatellite loci of 560 Caribou from Quebec and Labrador concluded that EM and TM originate from the same North American lineage but differences are significant enough to support the differentiation of EM and TM DUs (Yannic et al. 2014, 2016).
Morphological description
Caribou exhibit large variation in morphology, ecology, and behaviour across their range (Geist 1998; Couturier et al. 2010). They are medium-size deer that possess relatively long legs, crescent-shaped hooves, and broad muzzles with large nostrils. The hooves are very large, often wider than they are long, and well suited to walk on deep soft snow, dig through crusted snow for forage, and swim. Coat colouration varies seasonally and between DUs. Generally, EM Caribou are almost white in winter and light to medium brown during summer. TM Caribou have a similar coat colour.
Antler morphology varies by ecotype, sex, age, and season within the EM (Thompson and Abraham 1994; Abraham and Thompson 1998; Pond et al. 2016). Antler mass and size vary with environment and nutrition (Bergerud et al. 2008). For example, classified counts between 2000 and 2012 revealed that 15 - 20% of adult females in the Leaf River subpopulation were antlerless, and the antlerless proportion in the George River subpopulation over this period declined from about 12% to less than 5%, which possibly reflected improved body condition as Caribou density declined (Caribou Ungava unpub. data).
Population spatial structure and variability
COSEWIC uses the term ‘subpopulation’ for populations within a species’ or DU range. In Caribou literature, terms such as herd, range, and local population often are used for groupings below the DU level. Delineation of these ‘sub-units’ can be difficult (Environment Canada 2011; Nagy 2011). The EM DU currently includes four subpopulations: Cape Churchill, along the coastal part of the Manitoba-Ontario border; Southern Hudson Bay (formerly named as Pen Islands, Hudson Bay Coastal Lowland herd, or Migratory Southern Hudson Bay Caribou; Abraham pers. comm. 2016) along the coastal Manitoba - Ontario border, but extending southeast to Cape Henrietta Maria; Leaf River (in French; Rivière-aux-Feuilles) in northern Quebec; and George River (Rivière-George) in Quebec and Labrador.
These subpopulations are recognized based on demography and distribution, as well as possessing enough genetic differences to warrant subpopulation status (Kutsch et al. 2012, 2016; Yannic et al. 2016) but the differences are not distinct and significant enough to warrant each being separate DUs (COSEWIC 2011). The Eeyou Marine Region Wildlife Board suggests that the Leaf River and George River supopulations should have separate status reports because of concerns that threats are different for each, and combining them would lessen their importance (Pachano pers. comm. 2016). It is noted that COSEWIC does not use threats or management units as a criteria to delineate DUs. However, threats are discussed separately by subpopulation.
Subpopulations of migratory Caribou traditionally have been delineated based on the location of their calving grounds. The spatial location of calving grounds, however, can shift substantially over time (Williamson 1997; Taillon et al. 2012a). Although subpopulation fidelity is generally very strong, individuals can switch, as documented by rare exchanges between the George River and the Leaf River subpopulations during a period of high abundance (Boulet et al. 2007). Both herds though are well monitored and there is no evidence of exchange based on radio-collared females since 2008 (MFFP unpub. data; Moores pers. comm. 2016). Caribou living in a specific calving ground also generally tend to use an associated wintering area, but, as recorded for the George River subpopulation since 2015 (Government of Newfoundland and Labrador unpub. data), wintering areas can change in size and location over time, partly in response to changes in subpopulation size, climate, and food availability (Le Corre et al., 2014, unpub. data).
There are no data on population structure for the TM population.
Special significance
Caribou are integral to the ecology, economy, and culture of much of northern Canada (Festa-Bianchet et al. 2011). They are the most abundant large mammal in much of their range, providing food, tools, and clothes to people for thousands of years (Gordon 2003, 2005). Caribou continue to play a vital role in societal cohesion and form the basis of many legends and spiritual practices that depict the strong relationships linking them to Aboriginal people (Hummel and Ray 2008; Vors and Boyce 2009). Both EM and TM Caribou are hunted for subsistence, and some subpopulations are hunted for sport (i.e., non-Aboriginal harvest), both of which generate significant economic contributions (Wells et al. 2011). The decline in Caribou subpopulations in several regions of the Arctic is having strong negative impacts on northern communities, especially through food security issues.
Distribution
Global range
Rangifer has a widespread circumpolar distribution in the boreal, subarctic, and arctic biomes. Most Reindeer are found in Norway, Sweden, Finland, and Russia, while Caribou occupy large portions of northern Canada, Greenland and Alaska (Røed et al. in press). EM and TM Caribou are found entirely within Canada.
Canadian range
Eastern Migratory population
The four subpopulations within the Eastern Migratory DU range from the Manitoba - Ontario border (Cape Churchill subpopulation) to Labrador (George River subpopulation), except for a gap along the western coast of James Bay (Figure 1). The George River and Leaf River subpopulations in the east part of the range overlapped during part of the year, until recently (Government of Newfoundland and Labrador unpub. data), as do the Cape Churchill and Southern Hudson Bay subpopulations in the west, but there is no contact recorded between the eastern and western subpopulations (MFFP unpub. data). The ranges of Southern Hudson Bay, Leaf River, and George River subpopulations partially overlap with ‘sedentary Caribou’ (i.e., non-migratory Woodland/ Boreal Caribou [DU6]) in winter (COSEWIC 2011; Rudolph et al. 2012; Pond et al. 2016; unpub. data from Caribou Ungava, Government of Newfoundland and Labrador). The Cape Churchill subpopulation in the northern range of the EM DU in Ontario-Manitoba overlaps in winter with the Qamanirjuaq subpopulation of DU3 (COSEWIC 2011). The recent range of the George River subpopulation is mainly in Labrador, and partially overlaps with the Torngat Mountains population, for part of the year (Figure 1).
Torngat Mountains population
The TM population is confined to the northern tip of the peninsula (hereafter, ‘Quebec - Labrador Peninsula’) bounded by Ungava Bay and the Labrador Sea, which includes parts of Quebec, Newfoundland and Labrador, as well as Nunavut (Killiniq and adjacent islands) (Figure 1).
Extent of occurrence and area of occupancy
The extent of occurrence for the EM population is very large (> 2 million km2) and covers an area from Labrador to the west coast of Hudson Bay (Figure 1). The area of occupancy (AOO) is composed of the ranges of the four subpopulations, some of which overlap for part of the year. Calving areas could be considered the smallest area essential to Caribou survival but the size of the calving grounds is not known, except for George River (Figure 3). Also, the locations of calving areas aren’t fixed, but move over time within the AOO (e.g., George River subpopulation; Williamson 1997; Taillon et al. 2012a; Figure 3).
The entire range of each subpopulation is considered to be the AOO because there is likely very little unused space within the ranges. Caribou are very mobile and occupy different areas seasonally. In the Southern Hudson Bay subpopulation some proportion of the herd can be found in each seasonal range, regardless of season (Pond et al. 2016), suggesting much of the AOO is in use, even when some members are calving elsewhere. The AOO for the EM is > 1.5 million km2. The AOO for each subpopulation is: George River (937,395 km2; maximum since the 1990s); Leaf River (663,810 km2); Cape Churchill (27,192 km2); Southern Hudson Bay (310,000 km2). The total AOO is less than the subpopulation AOOs combined because sections of the subpopulations overlap (Figure 1). These estimates are based on space use patterns determined using VHF or satellite-tagged animals (Abraham et al. 2012; Berglund et al. 2014; Pond et al. 2016; Caribou Ungava unpub. data).
The relative use within an AOO changes over time. The Southern Hudson Bay subpopulation shifted its post-calving area a distance of 500 km eastward since the 1980s, but mainly during the 2000s (Abraham et al. 2012; Berglund et al. 2014; Newton et al. 2015; Pond et al. 2016).
The AOO of the George River subpopulation declined by approximately 85% between the 1990s and 2010 as the population declined (Figure 2). A decline in AOO of the Leaf River subpopulation is known but has not been quantified. The range of the Southern Hudson Bay subpopulation increased in the 1990s by approximately 30%. Changes in AOO has not been recorded for the Cape Churchill subpopulation. The overall change in AOO of the EM is difficult to measure because parts of the Leaf River subpopulation persist in areas abandoned by the George River subpopulation.
For the Torngat population, the EOO and AOO is 28,000 km2, based on space use patterns of satellite-tagged animals since 2011. Both ATK and satellite-based telemetry indicate that in recent years TM Caribou no longer occupy the Okak Bay area north to Hebron (Figure 4; Parks Canada Agency 2008; Wilson et al. 2014). Calving areas or other seasonal distribution have not been delineated but shifts in calving areas used by the TM Caribou have not been recorded.
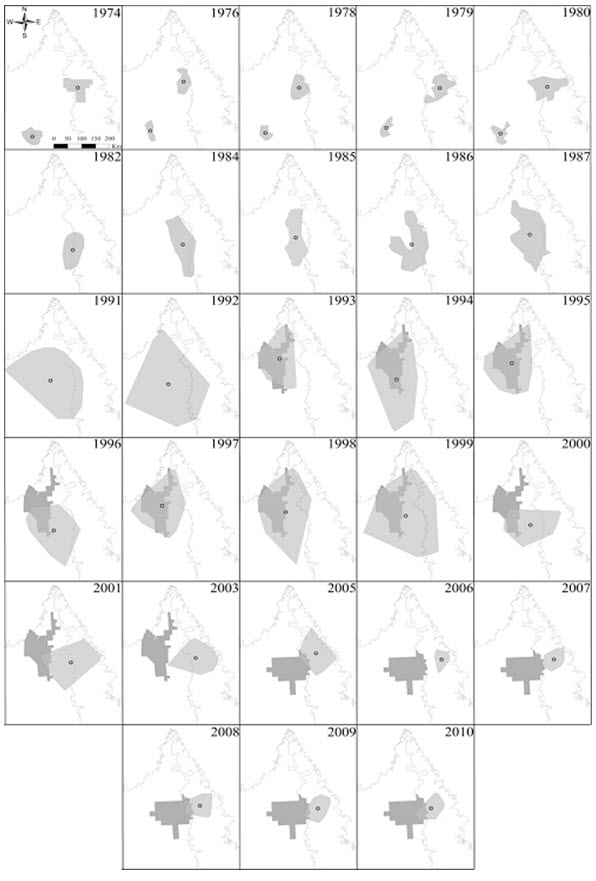
Long description for Figure 3
Series of maps for each year from 1974 to 2010 showing the location of calving grounds of the George River subpopulation of the Eastern Migratory Caribou. The centroid of each annual calving ground is indicated, as is the area of legal Wildlife Habitat.
Search effort
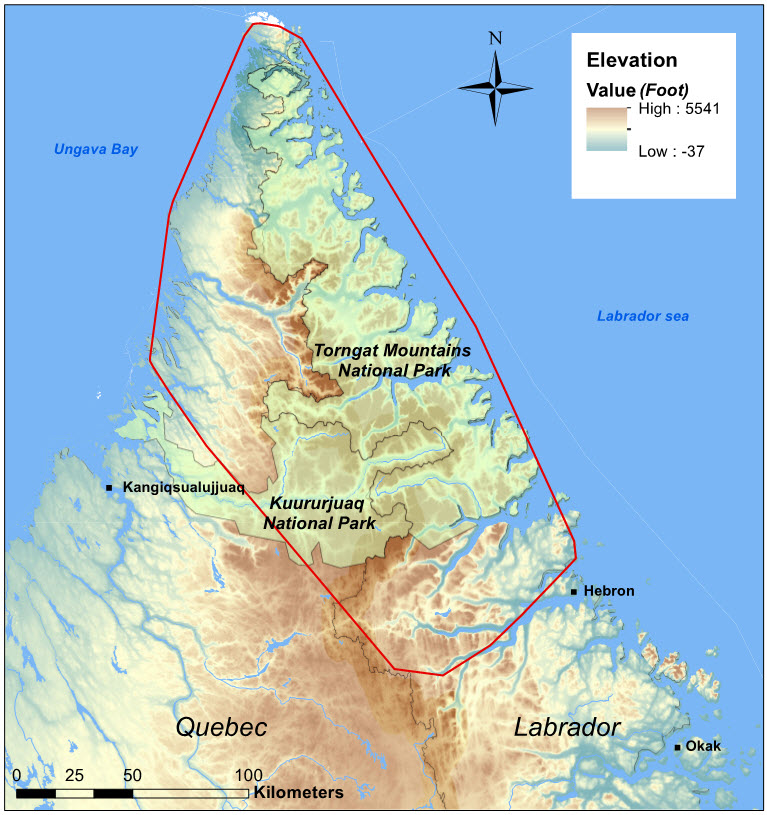
Long description for Figure 4
Map outlining the estimated range of the Torngat Mountains Caribou population, based on satellite tagging between 2011 and 2015.
The discussion on search effort is provided in the Population Sizes and Trends section because distribution and demographic data are derived from a common method of aerial surveys and/or capture and telemetry research.
Habitat
In this report, habitat includes the vegetative structures (e.g., taiga forest), and factors that influence survival and productivity (e.g., predation levels). ATK and western science show strong agreement on which factors constitute key Caribou habitat.
Habitat requirements
Habitat use
The large-scale selection of habitat is discussed in the Dispersal and Migration section.
Eastern Migratory population
ATK notes that females often travel to hillsides, mountain plateaus, and islands to calve, presumably to avoid disturbance from predators and humans (Wilson et al. 2014). Summer and calving habitat use is mainly associated with a variety of peatland complexes and an avoidance of rich conifer (Cedar [Thuja occidentalis], Larch [Larix laricina]) swamps, areas with dense snags, large fens (i.e., > 200 km2), and abundant tall shrubs such as willow (Salix spp.) (Berglund et al. 2014). In summer, Caribou use habitats rich in graminoids and deciduous shrubs and some individuals move to higher elevation plateau areas to give birth (Crête et al. 1990; Manseau et al. 1996). Selection for rich lichen feeding areas can be an important driver of Caribou distribution within the boreal forest, particularly during winter when lichen may be the only forage available (Mayor et al. 2009). Ground lichens are low in protein but are an important winter source of carbohydrates (Schaefer and Pruitt 1991; Côté 1998). Caribou of the George River subpopulation also tend to utilize higher elevation windblown barren areas where snow depth is less than in lower elevation forested areas (Pisapio pers. comm. 2016). Caribou may dig through snow to access terrestrial lichens, or forage on arboreal lichens on old trees (Williamson 1997). Mature and old coniferous forests generally have shallower snow and less crust than open forested areas; such areas are used for access to lichens, and as shelter from harsh winter conditions (Mosnier et al. 2003; Ferguson and Elkie 2004; Mayor et al. 2009). In the Southern Hudson Bay subpopulation, ‘Winter Use Areas’ are associated with soil and forest cover conditions that provide abundant ground lichen (Cladina and Cladonia species) (OMNRF 2014a), often in association with peatland complexes of fen, bog, and open-treed low conifer forest (Berglund et al. 2014).
Torngat Mountains population
Atk reports that tm caribou remain in treeless habitat most of the year (wilson et al. 2014) but make an annual altitudinal migration, using alpine tundra areas in summer, and valleys and lower elevations in winter (wilson et al. 2014; caribou ungava unpub. data). there is limited additional information on habitat use for the tm population but it is likely they generally use the same food types as the george river subpopulation. the relative importance of specific food species in tm range is unknown.
Habitat trends
Recent changes, and predicted future changes in the amount of shrub cover, are discussed in the Threats-Climate Change section.
Eastern Migratory population
The quantity and quality of vegetative habitat changes over time and likely causes the seasonal and long-term changes in distribution typical of migratory Caribou. Increased Caribou density is followed by local decline, which then may allow vegetation to recover (Crete et al. 1996; Bergerud et al. 2008; Newton et al. 2015). In the late 1980s and early 1990s, the high abundance of the George River subpopulation led to habitat degradation, including trampling and extensive loss of lichen cover (Manseau et al. 1996; Boudreau et al. 2003; Boudreau and Payette 2004; Théau and Duguay 2004). Lichen biomass in grazed areas of summer range in the George River subpopulation averaged 23 ± 14 g/m2, compared to 401 ± 14 g/m2 in ungrazed areas; lichen mats were absent, and Dwarf Birch (Betula nana) leaf biomass was half as abundant in grazed areas of shrub tundra habitat (Manseau et al. 1996). ATK reported evidence of Caribou eating low quality forage and trampling of foraging areas (Williamson 1997). Apparently, habitat has since partly recovered, but no recent quantitative measures of habitat quality are available (Caribou Ungava pers. comm. 2016). In the Southern Hudson Bay subpopulation, increased density of Caribou in coastal areas was associated with decreased plant biomass, which has not recovered after multiple years (Newton et al. 2014).
Hydroelectric development and mining activities occur within parts of the EM Caribou range and lead to changes in the amount of available structural habitat. These activities include landscape-level changes in surface hydrology and an expanded network of roads and other infrastructures, which provide access to more areas from where snowmobiles can be launched in winter. In addition, hydroelectric dams in Quebec and Newfoundland and Labrador have flooded large areas of the former winter range of the EM (Therrien et al. 2004). In the Southern Hudson Bay subpopulation, mining, forestry, or peat development is very limited or absent but a winter season road was recently built from Fort Severn to Shamattawa and Gillam, Manitoba that bisects the northern part of the Southern Hudson Bay range (Walton et al. 2011).
Torngat Mountains population
Trends in Caribou habitat are not well quantified but there are reported changes in the habitat of the TM associated with climate change; ATK reports that the Torngat Mountains are becoming greener (Parks Canada Agency 2008). Vegetation cover, especially shrub cover, has increased over the last decades (Fraser et al. 2011; Threats section). ATK in Wilson et al. (2014) documented observations of green growth at higher altitudes on mountainsides, and shrubs overgrowing old trails.
Biology
Life cycle and reproduction
The maximum recorded longevity for Caribou is 22 years but this animal was in captivity (Müller et al. 2010); in the wild, few males and females exceed 10 and 15 years, respectively (Thomas and Kiliaan 1998). Age structure within a Caribou population may differ over time because survival and fertility rates within each age class change. The wide fluctuations in numbers of migratory tundra Caribou are likely associated with changes in the average age of reproducing females, as age structure is younger during population growth phases than it is during declines (Clutton-Brock and Coulson 2002; Festa-Bianchet et al. 2003). Generation length in this report is based on the average age of parents within the population and therefore reflects the turnover rate of breeding individuals (IUCN Standards and Petitions Subcommittee 2013). In harvested species, such as Caribou, the harvest rate can modify the percentage of older breeders. Generation length was estimated to be 6 - 7 years, based on 196 known-aged breeding females collected from the George River subpopulation in 1978 – 1985 (Caribou Ungava pers. comm.).
In Caribou populations, adult sex ratios are female-biased because age-specific survival is higher for females than for males (Gaillard et al. 2000). Primiparity occurs between 2 and 4 years, depending on range quality (Bergerud 1971; Crête et al. 1996). Gestation lasts 215 - 230 days (McEwan and Whitehead 1972; Bergerud 1975) and females give birth to a single offspring. Females may conceive only in alternate years when forage is poor, or when body fat and protein reserves are reduced during lactation (Gerhart et al. 1997). Parturition is highly synchronized within a population and peaks in early to mid-June for the George River and the Leaf River subpopulations (Taillon et al. 2012a). Timing of parturition for the Southern Hudson Bay subpopulation is mid-May to early June (Abraham and Thompson 1998; Wilson 2013; Pond et al. 2016; Abraham pers. comm. 2016).
Caribou are polygynous (Kelsall 1968; L’Italien et al. 2012). The rut for EM in Quebec normally peaks in late October (S. Couturier et al. unpub. data) whereas rut in the Southern Hudson Bay subpopulation typically runs from mid-September to mid-October (Abraham and Thompson 1998; Abraham pers. comm. 2016). For TM Caribou, the rut has been recorded between mid-October and mid-November, with calving occurring from June 5-25 (Schaefer and Luttich 1998). ATK indicates rutting behaviour occurs from August into the fall (Wilson et al. 2014).
Physiology and adaptability
Caribou experience marked seasonal fluctuations in body fat and protein reserves, which reflects differences in forage quality and energetic stressors, such as deep snow, insect harassment, and breeding (Barboza et al. 2004; Barboza and Parker 2008; Vors 2013). During the snow-free season, Caribou consume nitrogen-rich herbaceous vegetation, essential for protein synthesis. Males may lose up to 25% of protein reserves during the rut (Barboza et al. 2004) and female protein stores are allocated to gestation and lactation (Gerhart et al. 1997; Taillon et al. 2013). Winter diet is nitrogen-poor because of this higher dependence on lichens, but Caribou cope with the dietary deficiency by conserving protein through several physiological mechanisms (Taillon et al. 2013). Caribou have lower energy requirements in winter, when they also reduce forage intake in response to reduced forage quality and availability. Under certain situations, they may gain fat in winter (Couturier et al. 2009), partly because they eat highly digestible terrestrial lichens (Côté 1998).
Dispersal and migration
Eastern Migratory population
Natal dispersal is not well studied, but ATK, and results from a large number of radio-collared animals have identified well-established seasonal migration patterns. Caribou in the EM perform long bi-annual migrations; they calve on high tundra plateaus or tundra areas with sparse vegetation, summer in tundra-like habitats, migrate to taiga and boreal forest in the fall, winter in taiga and boreal forest, and migrate in the spring to calving grounds. Strong gregariousness during migration means that the movements of individuals are not independent and do not simply represent a response to changing phenology of the environment or physiological cues (Dalziel et al. 2016). The migration to specific areas to calve is considered to be an anti-predator defence strategy by pregnant females wherein predators are satiated by high density of prey, and thus individuals gain a lower probability of losing their calf to predation (Bergerud 1996).
Telemetry research indicates that Caribou from the western subpopulations move from coastal areas to the interior each year; some segments of the subpopulation move in large circles between inland and coast over the year (Hedman unpub. data; Berglund et al. 2014). The mean annual home range for 19 radio-tagged female Caribou was 42,039 km2 ± 3,002 in 2009, and 67,809 km2 ± 2,472 for 32 Caribou in 2010 (Berglund et al. 2014). Until 30 years ago, most of the Southern Hudson Bay subpopulation calved and summered in the Pen Islands area of the Hudson Bay coast (near the border of Ontario and Manitoba) then moved inland in November to overwinter, and then back to the coast in February-March (Abraham and Thompson 1998, Magoun et al. 2005; Pond et al. 2016). The subpopulation presently has shifted eastward but seasonal movement continues between inland and coastal areas (Pond et al. 2016). There is extensive overlap with more sedentary Boreal Caribou (DU 6) in winter, but not during breeding, calving, and summer periods (Berglund et al. 2014; Pond et al. 2016). There is similar seasonal overlap between the Cape Churchill subpopulation and Barren-ground Caribou (DU3) (Elliot 1998).
Caribou of the eastern subpopulations generally migrate north and south (Figure 5). Telemetry studies and ATK indicate that migration corridors, routes, and distance covered can change from year to year (Williamson 1997; Furgal and Rochette 2007; Taillon et al. 2013; Le Corre et al. 2014; Government of Newfoundland and Labrador unpub. data). For instance, the migration routes of the George River subpopulation have changed tremendously since the early 1990s, concomitant with changes in population size (Le Corre et al. 2014). Animals from the Leaf River subpopulation used to migrate 200 - 300 km and remained on tundra habitats year round. However, they started migrating farther and began to use the area around the La Grande reservoirs during winter; the current migration of the Leaf River subpopulation is approximately 1000 km, the longest known for Caribou (Le Corre et al. 2014; Figure 5). Telemetry data does not indicate that there has been a merging of the George River and Leaf River subpopulations, at least since 2009 (Caribou Ungava, unpub. data; Figure 5).
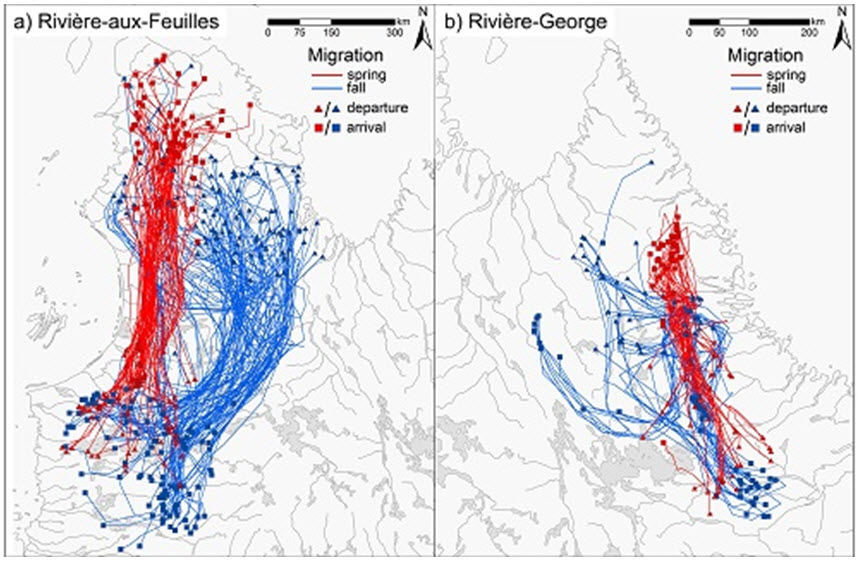
Long description for Figure 5
Deux cartes illustrant les migrations printanières et automnales de caribous suivis par satellite faisant partie de la sous population de la rivière aux Feuilles (carte a) et de la sous population de la rivière George (carte b), de 2009 à 2011.
Torngat Mountains population
The TM population migrates altitudinally (as is typical of the mountain ecotype; COSEWIC 2011), spending summers at high elevations. They also calve in a diffuse pattern, as opposed to the aggregated pattern observed in the migratory ecotype (Schaefer and Luttich 1998). Annually, their movements average 4.5 km/day, two to four times less than for migratory Caribou (Couturier et al. 2010; Caribou Ungava unpub. data).
The exact amount of movement or exchange of animals between the TM and EM populations is unknown but is considered enough to result in a similar genotype, but not enough to mitigate the ongoing population decline of the TM population (Boulet et al. 2007; Schmelzer pers. comm. 2016).
Interspecific interactions
Some of EM Caribou winter range overlaps with that of Moose (Alces alces) but the Moose density in much of the EM population range presently is low and interaction between these species is not considered to be significant. There is a general concern about Moose because increased Moose densities may result in higher Wolf (Canis lupus) density (Wilson et al. 2014; COSEWIC 2015); the avoidance of tall shrubs by Southern Hudson Bay Caribou was thought to relate to the presence of Moose, and an associated risk of Wolf predation (Berglund et al. 2014). The summer range of the Leaf River subpopulation overlaps with that of introduced Muskoxen (Ovibos moschatus) on the Ungava Peninsula. The Muskoxen population today extends over coastal areas of the Ungava Peninsula, as far as the Rivière aux Mélèzes (MFPP unpub. data). There is some concern about possible forage competition between Muskoxen and Caribou, but any effects to a population have not been established (Thomas and Edmonds 1984).
The spatial overlap with Caribou of DU 6 is discussed in the Canadian Range section.
Predation
Caribou are an important food for numerous predators and scavengers. Wolves, Black Bear (Ursus americanus), Lynx (Lynx canadensis), and Wolverine (Gulo gulo) prey on both adults and calves (Bergerud 1974; Gustine et al. 2006; Pinard et al. 2012; Leclerc et al. 2014). Golden Eagles (Aquila chrysaetos) andBald Eagles (Haliaeetus leucocephalus) may also opportunistically prey on calves (Crête and Desrosiers 1995Mahoney and Weir 2009). Migratory behaviour is assumed to take Caribou outside the range of most predators, particularly when animals are most vulnerable to predation, such as at calving (Bergerud and Page 1987). Some Wolves follow migratory Caribou over several hundred kilometres (Musiani et al. 2007) and similar events have been noted in the EM population, but it remains unclear if any of these wolves are provisioning pups at a den (Caribou Ungava unpub. data). ATK lists predation, especially from Wolves, as the 2nd most important threat to the TM population, after overhunting (Wilson et al. 2014).
Eastern Migratory population
Wolves are the main predator of EM Caribou, but Black Bears also prey on Caribou, particularly on calves (Veitch and Krizan 1996; Miller 2003; Cuerrier and the Elders of Kangiqsualujjuaq 2012). Wolves likely show a numerical response to Caribou numbers, possibly with a time lag of a few years (Hayes 1995; Williamson 1997). Preliminary findings indicate that the Wolf population in large portions of the current George River subpopulation range has declined concurrently with the severity and duration of the decline in Caribou (Government of Newfoundland and Labrador unpub. data). ATK also indicates a recent decrease in Wolf abundance on the George River subpopulation range. Black Bears are abundant in northern Quebec and especially in some coastal valleys of Labrador (Veitch and Krizan 1996). ATK indicates a recent increase in Black Bear abundance on the George River subpopulation range (Cuerrier and the Elders of Kangiqsualujjuaq 2012).
Torngat Mountains population
There is no information on predation for the TM population, although Wolves were likely more abundant there when the adjacent George River subpopulation was abundant in the early 1990s. Black Bears are present on the range of the TM; ATK indicates that they are predators of Caribou, albeit they are less efficient predators than are Wolves (Wilson et al. 2014).
Parasites
Gastro-intestinal parasites are very prevalent in Caribouand, while they may not cause obvious symptoms, they have energetic costs (Gunn and Irvine 2003; Kutz et al. 2012), and may reduce fecundity (Pachkowski et al., 2013). For Svalbard (Scandinavia) Reindeer, parasites appeared to play a role in regulating abundance (Albon et al. 2002). Trends in gastro-intestinal parasites are unknown but climate warming will likely change some host-parasite relationships (Gunn et al. 2011; Altizer et al., 2013).
Giant Liver Fluke (Fascioloides magna) have been recorded in migratory Caribou of northern Quebec and Labrador (Lankester and Luttich 1988; Simard et al. 2016). Prevalence of F. magna, Taenia hydatigena, and Cephenemyia trompe seems higher in adults than in calves (Simard et al. 2016). Prevalence and intensity of F. magna and prevalence of T. hydatigena appear to increase with population size. Caribou in the George River subpopulation had higher prevalence of F. magna than Caribou in the Leaf River subpopulation (Simard et al. 2016).
Besnoitia tarandi, a protozoan parasite, has been documented in other Caribou and Reindeer populations for almost a century, but little is known about its epidemiology, life cycle (Ducrocq et al. 2012, 2013), and transmissibility (Kutz et al. 2009). The parasite may be newly arrived to the eastern EM subpopulations because it first became a significant issue in the George River and Leaf River subpopulations in the mid-2000s (Kutz et al. 2009; Threats section).
Numerous other parasites and pathogens are suspected to impact Caribou, such as Toxoplasma gondii, Neospora caninum, Babesia sp., and Erysipelothrix rhusiopathiae (Johnson et al. 2010; Kutz pers. comm. 2016).
Samples collected from both migratory subpopulations in Quebec-Labrador in 2007-2009 were tested for serological prevalence of antibodies for Brucella, Neospora caninum, West Nile virus, Toxoplasma gondii, parainfluenza 3 virus, bovine herpes virus 1, respiratory syncytial virus, bovine diarrhea types I and II. Previous results suggest a very low prevalence for exposure to most of these pathogens (or related Rangifer cross-reacting pathogens) (Curry 2012).
Sampling effort and methods
ATK is valuable for documenting changes in relative abundance and distribution over long time periods. There is generally more ATK available for subpopulations in Quebec-Labrador than for those in Ontario (Brice-Bennett 1977; Williamson 1997; Cuerrier and the Elders of Kangiqsualujjuaq 2012; Wilson et al. 2014). Caribou also are counted with aerial surveys along flight lines and often use a standardized census method based on photographs taken during periods of aggregation (Abraham and Thompson 1998; Couturier et al. 2004). In general, estimating the size and composition of migratory Caribou is challenging because of their large ranges, wide movements, and an aggregated distribution that can result in high variability among surveys if the aggregation is missed in any particular survey year. The risk of under sampling is mitigated by ensuring surveys are conducted at the proper time of year, and by applying systematic coverage of close survey lines. Aerial work in Quebec is supplemented by ground observation using classified counts. Classified counts usually are made from ground level as Caribou migrate past the observer. During these counts, a few thousand Caribou are classified as either males (of four different size classes), females (with or without antlers), or calves. An attempt is made to distribute counting sites widely to obtain a reliable estimate of age-sex structure for the entire population.
Sex ratios are used to determine the proportion of adult females and males and to estimate recruitment (number of fawns) in the population each fall. Two of these indicators (recruitment and percentage of large males) are key indicators for monitoring these populations. The use of age ratios to assess population trends in ungulates has been criticized because they fail to account for differences in juvenile survival over the winter, or for the ratio of mature to immature females (Bender 2006). However, age ratios are valuable in situations of very low ratios over several years, which do indicate population decline.
Eastern Migratory population
More than 15 aerial surveys have been conducted since 1979 on the Southern Hudson Bay subpopulation, with increased monitoring since 2005 (Magoun et al. 2005; Newton et al. 2014). These population estimates are minimum counts rather than total population estimates because there is uncertainty on how much of the subpopulation was surveyed in some years (Abundance and Trends). The Southern Hudson Bay subpopulation was surveyed almost annually from 1982 – 1994, and movement assessed based on telemetry of > 50 adults (Abraham and Thompson 1998). In 2008 - 2011, a series of aerial surveys in northern Ontario and Manitoba determined the distribution of both Southern Hudson Bay Caribou, and 41 females were equipped with radio collars to delineate their migrations and area-use patterns (Newton et al. 2014). These efforts documented changes in area-use patterns and impacts of Caribou on vegetation. The Cape Churchill subpopulation has been surveyed twice and documented minimum population estimates. A three-year telemetry study (2010-2012) was done on movements of 19 Caribou from the Cape Churchill subpopulation, and 21 Caribou from the Manitoba side of the Southern Hudson Bay subpopulation (Hedman unpub. data).
Aerial surveys were conducted 12 times, from 1965 – 2016, for the George River subpopulation, with high precision photo censuses conducted four times in the last eight years. Aerial surveys were conducted eight times, from 1975 – 2016, for the Leaf River subpopulation. Aerial surveys conducted every few years were supplemented with classified counts (i.e., annual average 2,658; SE 250 in recent years in Quebec) during the autumn migration, beginning in 1973 for the George River subpopulation and in 1994 for the Leaf River subpopulation.
In addition, there has been extensive monitoring of eastern subpopulations of the EM through VHF, satellite, and GPS telemetry since 1986 by the governments of Newfoundland and Labrador, and Quebec, and several studies on body condition starting in the 1970s (e.g., Parker 1980; Huot 1989; Taillon et al. 2012b). Radio-collaring and monitoring effort increased after 2007. Locations of some EM Caribou were documented by various projects associated with environmental monitoring for low level airforce training exercises during the 1980-90s, but most of the work (approximately 90%) was conducted on Red Wine and Mealy Mountain subpopulations (Harrington and Veitch 1991), which form part of a different DU (DU6) (COSEWIC 2011). Sex-specific survival rates for Caribou in Quebec-Labrador have been estimated based on radio-collared animals. Caribou have been radio-collared since 1986 in the George River and since 1991 in the Leaf River subpopulation. Since 2007, a sample of female yearlings has been marked each year, providing information on known-age individuals. In 2014, the timing of marking of yearlings in the George River subpopulation was changed from June to April to avoid disturbing Caribou on or near the calving grounds. Therefore, with the exception of calf overwinter survival, there is good population dynamics information for the eastern subpopulations. In addition, data from radio-collared Caribou guide the design of aerial censuses. These data also provide yearly information on migratory patterns in time and space, range use, and changes in size and location of calving areas (Taillon et al. 2012a).
Torngat Mountains population
The initial estimated abundance and distribution of the TM Caribou was based on a 1980 reconnaissance survey of unknown reliability (Bélanger and Le Hénaff 1985). The first helicopter survey using distance sampling, which produced a population estimate with a confidence interval, was conducted in spring 2014 (Couturier and Mitchell Foley 2014). The 2014 survey is considered to be rigorous by industry standards. The survey covered 30,689 km2, which is the extended traditional winter range known from the 1980s-1990s, from the top of the Ungava-Labrador Peninsula southward to include the Okak Bay area (Schaeffer and Luttich 1998) with 81 transects (7,057 km total). The survey was conducted when movement is minimal and there is no overlap in the range of the George River subpopulation and the Torngat DU. Also, the observers were experienced and consistent during the short (i.e., 2-week long) survey period and it is unlikely any Caribou moved into previously surveyed areas. The authors are confident that detection probability was high and unbiased (Couturier and Mitchell Foley 2014).
ATK has been summarized in Wilson et al. (2014). Monitoring and research has been relatively limited on the TM population. A space use study was conducted in the 1990s (Schaefer and Luttich 1998) and a study on survival and habitat selection based on 35 animals equipped with satellite collars began in 2011 (Caribou Ungava unpub. data).
Abundance and trends
Eastern Migratory population
George river subpopulation
The most recent (2016) population estimate for the George River subpopulation is 8,938 ± 670 (Table 1). The number of mature animals is estimated to be 6,704. The mature population size is 75% of the total subpopulation size, based on the proportion of non-mature animals (i.e., ≤ 2 years old) recorded in surveys of the Leaf River and George River subpopulations (Government of Newfoundland and Labrador, Government of Quebec unpub. data).
| Subpopulation | Year of Estimate | Estimate(# + S.E.) | Type of Survey |
|---|---|---|---|
| George River | 2016 | 8,938 + 670 | Total count; photographic aerial survey |
| Leaf River | 2016 | 199,000 ± 15,920 | Total count; photographic aerial survey |
| Southern Hudson Bay | 2011 | 16,638 | Minimum count; photographic aerial survey |
| Cape Churchill | 2007 | 2,937 | Minimum count; photographic aerial survey |
The first population estimate for the George River subpopulation was 5,000 Caribou in 1954, but the survey area was constricted and the authors considered it to be a partial count (Banfield and Tener 1958). Simulation models based on stronger survey work done in later years, along with survival and recruitment rates, suggest that a minimum of 60,000 Caribou would have had to be alive in 1954 to grow to the record number estimated in 1993 (Rasiulis 2015). Desmeules and Brassard (1964) suggested that there were 61,800 Caribou in 1963, but did not provide an error for this estimate. The George River subpopulation increased after the late 1960s, peaking at 823,000 ± 102,000 Caribou in 1993 (Couturier et al. 1996). It then began to decline (Figure 6); by 2012, aerial surveys by the Quebec and Newfoundland and Labrador governments estimated the population at 27,600 ± 2,760 individuals, with a further decline to 14,200 ± 710 by 2014. A survey in 2016 estimated the total subpopulation at 8,938 ± 670 (90% C. I.) (unpub. data from Government of Newfoundland and Labrador, Government of Quebec).
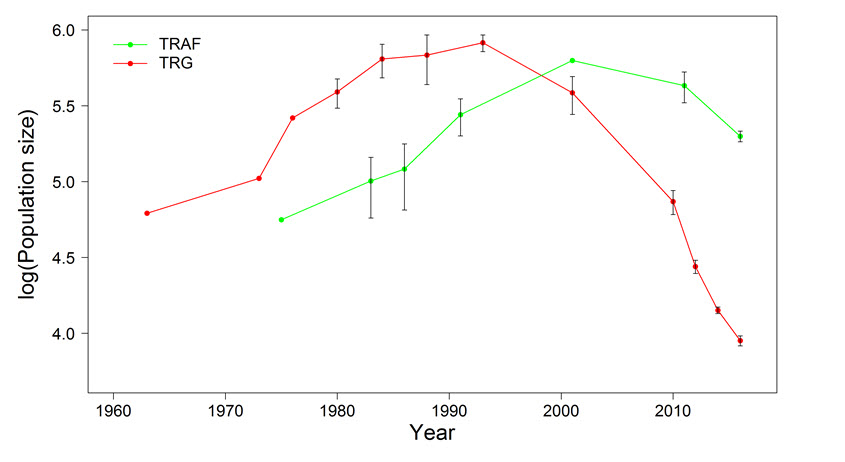
Long description for Figure 6
Chart illustrating log-transformed population estimates from aerial surveys for all ages of Eastern Migratory Caribou in the George River and Leaf River Caribou subpopulations, from 1963 to 2016. Standard error bars are presented where available.
Although it is unclear when this subpopulation peaked, the estimate in 2016 was 99% lower than the estimate from 1993, a time period of 23 years, which is near the 3-generation length range of 18 - 21 years. A 2-generation length range would be a comparison of a 12 - 14 year period (i.e., 2016 versus 2002 to 2004) and would compare the closest available survey year (2001) estimate of 385,000 to the most recent estimate of 8,938 in 2016, suggesting a decline of 98%. A 1-generation length range would be a comparison of a 6 – 7 year period (i.e., 2016 versus 2009 to 2010) and would compare the closest available survey year (2010) estimate of 74,000 to the most recent (2016) estimate of 8,938, suggesting a decline of 88% in 1 generation.
Leaf river subpopulation
The most recent (2016) population estimate for the Leaf River subpopulation is 199,000 ± 15,920 (Table 1). The number of mature animals is estimated to be 149,250, which is 75% of the total subpopulation size, based on the proportion of non-mature animals (i.e., ≤ 2 years old) recorded in surveys of the Leaf River and George River subpopulations (Caribou Ungava unpub. data).
The Leaf River subpopulation may have originated as an offshoot of the George River subpopulation and the first census in 1975 estimated 56,000 Caribou (Le Hénaff 1976). It appeared to increase steadily, and by 1991 it was estimated at 276,000 ± 76,000 (Figure 6). The next census in 2001 estimated a very high peak of 1,193,000 ± 567,100 (Couturier et al. 2004), but survey conditions were difficult and the estimate has a very wide confidence interval, making it less reliable than most recent estimates for the two subpopulations in Quebec-Labrador. A population projection exercise based on known rates of sex- and age-specific survival and of productivity, suggested that this subpopulation may have peaked in 2002 at about 500,000 (Rasiulis 2015), and never included more than 700,000 Caribou (Couturier et al. 1996). In this report, we use the lower confidence limit of 625,900 from the 2001 survey as the best available information. The population was estimated at 430,000 ± 98,900 in 2011 by the Quebec government, whose data on classified counts and area use suggest that it was stable between 2008 and 2013. Over the last few years, however, indices of decline, such as poor body condition of lactating females suggested the population was in decline (Taillon et al. 2011). In 2014, it had a very low fall recruitment rate of 14 calves/100 females (Taillon et al. 2016); evidence from recruitment and adult survival data indicates a significant demographic decline of the subpopulation between 2013 and 2014, and a more moderate decline in 2014 – 2015 and, according to Aboriginal users, especially Inuit and Cree hunters, the Leaf River subpopulation has decreased since 2011 (Taillon et al. 2016). The results of the 2016 survey estimated a total population size of 199,000 ± 15,920 (Table 1). The estimated mature population is 149,250 Caribou.
Discerning a trend in the Leaf River subpopulation relative to generation length is problematic because the subpopulation has been increasing and decreasing. A comparison of the estimate from the survey year closest to the 3-generation length period (range of 18 to 21 years; i.e., 1990 to 1993) would be a comparison of the 1991 estimate (276,000) to the 2016 survey (199,000), and suggests a decrease of 28% over the last 3-generation range. However, this method missed the peak population of approximately 625,000 that occurred in mid-2000s (Figure 6). A 2-generation length range would be a comparison of a 12 – 14 year period (i.e., 2016 versus 2002 to 2004) to the latest (2016) survey. The closest survey year is 2001, when 625,900 Caribou were estimated; although not exactly within the generation length period, the decline from 2001 to 2016 would be 68%. A 1-generation length range would be a comparison of a 6 – 7 year period (i.e., 2016 versus 2009 to 2010) to 2016. The closest year is 2011, when 430,000 Caribou were estimated; the decline from 2011 to 2016 would be 54%.
Southern hudson bay and cape churchill subpopulations
There are no estimates of total population size of the western subpopulations of the EM because parts of the range were not surveyed. However, the most recent minimum population estimate of 16,638 Caribou was made for the Southern Hudson Bay subpopulation, and 2,937 Caribou for the Cape Churchill subpopulation (Table 1). (Note: In the status report, it is assumed that the proportion of mature animals in the population is similar to that found in the eastern subpopulations). Applying the 75% result to each western subpopulation suggests that the minimum number of mature Caribou in the Southern Hudson Bay subpopulation is 12,479, and 2,203 for the Cape Churchill subpopulation.
The lack of strong historical estimates for the western subpopulations makes it difficult to quantify changes in abundance. In the Southern Hudson Bay subpopulation, an increasing trend seemed apparent from 1979 – 1994, based on standardized photographic surveys (Abraham and Thompson 1998; Abraham pers. comm. 2016). Minimum population estimates were 2,300 (in 1979), 4,660 (1986), 7,424 (1989), and 10,798 (1994) (Abraham and Thompson 1998; Newton et al. 2015). Surveys from 2008 – 2011 indicated a decline but it is now believed that the decline was actually due to animals moving inland, where surveys had not been conducted (Newton et al. 2015; Abraham pers. comm. 2016). Surveys from 2008 - 2011 cannot be added to assess a trend because the location and timing of surveys after the late 2000s likely was not ideal; surveys were timed to coincide with the timing of greatest aggregation (late July – early August), as had been recorded earlier (Abraham and Thompson 1998), and which should have recorded most animals. However, satellite-tagged Caribou telemetry data showed that movement during the 2008 – 2011 surveys from coastal to inland areas was now occurring sooner in the year (late July – early August; Berglund et al. 2014) and an unknown number were not surveyed (Abraham pers. comm. 2016). The most recent minimum population estimate (2011) is 16,638 Caribou, of which 12,166 were in the inland aggregation (Berglund et al. 2014; Table 1).
The first estimate of the Cape Churchill subpopulation was of 58 animals in 1965 but survey effort was limited, followed by an estimated range of 1,800 – 2,200 animals in 1988 (Campbell 1994). In 1997 – 1998, the minimum estimate was 3,013 adults (Elliot 1998). Adults were identified based on relative size of adults and calves; this method differs from the 75% rule used on other subpopulations, but for the purposes of this report likely suffices because the Cape Churchill subpopulation is a small subpopulation, compared to the other three subpopulations. Analysis of aerial photography from three aerial surveys in July 2007 resulted in an estimate of 2,937 of all ages (Walton et al. 2011). The size of the mature population is estimated to be 2,203 animals. The trend is not known but is considered stable because minimum population estimates from 1998 and 2007 were similar.
Population and trends summary
Eastern Migratory population
The minimum population size for the EM is 227,513 Caribou (of all ages), based on the most recent total estimates for the Leaf River (2016) and George River (2016) subpopulations, and most recent minimum estimates for the Cape Churchill (2007) and Southern Hudson Bay (2011) subpopulations. Assuming 75% are mature, the estimated number of mature animals is 170,636. The population estimate for the EM population three generations ago was 1,111,698 Caribou, of which 833,774 were mature. Values are from the year of survey or minimum estimate nearest to the three generation length range (18 – 21 years) before that subpopulation’s most recent estimate: Cape Churchill (1,900 estimated in 1988; 1,425 mature; <1% of the EM population); Southern Hudson Bay (10,798 estimated in 1994; 8,099 mature; 1%); Leaf River (276,000 in 1991; 207,000 mature; 25%); and George River (823,000 in 1993; 617,250 mature; 74%). A comparison of these values to the most recent estimates suggests a decline in the EM population of 80% over three generations. The two eastern subpopulations comprised approximately 99% of the total EM population three generations ago, and approximately 96% presently.
The significance of a population decline is related to the extent that declines are part of natural fluctuations, and the likelihood that present-day declines will reverse. Natural fluctuations appear to exist for the two subpopulations in Quebec-Labrador, which have experienced dramatic fluctuations over time (Messier et al. 1988), as is typical of migratory Caribou (Payette et al. 2004; Vors and Boyce 2009). ATK indicates large fluctuations in migratory Caribou over time (Brice-Bennett 1977; Parks Canada Agency 2008). The analyses by Morneau and Payette (2000) of root scars in Black Spruce (Picea mariana) left by migrating Caribou at three sites along the George River suggest a population decline beginning about 1870. The decline appeared to steepen in 1905 - 1915, was followed by a slight increase in 1920 – 1930, and then another decline around 1940 (Bergerud et al. 2008). From 1950 to the late 1980s, root scars suggest a substantial increase in Caribou numbers (Morneau and Payette 2000). Fluctuations in the western subpopulations likely occur, but are not quantified.
The extent that populations will recover this time is less clear. The population of the George River subpopulation is at the lowest levels ever recorded (< 9,000 Caribou (of all ages) in 2016, compared to approximately 60,000 (of all ages) during the last recorded population low), and threats continue from overharvest. Impacts from development infrastructure, such as resource roads, mining, and ATV and snowmobile access, have increased since the earlier population low of the 1950s (Threats section). Lichen is a preferred forage species but there is evidence of tundra becoming greener with the increase of shrub cover associated with climate change, and there is some indication of increased numbers of Black Bear in the region (Threats section). The extent that these changes impact the ability of Caribou populations to increase are not well understood.
Torngat Mountains population
The most recent (2014) population estimate for the Torngat Mountains population is 930 individuals (range 616-1,453; Couturier and Mitchell Foley 2014). The extant mature population size is estimated as 698 animals.
Documenting a trend in the TM population is difficult because only two surveys have been conducted, and these were conducted over 30 years apart. The population was estimated at approximately 5,000 individuals in 1980, based on a reconnaissance survey (Bélanger and Le Hénaff 1985). Biologists from the Newfoundland and Labrador Wildlife Division noticed local declines of TM Caribou from the late 1990s through the early 2000s, and by 2005 suspected a significant decline had occurred, in part, because of range retraction from Okak Bay to Hebron (Blake pers. comm. 2015). An aerial survey in March 2014 did not document Caribou south of Hebron Fjiord, and suggested a much smaller population of 930 individuals (range 616 - 1453; Couturier and Mitchell Foley 2014). ATK suggests large variations in abundance through time, with a low in the 1940 - 1960s (Parks Canada Agency 2008; Wilson et al. 2014). More than 80% of people interviewed in Nunatsiavut, and 50% in Nunavik, believe that the TM population is decreasing (Wilson et al., 2014), but most people interviewed think that the Caribou have moved elsewhere. The area is large, but the 2014 aerial survey was flown using numerous survey lines over the entire area and it is not possible that a large segment of the population was missed (Couturier and Mitchell Foley 2014; Population Sizes and Trends section). The decline from 1980 to 2014 is approximately 81%, over 34 years, which is approximately a period of 4 – 5 generations (3-generation length range is from 18 to 27 years).
Survival and recruitment
Survival and recruitment rates often are used as an indicator of Caribou population health. Environment Canada (2008) suggested a minimum recruitment rate of 29 calves per 100 cows in late winter (i.e., calf:cow ratio of 0.29) for population stability, assuming a high and stable survival rate of adult females. Current Quebec government policy, based on data for migratory Caribou (Crête et al. 1996; Bergerud et al. 2008; Couturier et al. 2009), is to expect a stable subpopulation if the calf:cow ratio is at least 0.39 with adult female survival greater than 85%, and at least 0.34 if female survival is greater than 87%. The value of the indicator is debated; many studies of Caribou suggest that much variability in population growth rate is not explained by differences in calf recruitment (Gaillard et al. 2000). However, vital rates such as adult survival and calf survival are often correlated and high female mortality is likely associated with poor recruitment (Bergerud et al. 2008).
Eastern Migratory population
Over the last 25 years, survival of adult females has generally been higher in the Leaf River subpopulation than in the George River subpopulation (Figure 7). These differences coincide with the differences in population trends of these subpopulations (Figure 7). Recent estimated adult female survival rate of the Leaf River subpopulation was 84% (in 2014 – 2015), and 85% (2015 – 2016) (Taillon et al. 2016).
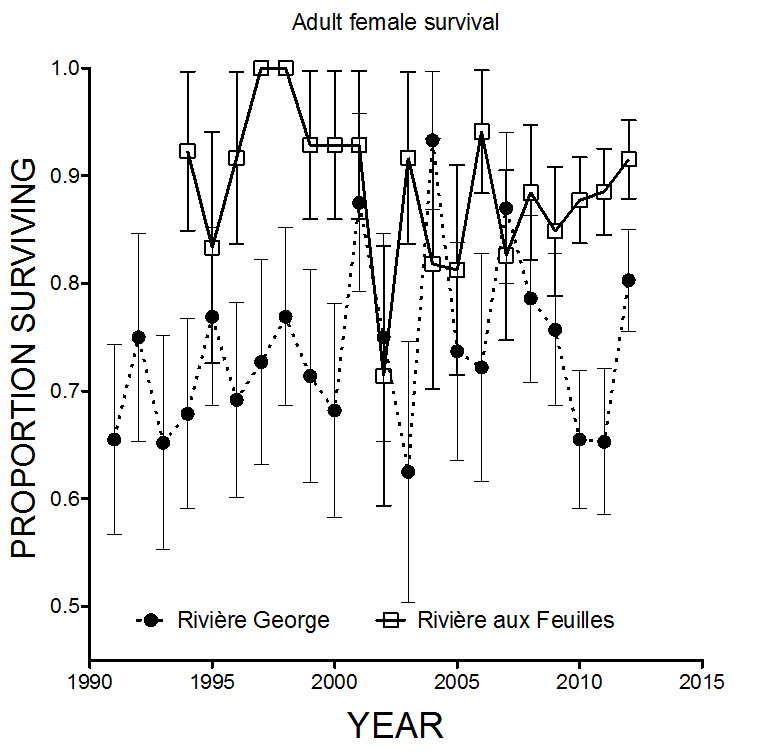
Long description for Figure 7
Chart illustrating estimated survival rates of radio-collared adult female Eastern Migratory Caribou in the George River and Leaf River subpopulations, with standard error, from the early 1990s to the mid-2010s.
In 1984, the annual survival rate of adult females in the George River subpopulation was estimated at 95% (Crete et al. 1996). Since 1991, survival of radio-collared adult females of the George River subpopulation has been greater than 80% for only three years, although, for two of those years, the sample was < 20 animals. Survival rates for 1991 - 2000 were likely underestimated because the heavy satellite collars deployed then appeared to artificially increase mortality rates (Rasiulis et al. 2014). Much lighter collars have been deployed since 2001, of a weight comparable to that of VHF collars used in 1991 - 2000 that did not appear to affect Caribou survival (Rasiulis et al. 2014). Survival of adult females in the George River subpopulation has remained below 80% in nearly all years (average 68%) from 2001 – 2014. Low recruitment and low survival suggests a population decline of more than 70% between 2009 - 2011. The survival of adult females in 2013 - 2014 is estimated to be 84% (MFFP unpub. data). Survival rates of adult females in the George River subpopulation are also calculated by the Government of Newfoundland and Labrador but also include data from collared female Caribou killed by hunting; since 2000 – 2001, all years (except for two) are below 80% survival (average 55%). The survival of adult females in 2013 - 2015 is estimated to be 76% (Government of Newfoundland and Labrador unpub. data).
Data on radio-collared males available from 2007 - 2012 for the Leaf River subpopulation indicated average survival rate of 78% (N = 135 male-years), declined to 70% in 2013-2014 and 66% in 2014 – 2015, but increased to 86% in 2015 - 2016. From 2009 – 2015, average male survival for the George River subpopulation was only 51% (annual range 31-64%, N = 127 male-years) (Taillon et al. 2016; MFFP unpub. data).
For many years, hunting parties of the Cree, Inuit, and Naskapis have noted a decreasing proportion of large males and considered the change to be a significant impact to the Leaf River subpopulation (Smart pers. comm. 2016). Survey data confirmed these declines during recent years in both subpopulations, although apparently more so in the George River subpopulation (Figure 8). The proportion of males classified as ‘large’ declined in both subpopulations, which ranged from 10 - 20% in 1994 - 2006 and 2 - 6% in most years since 2008 (MFFP unpub. data). That proportion appeared to increase in 2012 - 2013 (Figure 8), but for the George River subpopulation it was still only 5% in 2015. Theories on the cause of the decline have been related to overhunting, sport hunting selection for larger males, and the potential role of Besnoitia tarandi (Parasites section) (MFFP pers. comm. 2016; McCarthy pers. comm. 2016).
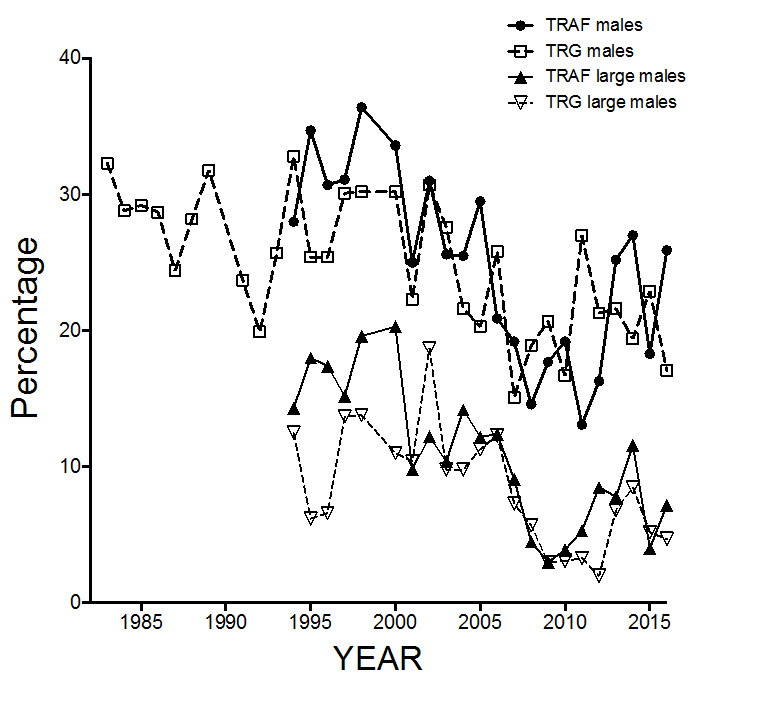
Long description for Figure 8
Chart illustrating proportion of males of all size classes and of large males seen during autumn classified counts in the George River and Leaf River subpopulations of the Eastern Migratory Caribou, from the early 1980s to the mid-2010s.
Yearling females radio-collared in 2005 - 2012 had higher survival in the Leaf River subpopulation (77%, N = 103) than in the George River subpopulation (63%, N = 92). Although survival rates of yearling females have not been documented in other migratory Caribou populations, estimates of yearling survival in 16 populations of ungulates (Gaillard et al. 2000) averaged 87%, suggesting that survival of yearling female Caribou, particularly for the George River subpopulation, is low. The survival of radio-collared yearling females in the George River subpopulation declined in recent years, from 82.5% in 2005 - 2008 (N = 40) to only 48% in 2009 - 2013 (N = 52). The very low yearling survival must be considered in context with the very low calf:female ratios observed during recent years (except 2014) in this subpopulation. For example, counts in 2010 - 2013 suggested an average of 8.4 calves per 100 females. Combined with the average yearling female survival measured in 2009 - 2012, the recruitment rate of 2-year-old females would have been at most 4%, or 5 - 6 times lower than the rate of loss of adult females (Figure 7). As well, this recruitment rate is an overestimate because it does not account for mortality of calves during their first winter.
Classified counts conducted in the autumn suggested substantial variability in recruitment, but indicate a recent deterioration in recruitment for the George River subpopulation (Figure 9). The number of calves/100 adult females was 12 or less from 2010 to 2013, but increased to 27 in 2014 and 34 calves/100 adult females in 2015, then declined in 2016. Calf recruitment in the Leaf River subpopulation since 2001 has been generally around 34 calves/100 adult females but three years (2004, 2007 and 2014) were much lower, at 14 – 17 calves/100 females, of which the lowest recorded occurred in 2014 (MFFP unpub. data, pers. comm. 2016) (Figure 9).
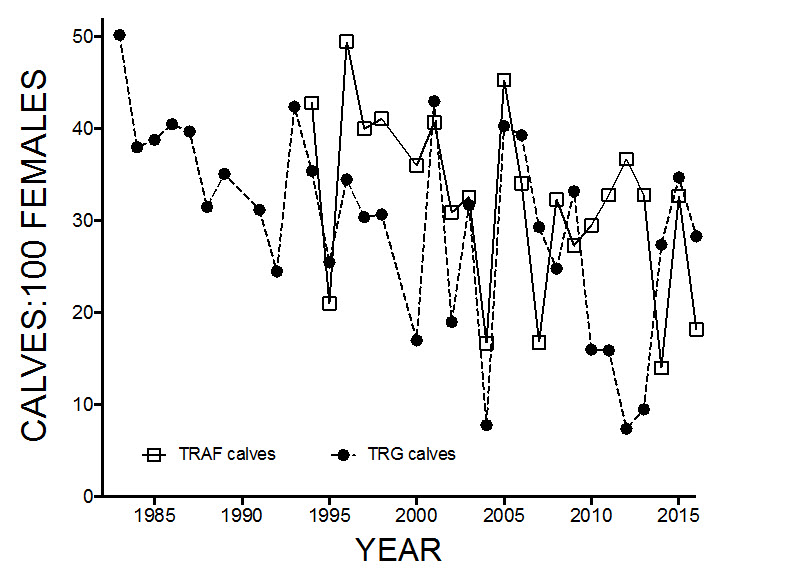
Long description for Figure 9
Chart illustrating the ratio of calves to 100 adult females observed during classified counts in autumn in the George River and Leaf River Caribou subpopulations of the Eastern Migratory Caribou, from the early 1980s to the mid-2010s.
In Ontario and Manitoba, estimates of survival for radio-collared adult females exist for 2009 - 2011 (Berglund et al. 2014). Depending on year and region, adult female survival estimates ranged from 72 - 96%, but all multi-year estimates suggested a yearly survival rate lower than 85% (Berglund et al. 2014). Calf recruitment in Ontario and Manitoba, derived in late winter, 2009 – 2011, ranged from 13.2 to 15.7 calves per 100 cows (Berglund et al. 2014). Estimates of calf recruitment based on a smaller sample of Caribou during targeted surveys of radio-collared females in February to March 2010 - 2012 were slightly higher, ranging from 12 to 26 calves:100 females, depending on year and region (Berglund et al., 2014). The values are considered lower than the estimated 39:100 ratio required to maintain a stable population (assuming 85% survival of adult females), and these results suggest that the population was declining. However, Berglund et al. (2014) considered the rates to be minimum expected rates and a decline has not been established. At present, the population is considered to be stable.
Torngat Mountains population
Estimates of survival were obtained in 2011 - 2013 based on monitoring 35 satellite collars fitted on both sexes, for a total sample size of 47 animal-years. Annual survival averaged 59.5% over the 3 years. Sample size is too low to estimate sex-specific survival rates. This low survival rate clearly indicates a rapidly declining population. Unfortunately, there are no recruitment data. In March 2014, however, calves represented 17.2% of the animals seen (or 28 calves:100 females) (Couturier and Mitchell Foley 2014).
Rescue effect
Both DUs are endemic to Canada and isolated, therefore rescue from outside populations is not possible.
Threats and limiting factors
The report discusses threats for both DUs together because many of threats appear to be similar. When appropriate, differences between the two DUs are noted.
Limiting factors
Populations of migratory Caribou likely are limited mainly by summer forage availability over large spatio-temporal scales (Couturier et al. 1988; Bergerud et al. 2008; Manseau et al. 1996; Newton et al. 2014). Caribou populations may be regulated by lichens because lichen requires many decades to accumulate biomass, but an increasing Caribou density can quickly reduce the food to levels too low to support Caribou (Messier et al. 1988; Crete et al. 1996). Females in the Leaf River subpopulation are smaller than those in the George River subpopulation, likely due to lower quality and quantity of forage (Crête and Huot 1993). The difference appears to result in poorer population growth (Couturier et al. 2010). Areas with low food availability can be nearly abandoned, at least for a few years. Dense aggregations in parts of the Southern Hudson Bay subpopulation are associated with a decline in woody species, likely due to heavy browsing and/or trampling of vegetation (Manseau et al. 1996; Newton et al. 2014). Decreasing populations often coincide with range retraction (Taillon et al. 2012a; Figure 2), with decreased herbivory and trampling effects on vegetation. Abandoned areas typically revegetate and eventually support aggregations of Caribou, although recovery may take 10s of years (Crete and Doucet 1998; Kumpula et al. 2011; Newton et al. 2014). Mortality from Wolves and hunting are important limiting factors (Bergerud 2008). Forage availability appears limiting, at least in the George River subpopulation where research has been the most extensive of the four subpopulations (Hearn et al. 1990; Crete et al. 1996; unpub. data from Government of Newfoundland and Labrador, Government of Quebec, Caribou Ungava).
Threats
An IUCN Threats Calculator exercise was conducted; the overall threat score for the Eastern Migratory population was ‘Very High to High’, based on an accumulation of threats but mainly from predicted impacts from mining activity, associated roads and increased access, hunting, increased fire events, and vegetation change associated with climate change (Appendix 1). These threats appear greater in the eastern subpopulations where most of the population resides. The overall threat score for the Torngat Mountains population is ‘High’, based on an accumulation of threats but mainly from predicted impacts from hunting, and potential impact of climate change (Appendix 2). Categories with concern, even if considered to be unknown or negligible, are presented because there is concern about these factors, but the lack of data limits the ability to quantify the threat.
Mining (iucn 3.2); threat score was negligible for torngat mountains, high-low for eastern migratory
Caribou avoid active mining areas. In the Northwest Territories, migratory Caribou occurrence decreased with increasing proximity to diamond mines (Boulanger et al. 2012). For the same subpopulation, Johnson et al. (2005) reported that the greatest impact from mining activity on habitat quality occurred during the post-calving season; modelled coefficients indicated a 37% reduction in high-quality habitats, and an 84% increase in low-quality habitats. In Newfoundland, Weir et al. (2007) found that Caribou avoided areas up to about 6 km from mine sites.
Mining impacts are predicted to increase in the eastern range of the EM Caribou, and several hydroelectricity projects are underway. In addition to dams, hydroelectricity projects involve flooding large areas of Caribou habitat. Research is currently assessing cumulative impacts on migratory Caribou space use and survival, and the impacts of large hydroelectricity reservoirs on Caribou space use (Caribou Ungava unpub. data). ATK for the TM also listed development activity as a threat (Wilson et al. 2014). Mining exploration has increased in northern Quebec in the last few decades (Government of Quebec 2014). Within the range of the Leaf River subpopulation, three mines were active in 2015 (Raglan; Nunavik Nickel; Éléonore) and an iron ore development is being considered (Hopes Advance Bay). Within the Quebec range of the George River subpopulation, there are currently four mining projects underway or proposed (Eldor; Lac Otelnuk Mining; KéMag, Taconiten north of Schefferville and Lac Brisson-Strange Lake). Another iron mining project is underway near Schefferville (DSO, New Millennium Iron Corp. and Tata Steel Minerals) (Government of Quebec 2014). These mining activities may affect access to calving and summering areas and some are along Caribou migratory routes. Mining expansion in the western subpopulation range is predicted to be minor, based on limited access and lack of major development proposals. The threat score for EM Caribou was a range of High-Low because of uncertainty of actual development. Mining is considered to be a negligible threat for the TM Caribou because approximately 50% of their range is in protected areas and mining activity is minor elsewhere.
Linear features (roads, utility lines; iucn 4.1, 4.2); threat score was unranked for torngat mountains, low for eastern migratory
Road-kill is not a significant threat because there are very few roads in the range of both DUs. Linear features, such as roads, power lines and seismic lines in winter ranges, lead to functional habitat loss because Caribou appear to avoid them (see Polfus et al. 2011), and they increase predation risk (Latham et al. 2011). New roads provide motorized access to new areas, leading to additional disturbance and increased hunter presence in Caribou range where hunting is permitted (Boulanger et al. 2012). That is particularly true in winter, when much Caribou harvest depends on snowmobile access. The latter issue is likely to expand as new roads provide new launching sites for snowmobiles. Hydro lines also improve access by snowmobile to previously remote areas.
There are no reliable projections of road density over the EM range. Many roads are associated with mining developments and forestry activities, but specific projects depend on economic factors and their timing is difficult to predict. There is, however, an expectation of growth in mining and forestry activities throughout much of the eastern EM range. Mining activities and associated roads within sensitive Caribou habitat areas, such as calving grounds and high-use migratory routes, may have adverse impacts on migratory Caribou. Several all-winter roads associated with mining development are proposed. The proposed mine at Lac Brisson and the connecting road to Voisey’s Bay would sever the main migration corridor of the George River subpopulation and is also within the historical southern portion of the calving grounds. Another indication of potential disturbance in EM range is Plan Nord, an $80-billion proposal for investment in roads, airports, mining, and forestry in central and northern Quebec (Northern Miner 2014). There are no known plans for roads in the TM.
Hunting (iucn 5.1); threat score was high for torngat mountains, medium for eastern migratory
Human harvest is a known source of mortality for each subpopulation but the harvest levels remain largely unquantified for some subpopulations because reporting is very limited (Hayes et al. 2003; Courtois et al. 2007). Harvest is a controversial and complicated issue; the sharing of harvest data between governments can be problematic for Aboriginal managers (Smart pers. comm. 2016). Aboriginal peoples hold first rights to the use of migratory Caribou for subsistence and other traditional uses. In Quebec, the majority of the territory where migratory Caribou exist is governed under the James Bay and Northern Quebec Agreement, and the Northeastern Quebec Agreement, which provides for the ‘Principle of Priority of Native Harvesting’, which must be in conformity with the ‘Principle of Conservation’ (Smart pers. comm. 2016).
In 2013, Aboriginal people from eastern Quebec and Labrador, including Nunatsiavut, formed the Aboriginal round table on Ungava Caribou. Inuit authorities from both Nunatsiavut (northern Labrador) and Nunatukavut (southern Labrador) have asked their members not to hunt Caribou for, respectively, a 2-year and a 1-year period. The request is not binding and an unknown level of harvest of George River subpopulation Caribou continues in both Quebec and Labrador. The Innu Nation consider the impact of their members’ hunting to be negligible, and continue to harvest Caribou (CBC News 2016).
Hunting is presently known to be the major source of mortality on the George River subpopulation (Government of Newfoundland and Labrador unpub. data). Sport hunting for the George River subpopulation has been closed since 2012 in Quebec, and since 2013 in Labrador. In 2013, the Province of Newfoundland and Labrador enacted a 5-year moratorium on all hunting of George River subpopulation Caribou in Labrador, inclusive of Aboriginal peoples, based on the low abundance, and evidence of harvest rates. A review by the province in 2015 concluded that the ban should continue (Government of Newfoundland and Labrador 2016). Sport hunting continued for the Leaf River subpopulation (in Quebec), although the number of licences has been severely reduced. For example, assuming a hunter success rate of 80%, the sport harvest of Leaf River Caribou in 2016 - 2017 will be about 2,100, a decline of 89% compared to the 18,400 taken by sport hunters in 2004 - 2005 (Brodeur pers. comm. 2015). In April 2017, the Quebec government announced that sport hunting of the Leaf River subpopulation will discontinue in February 2018 (MFFP 2017). The term ‘sport hunt’ varies between Quebec and Newfoundland and Labrador; in Quebec, sport hunting refers to any harvest by non-Aboriginals, while in Labrador, harvest by non-Aboriginal Labradoreans is considered a subsistence hunt, or resident harvest (Moores pers. comm. 2016).
The Cree, Inuit, and Naskapi of northern Quebec lobbied for a complete ban on sport hunting for the Leaf River and George River subpopulations in 2010. These groups believe that sport hunting should have been prohibited sooner, and its delay contributed to the decline of the George River subpopulation; the continued sport hunt of Leaf River subpopulation Caribou also is considered by them to be the cause of the ongoing decline (Smart pers. comm. 2016).
Both Aboriginal subsistence hunting and a limited sport hunt take place on the Cape Churchill subpopulation but harvest rates are not known, in part due to difficulty separating Caribou of this subpopulation from Qamanirjuaq subpopulation Caribou (DU3) in hunt statistics, as well a low hunter return rate of voluntary questionnaires regarding success (Elliot 1998; Abraham et al. 2011).
The portion of the Southern Hudson Bay subpopulation in Manitoba is exposed to a sport hunt and a subsistence hunt. The portion in Ontario is exposed to subsistence hunting; sport hunting has not been allowed in Ontario since 1929 (OMNR 2008). In both jurisdictions, the level of subsistence harvest is unknown. In Ontario, harvest levels were estimated around 400 – 500 Caribou/year in the 1980s, and > 700/year during the late 1980s – 1990s, and appeared to be increasing, at least up to 2011 (Abraham et al. 2011). More recent data are unavailable.
For the TM, some ATK indicates overhunting for subsistence as the most important factor in the decline (Wilson et al. 2014). This response, however, differed between Nunavik where 27% of Aboriginal respondents listed overhunting as the most important threat for the TM population, compared to 72% in Nunatsiavut (Wilson et al. 2014). There is no sport hunting for the TM population.
Hunting of Caribou is facilitated by roads and other linear features and by off-road vehicles that permit access to previously inaccessible areas. Much ATV use in the Southern Hudson Bay subpopulation range is related to hunting, rather than ‘recreation’, and therefore separating the effect of ATVs from the risk of human mortality is difficult. Newton et al. (2015) found areas with high ATV activity (measured by lasting ATV tracks) in western and eastern coastal zones of the summer range were avoided by Caribou by 10 – 14 km, even though these areas contained nutritious forage.
In summary, unsustainable harvest (overharvest) rates by humans is a known threat for both the EM and TM. It appears that sociopolitical issues between governments will result in some level of ongoing harvest. The impact of harvest will increase as the Caribou populations decline.
Recreational Activities (IUCN 6.1); Threat Score was Negligible for both populations.
Recreational activities, such as snowmobiling, hiking, skiing and use of cabins can displace Caribou, force them to use lower quality habitats, or change their behaviour (Duchesne et al. 2000; Mahant 2013). Each of these responses can impact body condition, recruitment, survival, and vulnerability to predation (Bergerud 1988; Vistnes and Nelleman 2008; Bowman et al. 2010). The frequency of recreational activities is relatively low for both EM and TM because of the remoteness of their habitat. However, ATK notes that noise and recreational activities (e.g., increased snowmobile traffic) ranks as the 3rd most important threat to the TM population (Wilson et al. 2014). The recreational activities associated with new protected areas (Habitat Protection and Ownership section) in the range of the Torngat and eastern subpopulations of the Eastern Migratory DU is unknown.
Fire (IUCN 7.1); Threat Score was unranked for Torngat Mountains, Medium-Low for Eastern Migratory
Fire is a concern for the winter ranges of EM, but presently has limited impact for the TM. Climate change appears to be affecting fire ecology; ATK reported that lands are now drier, with increased frequency and severity of forest fires, reducing the winter range available for Caribou (Northern River Basins Study 1996 quoted in COSEWIC 2012, p. 99).
Fires have complex effects on Caribou winter range occupancy (Schaefer and Pruitt 1991). Fires initially diminish the forest habitats of Caribou because they result in loss of mature conifer stands and lichens, and act as barriers to movement (Thomas and Gray 2002; Dalerum et al. 2007; Dzus et al. 2010). The regeneration time of lichen after burns will influence the length of time before sites become suitable again for Caribou; Morneau and Payette (1989) estimated lichen species consumed by Caribou would require 30 - 40 years to recover after a fire, and, in forests of the NWT near the Saskatchewan border, biomass of lichens used by Caribou, such as Cladina spp. and Cetraria nivalis, stabilized between 40 - 60 years after fire (Thomas et al. 1995).
The fire cycle in the shrub tundra of the George River subpopulation summer range is estimated as 9,320 years (Payette et al. 1989); any increase in fire frequency could reduce lichen-bearing tundra. In forested parts of eastern EM range, the fire frequency is about 111-139 years in western and central Quebec’s Black Spruce forests on xeric soils, but increases to about 500 years in eastern Quebec and southeastern Labrador’s mesic Black Spruce forests (Bergeron et al. 2001; Bergeron and Le Goff 2005). Predictions for future fire impact include a significant increase in fire severity in parts of central and western Ontario (Colombo et al. 1998), to a 7-fold increase in central Quebec (Le Goff et al. 2009) and a minor impact in eastern boreal forests (Bergeron et al. 2001).
Problematic Native Species (IUCN 8.2) – predation; Threat Score was Unknown for Torngat Mountains, and Low for Eastern Migratory because even though there is growing concern, the lack of quantified impact leads to uncertainty.
ATK documents that Black Bear populations have increased in recent years, possibly due to changing climate (Wilson et al. 2014). Bear predation on young calves at calving areas can be substantial (Leclerc et al. 2014) and continues even after a major population decrease in migratory Caribou because Caribou continue to concentrate on calving areas. Black Bear predation could now be an important factor for calf survival in the George River subpopulation (Caribou Ungava unpub. data).
ATK has also documented an increase of Moose in the southern distribution of TM that may increase apparent competition with Caribou (Wilson et al. 2014). The cause for the increase may be related to milder winters associated with climate change. Increased Moose numbers are known to result in higher predation rates on Caribou by Wolves.
The other large herbivores overlapping the range of EM and TM are Muskoxen in northern Quebec but they occur at low density and likely have a limited impact on Wolf population dynamics.
Problematic Native Species (IUCN 8.2)–parasites and pathogens; Threat Score was unranked for Torngat Mountains, and Low for Eastern Migratory because there is growing concern, but uncertainty because of lack of data.
Caribou parasites can influence population dynamics, and the quality and safety of the meat consumed by people (Kutz et al. 2009). Parasites and diseases are expected to increase in the Arctic with climate warming (Kutz et al. 2004). Changes in the distribution of other cervids could also have negative consequences, first because they are prey for Wolves, but also because they are a vector for diseases (Pitt and Jordan 1994; Dumont and Crête 1996; Racey and Armstrong 2000). Meningeal Brainworm (Parelaphostrongylus tenuis), which is non-lethal to White-tailed Deer (Odocoileus virginianus), can be transmitted via gastropods on vegetation to Caribou and Moose and cause death (Anderson and Strelive 1968). It exists from Saskatchewan eastward (Wasel et al. 2003). Attempts to reintroduce Caribou into historical southern range have failed, likely because of the presence of infected deer (Bergerud and Mercer 1989). This threat could possibly affect the northern Ontario Caribou subpopulations in the future.
Moose can be severely affected by the Winter Tick (Dermacentor albipictus), and Caribou also are a host of this parasite (Samuel 2004). Kutz et al. (2009) reported that Winter Tick range is expanding into the Canadian North, possibly due to warmer spring weather (Drew and Samuel 1986).
Besnoitia emerged as a disease-causing agent in the George River and Leaf River subpopulations in 2007 - 09 (Ducrocq et al. 2013). It is possibly an invasive to the system that is impacting a naive population. It was detected in about half of the animals sampled in 2015 (MFFP unpub. data). Besnoitia was found in 80% of metatarsal skin samples collected from the George River subpopulation Caribou in 2012. There was no significant difference between infection rates or levels between males and females (Government of Newfoundland and Labrador unpub. data). Besnoitia is currently being investigated for possible sub-lethal health effects on Caribou by the Newfoundland and Labrador Wildlife Division. In Quebec, visual inspection of the eye revealed Besnoitia in about 40% of 275 Caribou captured for radio-collaring from the Leaf River subpopulation in 2010 - 2015. Monitoring of the George River subpopulation by the Quebec and Newfoundland and Labrador governments in 2010-2012 suggested a prevalence of 53% (n = 58 Caribou), prevalence was 15% for 48 Caribou in 2013-2014. Besnoitia may cause reduced mobility (including recumbent behaviour), invasion of testicular tissue, and probable reduced fertility (Kutz pers. comm. 2016).
Pollution (IUCN 9.2, 9.5); Threat Score was Unknown for both populations because there is growing concern but uncertainty because of lack of data.
Aboriginal users of Caribou have raised concerns that pollution and other environmental contaminants are negatively affecting this species (COSEWIC 2012). Studies of contaminant levels in Caribou tissues suggest that these levels do not pose a risk to Caribou survival (for example, in the Yukon, see Gamberg 2004). However, research in the EM and TM is limited to an assessment of heavy metals in Leaf River subpopulation Caribou during 2007 – 2008 (Kwan 2011). Further research has been recommended over concerns about atmospheric contaminants such as mercury and cesium, and possible effects on Caribou health (Moores pers. comm. 2016).
Climate Change - Habitat Shifting and Alteration (IUCN 11.1); Threat score was Unknown for both populations but there is considerable concern about future effects; the impacts are expected to be significant after three generations.
Average air temperature in the Torngat Mountains has increased by approximately 2°C since the early 1990s and is expected to increase by another 2-4°C by 2050 (Allard and Lemay 2012; Finnis 2013; Way and Viau 2014). Coupled with this, growing seasons are expected to increase in length by approximately 20 days by 2050 (Allard and Leamy 2012), a change which satellite monitoring indicates is already under way (He et al. 2008; Pouliot et al. 2009).
Climate change may impact Caribou directly by affecting thermoregulation, and indirectly through habitat changes. There also is growing evidence of changes in the diversity of parasites, viruses and bacteria, and pathogens, and shifts in host-parasite/pathogen interactions (Kutz et al. 2014). Earlier springs may desynchronize peak vegetation abundance and calving, with negative consequences for Caribou. In Greenland, calf production and survival are reduced when the asynchrony between the birth pulse and vegetation green-up increases, a phenomenon termed ‘trophic mismatch’ (Post and Forchhammer 2008). A warmer climate may also increase Caribou harassment by biting and parasitic insects (Toupin et al. 1996; Weladji et al. 2003). These insects have adverse impacts on Caribou, which contribute to declines in foraging efficiency and deterioration in health (Russell et al. 1993).
Climate change has been reported in ATK compilations as a threat to TM Caribou (Wilson et al. 2014). Within 50 years, the winter, spring and summer range suitable for the George River subpopulation is predicted to be restricted to the northeast section of the Quebec-Labrador Peninsula, while the fall season range may still occur across the entire peninsula (Sharma et al. 2009). Modelled changes in thawing and freezing dates, and in ice availability, for the Leaf River subpopulation were shown to influence Caribou movements, increasing distance travelled, and consequently, the amount of energy expended during spring and fall migrations (Leblond et al. 2016).
Habitat is changing with climate change, mainly through the invasion of tundra by shrubs and spruce (Picea spp.) at northern latitudes (Sturm et al. 2001, 2005; Elmendorf et al. 2012; Tremblay et al. 2012). ATK notes an increase in shrubs in the Torngat Mountains (Parks Canada Agency 2008; Fraser et al. 2011; Wilson et al. 2014). Analysis of satellite imagery indicates that the amount of shrub-dominated habitat in the central Torngat Mountains increased approximately 6-fold from 1985 – 2014 (Fraser et al. 2011; Tremblay et al. 2012; Quirouette 2015; Quirouette and Zorn 2015; Figure 10). Shrub expansion is occurring across much of the Arctic (Myers-Smith et al. 2011, 2015) but the rate of change is much higher in the Torngat Mountains (Fraser et al. 2011; Tremblay et al. 2012). This increase may be attributed to an additive or interactive functional response of existing shrubs to climate amelioration concurrent with a large decrease in grazing pressure due to the decline of the TM Caribou population (Couturier et al. 2014; Christie et al. 2015; Wilson et al. 2014).
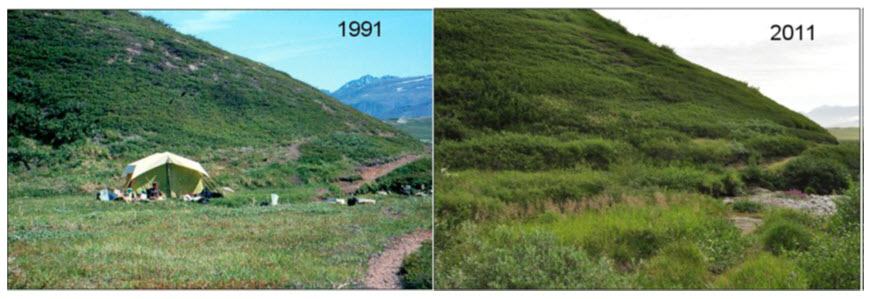
Long description for Figure 10
Two photos illustrating the expansion in shrub vegetation over a 20-year period (1991 and 2011) in Torngat Mountains National Park.
There is some concern that tundra plants and lichen could be outcompeted by shrubs, thereby reducing traditional forage for Caribou (Meyers-Smith et al. 2011). The amount of shrub species consumed by Caribou varies. Manseau et al. (1996) recorded willow shrub (Salix sp.) at 9% of rumen contents (although they note that this consumption could be abnormal because regular food items were low due to years of high Caribou density). Spruce is not consumed by Caribou. Overall, shrub expansion could be positive for Caribou in the short term by increasing food abundance, but its long-term impact on Caribou habitat use is unknown. Areas with tall shrubs were avoided by Caribou in the Southern Hudson Bay subpopulation during calving and post-calving periods (Habitat section).
There is increasing overlap of Caribou with other cervids as the climate warms (Vors and Boyce 2009), potentially increasing the interspecific transmission of diseases and parasites. The increase of Moose has been associated with increased predation risk for Caribou and is considered a major threat to the non-migratory Caribou (DU6; COSEWIC 2015). The role of Moose in rates of Wolf predation on Caribou is not known for the TM and EM, but the more forested southern edge of the EM range is likely to experience increased Moose, and potentially increased predation impact on Caribou.
In general, climate warming is predicted to lead to an 89% decrease of Caribou habitat in North America by 2080 (Yannic et al. 2014). The threat is classified as unknown in both populations because impacts are expected but the extent of impact may not occur in the next 3 generations.
Number of locations
Eastern Migratory population
The number of locations likely is ‘many’. Although the four subpopulations use specific calving grounds, the main threats of human mortality and climate change vary in intensity and impacts will occur across a large area of > 1.5 million km2. Also, divisions within the subpopulations have been noted. In the Southern Hudson Bay subpopulation, Newton et al. (2015) delineates three subgroups based on different movement patterns, and human mortality likely varies within these groups. ATV impacts also vary between these subgroups (Newton et al. 2015).
Torngat Mountains population
The number of locations likely is ‘many’. TM is considered a single population; the most likely threatening event is overharvest, but the harvest rate would vary in different parts of a very large (i.e., 28,000 km2) range.
Protection, status and ranks
Legal protection and status
Both DUs in this report are found only within Canada. COSEWIC assessed the conservation status of the EM Caribou (Endangered) in April 2017, and TM Caribou (Endangered) in November 2016. In Quebec, the two populations are not listed as Threatened or Vulnerable under the Loi sur les espèces menacées ou vulnérables (RLRQ, c E-12.01) (LEMV) (Act respecting threatened or vulnerable species) (CQLR, c E-12.01), but are afforded protection under the Loi sur la conservation et la mise en valeur de la faune (RLRQ, c. C- 61.1) (LCMVF) (Act respecting the conservation and development of wildlife) (CQLR, c. C-61.1). Under article 26 of the LCMVF, it is illegal to disturb, destroy, or damage the eggs or nest of an animal. It is also prohibited to capture, hunt, and/or keep in captivity any species that are native to Quebec. Similar laws exist for Caribou in Ontario and Newfoundland and Labrador.
Non-legal status and ranks
The IUCN global status of Caribou (Rangifer tarandus) was changed from Least Concern (assessed in 2008) to Vulnerable (2016) because population declines have been documented for many populations worldwide (Vors and Boyce 2009; Gunn 2016). Caribou have not been ranked at the scale of COSEWIC DUs, and provincial ranks can include Caribou from several DUs. Some subpopulations have been ranked, such as the George River subpopulation (S5, by Newfoundland and Labrador) but that ranking does not reflect recent population declines, and the draft (2015) status is S1S2 for all Caribou in Labrador (Moores pers. comm. 2016).
Eastern Migratory population
EM Caribou in the eastern part of their range occur almost exclusively on public land and on Inuit, Cree, and Naskapi land categories 1 to 3 of the James Bay and Northern Quebec Agreement in northern Quebec. In Labrador, they occur on crown land and lands owned by, or for the exclusive use of, Inuit as part of the Labrador Inuit Settlement Area and associated land claim. Land claims by the Innu Nation in the central portion of the George River subpopulation range also are pending. Parts of the calving grounds of the George River and Leaf River subpopulations in Quebec are afforded some protection by legally recognized Wildlife Habitats that minimize disturbance during calving. Within Wildlife Habitats, activities that may affect Caribou habitat are prohibited from 15 May to 31 July (Quebec Government 2011). Access to, and activities within the period of protection of, Wildlife Habitats may be allowed if permits are issued by the Quebec government. The effectiveness of these temporal restrictions in supporting Caribou recovery and or persistence have not been assessed. These Wildlife Habitats are protected under the Regulation respecting Wildlife Habitats (CQLR, c. C-61.1 r18), and Chapter IV.1 of the Conservation and Development of Wildlife Act (CQLR, c. C-61.1) (Quebec Government 2011). Although the George River subpopulation moves seasonally through three jurisdictions (Quebec, Newfoundland and Labrador, and the Inuit land claim area of Nunatsiavut; Couturier et al. 2010), there is no current legal protection of calving grounds in either Labrador or Nunatsiavut. Habitat protection requirements necessary to support the recovery and persistence of EM Caribou are being jointly considered by the governments of Newfoundland and Labrador, and Quebec, as part of efforts to develop long-term Caribou management plans.
Protected areas in the summer range of the Leaf River subpopulation in Quebec include the provincial parks: Parc national des Pingualuit (1,134 km2), Tursujuq (26,107 km2), and three proposed parks (Baie-aux-Feuilles, Monts-de-Puvirnituq, Cap-Wolstenholme [combined; 13,378 km2]). Part of the summer range and migration corridors of the George River subpopulation is protected by Parc national Kuururjuaq (4,460 km2). Parc national Ulittaniujalik was created in 2016 within the range of the George River subpopulation. Hunting by non-Aboriginals is not allowed in these protected areas.
Protected areas in the Cape Churchill subpopulation include Wapusk National Park, Manitoba (≈ 10,700 km2), which protects almost 50% of the range from resource extraction. The southern end of Wapusk National Park also protects part of the Southern Hudson Bay subpopulation. The area from south of Fort Severn to Cape Henrietta Maria is protected by Polar Bear Provincial Park, Ontario (≈ 23,300 km2). Parts of Kaskatamangan Wildlife Management Area (≈ 2600km2) legally protect calving grounds (Abraham et al. 2011). Overall, approximately 50% of the Southern Hudson Bay subpopulation coastal range (to 50 km inland) is protected from resource extraction.
Torngat Mountains population
Approximately 50% of the range of TM population is in the Torngat Mountains National Park of Canada on the Nunatsiavut side, and the Kuururjuaq national park (Parc national Kuururjuaq; a provincial park) on the Quebec side. Aboriginal harvest of Caribou is allowed within these protected areas, but industrial and commercial extraction is prohibited.
Acknowledgements and authorities contacted
The report writers thank Environment Canada for funding the preparation of this status report. Members of the COSEWIC Terrestrial Mammals and ATK subcommittees, and numerous reviewers from provinces and territories provided valuable comments, in particular Vicki Trim and Vincent Brodeur. The report writers are grateful to Caroline Hins for help with the literature review and Kaitlin Wilson for discussions about ATK. The report writers would like to thank the following people who provided information and comments.
List of authorities contacted
Name Affiliations
Vicky Trim Sustainable Development, Manitoba
William Watkins Manitoba Ministry of Natural Resources
Dennis Brannen Wildlife Branch, Sustainable Development, Manitoba
Michael Oldham Ontario Ministry of Natural Resources and Forestry
Bruce Pond Ontario Ministry of Natural Resources and Forestry
Darren Elder Ontario Ministry of Natural Resources and Forestry
Ken Abraham Caribou biologist (retired) OMNR
Gerry Racey Ontario Ministry of Natural Resources and Forestry
Vivian Brownell Ontario Ministry of Natural Resources and Forestry
Mark Basterfield Trent University, Ontario
Serge Couturier Caribou biologist (retired) Consultant
Jennifer Mitchell Foley Torngat Wildlife, Plants & Fisheries Secretariat
Isabelle Gauthier Ministère de Forêts, de la Faune et des Parcs du Québec
Julien Mainguy Ministère de Forêts, de la Faune et des Parcs du Québec
Annie Paquet Ministère de Forêts, de la Faune et des Parcs du Québec
Joelle Taillon Ministère de Forêts, de la Faune et des Parcs du Québec
Vincent Brodeur Ministère de Forêts, de la Faune et des Parcs du Québec
Alexandre Rasiulis Université Laval, Québec
Mael Le Corre Université Laval, Québec
Roderick Pachano Chairperson, Eeyou Marine Region Wildlife Board
Miles Smart Executive Secretary, Hunting, Fishing and Trapping Coordinating Committee
Isabelle Schmelzer Wildlife Division, Newfoundland and Labrador
John Pisapio Wildlife Division, Newfoundland and Labrador
John Blake Wildlife Division, Newfoundland and Labrador
Sara McCarthy Wildlife Division, Newfoundland and Labrador
Shelley Moores Wildlife Division, Newfoundland and Labrador
Working Group Hunting, Fishing and Trapping Coordinating Committee
Jamie Snook Torngat Wildlife, Plants & Fisheries Secretariat
Gilles Falardeau Environment and Climate Change Canada
Stéphane Légaré Environment and Climate Change Canada
Robert Anderson Canadian Museum of Nature
Robert Bellizzi National Defence
Jennifer Rowland National Defence
Rachel McDonald National Defence
Rich Russell Environment and Climate Change Canada
Ruben Boles Environment and Climate Change Canada
Patrick Nantel Parks Canada
Darroch Whitaker Parks Canada
Information sources
Abraham, K.F. Email communication with G. Forbes, September 2016.
Abraham, K.F., and J.E. Thompson. 1998. Defining the Pen Islands caribou herd of southern Hudson Bay. Rangifer, Special Issue 10:33-40.
Abraham, K.F., McKinnon, L.M., Jumean, Z., Tully, S.M., Walton, L.R. and Stewart, H.M. (lead coordinating authors and compilers). 2011. Hudson Plains Ecozone+ Status and Trends Assessment. Canadian Biodiversity: Ecosystem Status and Trends 2010, Technical Ecozone+ Report. Canadian Councils of Resource Ministers, Ottawa, Ontario. 445 pp.
Abraham, K.F., (and 6 co-authors). 2012. Recent changes in summer distribution and numbers of migratory caribou on the southern Hudson Bay coast. Rangifer, Special Issue 20: 269–276.
Albon, S.D., (and 5 co-authors). 2002. The role of parasites in the dynamics of a reindeer population. Proceedings of the Royal Society B-Biological Sciences 269:1625-1632.
Allard, M., and M. Lemay. 2012. Nunavik and Nunatsiavut: from science to policy, an Integrated Regional Impact Study of climate change and modernization. ArcticNet Inc., Québec, Québec.
Altizer, S., R.S. Ostfeld, P.T. Johnson, S. Kutz, and C.D. Harvell. 2013. Climate change and infectious diseases: from evidence to a predictive framework. Science 341:514-519.
Anderson, R., and U. Strelive. 1968. The experimental transmission of Pneumostgrongylus tenuis to caribou (Rangifer tarandus terranovae). Canadian Journal of Zoology 46:503-510.
Banfield, A.W.F. 1961. A revision of reindeer and caribou, genus Rangifer. National Museum of Canada, Bulletin No. 177. Queen's Printer, Ottawa, Ontario.
Banfield, A.W.F., and J.S. Tener. 1958. A preliminary study of the Ungava caribou. Journal of Mammalogy 39:560-573.
Barboza, P.S., D.W. Hartbauer, W.E. Hauer, and J.E. Blakes. 2004. Polygynous mating impairs body condition and homeostasis in male reindeer (Rangifer tarandus tarandus). Journal of Comparative Physiology B 174:309-317.
Barboza, P.S., and K.L. Parker. 2008. Allocating protein to reproduction in Arctic reindeer and caribou. Physiological & Biochemical Zoology 81:835-855.
Bélanger, M., and D. Le Hénaff. 1985. Distribution, abundance and regulation of caribou hunting in Québec. McGill Subarctic Research Paper 40:3-13.
Bender, L.C. 2006. Uses of herd composition and age ratios in ungulate management. Wildlife Society Bulletin 34:1225-1230.
Bergeron, Y., S. Gauthier, V. Kafka, P. Lefort, and D. Lesieur. 2001. Natural fire frequency for the eastern Canadian boreal forest: consequences for sustainable forestry. Canadian Journal of Forest Research 31:384-391.
Bergeron, Y., and E. Le Goff. 2005. Doit-on remettre en question notre façon
d’aménager la forêt boréale canadienne? Vertigo – La revue en sciences de
l’environnement 6:1-7.
Bergerud, A.T. 1971. The population dynamics of Newfoundland caribou. Wildlife Monographs 25:3-55.
Bergerud, A.T. 1974. Decline of caribou in North America following settlement. Journal of Wildlife Management 38:757-770.
Bergerud, A.T. 1975. The reproductive season of Newfoundland caribou. Canadian Journal of Zoology 53:1213-1221.
Bergerud, A.T. (1996). Evolving perspectives on caribou population dynamics, have we got it right yet? Rangifer 16:95–115.
Bergerud, A.T. 1988. Caribou, wolves and man. Trends in Ecology & Evolution 3:68-72.
Bergerud, A.T., and R.E. Page. 1987. Displacement and dispersion of parturient caribou at calving as antipredator tactics. Canadian Journal of Zoology 65:1597-1606.
Bergerud, A.T., and W.E. Mercer. 1989. Caribou introductions in eastern North America. Wildlife Society Bulletin 17:111-120.
Bergerud, A.T., S.N. Luttich, and L. Camps. 2008. The Return of Caribou to Ungava . McGill-Queen’s University Press, Montréal, Québec.
Berglund, N.E., (and 4 co-authors). 2014. Woodland caribou (Rangifer tarandus caribou) in the Far North of Ontario: Background information in support of land use planning. Ontario Ministry Natural Resources, Biodiversity and Monitoring Section Tech. Rpt. TR-147, Thunder Bay, Ontario.
Blake, J. 2015. Government of Newfoundland and Labrador. Email communication with S. Cote.
Boudreau, S., S. Payette, C. Morneau, and S. Couturier. 2003. Recent decline of the George River caribou herd as revealed by tree-ring analysis. Arctic, Antarctic, and Alpine Research 35:187-195.
Boudreau, S., and S. Payette. 2004. Caribou-induced changes in species dominance of lichen woodlands: an analysis of plant remains. American Journal of Botany 91:422-429.
Boulanger, J., K.G. Poole, A. Gunn, and J. Wierzchowski. 2012. Estimating the zone of influence of industrial developments on wildlife: a migratory caribou Rangifer tarandus groenlandicus and diamond mine case study. Wildlife Biology 18:164-179.
Boulet, M., S. Couturier, S.D. Côté, R.D. Otto, and L. Bernatchez. 2007. Integrative use of spatial, genetic, and demographic analyses for investigating genetic connectivity between migratory, montane, and sedentary caribou herds. Molecular Ecology 16:4223-4240.
Bowman, J., J.C. Ray, A.J. Magoun, D.S. Johnson, and F.N. Dawson. 2010. Roads, logging, and the large-mammal community of an eastern Canadian boreal forest. Canadian Journal of Zoology 88:454-467.
Brice-Bennett, C. 1977. Our Footprints Are Everywhere: Inuit Land Use and Occupancy. Prepared for the Labrador Inuit Association, Nain, Newfoundland and Labrador.
Brodeur, V. 2016. Ministère de la faune et des parcs du Québec Email communication with S. Cote.
Campbell, M.W. 1994. The Winter Ecology of Cape Churchill Caribou (Rangifer tarandus ssp.). MSc Thesis, University of Manitoba, Winnipeg, Manitoba. 216 pp.
CBC 2016. Innu ‘treated like criminals for hunting George River caribou, says Grand Chief. Julie Skinner; Canadian Broadcast News web article. August 31, 2016. [www.cbc.ca/news/canada/newfoundland-labrador/innu-nation-george-river-caribou-1.3742552].
Caribou Ungava. Unpublished data and personal communication. 2016. Universite Laval, Departement de biologie. http://www.caribou-ungava.ulaval.ca/en/accueil/.
Christie, K. (and 5 co-authors). 2015. The role of vertebrate herbivores in regulating shrub expansion in the Arctic: a synthesis. Bioscience 65:1123-1133.
Clutton-Brock, T.H., and T. Coulson. 2002. Comparative ungulate dynamics: the devil is in the detail. Philosophical Transactions of the Royal Society B 357:1285-1298.
Colombo, S.J., (and 9 co-authors). 1998. The Impacts of Climate Change on Ontario's Forests. Forest Research Information Paper 143, Ontario Forest Research Institute, Ontario Ministry of Natural Resources, Sault Ste. Marie, Ontario.
COSEWIC. 2002. COSEWIC assessment and update status report on the woodland caribou Rangifer tarandus caribou in Canada. Committee on the Status of Endangered Wildlife in Canada, Ottawa, Ontario.
COSEWIC. 2011. Designatable Units for caribou (Rangifer tarandus) in Canada. Committee on the Status of Endangered Wildlife in Canada, Ottawa, Ontario.
COSEWIC. 2012. Aboriginal Traditional Knowledge assessment report on caribou Rangifer tarandus in Canada ATK Subcommittee of COSEWIC. Environment Canada, Ottawa, Ontario.
Côté, S.D. 1998. In vitro digestibilities of summer forages utilized by the Rivière George caribou herd. Arctic 51:48-54.
Courtois, R., J.-P. Ouellet, L. Breton, A. Gingras, and C. Dussault. 2007. Effects of forest disturbance on density, space use, and mortality of woodland caribou. Ecoscience 14:491-498.
Couturier, S., J. Brunelle, and J. Lapointe 1988. Decline of physical condition and decrease of recruitment in the George River Caribou Herd. Proc. 3rd N. Am.
Caribou Workshop. Alaska Dept. Fish Game, Technical Bulletin 8: 35-37.
Couturier, S., J. Brunelle, D. Vandal D, G. St-Martin. 1990. Changes in the population dynamics of the George River caribou herd, 1976–87. Arctic 43:9–20.
Couturier, S., R. Courtois, H. Crépeau, L.-P. Rivest, and S. Luttich. 1996. Calving photocensus of the Rivière George caribou herd and comparison with an independent census. Rangifer, Special Issue 9:283-296.
Couturier, S., D. Jean, R. Otto, and S. Rivard. 2004. Démographie des troupeaux de caribous migrateurs-toundriques (Rangifer tarandus) au Nord-du-Québec et au Labrador. Ministère des Ressources naturelles, de la Faune et des Parcs, Direction de l'aménagement de la faune du Nord-du-Québec et Direction de la recherche sur la faune, Québec, Québec.
Couturier, S., S.D. Côté, J. Huot, and R.D. Otto. 2009. Body condition dynamics in a northern ungulate gaining fat in winter. Canadian Journal of Zoology 87:367-378.
Couturier, S., R.D. Otto, S.D. Côté, G. Luther, and S.P. Mahoney. 2010. Body size variations in caribou ecotypes and relationships with demography. Journal of Wildlife Management 74:395-404.
Couturier, S., and J. Mitchell Foley. 2014. First scientific data on herd size and population dynamics of the Torngat Mountains caribou herd. Torngat Wildlife, Plants and Fisheries Secretariat Series 2015.
Crête, M., and A. Desrosier. 1995. Range expansion of coyotes, Canis latrans, threatens a remnant herd of caribou, Rangifer tarandus, in southeastern Québec. Canadian Field-Naturalist 109:227-235.
Crête, M., and G. Doucet. 1998. Persistent suppression in dwarf birch after release from heavy summer browsing by caribou. Arctic Alpine Research 30:126–132.
Crête, M., and Huot, J. 1993. Regulation of a large herd of migratory caribou: Summer nutrition affects calf growth and body reserves of dams. Canadian Journal of Zoology 71:2291 – 2296.
Crête, M., J. Huot, and L. Gauthier. 1990. Food selection during early lactation by caribou calving on the tundra in Québec. Arctic 43: 60-65.
Crête, M., S. Couturier, B.J. Hearn, and T.E. Chubbs. 1996. Relative contribution of decreased productivity and survival to recent changes in the demographic trend of the Rivière George subpopulation. Rangifer, Special Issue 9:27-36.
Cuerrier and the Elders of Kangiqsualujjuaq. 2012. The Zoological Knowledge of the Inuit of Kangiqsualujjuaq, Nunavik. Avataq Cultural Institute, 132 p.
Curry, P.S. 2012. Blood on filter paper for monitoring caribou health: efficacy, community-based collection, and disease ecology in circumpolar herds. PhD thesis, Department of ecosystem and public health, University of Calgary, Calgary, Alberta, 308 p.
Dalerum, F., S. Boutin, and J.S. Dunford. 2007. Wildfire effects on home range size and fidelity of boreal caribou in Alberta, Canada. Canadian Journal of Zoology 85:26-32.
Dalziel, B., M. Le Corre, S.D. Côté, and S. Ellner. 2016. Detecting collective behavior in animal relocation data, with application to migrating caribou. Methods in Ecology and Evolution 7: 30-41.
DesMeules, P., and Brassard, J.M. 1964. Inventaire préliminaire du caribou Rangifer tarandus caribou d'un secteur de la Côte-Nord et du secteur centre de l'Ungava. Québec, Ministère du Loisir, de la chasse et de la Pêche: p.187-218.
Drew, M.L., and W.M. Samuel. 1986. Reproduction of the winter tick, Dermacentor albipictus, under field conditions in Alberta, Canada. Canadian Journal of Zoology 64:714-721.
Duchesne, M., S.D. Côté, and C. Barrette. 2000. Responses of woodland caribou to winter ecotourism in the Charlevoix Biosphere Reserve, Canada. Biological Conservation 96:311-317.
Ducrocq, J., (and 12 co-authors). 2012. Comparison of gross visual and microscopic assessment of four anatomic sites to monitor Besnoitia tarandi in barren-ground caribou (Rangifer tarandus groenlandicus). Journal of Wildlife Diseases 48:732-738.
Ducrocq, J., (and 7 co-authors). 2013. Variables associated with Besnoitia tarandi prevalence and cyst density in barren-ground caribou (Rangifer tarandus) populations. Journal of Wildlife Diseases 49:29-38.
Dumont, A., and M. Crête. 1996. The meningeal worm, Parelaphostrongylus tenuis, a marginal limiting factor for moose, Alces alces. Canadian Field-Naturalist 110:413-418.
Dzus, E., J. Ray, I. Thompson, and C. Wedeles. 2010. Caribou and the National Boreal Standard: Report of the FSC Canada Science Panel.
Elliot, C., 1998. Cape Churchill Caribou: Staus of herd and harvest. Manuscript Report 98-05w. Manitoba Natural Resources. 16 pp.
Elmendorf, S.C., (and 46 co-authors). 2012. Plotscale evidence of tundra vegetation change and links to recent summer warming. Nature Climate Change 2:453-457.
Environment Canada. 2008. Scientific review for the identification of critical habitat for woodland caribou (Rangifer tarandus caribou), Boreal population, in Canada. Environnement Canada, Ottawa, Ontario.
Environment Canada. 2011. Scientific assessment to inform the identification of critical habitat for woodland caribou (Rangifer tarandus caribou), Boreal population, in Canada–2011 Update. Environment Canada, Ottawa, Ontario.
Ferguson, S.H., and P.C. Elkie. 2004. Seasonal movement patterns of woodland caribou (Rangifer tarandus caribou). Journal of Zoology 262:125-134.
Festa-Bianchet, M., J.-M. Gaillard, and S.D. Côté. 2003. Variable age structure and apparent density-dependence in survival of adult ungulates. Journal of Animal Ecology 72:640-649.
Festa-Bianchet, M., J.C. Ray, S. Boutin, S.D. Côté, and A. Gunn. 2011. Caribou conservation in Canada: an uncertain future. Canadian Journal of Zoology 89:419-434.
Finnis, J. 2013. Predicted impacts of climate change on the province of Newfoundland and Labrador. Unpub. Report. Depat. Geography, Memorial University, Newfoundland and Labrador.
Fraser, R.H., I. Olthof, M. Carrière, A. Deschamps, and D. Pouliot. 2011. Detecting long-term changes to vegetation in northern Canada using the Landsat satellite image archive. Environmental Research Letters 6:045502.
Fraser, R.H., T.C. Lantz, L. Olthof, S.V. Kokelj, and R.A. Sims. 2014. Warming-induced shrub expansion and lichen decline in the Western Canadian Arctic. Ecosystems 17(7): 1151-1168.
Furgal, C., and L. Rochette. 2007. Perception of contaminants, participation in hunting and fishing activities, and potential impacts of climate change. Institut national de santé publique du Québec and Nunavik Regional Board of Health and Social Services, Québec, Québec.
Gaillard, J.-M., M. Festa-Bianchet, N.G. Yoccoz, A. Loison, and C. Toïgo. 2000. Temporal variation in fitness components and population dynamics of large herbivores. Annual Review of Ecology and Systematics 31:367-393.
Gamberg, M. 2004. Contaminants in Yukon moose and caribou–2003. Prepared for Yukon contaminants committee, and Department of Indian Afairs and Northern Development, Whitehorse, Yukon.
Gauthier, L., R. Nault, and M. Crête. 1989. Variations saisonnières du régime alimentaire des caribous du troupeau de la rivière George, Québec nordique. Le Naturaliste Canadien 116:101-112.
Geist, V. 1998. Deer of the world: Their evolution, behavior, and ecology. Stackpole Books, Mechanicsburg, Pennsylvania.
Gerhart, K.L., (and 5 co-authors). 1997. Pregnancy of adult caribou (Rangifer tarandus): evidence for lactational infertility. Journal of Zoology 242:17-30.
Gordon, B. 2003. Rangifer and man: An ancient relationship. Rangifer, Special Issue 14:15-28.
Gordon, B. C. 2005. 8000 years of caribou and human seasonal migration in the Canadian Barrenlands. Rangifer16:155-162.
Gouvernement du Québec. 2014. Rapport sur les activités minières au Québec 2013, Direction générale de géologie Québec, secteur des opérations régionales et secteur des mines, Québec, Québec, 133 p.
Government of Newfoundland and Labrador. 2016. Provincial governmebt maintains huntin ban on George River Caribou herd. News release. March 23, 2016. [www.releases.gov.nl.ca/releases/2016/env/0323n02.aspx].
Grayson, D.K., and F. Delpeche. 2005. Pleistocene reindeer and global warming. Conservation Biology 19:557-562.
Gunn, A., and R.J. Irvine. 2003. Subclinical parasitism and ruminant foraging stategies - a review. Wildlife Society Bulletin 31:117-126.
Gunn, A., D. Russell, and J. Eamer. 2011. Northern caribou population trends in Canada. Canadian Biodiversity: Ecosystem Status and Trends 2010, Technical Thematic Report No. 10. Canadian Councils of Resource Ministers, Ottawa, Ontario.
Gunn, A. 2016. Rangifer tarandus. IUCN Red List of Threatened Species 2016.: e.T29742A22167140. [accessed: August 2016].
Gustine D.D., K.L. Parker, R.J. Lay, M.P. Gillingham, and D.C. Heard. 2006. Calf survival of woodland caribou in a multi-predator ecosystem. Wildlife Monographs 165:1-32.
Harrington, F., and A. Veitch. 1991. Short-term impact of low level jet fighter training on caribou in Labrador. Arctic 44:318-327.
Hayes, R.D. 1995. Numerical and functional responses of wolves, and regulation of moose in the Yukon. MSc thesis. Simon Fraser University, Burnaby, British Columbia.
Hayes, R.D., (and 8 co-authors). 2003. Experimental reduction of wolves in the Yukon: Ungulate responses and management implications. Wildlife Monographs 152:1-35.
He, Y., X. Guo, P. Dixon, and J. Wilmshurst. 2008. Satellite monitoring of northern ecosystems using multi-sensors. Unpublished report. Dept. Geography, University Saskatchewan.
Hearn, B. J., S., Luttich, M. Crête, and M. Berger. 1990. Survival of radio-collared caribou (Rangifer tarandus caribou) from the George River herd, Nouveau-Québec - Labrador. Canadian Journal of Zoology68: 276-283.
Hedman, D. unpublished data. Declining Caribou; shared concerns, shared solutions. Powerpoint presentation. Manitoba Conservation. September 2012.
Hummel, M., and J.C. Ray. 2008. Caribou and the North: A Shared Future . Dundurn Press, Toronto, Ontario.
Huot, J. 1989. Body composition of the George River caribou herd (Rangifer tarandus caribou) in fall and late winter. Canadian Journal of Zoology 67:103-107.
IUCN. 2008. IUCN Red List. http://www.iucnredlist.org/details/29742/0 (accessed 25 November 2014).
IUCN Standards and Petitions Subcommittee. 2013. Guidelines for Using the IUCN Red List Categories and Criteria. Version 10.1. Prepared by the Standards and Petitions Subcommittee. From http://www.iucnredlist.org/documents/RedListGuidelines.pdf. (accessed 25 November 2014).
Johnson, C.J., (and 6 co-authors). 2005. Quantifying the cumulative effects of human developments: a regional environmental assessment for sensitive Arctic wildlife. Wildlife Monographs 160:1-36.
Johnson, D., N.J. Harms, N.C. Larter, B.T. Elkin, H. Tabe, and G. Wei.. 2010. Serum biochemistry, serology, and parasitology of boreal caribou (Rangifer tarandus caribou) in the northwest territories, Canada. Journal of Wildlife Diseases 46:1096-1107.
Kelsall, J.P. 1968. The Migratory Barren-ground Caribou of Canada. Department of Indian Affairs and Northern Development. Canadian Wildlife Service, Ottawa, Ontario.
Klütsch, C.F.C., M. Manseau, and P.J. Wilson. 2012. Phylogeographical analysis of mtDNA data indicatesp expansion from multiple glacial refugia in woodland caribou (Rangifer tarandus caribou). Plos One 7:e52661.
Krawchuk, M.A., M.A. Moritz, M.-A. Parisien, J. Van Dorn, and K. Hayhoe. 2009. Global pyrogeography: the current and future distribution of wildfire. Plos One 4:e5102.
Kutz, S. J., 2016. Personal communication. Email correspondence with G. Forbes. September 2016. Wildlife Veterinarian, University of Calagary, Alberta.
Kutz, S.J., E.P. Hoberg, J. Nagy, L. Polley, and B. Elkin. 2004. “Emerging” parasitic infections in Arctic ungulates. Integrative and Comparative Biology 44:109-118.
Kutz, S.J., (and 6 co-authors). 2009. The Arctic as a model for anticipating, preventing, and mitigating climate change impacts on host-parasite interactions. Veterinary Parasitology 163:217-228.
Kutz, S.J., (and 8 co-authors). 2012. Parasites of ungulates of arctic North America and Greenland: A view of contemporary diversity, ecology, and impact in a world under change. Advances in Parasitology 79:99-252.
Kutz, S.J., (and 4 co-authors). 2014. A walk on the tundra: Host–parasite interactions in an extreme Environment. International Journal of Parasitology: Parasites and Wildlife. http://dx.doi.org/10.1016/j.ijppaw.2014.01.002
Kwan, M., 2011. Heavy Metals in Leaf River Herd Caribou and Nunavik Muskoxen. Nunavik Research Centre, Makivik Corportation. 33 pp.
Lankester, M.W., and S. Luttich. 1988. Fascioloides magna (Trematoda) in woodland caribou (Rangifer tarandus caribou) of the George River herd, Labrador. Canadian Journal of Zoology 66:475-479
Latham, D.M., M.C. Latham, M.S. Boyce, and S. Boutin. 2011. Movement responses by wolves to industrial linear features and their effect on woodland caribou in northeastern Alberta. Ecological Applications 21:2854-2865.
Leblond M, St-Laurent M-H, Côté SD. 2016. Caribou, water, and ice – fine-scale movements of a migratory arctic ungulate in the context of climate change. Movement Ecology 4:14.
Leclerc, M., C. Dussault, and M.-H. St-Laurent. 2014. Behavioural strategies towards human disturbances explain individual performance in woodland caribou. Oecologia 176:297-306.
Le Corre, M., C. Dussault, and S.D. Côté. 2014. Detecting changes in the annual movements of migratory caribou: Using the first-passage time to assess departure and arrival of the spring migration. Movement Ecology 2:19.
Le Goff, H., M. Flannigan, and Y. Bergeron. 2009. Potential changes in monthly fire risk in the eastern Canadian boreal forest under future climate change. Canadian Journal of Forest Research 39:2369-2380.
Le Hénaff, D. 1976. Inventaire aérien des terrains de vêlage du caribou dans la région nord et au nord du territoire de la municipalité de la Baie James (mai-juin 1975). Ministère du Tourisme, de la Chasse et de la Pêche, Québec, Québec.
L’Italien, L., (and 5 co-authors). 2012. Mating group size and stability in reindeer Rangifer tarandus: the effects of male characteristics, sex ratio and male age-structure. Ethology118:783-792.
Magoun, A.J., (and 8 co-authors). 2005. Distribution and relative abundance of caribou in the Hudson Plains Ecozone of Ontario. Rangifer, Special Issue 16:105-121.
Mahant, S.P. 2013. Effects of snowmobile trails on woodland caribou habitat selection in Gros Morne National Park. Honours thesis, Trent University, Peterborough, Ontario.
Mahoney, S.P., and J.N. Weir. 2009. Caribou Data Synthesis--Progress Report. Overview of the status of woodland caribou in insular Newfoundland: research methodology, results, interpretations and future projections. Sustainable Development and Strategic Science, Government of Newfoundland and Labrador, St. John’s, Newfoundland and Labrador.
Manseau, M., J. Huot, and M. Crête. 1996. Effects of summer grazing by caribou on composition and productivity of vegetation: community and landscape level. Journal of Ecology 84:503-513.
Mayor, S.J., J.A. Schaefer, D.C. Schneider, and S.P. Mahoney. 2009. The spatial structure of habitat selection: A caribou's-eye-view. Acta Oecologica 35:253-260.
McCarthy, S. 2016. Ecosystem Management Ecologist, NL Widlife Division. Email correspondence with G. Forbes, September 2016.
McEwan, E.H., and P.E. Whitehead. 1972. Reproduction in female reindeer and caribou. Canadian Journal of Zoology 50:43-46.
Messier, F., J. Huot, D. Le Henaff, and S. Luttich. 1988 Demography of the George River caribou herd: evidence of population regulation by forage exploitation and range expansion. Arctic 41:279–287.
Meyers-Smith, I., (and 31 co-authors). 2011. Shrub expansion in tundra ecosystems: dynamics, impacts, and research priorities. Environmental Research Letters 6: 2011.
Ministere du Développement Durable, de la Faune et des Parcs (MDDEFP). 2013. Projets de parc national et de territoires de mise en valuer de la faune. Québec City, QC. [www.mddep.gouv.qc.ca/parcs/projets/index.htm].
Ministère de la faune et des parcs du Québec (MFFP). 2016. Email communication to G. Forbes. August 2016.
Ministère de la faune et des parcs du Québec (MFFP). 2017. Migratory caribou sport hunting closure – press release. [http://mffp.gouv.qc.ca/english/press/press-release-detail.jsp?id=11881].
Miller, F.L. 2003. Caribou (Rangifer tarandus). pp. 965-997 in Wild Mammals of North America: Biology, Management, and Conservation . 2003. G.A. Feldhamer, B.C. Thompson, and J.A. Chapman (eds). The Johns Hopkins University Press, Baltimore, Maryland.
Mitchell, G.B., (and 7 co-authors). 2012. Experimental oral transmission of Chronic Wasting Disease to reindeer (Rangifer tarandus tarandus). Plos One 7:e39055.
Moores, Shelley. 2016. Newfoundland and Labrador Wildlife Division. Email communication with G. Forbes, November 2016.
Morneau, C., and S. Payette. 1989. Postfire lichen-spruce woodland recovery at the limit of the boreal forest in northern Québec. Canadian Journal of Botany 67: 2770-2782.
Morneau, C., and S. Payette. 2000. Long-term fluctuations of a caribou population revealed by tree-ring data. Canadian Journal of Zoology 78:1784-1790.
Mosnier, A., J.-P. Ouellet, L. Sirois, and N. Fournier. 2003. Habitat selection and home-range dynamics of the Gaspé caribou: a hierarchical analysis. Canadian Journal of Zoology 81:1174-1184.
Müller, D.W.H., L.B. Lackey, W.J. Streich, J.-M. Hatt, and M. Clauss. 2010. Relevance of management and feeding regimens on life expectancy in captive deer. American Journal of Veterinary Research 71:275-280.
Musiani, M., J.A. Leonard, H. Cluff, C.C. Gates, S. Mariani, P.C. Paquet, C. Vilà, and R.K. Wayne. 2007. Differentiation of tundra/taiga and boreal coniferous forest wolves: genetics, coat colour and association with migratory caribou. Molecular Ecology 16:4149-4170.
Myers-Smith (and 31 co-authors). 2011. Shrub expansion in tundra ecosystems: dynamics, impacts and research priorities. Environmental Research Letters 6:045509.
Myers-Smith (and 32 co-authors). 2015. Climate sensitivity of shrub growth across the tundra biome. Nature Climate Change 5:887-891.
Nagy, J. 2011. Use of space by caribou in northern Canada. Ph.D. Thesis, University of Alberta, Edmonton, Alberta.
NatureServe. 2012. NatureServe Explorer: An online encyclopedia of life [web application]. Version 7.1. NatureServe, Arlington, Virginia. Available http://www.natureserve.org/explorer.
Newton, E.J., B.A. Pond, G.F. Brown, K.F. Abraham, and J.A. Schaefer. 2014. Remote sensing reveals long-term effects of caribou on tundra vegetation. Polar Biology 37: 715-725.
Newton, E.J., K.F. Abraham, J.A. Schaefer, B.A. Pond, G.S. Brown, and J.E. Thompson. 2015. Causes and consequences of broad-scale changes in the distribution of migratory caribou (Rangifer tarandus) of Southern Hudson Bay. Arctic 68: 472-485
Northern Miner 2014. Québec government relaunches Plan Nord. June 18, 2014. http://www.northernminer.com/news/québec-relaunches-plan-nord/1003103496/ [accessed 25 November 2014].
Ontario Ministry of Natural Resources and Forestry (OMNR). 2008. Discussion Paper: Keeping Caribou in Ontario. Ontario Ministry of Natural Resources, Fish and Wildlife Branch, Species at Risk Section, Peterborough, Ontario. 41 pp.
Ontario Ministry of Natural Resources and Forestry (OMNRFa). 2014. State of the Woodland Caribou Resource Report. Species at Risk Branch, Thunder Bay, Ontario.
Ontario Ministry of Natural Resources and Forestry (OMNRFb). 2014. Range Management Policy in Support of Woodland Caribou Conservation and Recovery. Species at Risk Branch, Thunder Bay, Ontario. 11 pp.
Pachano, R. 2016. Chairperson, Eeyou Marine Region Wildlife Board. Letter communication to COSEWIC Secretariat, February 2016.
Pachkowski, M., M. Festa-Bianchet, and S.D. Côté. 2013. Spring-loaded reproduction: effects of body condition and population size on fertility in migratory caribou (Rangifer tarandus). Canadian Journal of Zoology 91:473-479.
Parker, G.R. 1980. Physical and reproductive parameters of pre-calving caribou (Rangifer tarandus caribou) in northern Labrador. Unpub. Report available at Canadian Wildlife Service, Sackville, New Brunswick. 86 p.
Parks Canada Agency. 2008. Torngat Mountains National Park of Canada: State of park report, Québec, Québec.
Payette, S., S. Boudreau, C. Morneau, and N. Pitre. 2004. Long-term interactions between migratory caribou, wildfires and Nunavik hunters inferred from tree rings. Ambio 33:482-486.
Payette, S., C. Morneau, L. Sirois, and M. Desponts. 1989. Recent fire history of northern Québec biomes. Ecology 70:656-673.
Pinard, V., C. Dussault, J.-P. Ouellet, D. Fortin, and R. Courtois. 2012. Calving rate, calf survival rate, and habitat selection of forest-dwelling caribou in a highly managed landscape. Journal of Wildlife Management 76:189-199.
Pisapio, John. 2016. Government of Newfoundland and Labrador Widlife Division. Email communication to G. Forbes, November 2016.
Pitt, W.C., and P.A. Jordan. 1994. A survey of the nematode parasite Parelaphostrongylus tenuis in the white-tailed deer, Odocoileus virginianus, in a region proposed for caribou, Rangifer tarandus caribou, re-introduction in Minnesota. Canadian Field-Naturalist 108:341-346.
Polfus, J.L., Hebblewhite M., Heinemeyer K. 2011. Identifying indirect habitat loss and avoidance of human infrastructure by northern mountain woodland caribou. Biological Conservation 144: 2637-2646.
Polfus, J.L., (and 9 co-authors). 2016. Łeghágots'enetę (learning together): the importance of indigenous perspectives in the identification of biological variation. Ecology and Society 21: 18. http://dx.doi.org/10.5751/ES-08284-210218.
Pond, B.A., G.S. Brown, K.S. Wilson, and J.A. Schaefer. 2016. Drawing lines: Spatial behaviours reveal two ecotypes of woodland caribou. Biological Conservation 194: 139-148.
Pouliot, D., R. Latifovic, and I. Olthof. 2009. Trends in vegetation NDVI from 1km AVHRR data over Canada for the period 1985-2006. International Journal of Remote Sensing 30:149-168.
Post, E., and M.C. Forchhammer. 2008. Climate change reduces reproductive success of an Arctic herbivore through trophic mismatch. Philosophical Transactions of the Royal Society B 363:2369-2375.
Quebec Government. 2011. Regulation Respecting Wildlife Habitats (R.R.Q., c C-61.1, r 18) and the Conservation and Development of Wildlife Act (R.S.Q., c. C-61.1). Québec, QC. <http://www.mddep.gouv.qc.ca/publications/loisreglem-en.htm> (accessed 16 November 2011).
Quirouette, J. 2015. Subtle Vegetation Change – Torngat Mountains. Unpublished report. Torngat Mountains National Park, Monitoring and Ecological Information Division.
Racey, G.D., and T. Armstrong. 2000. Woodland caribou range occupancy in northwestern Ontario: past and present. Rangifer, Special Issue 12:173-184.
Rasiulis, A. 2015. Survie et dynamique de population des caribous migrateurs du Québec-Labrador. Mémoire de maîtrise, Université Laval, Québec, Québec.
Rasiulis, A.L., M. Festa-Bianchet, S. Couturier, and S.D. Côté. 2014. The effect of radio-collar weight on survival of migratory caribou. Journal of Wildlife Management 78:953-956.
Røed, K.H., M.A.D. Ferguson, M. Crête, and T.A. Bergerud. 1991. Genetic variation in transferrin as a predictor for differentiation and evolution of caribou from eastern Canada. Rangifer 11:65-74.
Røed, K.H., S.D. Côté, and G. Yannic. In press. Rangifer tarandus, classification and genetic variation. In Reindeer and caribou: health and diseases. M. Tryland, S.Kutz, A. Oksanen (eds). CRC Press, Boca Raton, California.
Rudolph, T., P. Drapeau, M.-H. St. Laurent, and L. Imbeau. 2012. Situation du caribou forestier sur le territoire de la Baie James dans le region Nord-du-Québec. Montreal Québec. 77 pp.
Russell, D.E., Martell, A.M. and Nixon, W.A. 1993. The range ecology of the Porcupine Caribou herd in Canada. Rangifer Special Issue 8:1-168.
Samuel, W.M. 2004. White as a ghost: Winter ticks and moose. Natural History Series, Volume 1, Federation of Alberta Naturalists, Edmonton, Alberta.
Schaefer, J.A., and S.N. Luttich. 1998. Movements and activity of caribou, Rangifer tarandus caribou, of the Torngat Mountains, Northern Labrador and Québec. Canadian Field-Naturalist 112:486-490.
Schaefer, J.A., and W.O.J. Pruitt. 1991. Fire and woodland caribou in southeastern Manitoba. Wildlife Monographs 116:3-39.
Schmelzer, I. Personal communication. 2016. Correpsondence to report authors. Autumn 2016. Biologist, Government of Newfoundland and Labrador.
Sharma, S., S. Couturier, and S.D. Côté. 2009. Impacts of climate change on the seasonal distribution of migratory caribou. Global Change Biology 15:2549-2562.
Simard, A.-A. (and 15 co-authors). 2016. Variation in the intensity and prevalence of macroparasites in migratory Caribou: a quasi-circumpolar study. Canadian Jounral of Zoology 97:607-617.
Smart, M. 2016. Executive Secretary, Hunting, Fishing and Trapping Coordinating Committee. Letter communication to G. Forbes, August 2016.
Sommer, R.S., U. Fritz, H. Seppä, J. Ekström, A. Persson, and R. Liljegren. 2011. When the pond turtle followed the reindeer: effect of the last extreme global warming event on the timing of faunal change in Northern Europe. Global Change Biology 17:2049-2053.
Sturm, M., C. Racine, and K. Tape. 2001. Climate change - Increasing shrub abundance in the Arctic. Nature411:546-547.
Sturm, M., (and 7 co-authors). 2005. Winter biological processes could help convert arctic tundra to shrubland. Bioscience 55:17-26.
Taillon, J., V. Brodeur, M. Festa-Bianchet, and S.D. Côté. 2011. Variation in body condition of migratory caribou at calving and weaning–which measures should we use? Ecoscience 18:295-303.
Taillon, J., V. Brodeur, and S. Rivard. 2016. Biological status of migratory caribou, Leaf River herd. Ministère des Forêts, de la Faune et des parcs, Québec, 69 pp.
Taillon, J., M. Festa-Bianchet, and S.D. Côté. 2012a. Shifting targets in the tundra: protection of migratory caribou calving grounds must account for spatial changes over time. Biological Conservation 147:163-173.
Taillon, J., V. Brodeur, M. Festa-Bianchet, and S.D. Côté. 2012b. Is mother condition related to offspring condition in migratory caribou at calving and weaning? Canadian Journal of Zoology 90:393-402.
Taillon, J., P.S. Barboza, and S.D. Côté. 2013. Nitrogen allocation to offspring and milk production in a capital breeder. Ecology 94:1815-1827.
Tapscott, B. 2011. Chronic Wasting Disease - Fact sheet. Ontario Ministry of Natural Resources, Ontario.
Théau, J., and C.R. Duguay. 2004. Mapping lichen changes in the summer range of the George River caribou herd (Québec-Labrador, Canada) using Landsat imagery (1976-1998). Rangifer 24:31-50.
Therrien, J., R. Verdon, and R. Lalumiere. 2004. Environmental monitoring at the La Grande complex. Changes in fish communities. Summary report 1977-2000, GENIVAR groupe conseil inc. et Direction barrages et environnement, Hydro-Québec production, Québec, Québec, 129 p.
Thomas, D., S. Barry, and G. Alaie. 1995. Fire-caribou-winter range relationships in northern Canada. Rangifer 16:57-67.
Thomas, D.C., and J.E. Edmonds. 1984. Competition between caribou and muskoxen, Melville Island, N.W.T., Canada. Biological Paper University of Alaska Special Report 4: 93-100.
Thomas, D.C., and H.P.L. Kiliaan. 1998. Fire-caribou relationships: (II) Fecundity and physical condition of the Beverly herd. –Technical Report Series No. 310. Canadian Wildlife Service, Prairie and Northern Region, Edmonton, Alberta.
Thomas, D.C., and D.R. Gray. 2002. Update COSEWIC status report on the woodland caribou Rangifer tarandus caribou in Canada. In COSEWIC assessment and update status report on the woodland caribou Rangifer tarandus caribou in Canada. Committee on the Status of Endangered Wildlife in Canada, Ottawa, Ontario, pp. 1-98.
Thompson, J., and K. Abraham. 1994. Range, seasonal distribution and population dynamics of the Pen Islands caribou herd of southern Hudson Bay. OMNR Report Moosonee, Ontario. 94 p.
Toupin, B., J. Huot, and M. Manseau. 1996. Effect of insect harassment on the behaviour of the Rivière George caribou. Arctic 49:375-382.
Tremblay, B., E. Lévesque, and S. Boudreau. 2012. Recent expansion of erect shrubs in the low Arctic: evidence from Eastern Nunavik. Environmental Research Letters 7:035501.
Veitch, A.M., and P.K. Krizan. 1996. Black bear predation on vertebrates in northern Labrador. Journal of Wildlife Research 1:193-194.
Vistnes, I., and C. Nellemann. 2008. The matter of spatial and temporal scales: a review of reindeer and caribou response to human activity. Polar Biology 31:399-407.
Vors, L.S. 2013. Caribou in Canada: Ecology and policy. Ph.D. Thesis, University of Alberta, Edmonton, Alberta.
Vors, L.S., and M.S. Boyce. 2009. Global declines of caribou and reindeer. Global Change Biology 15:2626-2633.
Walton. L., K. Abraham, V. Crichton, and H. Stewart. 2011. Caribou. Pages 176-185 in Hudson Plains Ecozone: Status and Trends Assessment (K. Abraham et al.; lead authors) Canadian Biodiversity: Ecosystem Status and Trends 2010. Technical Ecozone Report. Canadian Council of Resource Ministers, Ottawa, Ontario. 445 pp.
Wasel, S., W. Samuel, and V. Crichton. 2003. Distribution and ecology of Parelaphostryongylus tenuis (Nematoda), in northcentral North America. Journal of Wildlife Diseases 39:338-346.
Way, R., and A. Viau. 2014. Natural and forced air temperature variability in the Labrador region of Canada during the past century. Theoretical and Applied Climatology 121:413-424.
Weir, J.N., S.P. Mahoney, B. McLaren, and S.H. Ferguson. 2007. Effects of mine development on woodland caribou Rangifer tarandus distribution. Wildlife Biology 13: 66-74.
Weladji, R.B., Ø. Holand, and T. Almøy. 2003. Use of climatic data to assess the effect of insect harassment on the autumn weight of reindeer (Rangifer tarandus) calves. Journal of Zoology 260:79-85.
Wells, J., J. Jacobs, I. Goudie, and J. Feldgajer. 2011. Intact habitat landscapes and woodland caribou on the island of Newfoundland. Canadian Boreal Initiative, Ottawa, Ontario.
Williamson, T. 1997. From Sina to Sikujâluk: Our footprint, Mapping Inuit Environmental Knowledge in the Nain District of Northern Labrador. The Labrador Inuit Association, 119 p.
Wilson, K. 2013. Temporal and spatial variation in home range size for two woodland ecotypes in Ontario. MSc Thesis. Trent University, Peterborough, Ontario.
Wilson, K.S., M.W. Basterfield, C. Furgal, T. Sheldon, and E. Allen. 2014. The communities of Nain and Kangiqsualujjuaq, and the Co-operative Management Board for the Torngat Mountains National Park. Torngat Mountains Caribou Herd Inuit Knowledge, Culture, and Values Study. Final Report to the Nunatsiavut Government, Makivik Corporation, Parks Canada, and the Torngat Wildlife and Plants Co-Management Board, Nain, Newfoundland and Labrador.
Yannic, G., (and 20 co-authors). 2014. Genetic diversity in caribou linked to past and future climate change. Nature Climate Change 4:132-137.
Yannic, G., (and 7 co-authors). 2016. Integrating ecological and genetic structure to define management units for caribou in Eastern Canada. Conservation Genetics 17:437-453.
Biographical summary of report writers
Steeve D. Côté has been working on the ecology of large herbivores since 1991. He received his PhD in 1999 from the Université de Sherbrooke, working on the behavioural ecology of mountain goats. Dr. Côté has been a professor at Laval University (city of Québec) since 2001. He has extensive knowledge of Caribou. He began studying migratory Caribou in Quebec-Labrador (DU 4) in 1992 and has been leading the Caribou Ungava research group since its creation in 2007 (http://www.caribou-ungava.ulaval.ca/en/accueil/).
Dr. Marco Festa-Bianchet is a professor in the Biology Department at the Université de Sherbrooke. He received a PhD in Behavioural Ecology from the University of Calgary in 1987. From 1988 to 1990 he was a NATO Postdoctoral Fellow, Large Animal Research Group, University of Cambridge. He has conducted extensive research on mountain ungulates, Caribou and kangaroos. He is a former member and co-chair of the COSEWIC Terrestrial Mammals Specialist Subcommittee and was chair of COSEWIC for 4 years.
Collections examined
No collections were examined during the preparation of this status report.
Appendix 1. Threats Classification Table for Eastern Migratory Caribou DU 4)
Threats assessment worksheet
- Species or ecosystem scientific name:
- Caribou (Eastern Migratory population) - DU4
- Element ID:
- El code:
- Date (Ctrl + ";" for today's date):
- 21/01/2016
- Assessor(s):
- Members: Graham Forbes (TM SSC Co-chair), Dwayne Lepitzki (COSEWIC moderator), Donna Hurlburt (ATK SC Co-chair), Isabelle Gauthier (QC), Shelley Moores (NL)
Report authors: Steeve Côté and Marco Festa-Bianchet
External Experts: John Pisapio (NL), Martin Lougheed (Parks - Torngat), Darroch Whitaker (Parks - Torngat), Todd Copeland (ON), Darren Elder (ON - MNR), Vincent Brodeur (QC), Allan Penter (Cree Nation), Josée Brunelle (HFTCC), Natalie D’Astous (Naskapi Nation of Kawawachikamach), Jennifer Mitchell (TWPCB), Serge Couturier (Consultant Biologist for TWPCB), Roderick Pachano (EMRWB), Mark O'Connor (Makivik Corporation), Karen Timm (COSEWIC Secretariat) - References:
- draft COSEWIC report and draft calculator provided by report writers Steeve Côté Marco Festa-Bianchet; telecon on 21 Jan 2016
| Threat impact | Threat impact (descriptions) | Level 1 Threat impact counts: high range |
Level 1 Threat impact counts: low range |
|---|---|---|---|
| A | Very high | 0 | 0 |
| B | High | 1 | 0 |
| C | Medium | 2 | 1 |
| D | Low | 3 | 5 |
| - | Calculated overall threat impact: | Very High | High |
- Assigned overall threat impact:
- B = High
- Impact Adjustment Reasons
- Overall Threat Comments:
| Threat | Threat | Threat | Impact (calculated) | Impact (calculated) | Impact (calculated) | Scope (next 10 Yrs) | Scope (next 10 Yrs) | Severity (10 Yrs or 3 Gen.) | Severity (10 Yrs or 3 Gen.) | Timing | Comments | Comments |
|---|---|---|---|---|---|---|---|---|---|---|---|---|
| 1 | Residential & commercial development | Residential & commercial development | blank cell | blank cell | Negligible | Negligible (<1%) | Negligible (<1%) | Negligible (<1%) | Negligible (<1%) | Moderate (Possibly in the short term, < 10 yrs) | blank cell | blank cell |
| 1.1 | Housing & urban areas | Housing & urban areas | blank cell | blank cell | Negligible | Negligible (<1%) | Negligible (<1%) | Extreme (71-100%) | Extreme (71-100%) | Moderate - Insignificant/Negligible | Very low density urban areas. Likely some additional housing planned for future, so scope and timing unknown, but if it comes it will be extreme. | Very low density urban areas. Likely some additional housing planned for future, so scope and timing unknown, but if it comes it will be extreme. |
| 1.2 | Commercial & industrial areas | Commercial & industrial areas | blank cell | blank cell | Negligible | Negligible (<1%) | Negligible (<1%) | Extreme (71-100%) | Extreme (71-100%) | Moderate - Insignificant/Negligible | Likely some additional commercial and industrial areas planned for future, so scope and timing unknown, but if it comes it will be extreme. | Likely some additional commercial and industrial areas planned for future, so scope and timing unknown, but if it comes it will be extreme. |
| 1.3 | Tourism & recreation areas | Tourism & recreation areas | blank cell | blank cell | Negligible | Negligible (<1%) | Negligible (<1%) | Negligible (<1%) | Negligible (<1%) | Moderate (Possibly in the short term, < 10 yrs) | New parks planned in this DU, and some planning underway for protected areas in George and Leaf River Range. However, the percentage of infrastructure will be negligible for projected parks and protected areas, which results in negligible severity overall. | New parks planned in this DU, and some planning underway for protected areas in George and Leaf River Range. However, the percentage of infrastructure will be negligible for projected parks and protected areas, which results in negligible severity overall. |
| 2 | Agriculture & aquaculture | Agriculture & aquaculture | blank cell | blank cell | blank cell | blank cell | blank cell | blank cell | blank cell | blank cell | This DU is not expected to be exposed to threats from agriculture and aquaculture in next 10 years. | This DU is not expected to be exposed to threats from agriculture and aquaculture in next 10 years. |
| 2.1 | Annual & perennial non-timber crops | Annual & perennial non-timber crops | blank cell | blank cell | blank cell | blank cell | blank cell | blank cell | blank cell | blank cell | blank cell | blank cell |
| 2.2 | Wood & pulp plantations | Wood & pulp plantations | blank cell | blank cell | blank cell | blank cell | blank cell | blank cell | blank cell | blank cell | blank cell | blank cell |
| 2.3 | Livestock farming & ranching | Livestock farming & ranching | blank cell | blank cell | blank cell | blank cell | blank cell | blank cell | blank cell | blank cell | blank cell | blank cell |
| 2.4 | Marine & freshwater aquaculture | Marine & freshwater aquaculture | blank cell | blank cell | blank cell | blank cell | blank cell | blank cell | blank cell | blank cell | blank cell | blank cell |
| 3 | 3 | Energy production & mining | BD | High - Low | High - Low | High - Low | Large - Small (1-70%) | Serious - Moderate (11-70%) | Moderate (Possibly in the short term, < 10 yrs) | Moderate (Possibly in the short term, < 10 yrs) | blank cell | |
| 3.1 | 3.1 | Oil & gas drilling | blank cell | Negligible | Negligible | Negligible | Negligible (<1%) | Moderate - Slight (1-30%) | Low (Possibly in the long term, >10 yrs) | Low (Possibly in the long term, >10 yrs) | No current oil and gas drilling in range. Normally, oil and gas development in this area would have a large footprint, and not only in a few scattered areas. Caribou exhibit avoidance behaviour to these types of activities. | |
| 3.2 | 3.2 | Mining & quarrying | BD | High - Low | High - Low | High - Low | Large - Small (1-70%) | Serious - Moderate (11-70%) | Moderate (Possibly in the short term, < 10 yrs) | Moderate (Possibly in the short term, < 10 yrs) | Currently low number of mines but may be increasing. If there is a new mine here, a high proportion of the DU could be migrating close to the mine during spring and fall. A few mines are proposed, some of which are in sensitive areas. Unknown as to if or when they will be approved. Note this estimate does consider the roads leading to the mines. Even with appropriate mitigations, the implications could be serious for Caribou. | |
| 3.3 | 3.3 | Renewable energy | D | Low | Low | Low | Restricted - Small (1-30%) | Moderate - Slight (1-30%) | Moderate (Possibly in the short term, < 10 yrs) | Moderate (Possibly in the short term, < 10 yrs) | There is a windmill at a current mine site. Proposals in development on new wind farms that could impact the Leaf River Herd. This technology occurs at a very high landscape level. | |
| 4 | 4 | Transportation & service corridors | D | Low | Low | Low | Pervasive (71-100%) | Slight (1-10%) | High (Continuing) | High (Continuing) | blank cell | |
| 4.1 | 4.1 | Roads & railroads | D | Low | Low | Low | Pervasive (71-100%) | Slight (1-10%) | High (Continuing) | High (Continuing) | Limited road network is expanding. Roads allow better access to hunters who then use skidoos to reach Caribou. If road to Kuujjuarapik is built, a huge proportion of Leaf River subpopulation would be exposed to it. The road is related to the James Bay Settlement Agreement. Roadkill and road maintenance effects may be negligible. Road mortality also includes those animals dying far off the road (may outnumber those found on road proper). Cases of muscle myopathy of animals running on roads for long distances (and may die far from road as well) and can reduce body condition to further affect reproduction. Range for severity is more towards the lower end. | |
| 4.2 | 4.2 | Utility & service lines | blank cell | Negligible | Negligible | Negligible | Negligible (<1%) | Negligible (<1%) | Unknown | Unknown | New power lines are being considered. If the Plan Nord (Economic Development plan) plan goes forward, impacts could be high. | |
| 4.3 | 4.3 | Shipping lanes | blank cell | blank cell | blank cell | blank cell | blank cell | blank cell | blank cell | blank cell | blank cell | |
| 4.4 | 4.4 | Flight paths | blank cell | Negligible | Negligible | Negligible | Pervasive (71-100%) | Negligible (<1%) | High (Continuing) | High (Continuing) | Regular commercial flights to communities. | |
| 5 | 5 | Biological resource use | C | Medium | Medium | Medium | Pervasive (71-100%) | Moderate (11-30%) | High (Continuing) | High (Continuing) | blank cell | |
| 5.1 | 5.1 | Hunting & collecting terrestrial animals | C | Medium | Medium | Medium | Pervasive (71-100%) | Moderate (11-30%) | High (Continuing) | High (Continuing) | Hunting still occurs for the TRAF, currently closed for the TRG for sport hunters, but some Aboriginal harvest still possible. No quota in at least 3 herds. Sport and subsistence hunting ongoing for Ontario-Manitoba herds | |
| 5.2 | 5.2 | Gathering terrestrial plants | blank cell | blank cell | blank cell | blank cell | blank cell | blank cell | blank cell | blank cell | blank cell | |
| 5.3 | 5.3 | Logging & wood harvesting | blank cell | Not Calculated (outside assessment timeframe) | Not Calculated (outside assessment timeframe) | Not Calculated (outside assessment timeframe) | Small (1-10%) | Moderate (11-30%) | Low (Possibly in the long term, >10 yrs) | Low (Possibly in the long term, >10 yrs) | The northern limit of industrial forestry is increasing northward, and is partially a future concern for a subpopulation in Ontario. | |
| 5.4 | 5.4 | Fishing & harvesting aquatic resources | blank cell | blank cell | blank cell | blank cell | blank cell | blank cell | blank cell | blank cell | blank cell | |
| 6 | 6 | Human intrusions & disturbance | D | Low | Low | Low | Pervasive (71-100%) | Slight (1-10%) | High (Continuing) | High (Continuing) | blank cell | |
| 6.1 | 6.1 | Recreational activities | blank cell | Negligible | Negligible | Negligible | Pervasive (71-100%) | Negligible (<1%) | High (Continuing) | High (Continuing) | Access to the country (e.g. Snowmobile) while hunting can impact many Caribou. | |
| 6.2 | 6.2 | War, civil unrest & military exercises | blank cell | Negligible | Negligible | Negligible | Small (1-10%) | Negligible (<1%) | High (Continuing) | High (Continuing) | Low-altitude jet training occurs, but at a lower extent than in the past; other types of military training are ongoing. Threat mainly applies to the George River Herd. There are military-based ground winter exercises in Labrador as well. | |
| 6.3 | 6.3 | Work & other activities | D | Low | Low | Low | Pervasive (71-100%) | Slight (1-10%) | High (Continuing) | High (Continuing) | Low-level flights by helicopter common with geological exploration, seismic work, environmental monitoring, and research can be very high some years. | |
| 7 | 7 | Natural system modifications | CD | Medium - Low | Medium - Low | Medium - Low | Large (31-70%) | Moderate - Slight (1-30%) | High (Continuing) | High (Continuing) | blank cell | |
| 7.1 | 7.1 | Fire & fire suppression | CD | Medium - Low | Medium - Low | Medium - Low | Large (31-70%) | Moderate - Slight (1-30%) | High (Continuing) | High (Continuing) | Migratory behaviour of these Caribou allows for some avoidance of burned areas, but large fires represent loss of habitat. Concerns over increasing fire disturbance in James Bay area. | |
| 7.2 | 7.2 | Dams & water management/use | D | Low | Low | Low | Pervasive (71-100%) | Slight (1-10%) | High (Continuing) | High (Continuing) | Potential for new dam development. Large hydroelectric reservoirs. Much of Leaf River subpopulation will cross near dams. | |
| 7.3 | 7.3 | Other ecosystem modifications | blank cell | blank cell | blank cell | blank cell | blank cell | blank cell | blank cell | blank cell | blank cell | |
| 8 | 8 | Invasive & other problematic species & genes | D | Low | Low | Low | Small (1-10%) | Slight (1-10%) | High (Continuing) | High (Continuing) | blank cell | |
| 8.1 | 8.1 | Invasive non-native/alien species | blank cell | Unknown | Unknown | Unknown | Pervasive (71-100%) | Unknown | High (Continuing) | High (Continuing) | Unknown whether parasite Besnoitia is considered native? If exotic, scope is likely much higher. No current information to link to mortality; however, evidence for mortality in livestock. Information may not come on this in time for assessment. Report says muskoxen introduced to Ungava and may interact with summer Leaf River range; effect unknown. | |
| 8.2 | 8.2 | Problematic native species | D | Low | Low | Low | Small (1-10%) | Slight (1-10%) | High (Continuing) | High (Continuing) | As Caribou and predators have co-evolved, quantifying threats here is of lower severity. Much is unknown at this point. | |
| 8.3 | 8.3 | Introduced genetic material | blank cell | blank cell | blank cell | blank cell | blank cell | blank cell | blank cell | blank cell | No genetic differentiation here. However, introduced reindeer in Hudson islands but unknown and impact would be very low. | |
| 9 | 9 | Pollution | blank cell | Unknown | Unknown | Unknown | Pervasive (71-100%) | Unknown | High (Continuing) | High (Continuing) | blank cell | |
| 9.1 | 9.1 | Household sewage & urban waste water | blank cell | blank cell | blank cell | blank cell | blank cell | blank cell | blank cell | blank cell | blank cell | |
| 9.2 | 9.2 | Industrial & military effluents | blank cell | blank cell | blank cell | blank cell | blank cell | blank cell | blank cell | blank cell | blank cell | |
| 9.3 | 9.3 | Agricultural & forestry effluents | blank cell | blank cell | blank cell | blank cell | blank cell | blank cell | blank cell | blank cell | blank cell | |
| 9.4 | 9.4 | Garbage & solid waste | blank cell | blank cell | blank cell | blank cell | blank cell | blank cell | blank cell | blank cell | blank cell | |
| 9.5 | 9.5 | Air-borne pollutants | blank cell | Unknown | Unknown | Unknown | Pervasive (71-100%) | Unknown | High (Continuing) | High (Continuing) | Dry deposition (i.e., Mercury) is of concern. | |
| 9.6 | 9.6 | Excess energy | blank cell | blank cell | blank cell | blank cell | blank cell | blank cell | blank cell | blank cell | blank cell | |
| 10 | 10 | Geological events | blank cell | blank cell | blank cell | blank cell | blank cell | blank cell | blank cell | blank cell | blank cell | |
| 10.1 | 10.1 | Volcanoes | blank cell | blank cell | blank cell | blank cell | blank cell | blank cell | blank cell | blank cell | blank cell | |
| 10.2 | 10.2 | Earthquakes/tsunamis | blank cell | blank cell | blank cell | blank cell | blank cell | blank cell | blank cell | blank cell | blank cell | |
| 10.3 | 10.3 | Avalanches/landslides | blank cell | blank cell | blank cell | blank cell | blank cell | blank cell | blank cell | blank cell | blank cell | |
| 11 | 11 | Climate change & severe weather | blank cell | Unknown | Unknown | Unknown | Pervasive (71-100%) | Unknown | High (Continuing) | High (Continuing) | Evidence for increased freeze-thaw cycles, lower incidence of lichen availability, vegetation changes. | |
| 11.1 | 11.1 | Habitat shifting & alteration | blank cell | blank cell | blank cell | blank cell | blank cell | blank cell | blank cell | blank cell | See 11; scored as unknown because of limited data to quantify impact; concern is considerable and expected to be significant threat in future | |
| 11.2 | 11.2 | Droughts | blank cell | blank cell | blank cell | blank cell | blank cell | blank cell | blank cell | blank cell | blank cell | |
| 11.3 | 11.3 | Temperature extremes | blank cell | blank cell | blank cell | blank cell | blank cell | blank cell | blank cell | blank cell | blank cell | |
| 11.4 | 11.4 | Storms & flooding | blank cell | blank cell | blank cell | blank cell | blank cell | blank cell | blank cell | blank cell | blank cell |
Classification of Threats adopted from IUCN-CMP, Salafsky et al. (2008)
Appendix 2. Threats Classification Table for Torngat Mountains Caribou (DU 10)
Threats assessment worksheet
- Species or ecosystem scientific name:
- Caribou (Torngat Mountains population) - DU10
- Element ID:
- El code:
- Date (Ctrl + ";" for today's date):
- 08/02/2016
- Assessor(s):
- Members: Graham Forbes (TM SSC Co-chair), Dwayne Lepitzki (COSEWIC moderator), Donna Hurlburt (ATK SC Co-chair), Isabelle Gauthier (QC), Shelley Moores (NL) Report authors: Steeve Côté and Marco Festa-Bianchet External Experts: Martin Lougheed (Parks - Torngat), Darroch Whitaker (Parks - Torngat), Vincent Brodeur (QC), Josée Brunelle (HFTCC), Serge Couturier (Consultant Biologist for TWPCB), Karen Timm (COSEWIC Secretariat)
- References:
- The results from the DU-4 telecon on 21 Jan 2016 were used as a draft for this DU on 8 February 2016.
| Threat impact | Threat impact (descriptions) | Level 1 Threat impact counts: high range |
Level 1 Threat impact counts: low range |
|---|---|---|---|
| A | Very high | 0 | 0 |
| B | High | 1 | 1 |
| C | Medium | 0 | 0 |
| D | Low | 0 | 0 |
| - | Calculated overall threat impact: | High | High |
- Assigned overall threat impact:
- B = High
- Impact Adjustment Reasons:
- Overall Threat Comments:
| Threat | Threat | Impact (calculated) | Impact (calculated) | Scope (next 10 Yrs) | Severity (10 Yrs or 3 Gen.) | Timing | Comments |
|---|---|---|---|---|---|---|---|
| 1 | Residential & commercial development | blank cell | Negligible | Negligible (<1%) | Negligible (<1%) | High (Continuing) | blank cell |
| 1.1 | Housing & urban areas | blank cell | blank cell | blank cell | blank cell | blank cell | blank cell |
| 1.2 | Commercial & industrial areas | blank cell | blank cell | blank cell | blank cell | blank cell | blank cell |
| 1.3 | Tourism & recreation areas | blank cell | Negligible | Negligible (<1%) | Negligible (<1%) | High (Continuing) | In QC there is a large Nunavik park in the range of the herd, past development of a few isolated camps, potential for more in future. In Labrador, about 4-5 fly-in camps have been created. |
| 2 | Agriculture & aquaculture | blank cell | blank cell | blank cell | blank cell | blank cell | blank cell |
| 2.1 | Annual & perennial non-timber crops | blank cell | blank cell | blank cell | blank cell | blank cell | blank cell |
| 2.2 | Wood & pulp plantations | blank cell | blank cell | blank cell | blank cell | blank cell | blank cell |
| 2.3 | Livestock farming & ranching | blank cell | blank cell | blank cell | blank cell | blank cell | blank cell |
| 2.4 | Marine & freshwater aquaculture | blank cell | blank cell | blank cell | blank cell | blank cell | blank cell |
| 3 | Energy production & mining | blank cell | Negligible | Negligible (<1%) | Negligible (<1%) | Moderate (Possibly in the short term, < 10 yrs) | |
| 3.1 | Oil & gas drilling | blank cell | blank cell | blank cell | blank cell | blank cell | |
| 3.2 | Mining & quarrying | blank cell | Negligible | Negligible (<1%) | Negligible (<1%) | Moderate (Possibly in the short term, < 10 yrs) | |
| 3.3 | Renewable energy | blank cell | blank cell | blank cell | blank cell | blank cell | |
| 4 | Transportation & service corridors | blank cell | blank cell | blank cell | blank cell | blank cell | blank cell |
| 4.1 | Roads & railroads | blank cell | blank cell | blank cell | blank cell | blank cell | No roads in this area |
| 4.2 | Utility & service lines | blank cell | blank cell | blank cell | blank cell | blank cell | No utility lines in this area |
| 4.3 | Shipping lanes | blank cell | blank cell | blank cell | blank cell | blank cell | Not applicable. If Davis Strait corridor developed or increased, due to the opening of northern route, there could be an increase in traffic next 10 years. However, animals here would not likely be affected as they are not migrating between islands. Discussion ongoing of a deepwater port in Hudson Bay. |
| 4.4 | Flight paths | blank cell | blank cell | blank cell | blank cell | blank cell | blank cell |
| 5 | Biological resource use | B | High | Pervasive (71-100%) | Serious (31-70%) | High (Continuing) | blank cell |
| 5.1 | Hunting & collecting terrestrial animals | B | High | Pervasive (71-100%) | Serious (31-70%) | High (Continuing) | ATK indicates overhunting as the most important factor in the decline of the TM. N. Labrador and N. Quebec have protected rights to hunt, although there is a moratorium on hunting at present. This moratorium is only in effect in Labrador, not the Quebec side, where the herds here are more accessible during winter. Severity considered the rate at which hunting is in effect currently. |
| 5.2 | Gathering terrestrial plants | blank cell | blank cell | blank cell | blank cell | blank cell | blank cell |
| 5.3 | Logging & wood harvesting | blank cell | blank cell | blank cell | blank cell | blank cell | blank cell |
| 5.4 | Fishing & harvesting aquatic resources | blank cell | blank cell | blank cell | blank cell | blank cell | blank cell |
| 6 | Human intrusions & disturbance | blank cell | Negligible | Pervasive (71-100%) | Negligible (<1%) | High (Continuing) | blank cell |
| 6.1 | Recreational activities | blank cell | Negligible | Large (31-70%) | Negligible (<1%) | High (Continuing) | This herd is less migratory than the George River herd, and therefore, may spend the winter in highly inaccessible locations. |
| 6.2 | War, civil unrest & military exercises | blank cell | blank cell | blank cell | blank cell | blank cell | blank cell |
| 6.3 | Work & other activities | blank cell | Negligible | Pervasive (71-100%) | Negligible (<1%) | High (Continuing) | For 6 weeks each summer there are research flights (4 twin otter per week). Some aerial surveys for population estimates, and uncertainty on collaring projects possible over in next 10 years. |
| 7 | Natural system modifications | blank cell | blank cell | blank cell | blank cell | blank cell | blank cell |
| 7.1 | Fire & fire suppression | blank cell | blank cell | blank cell | blank cell | blank cell | Uncertain fire history here. |
| 7.2 | Dams & water management/use | blank cell | blank cell | blank cell | blank cell | blank cell | blank cell |
| 7.3 | Other ecosystem modifications | blank cell | blank cell | blank cell | blank cell | blank cell | blank cell |
| 8 | Invasive & other problematic species & genes | blank cell | Unknown | Pervasive (71-100%) | Unknown | High (Continuing) | blank cell |
| 8.1 | Invasive non-native/alien species | blank cell | Unknown | Pervasive (71-100%) | Unknown | High (Continuing) | |
| 8.2 | Problematic native species | blank cell | blank cell | blank cell | blank cell | blank cell | Some evidence that Black Bear numbers on Labrador side are increasing, and may be considered as a predatory threat (more so than a limiting factor). Overall impact uncertain regarding possible impacts to population. |
| 8.3 | Introduced genetic material | blank cell | blank cell | blank cell | blank cell | blank cell | blank cell |
| 9 | Pollution | blank cell | Unknown | Pervasive (71-100%) | Unknown | High (Continuing) | blank cell |
| 9.1 | Household sewage & urban waste water | blank cell | blank cell | blank cell | blank cell | blank cell | blank cell |
| 9.2 | Industrial & military effluents | blank cell | Negligible | Negligible (<1%) | Unknown | High (Continuing) | |
| 9.3 | Agricultural & forestry effluents | blank cell | blank cell | blank cell | blank cell | blank cell | blank cell |
| 9.4 | Garbage & solid waste | blank cell | blank cell | blank cell | blank cell | blank cell | blank cell |
| 9.5 | Air-borne pollutants | blank cell | Unknown | Pervasive (71-100%) | Unknown | High (Continuing) | blank cell |
| 9.6 | Excess energy | blank cell | blank cell | blank cell | blank cell | blank cell | blank cell |
| 10 | Geological events | blank cell | blank cell | blank cell | blank cell | blank cell | blank cell |
| 10.1 | Volcanoes | blank cell | blank cell | blank cell | blank cell | blank cell | blank cell |
| 10.2 | Earthquakes/tsunamis | blank cell | blank cell | blank cell | blank cell | blank cell | blank cell |
| 10.3 | Avalanches/landslides | blank cell | blank cell | blank cell | blank cell | blank cell | Avalanches were considered. |
| 11 | Climate change & severe weather | blank cell | Unknown | Pervasive (71-100%) | Unknown | High (Continuing) | blank cell |
| 11.1 | Habitat shifting & alteration | blank cell | blank cell | blank cell | blank cell | blank cell | Recent evidence of rapid expansion of alder and dwarf birch, resulting in conversion of tundra. Impacts to Caribou are unknown, but may have impacts on grazing (loss of foraging habitat). Caribou will use dwarf birch and willow but mainly lichen. Recent PCA report on Subtle Vegetation change for Torngat Mtns (J. Quirouette 2015) quantifies the changes over the past 10 years. There are reported changes in the habitat of the TM associated with climate change. ATK reports that the Torngat Mountains are becoming greener (Parks Canada Agency 2008). Vegetation cover, especially shrubs, has increased over the last decades. |
| 11.2 | Droughts | blank cell | blank cell | blank cell | blank cell | blank cell | blank cell |
| 11.3 | Temperature extremes | blank cell | blank cell | blank cell | blank cell | blank cell | blank cell |
| 11.4 | Storms & flooding | blank cell | blank cell | blank cell | blank cell | blank cell | Ice storms and flooding may increase as a result of climate change predictions for this area. |
Classification of Threats adopted from IUCN-CMP, Salafsky et al. (2008).