
Lake Sturgeon (Acipenser fulvescens), four populations: COSEWIC assessment and status report 2017
Table of contents
Lake sturgeon
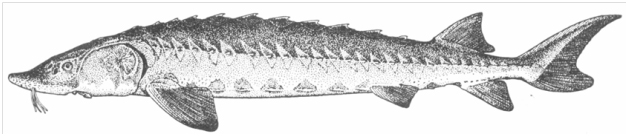
Photo: © Provided by authors.
Western Hudson Bay populations - Endangered
Saskatchewan-Nelson River populations - Endangered
Southern Hudson Bay-James Bay populations - Special concern
Great Lakes-Upper St. Lawrence populations - Threatened
2017
Table of contents
- Table of contents
- COSEWIC assessment summary - Western Hudson Bay populations
- COSEWIC assessment summary - Saskatchewan-Nelson River populations
- COSEWIC assessment summary - Southern Hudson Bay-James Bay populations
- COSEWIC assessment summary - Great Lakes-Upper St. Lawrence populations
- COSEWIC executive summary
- COSEWIC technical summary - Western Hudson Bay populations
- COSEWIC technical summary - Saskatchewan-Nelson River populations
- COSEWIC technical summary - Southern Hudson Bay-James Bay populations
- COSEWIC technical summary - Great Lakes-Upper St. Lawrence populations
- Preface
- Wildlife species description and significance
- Special significance
- Distribution
- Habitat
- Biology
- Population sizes and trends
- Threats and limiting factors
- Number of locations
- Protection, status and ranks
- Acknowledgements and authorities contacted
- Information sources
- Biographical summary of report writers
- Collections examined
List of figures
- Figure 1. Designatable units delineation based on freshwater biogeographic zones and haplotypes. Pie charts show the population average ancestry for 14 standardized microsatellites K=2 from STRUCTURE
- Figure 2. Western Hudson Bay DU showing the terrestrial ecozones and locations of officially named rapids and falls.
- Figure 3. Saskatchewan-Nelson River DU showing the terrestrial ecozones and locations of officially named rapids and falls.
- Figure 4. Southern Hudson Bay-James Bay DU showing the terrestrial ecozones and locations of officially named rapids and falls.
- Figure 5. Great Lakes-Upper St. Lawrence DU showing the terrestrial ecozones and locations of officially named rapids and falls.
- Figure 6. Lake Sturgeon distribution in North America based on historical and contemporary data.
- Figure 7. Fecundity of Lake Sturgeon.
- Figure 8. Length-at-age curves for four different growth trajectories. Based on aged fish from 0 to 10-14 years and incremental growth from recaptured fish using the largest recorded females to approximate maximum age.
- Figure 9. Length-weight relationships for ‘robust’ females and ‘slender’ females.
- Figure 10. Historical and contemporary Lake Sturgeon distribution in the Churchill River (DU1), showing the location of falls/rapids, dams, topography, and current management units.
- Figure 11. Historical and contemporary Lake Sturgeon distribution in Lake Winnipeg and tributaries (DU2), showing falls/rapids, dams, topography, and current management units.
- Figure 12. Historical and contemporary Lake Sturgeon distribution in the Winnipeg River (DU2), showing falls/rapids, dams, topography, and current management units.
- Figure 13. Historical and contemporary Lake Sturgeon distribution in the Saskatchewan River (DU2), showing falls/rapids, dams, topography, and current management units.
- Figure 14. Historical and contemporary Lake Sturgeon distribution in the Nelson River (DU2), showing falls/rapids, dams, topography, and current management units.
- Figure 15. Historical and contemporary Lake Sturgeon distribution in the Southern Hudson Bay-James Bay (DU3), showing falls/rapids, dams, and topography.
- Figure 16. Historical and contemporary Lake Sturgeon distribution in Lake Superior and its tributaries (DU4; MU1-MU4), showing falls/rapids, dams, topography, and current management units.
- Figure 17. Historical and contemporary Lake Sturgeon distribution in Lake Huron and tributaries (DU4), showing falls/rapids, dams, topography, and current management units.
- Figure 18. Historical and contemporary Lake Sturgeon distribution in Lake Erie and tributaries (DU4), showing falls/rapids, dams, topography, and current management units.
- Figure 19. Historical and contemporary Lake Sturgeon distribution in Lake Ontario and Upper St. Lawrence River (DU4), showing falls/rapids, dams, topography, and current management units.
- Figure 20. Historical and contemporary Lake Sturgeon distribution in the Ottawa River (DU4), showing falls/rapids, dams, topography, and current management units.
- Figure 21. Historical and contemporary Lake Sturgeon distribution in the St. Lawrence River and tributaries (DU4; MU6), showing falls/rapids, dams, topography, and current management units.
List of tables
- Name and classification table
- Table 1. Designatable units identified for Lake Sturgeon in this report and the previous COSEWIC report (COSEWIC 2006).
- Table 2. Detailed information provided by the pre-COSEWIC meeting participants by DU (DF 2016a,b), identifying survey information, quantitative abundance, qualitative abundance, recruitment, trajectory, and threats.
List of appendices
- Appendix 1. Threats assessment for Lake Sturgeon: Western Hudson Bay populations.
- Appendix 2. Threats assessment for Lake Sturgeon: Saskatchewan-Nelson River populations.
- Appendix 3. Threats assessment for Lake Sturgeon: Southern Hudson Bay-James Bay populations.
- Appendix 4. Threats assessment for Lake Sturgeon: Great Lakes-Upper St. Lawrence populations.