
Roughhead grenadier (Macrourus berglax) COSEWIC assessment and status report: chapter 7
Population Sizes and Trends
Data and methods
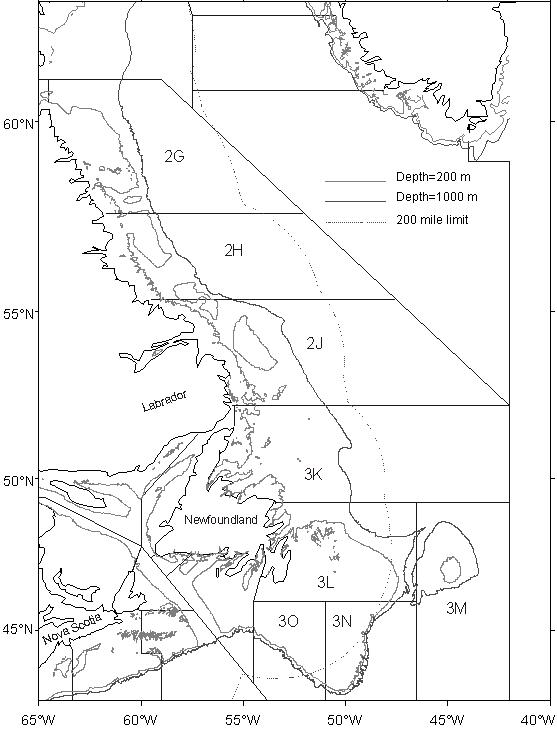
Data are from 1) stratified-random bottom trawl surveys conducted annually by the Canadian Department of Fisheries and Oceans, 2) the Spanish survey in NAFO Divisions 3NO (Figure 4) and 3) the EU survey of the Flemish Cap, NAFO Division 3M (Figure 4). Analyses of the Canadian data are restricted to surveys of the Grand Bank and the Labrador and NE Newfoundland Shelves. Although reported from areas as far south as Georges Bank and the Gulf of Maine, roughhead grenadier are rarely captured in surveys of areas south of the Grand Bank. This may reflect the relatively shallow depths (mostly < 400 m) sampled by these surveys. For example, a July survey of the Scotian Shelf and Bay of Fundy has been conducted annually since 1970. Additional deepwater strata (200-400 fathoms) were added to this survey in 1995. Only three specimens have been captured in the strata sampled since 1970 (one in each of 1995, 1998 and 2002) whereas over 50 individuals were captured in the deepwater strata between 1997 and 2002.
Figure 4. Northwest Atlantic Fisheries Organization (NAFO) divisions referred to in this report.
Canadian Surveys
Two surveys are considered here: a spring (April – June) survey of the Grand Bank (NAFO Divisions 3LNO, Figure 4) and a fall (mostly October – December) survey of the Labrador and NE Newfoundland Shelves (NAFO Divisions 2J3K). The fall survey was extended to include the northern Grand Bank (3L) in 1981 and the southern Grand Bank (3NO) in 1990. It also occasionally covered the Flemish Cap (3M) and northern areas off Labrador (2GH). Stratum coverage within each division has been variable from year to year. Additional deepwater strata were added to the surveys in the mid-1990s.
Survey catch rates provide an index of trends in abundance if catchability to the survey gear and the proportion of the population available to the survey do not change from year to year. The gear used in the fall Newfoundland surveys changed from an Engels trawl to a Campelen trawl in 1995. The spring Newfoundland surveys used a Yankee 41.5 trawl from 1971 to 1982, the Engels trawl from 1985 to 1995, and the Campelen trawl since 1996. A change in survey vessel also occurred in the fall survey in 1995 and in the spring survey in 1985. No estimates of relative fishing efficiency between these trawls and vessels are available for grenadiers. Thus, the Yankee, Engels and Campelen surveys are treated here as separate time series.
Indices for consistently sampled subsets of strata were constructed in order to reduce the likelihood that the proportion of the population covered by the survey varied from year to year (and to avoid other biases that result from changes in the area surveyed). Three indices were calculated using the fall data: 1) 2J3K, starting in 1978; 2) 2J3KL, starting in 1981; and 3) 2J3KLNO including the new deep strata, starting in 1996. Two indices were calculated using the spring data: 1) an index starting in 1971 but restricted to shallow strata with depths mostly less than 350 m; 2) an index starting in 1996 but including depths down to about 700 m. Indices were calculated up to 2002, 2003 or 2005, depending on data availability. Details are given in Appendix A. Note that the fall index covers a much greater portion of the roughhead grenadier distribution, including strata in the 750-1000 m range even in the early years.
Roughhead grenadier occur in relatively deep waters, along and beyond the offshore margin of the area covered by these surveys. Thus, shifts in the distribution of these grenadiers may result in changes in availability to the surveys, so that changes in catch rates in the surveys may not accurately reflect changes in population abundance. To investigate this possibility, interannual variation in geographic distribution and bathymetric pattern was examined for the fall surveys. Grenadier density as a function of depth was examined using Generalized Additive Models (see Swain & Benoît 2006 for details on the methods). The proportion of fish occurring in the deepwater (751-1000 m) strata was also calculated for each year.
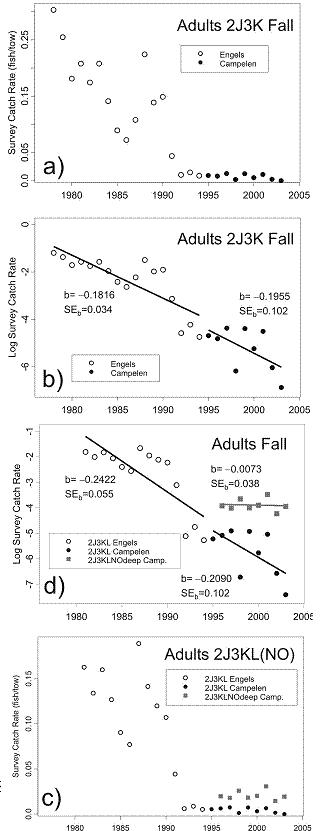
Adult catch rate indices were also calculated for the fall survey. These consisted of catch rates of fish with a pre-anal fin length (AFL) over 275 mm. This corresponds approximately to the length at maturity for females. Males mature at a considerably smaller size and few males reach an AFL of 275 mm. Only 1% of the fish over 275 mm AFL were males. Thus, these indices reflect catch rates of adult females.
To assess rates of change, loge of the stratified mean catch rate was regressed against year. Percent change was calculated as 100•(1-e-bDt), where b is the regression slope and Dt the change in time (years). In two cases, the stratified mean catch rate was 0. In these cases, zeros were replaced by half the minimum non-zero mean catch rate before calculating the loge catch rate.
European Surveys
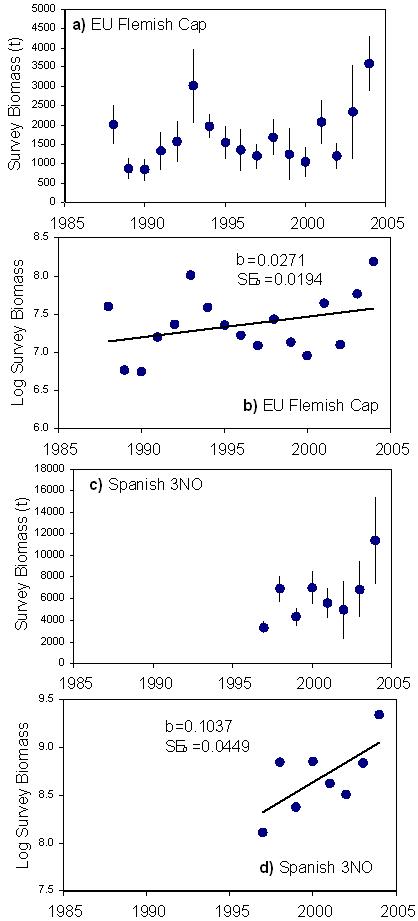
Biomass indices for the Spanish 3NO survey and the EU Flemish Cap (3M) survey are taken with permission from González Costas & Murua (2005). These indices are corrected for vessel and gear changes as described by González Costas & Murua (2005). The 3NO survey fishes waters down to 1500 m whereas the 3M survey is restricted to depths <720 m. The 3M and 3NO surveys have been conducted annually since 1988 and 1995, respectively. However, the 1995 and 1996 3NO surveys are not considered representative because the deeper strata were not surveyed, and they have been omitted from analyses presented here.
Trends in survey catch rates
Canadian Fall Surveys
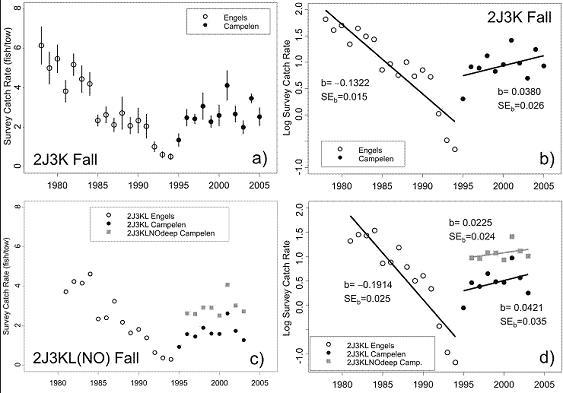
Catch rates in the fall survey declined sharply from 1978 to 1994 in the 2J3K area (Figure 5a). The linear trend in loge catch rates over this time period was highly significant (R²=0.84, P<0.0001, Figure 5b), and corresponded to an 88% decline over 16 yr. Catch rates after 1994 are not directly comparable to the earlier catch rates because of the change in gear in 1995. Catch rates were stable or slightly increasing over the 1995 – 2005 period. The linear trend in loge catch rates was positive but non-significant (R²=0.19, P=0.18, Figure 5b).
Similar trends are evident in the 2J3KL indices (Figure 5c,d). Catch rates declined sharply over the 1981 – 1994 period, corresponding to a 92% decline in 13 yr. Catch rates were stable after 1994, with a positive but non-significant trend in loge catch rates over the 1995 – 2003 period.
Catch rates were substantially (about 1.7 times) higher in the index expanded to include the deep strata added in 1996 (Figure 5c), reflecting the relatively high densities of grenadier in these deep strata. This index has been roughly stable since 1996, with no significant trend in loge catch rates (Figure 5d).
Figure 5. Stratified mean catch rates of roughhead grenadier (all sizes) in fall surveys of the Labradorand NE Newfoundland Shelves and the Grand Bank. Regression lines are shown for loge catch rate versus year in panels b) and d), along with their slope b and its standard error. Vertical lines in panel a) are±2SE. Different symbols denote different areas and/or gears.
Canadian Spring Surveys
Catch rates in the spring survey are much lower than those in the fall survey (Figure 6), reflecting the lack of coverage of deep waters in the spring survey. Catch rates in the spring survey were stable over the 1971 – 1982 period, declined sharply over the 1985 – 1995 period, and have been stable or increasing since 1996. The decline in the 1985 – 1995 period was highly significant (R²=0.85, P<0.0001) and corresponded to a 99% decline over 10 yr. However, most of the decline appeared to occur between 1989 and 1992.
Figure 6. Stratified mean catch rates of roughhead grenadier (all sizes) in spring surveys of the Grand Bank. Regression lines are shown for loge catch rate versus year in panel b). Different symbols denote different areas and/or gears.
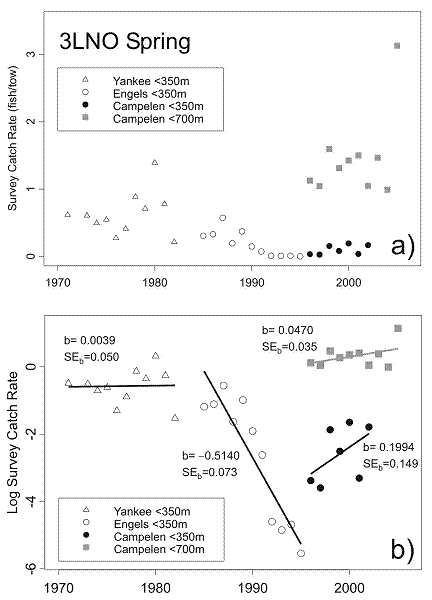
Mean catch rates in the shallow strata sampled since 1971 have been very low since the early 1990s. However, mean catch rates are more than an order of magnitude greater including the deeper strata sampled since 1996.
Adult Catch Rates
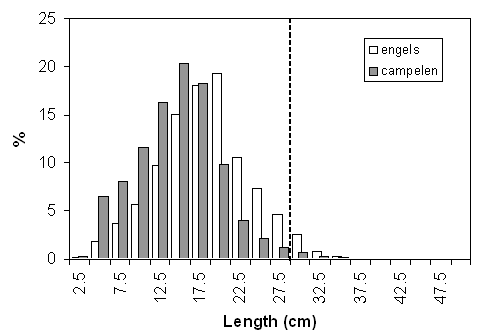
The roughhead grenadier caught during the surveys are almost entirely juveniles (Figure 7). Sizes corresponding to mature females comprise less than 3% of the grenadier caught.
Figure 7. Length distribution of roughhead grenadier catches in the fall surveys of the Labradorand NE Newfoundland Shelves and the Grand Bank. Lengths are pre-anal fin length (AFL). Distributions are shown separately for the Engels trawl used prior to 1994 and for the Campelen trawl used since 1995. The dashed line denotes the approximate length at maturity for females.
Adult catch rates declined sharply in the fall survey of 2J3K between 1978 and 1994 (Figure 8a). The linear regression of loge catch rates versus time was highly significant over this period (R²=0.66, P<0.0001, Figure 8b), and corresponded to a 95% decline over 16 yr. Adult catch rates in 2J3K also tended to decline between 1995 and 2003, but the decline was not significant (R²=0.34, P=0.1).
Similar patterns are evident extending the analysis to include 3L. The decline in catch rate was highly significant over the 1981 – 1994 period (96% decline over 13 yr.) but was non-significant over the 1995 – 2003 period (Figure 8c,d). Adult catch rates were substantially higher extending the analysis to include the deepwater strata sampled since 1996. Catch rates were stable over the 1996 – 2003 period when these deepwater strata are included in the analysis (Figure 8d).
Figure 8. Stratified mean catch rates of adult female roughhead grenadier in fall surveys of the Labradorand NE Newfoundland Shelves and the Grand Bank. Regression lines are shown for loge catch rate versus year in panels b) and d), along with their slope b and its standard error. Different symbols denote different areas and/or gears.
European Surveys
Biomass in the Flemish Cap survey varied without a long-term trend over the 1988-2004 period, with highest biomasses in 2004 and 1993 (Figure 9a). Biomass in this survey has increased in recent years. The linear regression of loge biomass versus time was positive but non-significant for this survey (R²=0.12, P=0.18, Figure 9b).
Biomass in the Spanish 3NO survey tended to increase over the 1997-2004 period (Figure 9c). The linear regression of loge biomass in this survey versus time was positive over this brief period, approaching statistical significance (R²=0.47, P=0.06, Figure 9d).
Figure 9. Biomass of roughhead grenadier in European surveys of the 3NO and Flemish Cap (3M) areas. Regression lines are shown for loge biomass versus year in panels b) and d), along with their slope b and its standard error. Vertical lines in panels a) and c) are±2SD. Data are from González & Murua (2005).
Changes in distribution
In the late 1970s and early 1980s, roughhead grenadier were widely distributed over the Labrador and NE Newfoundland Shelves during the fall survey (Figure 10). By the early 1990s, these fish were largely restricted to the offshore margin of the shelf. This restricted distribution along the offshore margin of the survey area persisted throughout the remainder of the 1990s and the early 2000s (Figure 11).
Figure 10. Geographic distribution of roughhead grenadier catches in the fall survey of the Labrador and NE Newfoundland Shelves and the Grand Bank for selected years between 1978 and 1994 (Engels surveys). Circle size is proportional to catch. Cutpoints are the 10th, 25th, 50th, and 75th percentiles of the non-zero catches. Crosses indicate zero catches. The 200 and 1000 m depth contours are denoted by solid and dashed lines, respectively.
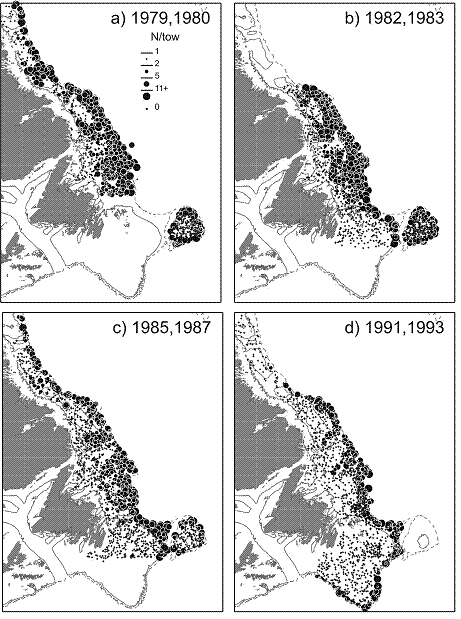
Figure 11. Geographic distribution of roughhead grenadier catches in the fall survey of the Labrador and NE Newfoundland Shelves and the Grand Bank for selected years between 1995 and 2000 (Campelen surveys). See Figure 10 caption for further details.
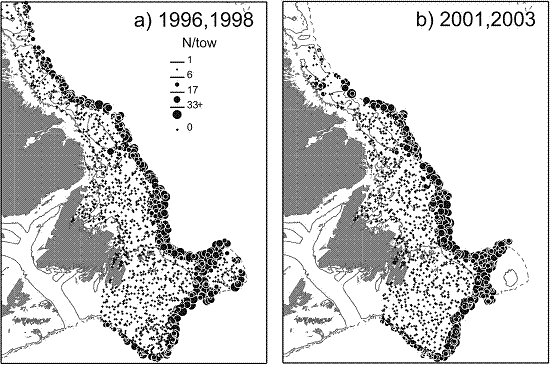
Figure 12 shows the proportion of the 2J3K survey catch occurring in the deep strata (751-1000 m) consistently sampled since 1978. The shift in distribution into deep waters along the offshore margin of the survey area is reflected in changes in this proportion. A small proportion (about 10%) of the survey catch occurred in these deepwater strata from the late 1970s to the mid-1980s. This proportion began to increase in the late1980s, reaching 50-60% by the mid-1990s.
Changes in the distribution of roughhead grenadier with respect to depth are described further in Figure 13. The analyses presented in this figure are based on all available tows (Figure 10-11), not just the subsets used to construct the standardized catch-rate indices presented above. Grenadier density was strongly related to depth in all years. In the 1978 – 1983 period, peak densities occurred at depths of about 750 m, with density decreasing substantially at greater depths. In the 1984 – 1989 period, peak densities occurred at slightly shallower depths (600 – 700 m), but density again decreased at greater depths. In later periods, densities dropped sharply to levels near 0 in waters shallower than 500 m. In contrast, densities declined little following peaks at 700 – 1000 m, and remained at high values in the deepest waters sampled.
Figure 12. Proportion of roughhead grenadier caught in deep strata (751-1000 m) during the fall surveys of 2J3K.

Figure 13. Effect of depth on the local density of roughhead grenadiers in fall surveys off Newfoundlandand Labrador. Panels a) - d): effect of depth (on a loge scale) on grenadier density in 5 time periods. Solid line shows the predicted relationship, and the dotted lines are ±2SE. Note that models included an effect of year not shown in these panels. Panel f): predicted density for a selected year in each decade. Campelen catch rates adjusted to be similar to Engels catch rates.

Coverage in the fall survey was extended into deeper waters in 1995. Maximum depths sampled were under 1275 m in the 1984 – 1994 period and over 1475 m in the 1995 – 2003 period (but 1432 m in the 1978 – 1983 period). The 95th percentile of sampled depths was about 600 m in the three periods before 1995 and 1200 m in the two later periods. However, the changes described in Figure 13 do not just reflect this change in depths sampled. The change was evident in the 1990 – 1994 period, preceding the extension of the survey into deeper waters.
Population size
A minimum estimate of population size can be obtained by expanding the mean survey catch per tow to the survey area (i.e., by multiplying by the survey area divided by the area swept by a standard tow). This estimate is an underestimate because 1) catchability to the survey gear is likely substantially less than 100%, and 2) a substantial portion of the roughhead grenadier population likely occurs outside of the area surveyed. Minimum estimates based on the fall survey of NAFO Divisions 2GHJ3KLMNO averaged 101.91 million for the 1996 – 2005 period (D. Power, DFO St. John’s, pers. comm.). This estimate was obtained by calculating the average survey abundance within each division over all years sampled in 1996-2005 and then summing over divisions. About 1.4% of the roughhead grenadiers caught by the Campelen trawl during these surveys correspond to adult females, based on their size. This yields a minimum estimate of about 1.43 million adult females in the area covered by this survey in recent years.
A deepwater longline survey was conducted in the 3LMN area in April – May 1996 between depths of 700 and 3000 m (Murua and de Cárdenas 2005). Roughhead grenadier were the most common species caught in this survey, comprising 34% of the catch by weight (compared to 5% for Greenland halibut). At depths below 1150 m, roughhead grenadier was the predominant species in the catch (>90% by weight).
Summary of population trends
Catch rates of roughhead grenadier in the bottom-trawl surveys of the Grand Bank and Newfoundland Shelf were roughly stable in the 1970s, declined precipitously in the 1980s, and have been generally stable since the early to mid-1990s, though some surveys have shown increases in catch rates in recent years. The declines in the 1980s amounted to 90 – 95% declines over 10 – 15 yr. (less than one generation). Declines in adult females in the surveys were 95-96% over 13 - 15 yr, although the surveys take a very low proportion of adult females.
The extent to which these declines in survey catch rates reflect declines in population abundance is unclear. Densities of roughhead grenadier are greatest along and beyond the offshore margin of the areas covered by these surveys. The surveys used here do not cover all of the latitudinal range of roughhead grenadier in the northwest Atlantic. Thus, catch rates of this species are likely to be affected by changes in availability to these surveys.
The decline in survey catch rates coincided with a shift in distribution to the deep strata along the offshore margin of the survey area (R²=0.70, P<0.0001). Many other species showed similar offshore shifts in distribution at about the same time (e.g., Gomes et al. 1995). The strong cooling of shelf waters in the 1980s has been implicated as a cause of these changes in distribution (e.g., Rose et al. 1994, Gomes et al. 1995), though density-dependence (Atkinson et al. 1997) or local depletion by fisheries (e.g., Hutchings 1996) could also be involved.
Distribution of roughhead grenadier failed to shift back into shallower waters when these waters warmed in the late 1990s. Other Northwest Atlantic fishes have shown similar patterns of distribution change. For example, thorny skate in the southern Gulf of St. Lawrence shifted into warm deep waters coincident with the cooling of the Magdalen Shallows in the early 1990s but failed to move back into shallower water when the Shallows warmed in recent years (Swain & Benoît 2006). One possibility is that fish distribution shows a high degree of ‘conservatism’ (cf. Corten 2002), with distribution changing quickly in response to an environmental stimulus but slow to return to its original pattern once the stimulus has been removed.
While local depletion by fisheries may contribute to the apparent shift in distribution, no known increases in grenadier catch coincided with these declines, and trawl fishing activity has tended to be greatest along the shelf edge (Kulka and Pitcher 2001) where grenadier density has not been depleted. Furthermore, the decline in grenadier density in shallower waters coincides with increases in density in deep waters (Figure 13). This confirms that the change in distribution does not just reflect local depletion but must at least partly involve a true shift in distribution of individual grenadiers. In the 1970s and 1980s, grenadier density declined to relatively low levels in the deepest waters sampled; in the 1990s and 2000s, density remained near peak levels in these deep waters. This strongly suggests that there has been a decline in availability of roughhead grenadiers to the survey, and that the declines in survey catch rates overestimate population declines. However, the extent of this overestimation cannot be determined.
Summary of NAFO assessment
The most recent NAFO assessment (González-Costas and Murua 2005) focuses on recent trends (1990s and 2000s). They consider the Canadian fall 2J3K survey and the Spanish 3NO survey to be the most reliable surveys for monitoring population trends due to their coverage of deep waters. Their biomass indices from these surveys, starting in 1995 and 1997 respectively, both show increasing trends reaching maximum levels in 2004, the last year reported. The biomass increase is substantial (three- or fourfold from 1997 or 1995 to 2004 based on the point estimates). Fishery catch divided by survey biomass (an index of exploitation rate) declines substantially over the same period. Catches of 3-year-old fish in the 2004 EU Flemish Cap and Spanish 3NO surveys suggest that the 2001 year-class is strong. The assessment concluded that stock biomass “is the highest in the time series from 1995” but noted that “immature fish constituted 92% of the catch in weight in 2004” (NAFO 2005).