
COSEWIC Assessment and status report on the Shortfin Mako (Isurus oxyrinchus) in Canada, 2017
Shortfin Mako

- Table of contents
- COSEWIC assessment summary - Atlantic population
- COSEWIC executive summary
- Technical summary - Atlantic population
- Preface
- Wildlife species description and significance
- Distribution
- Habitat
- Biology
- Population sizes and trends
- Threats and limiting factors
- Protection, status and ranks
- Acknowledgements and authorities contacted
- Information sources
- Biographical summary of report writer
- Figure 1. Shortfin Mako (Isurus oxyrinchus). Figure from the International Commission for the Conservation of Atlantic Tunas.
- Figure 2. Tag and release distributions for Shortfin Mako in the Atlantic Ocean displayed as straight lines between release and recovery locations.
- Figure 3. Canadian Shortfin Mako conventional tagging releases (n=142) and recovery (n=7) over two time periods.
- Figure 4. Canadian Shortfin Mako PSAT pop-up satellite tagging application sites (n=43) and data release positions (n=34).
- Figure 5. Approximate (a) Global distribution; (b) North Atlantic distribution of designatable unit and (c) Canadian aArea of occupancy for the North Atlantic designatable unit of Shortfin Mako.
- Figure 6. Combined observations of Shortfin Mako in Canadian waters from ZIFF and MARFIS observer databases (1998-2014).
- Figure 7. Core hotspots showing the probabilities of Shortfin Mako shark catch (landings+discards) in the Canadian pelagic longline fishery, 2003-2013: (a) catches two times (4 sharks/set); (b) five times (10 sharks/set) and (c) ten times (20 sharks/set) the average number of sharks per set. Red line indicates the 200 mile Canadian Exclusive Economic Zone.
- Figure 8. Length-frequency distribution of Shortfin Mako captured in Japanese longline fisheries operating in Canadian waters 1986 to 1996, and Canadian longline fisheries from 1999 to 2014, recorded through Canadian at-sea observer programs.
- Figure 9. (a) Indices of abundance for North Atlantic Shortfin Mako shark along with total catches (b) Standardized Shortfin Mako catch rate indices produced by Showell et al. (2017). US REC=US Recreational fishery index; US LOG=US pelagic longline logbook data; US OBS=US pelagic longline observer program; JAP LL=Japanese pelagic longline logbook data; POR LL=Portuguese pelagic longline logbook data; ESP LL=Spanish pelagic longline logbook data.
- Figure 10. Standardized Shortfin Mako catch rates from the Maritimes Region pelagic longline fishery (1996-2014) on the Scotian Shelf. Smooth line is a lowess fit.
- Figure 11. Median of the current North Atlantic Shortfin Mako biomass relative to Bmsy with 80% credibility intervals for four selected BSP model runs (ICCAT 2012). Run 1 (a) equal weighting starting in 1971, Run 3(c) starting in 1997, Run 6 (e) area weighting starting in 1971, and Run 13 (g) catch estimated from effort through 1996.
- Figure 12. Two catch-free model runs fit to the indices of relative spawning stock biomass (SSB) depletion for the North Atlantic Shortfin Mako.
- Figure 13. Canadian reported Shortfin Mako landings (t) by (a) gear type; ‘other’ includes derby, handline, and miscellaneous (from ZIFF and MARFIS databases) and (b) management region. Data do not include discards at sea.
- Figure 14. Estimated Shortfin Mako catch (landings and discards) in North Atlantic by longline gear (blue) and other (red).
- Figure 15. Shark mortality due to capture or hooking mortality in Canadian commercial pelagic longline fishing broken down by species: (a) proportion that die after release as recorded by PSATs; (b) proportion of the total catch that die during hooking (striped) and after release (solid grey).
- Figure 16. Estimated annual total bycatch (t) of Shortfin Mako by directed species and gear (GN=gillnet; LL=longline; OTB=otter trawl-bottom) in Canada’s EEZ of Div. 3LNOP, 1998-2010. Data are from Canadian Fisheries Observers and DFO-NL ZIFF in comparable years. Note that these unweighted estimates are scaled up to the entire fishery, and contingent on whether Canadian landings were reported in ZIFF, and the annual degree of NL-ASO coverage of each fishery.
- Table 1. canadian landings (t) of shortfin mako shark by year, fishing gear, and region calculated from ziff and marfis databases. showell et al. (2017)
- Table 2. productivity (r, intrinsic rate of population increase, yr-1) and generation time for 20 stocks of pelagic sharks and rays listed from highest to lowest values of productivity. productivity estimates are medians, along with 80% upper and lower confidence limits. source: iccat 2012.
COSEWIC Assessment and status report on the Shortfin Mako (Isurus oxyrinchus) in Canada, 2017
COSEWIC
Committee on the Status
of Endangered Wildlife
in Canada

COSEPAC
Comité sur la situation
des espèces en péril
au Canada
COSEWIC status reports are working documents used in assigning the status of wildlife species suspected of being at risk. This report may be cited as follows:
COSEWIC. 2017. COSEWIC assessment and status report on the Shortfin Mako Isurus oxyrinchus, Atlantic population, in Canada. Committee on the Status of Endangered Wildlife in Canada. Ottawa. xii + 34 pp. (Species at Risk Public Registry website).
Previous report(s):
COSEWIC 2006. COSEWIC assessment and status report on the shortfin mako Isurus oxyrinchus (Atlantic population) in Canada. Committee on the Status of Endangered Wildlife in Canada. Ottawa. vi + 24 pp.
COSEWIC would like to acknowledge Scott Wallace for writing the status report on the Shortfin Mako. This report was prepared under contract with Environment and Climate Change Canada and was overseen by John Neilson, Co-chair of the COSEWIC Marine Fishes Specialist Subcommittee.
COSEWIC Secretariat
c/o Canadian Wildlife Service
Environment Canada
Ottawa, ON
K1A 0H3
Tel.: 819-938-4125
Fax: 819-938-3984
E-mail: COSEWIC E-mail
Website: COSEWIC
Également disponible en français sous le titre Ếvaluation et Rapport de situation du COSEPAC sur le Requin-taupe bleu (Isurus oxyrinchus), population de l'Atlantique, au Canada.
Shortfin Mako - Cover image courtesy of the International Commission for the Conservation of Atlantic Tunas (A. López (‘Tokio’)).
Shortfin Mako
Isurus oxyrinchus
Atlantic population
Shortfin Mako (Isurus oxyrinchus) is one of two species in the genus Isurus (the other being the Longfin Mako, I. paucus) and one of five species in the family Lamnidae or mackerel sharks. Other lamnid sharks found in Canada include the White Shark (Carcharodon carcharias), Salmon Shark (Lamna ditropis), and the Porbeagle shark (L. nasus).
Based on biogeographical separation, genetic differences with other global populations, and no evidence of structuring within the North Atlantic, Shortfin Mako in the North Atlantic are considered to be a population and the single Designatable Unit (DU) in Canada is part of the wider North Atlantic population
Although this species is not directly targeted in Canada, it is caught and landed as bycatch in a limited number of Canadian fisheries. Due to its energetic displays and edibility, it is sought by sport anglers as a game fish in the United States and occasionally in Canada.
Shortfin Mako is widespread in temperate and tropical waters of all oceans from about 50°N (up to 60°N in the northeast Atlantic) to 50°S. Shortfin Mako are distributed throughout the North Atlantic in waters south of 60°N to the equator. In Canadian waters, Shortfin Mako is a highly migratory summer and fall visitor typically associated with warm Gulf Stream waters and represents the northern extension of the North Atlantic-wide population. It has been recorded from Georges and Browns Bank, along the continental shelf of Nova Scotia, the Grand Banks and even into the Gulf of St. Lawrence.
Temperature appears to be the dominant factor defining Shortfin Mako distribution. Preferred water temperature is between 17-22°C and consequently it is unlikely that Shortfin Mako have extended residency in Canadian waters. A lack of data has prevented any identification of habitats necessary for critical life functions (e.g., mating, pupping) of this species in Canadian waters, while impeding investigation of whether Shortfin Mako habitat has changed over time,
Shortfin Mako are aplacental viviparous with developing embryos known to feed on unfertilized eggs during the 15-18 month gestation period. Females have 11 pups on average every three years. The estimated age at which half the individuals are mature is 8 years for males and 18 years for females. They are a low-productivity species compared with other shark species, and have a generation time of about 25 years. It appears as if females migrate to latitudes of 20°-30°N to give birth based on evidence that no pregnant females have been caught outside of this range.
This species is likely adapted to withstand natural changes in its environment as adults can readily move long distances and prey upon a wide variety of species. Based on diet studies of adults, Shortfin Makos prey upon a wide variety of species, primarily fish including Bluefish, Butterfish, tunas, mackerels, bonitos, and Swordfish.
For Canadian waters, a catch rate series from the Canadian pelagic longline fishery from 1996 to 2014 is the only available index of abundance. The most recent data show a non-significant decline in catch rates compared to earlier in the time series. Canadian waters represent the northern fringe of the Shortfin Mako range, and therefore changes in the Canadian index may reflect distributional shifts.
Internationally there are six catch rate indices that are considered by the International Commission for the Conservation of Atlantic Tunas (ICCAT) to be the most representative of abundance. The combined interpretation is that these indices were fairly consistent in showing a decline during the 1990s followed by an increase after 2000.
A stock assessment conducted by ICCAT in 2012 concluded that updated abundance indices showed increasing or flat trends. Despite large uncertainties, the Commission concluded that the probability of overfishing was low and that the status of the population is above the maximum sustainable yield.
Bycatch in commercial longline fisheries targeting pelagic tunas and Swordfish is the main cause of mortality within Canadian waters and throughout the range of the Shortfin Mako. Post-release survival of Shortfin Mako shark caught by longline gear in Canada was recently estimated at 49% resulting in an historical average annual estimate of total Canadian mortality at about 69 t/year. In 2015 voluntary release of live Shortfin Mako in the Maritimes Region was supported by the longline fishing industry and is anticipated to reduce mortality in Canadian waters. Mature females comprise less than 1% of the observed Shortfin Mako caught in the Canadian Maritimes Region pelagic longline fishery with at-sea observer coverage averaging about 5% of the annual fishing effort.
Total fishing mortality for the entire North Atlantic is uncertain due to poor catch reporting, particularly in years prior to 1996. From 1996-2010, average reported landings were around 2400 t but this number was considered to be an underestimate by a recent ICCAT study that estimated the average catch (landings and discards) during this time period at 3500 t.
Due to their life-history characteristics such as relatively slow growth, late age of maturity and low reproductive rates, Shortfin Mako populations have relatively low productivity, thus the capacity to recover is limited once the population is depleted.
There is no targeted fishery for Shortfin Mako sharks in Atlantic Canada and there is a Canadian ban on shark finning (i.e., removing and retaining fins while discarding the shark’s body at sea). Incidentally captured individuals are permitted to be retained in some fisheries. Fishing regulations and protective measures for the Maritimes Region include a non-restrictive annual landings limit for Shortfin Mako of 100 t, corrodible circle hooks to reduce bycatch and post-release mortality in the pelagic longline fishery and a voluntary release of live Shortfin Mako. Present regulations do not limit total fishing mortality or discarding at sea.
Shortfin Mako (North Atlantic subpopulation) was last assessed in 2004 by the International Union for Conservation of Nature (IUCN) as “vulnerable”. The US National Oceanographic and Atmospheric Administration (NOAA) describes the population status as “stock is healthy, because it is not overfished and the probability that overfishing is occurring is low”. COSEWIC previously assessed the Atlantic population of Shortfin Mako as “Threatened” in 2006 but a Species at Risk Act Schedule 1 listing decision has yet to be made.
| Summary items | Information |
|---|---|
| Generation time based on G = age at maturity/natural mortality | 25 yrs |
| Is there an observed continuing decline in number of mature individuals? | No |
| Estimated percent of continuing decline in total number of mature individuals within [5 years or 2 generations] | continuing decline not observed |
[Observed, estimated, inferred, or suspected] percent [reduction or increase] in total number of mature individuals over the last [10 years, or 3 generations].
|
Indices show no consistent trend for the entire DU |
| [Projected or suspected] percent [reduction or increase] in total number of mature individuals over the next [10 years, or 3 generations]. | Unknown |
| [Observed, estimated, inferred, or suspected] percent [reduction or increase] in total number of mature individuals over any [10 years, or 3 generations] period, over a time period including both the past and the future. | Unknown |
| Are the causes of the decline a.clearly reversible and b. understood and c. ceased? | No clear decline a. NA b.NA c.NA |
| Are there extreme fluctuations in number of mature individuals? | No, low productivity species |
| Summary items | Information |
|---|---|
| Estimated extent of occurrence | 1, 060,000 km2 |
| Index of area of occupancy (IAO) (Always report 2x2 grid value). |
>> 2000 km2 |
| Is the population “severely fragmented” i.e., is >50% of its total area of occupancy is in habitat patches that are (a) smaller than would be required to support a viable population, and (b) separated from other habitat patches by a distance larger than the species can be expected to disperse? | a.No b.No |
| Number of “locations” See Definitions and Abbreviations on COSEWIC website and IUCN (Feb 2014) for more information on this term. (use plausible range to reflect uncertainty if appropriate) |
>10. Large range, caught in several global fisheries throughout North Atlantic. |
| Is there an [observed, inferred, or projected] decline in extent of occurrence? | No |
| Is there an [observed, inferred, or projected] decline in index of area of occupancy? | No |
| Is there an [observed, inferred, or projected] decline in number of subpopulations? | No |
| Is there an [observed, inferred, or projected] decline in Number of “locations” See Definitions and Abbreviations on COSEWIC website and IUCN (Feb 2014) for more information on this term.? |
No |
| Is there an [observed, inferred, or projected] decline in [area, extent and/or quality] of habitat? | No |
| Are there extreme fluctuations in number of subpopulations? | No |
| Are there extreme fluctuations in Number of “locations” See Definitions and Abbreviations on COSEWIC website and IUCN (Feb 2014) for more information on this term.? |
No |
| Are there extreme fluctuations in extent of occurrence? | No |
| Are there extreme fluctuations in index of area of occupancy? | No |
| Subpopulations (give plausible ranges) | N Mature Individuals |
|---|---|
| Total | Unknown |
| Summary items | Information |
|---|---|
| Probability of extinction in the wild is at least [20% within 20 years or 5 generations, or 10% within 100 years]. | No analysis available |
| Summary items | Information |
|---|---|
Was a threats calculator completed for this species? No |
What additional limiting factors are relevant? |
| Summary items | Information |
|---|---|
| Status of outside population(s) most likely to provide immigrants to Canada | Single population of which individuals in Canada are part, Population status is considered to be above the management reference point. |
| Is immigration known or possible? | Possible, genetic evidence in males. |
| Would immigrants be adapted to survive in Canada? | Yes |
| Is there sufficient habitat for immigrants in Canada? | Yes |
| Are conditions deteriorating in Canada? See Table 3 (Guidelines for modifying status assessment based on rescue effect). |
Unknown |
| Are conditions for the source population deteriorating? See Table 3 (Guidelines for modifying status assessment based on rescue effect). |
Unknown |
| Is the Canadian population considered to be a sink? See Table 3 (Guidelines for modifying status assessment based on rescue effect). |
No |
| Is rescue from outside populations likely? | Possible |
| Summary items | Information |
|---|---|
| Is this a data sensitive species? | No |
| Summary items | Information |
|---|---|
| COSEWIC: Designated Threatened in April 2006. | Status re-examined and designated Special Concern in April 2017. |
| Summary items | Information |
|---|---|
| Status | Special Concern |
| Alpha-numeric codes | not applicable |
| Reasons for designation | This species is more vulnerable than many other Atlantic shark species because of its long life span and low productivity. The species has a single highly migratory population in the North Atlantic, of which a portion is present in Canadian waters seasonally. The total North Atlantic catch and abundance are stable. Most analyses in a recent stock assessment showed a stable or increasing trend since 1971, resulting in improved status compared with the previous COSEWIC status report. However, the status is not secure, given the uncertainties in the stock assessment, the short period of improving catch rates relative to the 25-year generation time, and the low productivity of the species. |
| Summary items | Information |
|---|---|
| Criterion A (Decline in Total Number of Mature Individuals) | Does not meet criteria. The cause of the previous decline has ceased, is understood and is reversible. The reduction in total number of mature individuals is less than 50%. |
| Criterion B (Small Distribution Range and Decline or Fluctuation) | Does not meet criteria, EO and IAO exceed limits. |
| Criterion C (Small and Declining Number of Mature Individuals) | Does not meet criteria, population size exceeds limits. |
| Criterion D (Very Small or Restricted Population) | Does not meet criteria. |
| Criterion E (Quantitative Analysis) | Not done. |
| Summary items | Information |
|---|---|
| b. “ the wildlife species may become Threatened if factors suspected of negatively influencing the persistence of the wildlife species are neither reversed nor managed with demonstrable effectiveness” | - |
There are several new pieces of information since the writing of the 2006 Shortfin Mako COSEWIC status report including:
- studies confirming genetic structure of the population;
- all available tagging information from North Atlantic collated;
- PSAT tags deployed on Canadian captured Shortfin Mako;
- post-release survivorship information from Canadian pelagic longline fishery;
- ICCAT assessment in 2012 which included an analysis of best available trend indices, estimates of unaccounted for catch, productivity estimates, and a stock assessment;
- Based on new age validation studies, female age at maturity has been substantially revised from 7-8 yr to 18 yr (based on new information), implying lower population resilience than previously believed
- Better estimates of Canadian fishing mortality
The Committee on the Status of Endangered Wildlife in Canada (COSEWIC) was created in 1977 as a result of a recommendation at the Federal-Provincial Wildlife Conference held in 1976. It arose from the need for a single, official, scientifically sound, national listing of wildlife species at risk. In 1978, COSEWIC designated its first species and produced its first list of Canadian species at risk. Species designated at meetings of the full committee are added to the list. On June 5, 2003, the Species at Risk Act (SARA) was proclaimed. SARA establishes COSEWIC as an advisory body ensuring that species will continue to be assessed under a rigorous and independent scientific process.
The Committee on the Status of Endangered Wildlife in Canada (COSEWIC) assesses the national status of wild species, subspecies, varieties, or other designatable units that are considered to be at risk in Canada. Designations are made on native species for the following taxonomic groups: mammals, birds, reptiles, amphibians, fishes, arthropods, molluscs, vascular plants, mosses, and lichens.
COSEWIC comprises members from each provincial and territorial government wildlife agency, four federal entities (Canadian Wildlife Service, Parks Canada Agency, Department of Fisheries and Oceans, and the Federal Biodiversity Information Partnership, chaired by the Canadian Museum of Nature), three non-government science members and the co-chairs of the species specialist subcommittees and the Aboriginal Traditional Knowledge subcommittee. The Committee meets to consider status reports on candidate species.
The Canadian Wildlife Service, Environment and Climate Change Canada, provides full administrative and financial support to the COSEWIC Secretariat.
Shortfin Mako (Isurus oxyrinchus) is one of two species in the genus Isurus (the other being the Longfin Mako, I. paucus) and one of five species in the family Lamnidae or mackerel sharks. Other lamnid sharks found in Canada include the White Shark (Carcharodon carcharias), Salmon Shark (Lamna ditropis), and Porbeagle (Lamna nasus). There are no recognized subpopulations of Shortfin Mako.
Shortfin Mako are identified by a pointed snout, relatively small eyes, long smooth-edged dagger-like teeth without side cusps (on both jaws), and a U-shaped mouth (Figure 1). The lower anterior teeth protrude horizontally on jaws even when the mouth is closed. Pectoral fins are slightly curved with tips relatively narrow, anterior margins about 16 to 22% of total length and shorter than head length. Origin of first dorsal fin over or just behind the pectoral free rear tip; first dorsal-fin apex broadly rounded in young but more angular and narrowly rounded in large juveniles and adults; first dorsal-fin height greater than base length in large individuals but equal or smaller in young below 185 cm. The crescent-shaped caudal fin has a horizontal primary keel but no secondary keel. The dorsolateral colouration is brilliant blue or purplish, with white below the underside of snout in young and adults. The head is dark in colour and partially covers the gill septa. The dark colour of the flanks does not extend ventrally onto the abdomen; the pelvic fins are dark on anterior halves, white on posterior halves, with the undersides white.
Long description for Figure 1
Illustration of the Shortfin Mako. The Shortfin Mako has a pointed snout and relatively small eyes. The pectoral fins are slightly curved with relatively narrow tips and anterior margins about 16 to 22 percent of total length. The first dorsal fin originates over or just behind the pectoral free rear tip. The crescent-shaped caudal fin has a horizontal primary keel but no secondary keel. The back and sides of the Shortfin Mako are brilliant blue or purplish, with white below the underside of snout. The head is dark and partially covers the gill septa.
Misidentifications have occurred in warmer waters where the two mako species ranges commonly overlap. In Canada where Longfin Mako are extremely rare, misidentification between the two species is not believed to be a problem. In Atlantic Canada, Shortfin Mako has been misidentified as Porbeagle shark and may have contributed to underestimation of Shortfin Mako landing data prior to 1996 (Campana et al. 2004a).
Current understanding of the population spatial structure of Shortfin Mako globally and in the North Atlantic specifically has been achieved through over 50 years of conventional tagging, recent satellite tagging, and genetic studies over the last two decades (ICCAT 2012; Campana et al. 2015).
In 2012, the International Commission for the Conservation of Atlantic Tunas (ICCAT) collated all available conventional tagging information (i.e., wire tags) in the North Atlantic. Since 1962, a total of 9218 tags have been released and 1203 recaptured (Figure 2). Most of these tags have been deployed off the northeast coast of the United States. While Shortfin Mako were found to travel large distances of up to 3400 km across the Atlantic most movement was between south and east within the northwest Atlantic with very few captures below 20˚N and none south of 5˚N (Figure 2).
Long description for Figure 2
Map illustrating tag and release distributions for Shortfin Mako in the Atlantic Ocean. Distributions are displayed as straight lines between release and recovery locations.
Shark tagging using conventional tags occurred in Canadian waters between 1961 and 1986 (n=110) and more recently between 2006 and 2015 (n=32) with five and two recaptures respectively (Figure 3; Showell et al. 2017). Between 2010 and 2014, the Canadian Shark Laboratory deployed 43 satellite tags on both healthy and injured Shortfin Mako primarily from the Scotian Shelf of which 34 were recovered or transmitted data (Campana et al. 2015; Showell et al. 2017; Figure 4). Both conventional and satellite tagging information from individuals tagged in Canada during summer months suggests general movement in a south, east or southeasterly direction and over large distances easterly toward the central Atlantic or south toward the Caribbean.
Long description for Figure 3
Map showing Canadian Shortfin Mako conventional tagging releases and recoveries over two time periods (2006 to 2015 and 1961 to 1986).
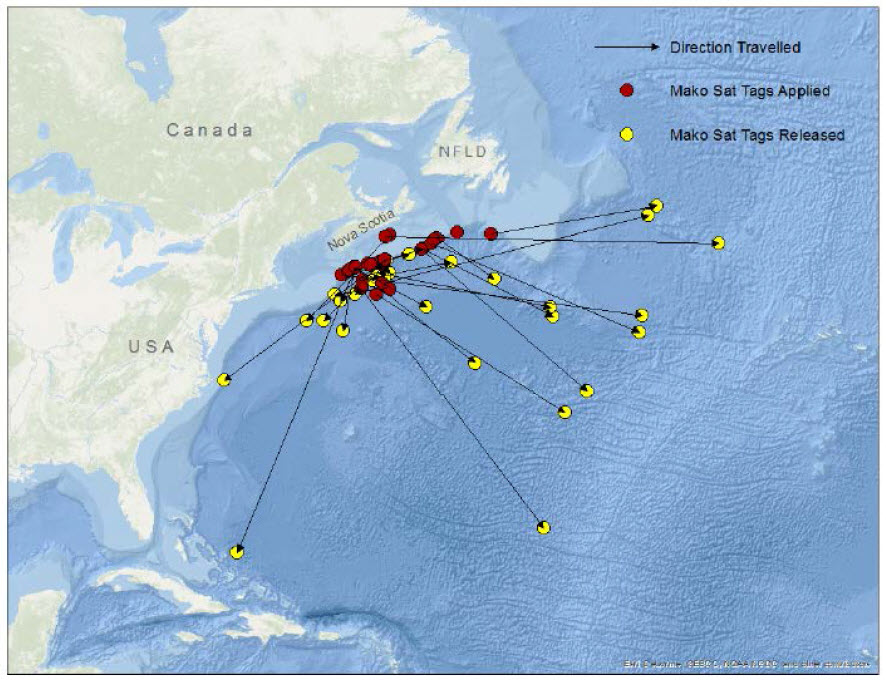
Long description for Figure 4
Map showing Canadian Shortfin Mako PSAT pop-up satellite tagging application sites and data release positions.
Collectively, tagging studies from both Canada and the US indicate that tagged individuals are highly migratory primarily using waters west of 40˚ longitude and north of 30˚ latitude.
Genetic evidence, primarily from analyses using mitochondrial DNA, supports a distinct North Atlantic population and wide spatial separation from other populations. Heist et al. (1996) used mitochondrial DNA (mtDNA) to analyze population structure in Shortfin Mako from both the Atlantic and Pacific. They found that the North Atlantic population differed substantially from populations in the South Atlantic and North and South Pacific (overall FST = 0.15), and the authors concluded that the North Atlantic population experienced restricted gene flow from other areas and therefore may warrant separate management consideration. Schrey and Heist (2003) investigated microsatellite (nuclear) DNA of Shortfin Mako at four loci using 433 samples from the North Atlantic, South Atlantic, North Pacific, South Pacific, and the Atlantic and Pacific coasts of South Africa. This latter study found very low levels of differentiation even among the major ocean basins (global FST < 0.003) and only a weak basis for rejecting the hypothesis that Shortfin Mako comprise a single global population. Under one mutation model the P value was slightly less than 0.05, whereas under another mutation model the P value was slightly above 0.05. Power analysis indicated very high power to detect population structure at the level indicated by the mtDNA study. Schrey and Heist (2003) suggested that one way to explain both datasets is that females are strongly philopatric (hence the strong differences at the maternally inherited mtDNA) but males are good dispersers (hence at best weak differentiation at nuclear DNA makers). Using similar mtDNA techniques (n=106), genetic separation of North Atlantic and Pacific Shortfin Mako populations was reconfirmed by Taguchi et al. (2011).
Canadian waters are near the periphery of the species’ range in the North Atlantic (see Distribution section below). Based on biogeographical separation, genetic differences with other global populations, and no evidence of structuring within the North Atlantic, Shortfin Mako in the North Atlantic are considered to be a population and the single DU in Canada is part of a wider North Atlantic population. No information on what proportion of the North Atlantic population resides in Canada is available.
Although this species is not directly targeted in Canada, it is incidentally caught and sold because of its high quality meat. Due to its energetic displays and edibility, it is highly prized by sport anglers, with most of the recreational fishing for this species occurring in the United States. Throughout its range, including Canadian waters, the meat is utilized fresh, frozen, smoked and dried salted for human consumption; the oil is extracted for vitamins; the fins used for shark-fin soup; the hides processed into leather and the jaws and teeth used for ornaments. The Shortfin Mako is an opportunistic apex predator with a wide prey base and as such is likely important in structuring marine ecosystems.
Shortfin Mako are found worldwide in temperate and tropical seas. The North Atlantic population of Shortfin Mako is considered to be in all waters south of 60˚N to the equator (Figure 5a) (Showell et al. 2017).
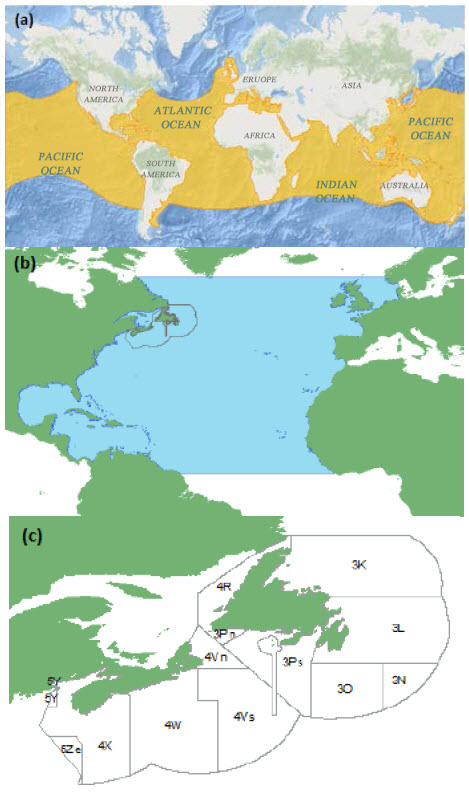
Long description for Figure 5
Maps showing (a) the approximate global distribution of Shortfin Mako (all waters south of 60 degrees north to the equator); (b) the North Atlantic distribution of the designatable unit; and (c) the Canadian area of occupancy for the North Atlantic designatable unit.
The Canadian range is an estimate based on the distribution of all known observations collected from commercial fisheries (ZIFF (Zonal Interchange File Format) and MARFIS (Maritimes Fisheries Information System) databases), Canadian at-sea fisheries observer data (Maritimes Region Observer Program, Newfoundland and Labrador Region Observer Program), research surveys, and tagging data overlapping with a NAFO fishing area (Figure 6; Showell et al. 2017). In Canadian waters, the Shortfin Mako is typically associated with warm waters such as in and around the Gulf Stream. It has been recorded from Georges and Browns Bank, along the continental shelf of Nova Scotia, the Grand Banks and even into the Gulf of St. Lawrence (Showell et al. 2017). Canadian at-sea fisheries observer data from Canadian, Faroese, and Japanese fishing vessels indicate that Shortfin Mako are caught both in inshore waters and offshore waters from the southern extent of Canada’s Exclusive Economic Zone (EEZ) to 50ºN. This species is a highly migratory seasonal visitor (late summer and fall) to Canada’s Atlantic coast. Shortfin Mako in Canadian waters represents the northwestern extension of the North Atlantic-wide population and is likely a small portion of the North Atlantic population during their residency although no information on what proportion resides in Canada is available. There are no data to indicate either an expansion or reduction in Shortfin Mako range within Atlantic Canadian waters.
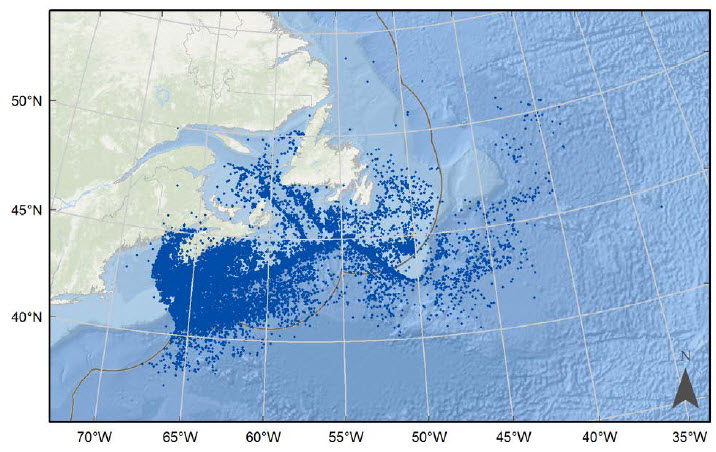
Long description for Figure 6
Map illustrating combined observations of Shortfin Mako in Canadian waters from ZIFF (Zonal Interchange File Format) and MARFIS (Maritimes Fisheries Information System) observer databases over the period 1998 to 2014.
The extent of occurrence within the Canadian portion of this DU was calculated to be the sum of the portion of NAFO areas 3KL+3NOP+4R+4VWX+5Y+5Ze within Canada’s EEZ (1.06 million km2) (Figure 5b; Showell et al. 2017). The current area of occupancy, represented by frequent sightings or captures is approximately 800,000 km2 (Campana et al. 2004a).
Although there have been several satellite tags deployed on Shortfin Mako in Canadian waters since the 2006 COSEWIC report, this new information has not changed the general understanding of habitat requirements in the North Atlantic (Campana et al. 2015). Temperature appears to be the dominant factor defining Shortfin Mako distribution. Preferred water temperature is between 17-22°C and consequently, in the Atlantic, they are often associated with Gulf Stream waters (Compagno 2001), which occur largely outside Canadian waters. Temperature and depth recorders on satellite transmitters indicate that Shortfin Mako occur between 10.4-28.6˚C and surface to 556 m (Loefer et al. 2005).
Typically, Shortfin Mako occur offshore on the continental shelf break, on the continental shelf, and can also occur nearshore. In the western North Atlantic, they move onto the continental shelf when surface temperatures exceed 17°C, typically June through to December.
A lack of data has prevented any identification of habitats necessary for critical life functions (e.g., mating, pupping) of this species in Canadian waters. Godin et al. (2015 unpubl.) identified areas of higher catch (landings+discards) rates (Figure 7) but no habitat features have been ascribed to these areas.
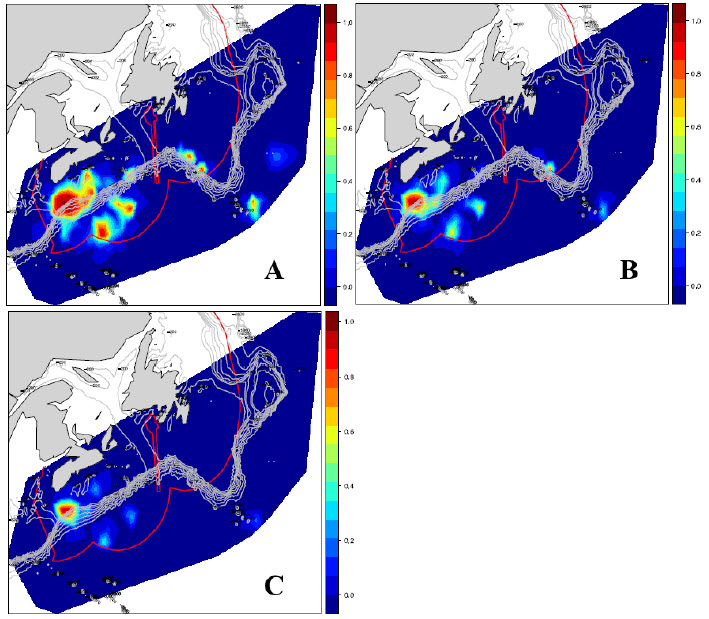
Long description for Figure 7
Map panels illustrating core hotspots for Shortfin Mako shark catch (landings plus discards) in the Canadian pelagic longline fishery, from 2003 to 2013. The panels show areas where catches are twice (panel a), five times (panel b), and 10 times (panel c) the average number of sharks per set.
A lack of data has impeded investigation of whether Shortfin Mako habitat has changed over time in the North Atlantic DU or Canadian waters. Although the North Atlantic has experienced positive temperature anomalies in recent decades, there has been no research into the timing of offshore and inshore migrations and distribution patterns of Shortfin Mako.
Shortfin Mako are aplacental viviparous with developing embryos known to feed on unfertilized eggs during the gestation period. The estimated gestation period varies globally. In the North Atlantic the gestation period is estimated to be 15-18 months with litter sizes of 11 on average every three years (Campana et al. 2004a). Birth can occur from late winter to mid-summer with young born at about 70 cm in length (Mollet et al. 2000). After parturition it is thought that females may rest for 18 months and therefore the breeding cycle may be three years (Mollet et al. 2000; ICCAT 2012).
Age and growth validation of Shortfin Mako has varied results depending on technique and ocean basin. For the North Atlantic, based on bomb radiocarbon validation, estimated age of 50% maturity is 8 years for males (185 cm fork length) and 18 years for females (275 cm fork length) (Natanson et al. 2006). Similar maturity estimates were found by Campana et al. (2004a) who reported females to be immature up to 18 years old and 272 cm fork length (Campana et al. 2004a).
Based on approximately five per cent annual at-sea observer coverage, length frequency data reported by observers in the Maritimes Region pelagic longline fishery suggest that mature individuals are either rare in Atlantic Canadian waters, do not encounter commercial fishing gear, or if encountered are more likely to break off the line due to their size (DFO 2016). The percentage of mature males (total length>185 cm) and females (total length>275 cm) reported by observers in the commercial fishing fleet between 2006 and 2015 is estimated at 7% (n=1114) and <1% (n=1025) respectively. The size composition of the observed catch in the Japanese pelagic longline fishery operating in Canadian waters from 1986 to 1996 increased over that period, and the size composition in the Canadian pelagic longline fishery from 1999 to 2014 has varied without trend (Figure 8).
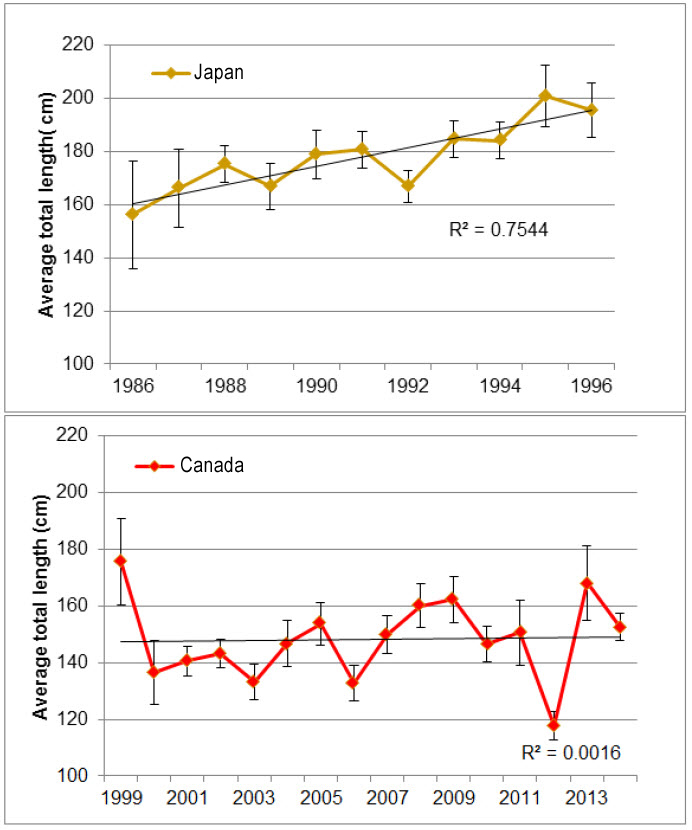
Long description for Figure 8
Charts illustrating the length-frequency distribution of Shortfin Mako captured in Japanese longline fisheries operating in Canadian waters from 1986 to 1996 (top chart), and in Canadian longline fisheries from 1999 to 2014 (bottom chart), recorded through Canadian at-sea observer programs
Natural mortality (M) for North Atlantic Shortfin Mako has been reported to be in the range of 0.10 to 0.15 by Bishop et al. (2006). Smith et al. (1998) calculated natural mortality to be 0.16.
Generation time was calculated using the following equation: 1/adult mortality+age of 50% female reproduction. Generation time is therefore (18+(1/0.15)) which is about 25 years.
Shortfin Mako adults are likely adapted to withstand the current extent of climate change, changes in prey type, and increasing water temperatures, as they can readily move long distances and prey upon a wide variety of species. Furthermore, adults are distributed over a large area, thereby reducing its susceptibility to localized stochastic events. Their physiology allows the animal to remain highly active in cooler waters (Carey et al. 1981).
Shortfin Mako are capable of highly migratory behaviour with observed movement of up to 3,400 km (Casey and Kohler 1992). Conventional tagging studies show that most recoveries are less than 500 km from tagging location (Kohler et al. 1998; ICCAT 2012). Based on both thermal preference and highly mobile behaviour, it is unlikely that Shortfin Mako have extended residency beyond summer and early fall months in Canadian waters. Shortfin Mako (Ntagged=9218, Nreturned=1203) tagged and recaptured between 1962-2012 in the northwestern Atlantic demonstrated a range of movement but primarily south, southeast, and eastward from the tagging location (Figure 2).
A recent study tracking the movement of Shortfin Mako sharks satellite tagged off the Yucatan Peninsula, Mexico (n=12) and off Maryland, United States (n=14) displayed region-specific movement with little distributional overlap providing evidence of some spatial structuring at scales smaller than currently considered (Vaudo et al. 2016).
There are no accepted models of Shortfin Mako migration in the North Atlantic. Maia et al. (2007) summarized what is known in the North Atlantic with respect to dispersal and migration. It appears that females migrate to latitudes of 20°-30°N to give birth based on evidence that no pregnant females have been caught outside this range (although such inferences are limited by the availability of scientific observer data). Males tend to be more common at higher latitudes than females based on frequency in observed catch data, but this may be in part due to segregation in the water column, with females spending more time at depth, or possibly an effect of fishing gear selectivity. Schrey and Heist (2003) have suggested females to be philopatric to yet-to-be identified pupping grounds while males may undertake longer distance movements, based on microsatellites and mtDNA population structure (described in Population Spatial Structure section). An accepted migration model is hindered by the lack of evidence of pupping grounds and insufficient understanding of movement patterns of both male/female and immature/mature individuals through an annual cycle.
Based on diet studies of adults, Shortfin Makos prey upon a wide variety of species, primarily bony fish (Osteichthyes) including tunas, mackerels, bonitos, and Swordfish, and also squid (Bowman et al. 2000). There is some suggestion that larger individuals shift towards consuming larger prey including other sharks, small cetaceans and turtles. Based on two sampling methodologies carried out in the western North Atlantic, Bluefish (Pomatomus saltatrix) and Butterfish (Peprilus triacanthus) were found to be the most important prey, comprising 78% and 31% of their diet respectively (Bowman et al. 2000).
Information on abundance and trends is available primarily from fishery dependent indices from within and from outside Canada. Shortfin Mako are in greatest abundance in Canadian waters from June to December associated with the warmest water temperatures and only represent about 2.5% of the overall geographic distribution of the North Atlantic-wide population. Therefore, indices from outside Canada are relevant for assessing status in Canada. Both DFO (Showell et al. 2017) and ICCAT (2012) have provided summary documents of existing fishery dependent data from throughout the North Atlantic range of Shortfin Mako and these have provided the primary sources for this document.
For Canadian waters, bycatch of Shortfin Mako from observed trips in the Maritimes Region pelagic longline fishery from 1996 to 2014 is the only available information to index abundance and to understand the demographics of the population (Showell et al. 2017). At-sea observer coverage in the pelagic longline fishery has been approximately 5% since 2004. Other fisheries that interact with Shortfin Mako (e.g., gillnet and trawl) have between 1-18% observer coverage depending on region and gear type. It is also worth noting that Canadian catch occurs at the periphery of the distribution of the North Atlantic DU and therefore the indices should not be considered in isolation of indices covering the full range of the North Atlantic Shortfin Mako.
There are several catch rate indices from commercial longline landings in other parts of the range. The most recent analysis of all available catch rate data was reviewed and published by ICCAT (2012). The ICCAT analysis identified the six most representative catch rate series: Japanese longline fishery (1994-2010); two from the US longline fishery (observer data 1992-2010, logbook data 1986-2010); US recreational fishery (1981-2010), Portuguese longline fishery (2000-2010), and Spanish longline fishery (1990-2010) (Figure 9 a,b).
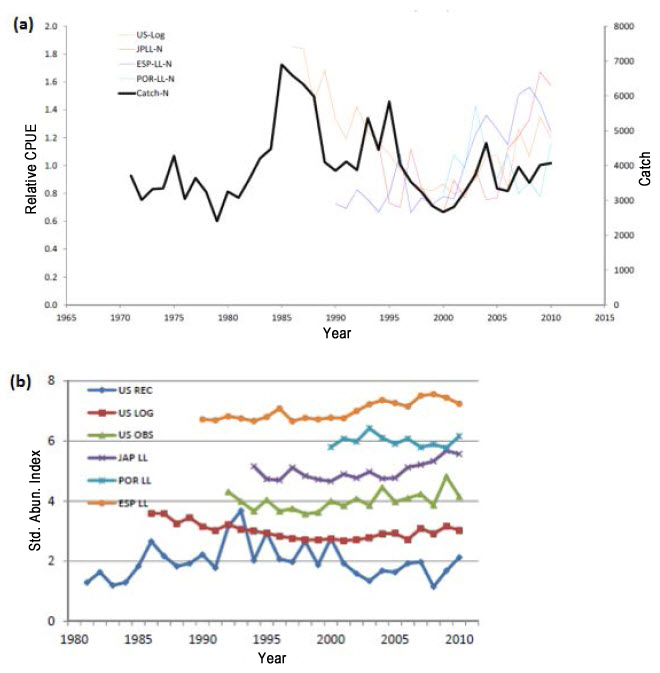
Long description for Figure 9
Charts showing indices of abundance for North Atlantic Shortfin Mako along with total catches (Chart a) and standardized Shortfin Mako catch rate indices produced by Showell et al. (2017) (Chart b).
ICCAT (2012) developed two population models, a Bayesian surplus production model and a ‘catch-free’ model, using four of the commercial longline catch rate indices (US, Japanese, Portuguese, Spanish). In addition, ICCAT applied a catch estimation factor to better account for inaccurate catch reporting in historical datasets.
An index of abundance using standardized Canadian catch rates from the Maritimes Region pelagic longline fishery was developed by Campana et al. (2004a) and has been used subsequently to update the catch rate series (Figure 10; Fowler and Campana 2009; Showell et al. 2017). Applying the catch rates to a generalized linear model, the most recent update (Figure 10) shows a decline in catch rate compared to earlier in the series but still not significant. Variables contributing to the limited utility of the Canadian index include a small number of annually observed trips with Shortfin Mako catches (range:11-95) and limited spatial coverage relative not only to the Canadian distribution but also the entire North Atlantic distribution.
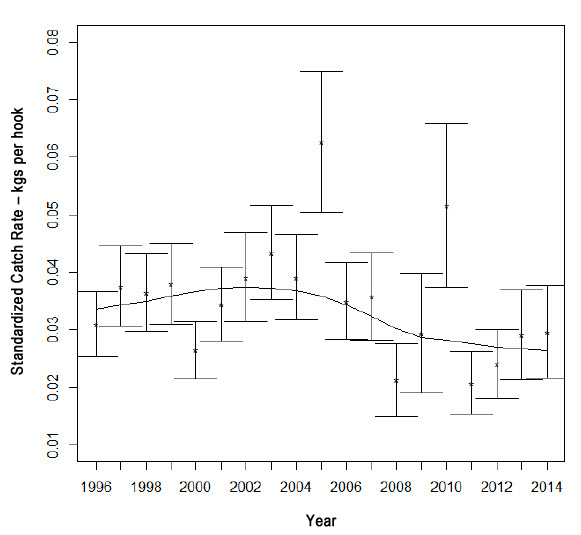
Long description for Figure 10
Chart showing standardized Shortfin Mako catch rates from the Maritimes Region pelagic longline fishery, from 1996 to 2014, on the Scotian Shelf.
The six most reliable catch rate indices identified by ICCAT (2012) were selected through a systematic evaluation involving 12 questions to examine the sufficiency of the catch per unit effort (CPUE) series (e.g., geographical coverage, length of time series; see Table 14, ICCAT 2012). Although the resultant six series are considered the best available, they also suffer from severe limitations because they are fishery-based and in some cases are highly variable. Showell et al. (2017) standardized the six indices using data available in the 2012 ICCAT assessment. The indices show no consistent trend for the North Atlantic population (Figure 9 a, b). ICCAT’s general interpretation is that the CPUE series show increasing or flat trends for the final years of each series while catch is remaining fairly constant (Figures 9 & 14).
The most recent assessment of the north Atlantic Shortfin Mako population was undertaken by ICCAT (2012) and utilizes data to 2010. Due to inconsistent reporting, the reported catches were not considered reliable for the model input. A new catch series was derived, where landings and discards that were reported were prorated to fill gaps in the time series (Table 8 in ICCAT 2012). As a result, the estimated catch (landings+discards) found in the time series used for modelling purposes was substantially higher than those found in reported landings data.
A Bayesian surplus production model (BSP) was used to estimate population status, incorporating catch estimates as well as four of the indices mentioned above: the US longline logbook series, Japanese longline, Portuguese longline and Spanish longline (Figure 9a). Sixteen model formulations were run, using various combinations of indices and weighting options. MSY (maximum sustainable yield) from the various runs ranged from 5,300 t to 24,000 t, with an average of about 19,000 t. In all cases estimates of biomass exceeded BMSY (the biomass which would produce maximum sustainable yield), with most around 1.75 BMSY. Four selected model runs showing the long-term trend of B/BMSY show an increasing or stable trend since 1971, but the assessment indicated poor fits of the indices with the model predictions (Figure 11). Recent estimated catches of around 4,000 t/yr are below the lower range of MSY (Figure 14; see Threats section).
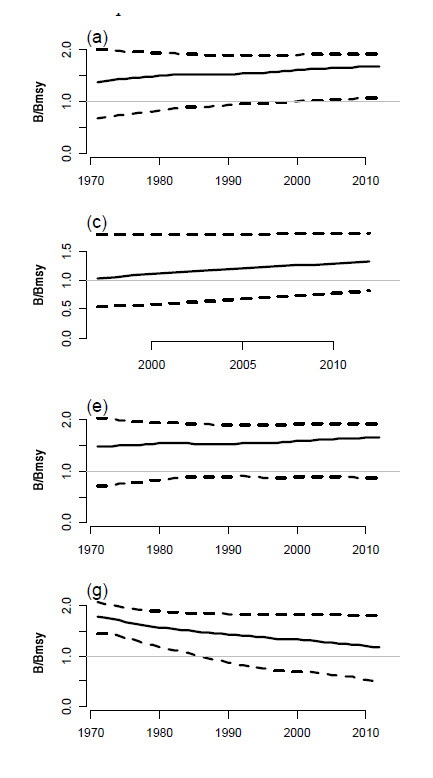
Long description for Figure 11
Chart panels illustrating the median of the current North Atlantic Shortfin Mako biomass relative to BMSY (stock biomass needed to support maximum sustainable yield), with 80 percent credibility intervals for four selected BSP (Bayesian surplus production) model runs. Run 1 uses equal weighting starting in 1971, Run 3 uses equal weighting starting in 1997, Run 6 uses area weighting starting in 1971, and Run 13 uses catch estimated from effort through 1996.
A catch-free model incorporating only CPUE data from 1956-2010 was also explored. Ten North Atlantic formulations were run and produced similar results to that of the BSP model, although this model could not estimate yields, and confidence intervals were not provided. Two of the ten runs representing the greatest range were included in the ICCAT (2012) report (Figure 12). The most negative scenario indicated a SSB/SSB0=0.55 while the most positive scenario indicated a SSB/SSB0=0.71. For all runs ICCAT concluded that the estimated biomass fit the CPUE series poorly, suggesting that improved knowledge around the biological parameters and factors affecting CPUE series are needed.
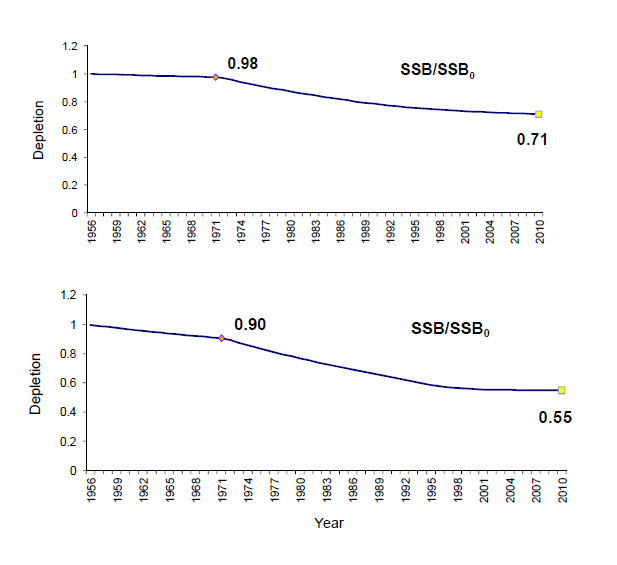
Long description for Figure 12
Charts illustrating two catch-free model runs fit to the indices of relative spawning stock biomass depletion for the North Atlantic Shortfin Mako, from 1956 to 2010.
Overall, ICCAT (2012) concluded that abundance indices and landings data showed increasing or flat trends since the previous assessment (2008). Indications of potential overfishing shown in the 2008 stock assessment have diminished and the current level of catches may be considered sustainable. The results indicated that the probability of overfishing is low; however, due to the uncertainty with catch data the analyses produced wide confidence intervals in estimated trajectories and other parameters.
Individuals are part of a single population distributed widely in the northern half of the Atlantic Ocean. Canadian waters are considered to represent only a peripheral 2.5% of their total geographical range and Canadian threats represent a small portion of the threats (Showell et al. 2017). Therefore extirpation from Canada is highly unlikely, but if it were to happen, a “rescue effect” from the broader population would be possible unless the entire population of the DU was also experiencing a severe decline.
Direct mortality through various directed and bycatch fisheries is the only identified threat to Shortfin Mako throughout their distribution. The species is not targeted in Canada but is caught and permitted to be landed as bycatch in a limited number of fisheries. In Canadian waters, bycatch in pelagic longline fisheries targeting tunas and Swordfish is the main cause of mortality, with lesser reported interactions in groundfish gillnet and trawl fisheries (Table 1; Figure 13a). Recreational catches in Canadian waters are considered insignificant (Campana et al. 2004b). Approximately 89% of the reported landings in Canada between 1994 and 2014 are from the Maritimes Region (Figure 13b). Landings data in Canada are considered a substantial underestimate of total bycatch because most discards are unreported. There has been a reduction in landings since 2008. One explanation for the decline may be a result of the Canadian pelagic longline fleet changing from J-hooks to circle hooks (DFO 2016). Outside Canada, international commercial longline fleets are the primary sources of mortality to this population with lesser mortalities associated with other gear types and fisheries, including the US recreational fishery (Figure 14).
Table 1. Canadian landings (t) of Shortfin Mako shark by year, fishing gear, and region calculated from ZIFF and MARFIS databases. Showell et al. (2017)
| Year | Region | Longline | Handline | Gillnet | Otter trawl | Other | Derby | Regional total | Annual total |
|---|---|---|---|---|---|---|---|---|---|
| 1993 | Maritimes | blank cell | blank cell | 0.3 | blank cell | blank cell | blank cell | 0.3 | 3.71 |
| blank cell | NF | 1.1 | blank cell | 2.3 | blank cell | 0.0 | blank cell | 3.41 | blank cell |
| blank cell | Quebec | blank cell | blank cell | blank cell | blank cell | blank cell | blank cell | 0 | blank cell |
| blank cell | Gulf | blank cell | blank cell | blank cell | blank cell | blank cell | blank cell | 0 | blank cell |
| 1994 | Maritimes | 117.6 | 2.3 | 9.5 | 1.7 | 0.1 | blank cell | 131.2 | 142.4 |
| blank cell | NF | 6.5 | blank cell | 4.5 | blank cell | blank cell | blank cell | 11 | blank cell |
| blank cell | Quebec | blank cell | 0.2 | blank cell | blank cell | blank cell | blank cell | 0.2 | blank cell |
| blank cell | Gulf | blank cell | blank cell | blank cell | blank cell | blank cell | blank cell | 0 | blank cell |
| 1995 | Maritimes | 88.0 | 0.2 | 13.4 | 0.7 | 0.5 | blank cell | 102.8 | 111.2 |
| blank cell | NF | 5.9 | blank cell | 2.4 | blank cell | blank cell | blank cell | 8.3 | blank cell |
| blank cell | Quebec | blank cell | blank cell | blank cell | blank cell | blank cell | blank cell | 0 | blank cell |
| blank cell | Gulf | 0.1 | blank cell | blank cell | blank cell | blank cell | blank cell | 0.1 | blank cell |
| 1996 | Maritimes | 50.5 | 0.3 | 7.8 | 1.0 | blank cell | 0.1 | 59.6 | 67.51 |
| blank cell | NF | 5.6 | blank cell | 2.3 | blank cell | 0.0 | blank cell | 7.91 | blank cell |
| blank cell | Quebec | blank cell | blank cell | blank cell | blank cell | blank cell | 0.0 | 0 | blank cell |
| blank cell | Gulf | blank cell | blank cell | blank cell | blank cell | blank cell | blank cell | 0 | blank cell |
| 1997 | Maritimes | 90.2 | 0.2 | 9.3 | 1.5 | blank cell | blank cell | 101.2 | 109.5 |
| blank cell | NF | 4.0 | blank cell | 4.0 | 0.1 | blank cell | blank cell | 8.1 | blank cell |
| blank cell | Quebec | blank cell | blank cell | blank cell | blank cell | blank cell | blank cell | 0 | blank cell |
| blank cell | Gulf | 0.2 | blank cell | blank cell | blank cell | blank cell | blank cell | 0.2 | blank cell |
| 1998 | Maritimes | 46.2 | 0.2 | 8.0 | 2.2 | 0.6 | blank cell | 57.2 | 70.9 |
| blank cell | NF | 9.5 | blank cell | 4.0 | blank cell | blank cell | blank cell | 13.5 | blank cell |
| blank cell | Quebec | blank cell | blank cell | blank cell | blank cell | blank cell | blank cell | 0 | blank cell |
| blank cell | Gulf | 0.2 | blank cell | blank cell | blank cell | blank cell | blank cell | 0.2 | blank cell |
| 1999 | Maritimes | 45.8 | blank cell | 4.8 | 1.8 | 0.7 | blank cell | 53.1 | 70.4 |
| blank cell | NF | 7.8 | 0.1 | 9.2 | 0.1 | blank cell | blank cell | 17.2 | blank cell |
| blank cell | Quebec | 0.0 | blank cell | blank cell | blank cell | blank cell | blank cell | 0 | blank cell |
| blank cell | Gulf | 0.1 | blank cell | blank cell | blank cell | blank cell | blank cell | 0.1 | blank cell |
| 2000 | Maritimes | 48.2 | 0.1 | 5.3 | 0.4 | 0.8 | 0.49 | 54.8 | 79.5 |
| blank cell | NF | 10.7 | blank cell | 12.9 | 0.1 | 0.5 | blank cell | 24.2 | blank cell |
| blank cell | Quebec | 0.0 | blank cell | blank cell | blank cell | blank cell | 0.3 | 0.3 | blank cell |
| blank cell | Gulf | blank cell | blank cell | blank cell | blank cell | blank cell | 0.2 | 0.2 | blank cell |
| 2001 | Maritimes | 51.2 | 0.2 | 5.2 | 0.2 | 0.4 | blank cell | 57.2 | 69.7 |
| blank cell | NF | 8.6 | blank cell | 3.6 | 0.1 | blank cell | blank cell | 12.3 | blank cell |
| blank cell | Quebec | 0.0 | 0.1 | blank cell | blank cell | 0.0 | blank cell | 0.1 | blank cell |
| blank cell | Gulf | 0.0 | blank cell | blank cell | blank cell | 0.1 | blank cell | 0.1 | blank cell |
| 2002 | Maritimes | 54.3 | 0.3 | 9.8 | 0.8 | 1.3 | 0.67 | 66.5 | 79.3 |
| blank cell | NF | 6.4 | 0.1 | 4.5 | blank cell | blank cell | blank cell | 11 | blank cell |
| blank cell | Quebec | blank cell | blank cell | 0.1 | blank cell | blank cell | blank cell | 0.1 | blank cell |
| blank cell | Gulf | 0.8 | blank cell | 0.2 | blank cell | blank cell | 0.7 | 1.7 | blank cell |
| 2003 | Maritimes | 57.6 | 0.2 | 6.8 | 0.5 | 1.4 | 0.40 | 66.5 | 74 |
| blank cell | NF | 6.0 | blank cell | 1.4 | blank cell | 0.1 | blank cell | 7.5 | blank cell |
| blank cell | Quebec | 0.0 | blank cell | blank cell | blank cell | blank cell | blank cell | 0 | blank cell |
| blank cell | Gulf | blank cell | blank cell | blank cell | blank cell | blank cell | blank cell | 0 | blank cell |
| 2004 | Maritimes | 62.1 | 0.2 | 6.8 | 0.1 | 1.0 | 1.00 | 70.2 | 81.4 |
| blank cell | NF | 8.0 | blank cell | 3.0 | blank cell | blank cell | blank cell | 11 | blank cell |
| blank cell | Quebec | blank cell | blank cell | blank cell | blank cell | blank cell | blank cell | 0 | blank cell |
| blank cell | Gulf | 0.2 | blank cell | blank cell | blank cell | blank cell | blank cell | 0.2 | blank cell |
| 2005 | Maritimes | 71.3 | 0.5 | 11.9 | 0.9 | 0.9 | 0.39 | 85.5 | 95.7 |
| blank cell | NF | 5.3 | blank cell | 4.4 | 0.1 | blank cell | blank cell | 9.8 | blank cell |
| blank cell | Quebec | blank cell | blank cell | blank cell | blank cell | blank cell | blank cell | 0 | blank cell |
| blank cell | Gulf | 0.4 | blank cell | blank cell | blank cell | blank cell | blank cell | 0.4 | blank cell |
| 2006 | Maritimes | 61.5 | blank cell | 4.9 | 0.3 | blank cell | 0.39 | 66.7 | 70.4 |
| blank cell | NF | 2.4 | blank cell | 1.2 | blank cell | blank cell | blank cell | 3.6 | blank cell |
| blank cell | Quebec | blank cell | blank cell | blank cell | blank cell | blank cell | blank cell | 0 | blank cell |
| blank cell | Gulf | blank cell | blank cell | blank cell | blank cell | 0.1 | blank cell | 0.1 | blank cell |
| 2007 | Maritimes | 61.3 | blank cell | 6.0 | 0.8 | blank cell | 0.20 | 68.1 | 71.3 |
| blank cell | NF | 1.9 | blank cell | 1.0 | blank cell | 0.0 | blank cell | 2.9 | blank cell |
| blank cell | Quebec | blank cell | blank cell | blank cell | blank cell | blank cell | blank cell | 0 | blank cell |
| blank cell | Gulf | 0.2 | blank cell | blank cell | blank cell | 0.1 | blank cell | 0.3 | blank cell |
| 2008 | Maritimes | 39.3 | blank cell | 2.3 | 0.7 | 1.3 | blank cell | 43.6 | 45.8 |
| blank cell | NF | 2.0 | blank cell | 0.1 | blank cell | blank cell | blank cell | 2.1 | blank cell |
| blank cell | Quebec | 0.1 | blank cell | blank cell | blank cell | blank cell | blank cell | 0.1 | blank cell |
| blank cell | Gulf | blank cell | blank cell | blank cell | blank cell | blank cell | blank cell | 0 | blank cell |
| 2009 | Maritimes | 46.6 | blank cell | 1.7 | 0.2 | blank cell | 0.49 | 48.5 | 53 |
| blank cell | NF | 3.5 | blank cell | 0.9 | blank cell | blank cell | blank cell | 4.4 | blank cell |
| blank cell | Quebec | blank cell | blank cell | blank cell | blank cell | blank cell | blank cell | 0 | blank cell |
| blank cell | Gulf | 0.1 | blank cell | blank cell | blank cell | blank cell | blank cell | 0.1 | blank cell |
| 2010 | Maritimes | 37.0 | blank cell | 0.5 | 0.1 | 0.3 | 0.25 | 37.9 | 41.3 |
| blank cell | NF | 1.5 | blank cell | 1.5 | blank cell | blank cell | blank cell | 3 | blank cell |
| blank cell | Quebec | blank cell | blank cell | blank cell | blank cell | blank cell | blank cell | 0 | blank cell |
| blank cell | Gulf | 0.2 | blank cell | 0.2 | blank cell | blank cell | blank cell | 0.4 | blank cell |
| 2011 | Maritimes | 35.6 | blank cell | 0.1 | blank cell | 0.1 | 0.15 | 35.8 | 37.6 |
| blank cell | NF | 1.3 | blank cell | blank cell | blank cell | blank cell | blank cell | 1.3 | blank cell |
| blank cell | Quebec | 0.2 | blank cell | blank cell | blank cell | blank cell | blank cell | 0.2 | blank cell |
| blank cell | Gulf | 0.2 | blank cell | blank cell | blank cell | 0.1 | blank cell | 0.3 | blank cell |
| 2012 | Maritimes | 28.4 | blank cell | 0.2 | 0.5 | blank cell | 0.42 | 29.1 | 29.7 |
| blank cell | NF | blank cell | blank cell | 0.4 | blank cell | blank cell | blank cell | 0.4 | blank cell |
| blank cell | Quebec | blank cell | blank cell | blank cell | blank cell | 0.1 | blank cell | 0.1 | blank cell |
| blank cell | Gulf | 0.1 | blank cell | blank cell | blank cell | blank cell | blank cell | 0.1 | blank cell |
| 2013* | Maritimes | 34.4 | blank cell | 0.4 | blank cell | blank cell | 0.32 | 35.1 | 35.3 |
| blank cell | NF | blank cell | blank cell | blank cell | blank cell | blank cell | blank cell | 0 | blank cell |
| blank cell | Quebec | 0.1 | blank cell | blank cell | blank cell | blank cell | blank cell | 0.1 | blank cell |
| blank cell | Gulf | 0.1 | blank cell | blank cell | blank cell | blank cell | blank cell | 0.1 | blank cell |
| 2014* | Maritimes | 53.2 | blank cell | 1.5 | blank cell | blank cell | 0.32 | 35.1 | 35.3 |
| blank cell | NF | blank cell | blank cell | blank cell | blank cell | blank cell | blank cell | blank cell | blank cell |
| blank cell | Quebec | blank cell | blank cell | blank cell | blank cell | blank cell | blank cell | blank cell | blank cell |
| blank cell | Gulf | blank cell | blank cell | blank cell | blank cell | blank cell | blank cell | blank cell | blank cell |
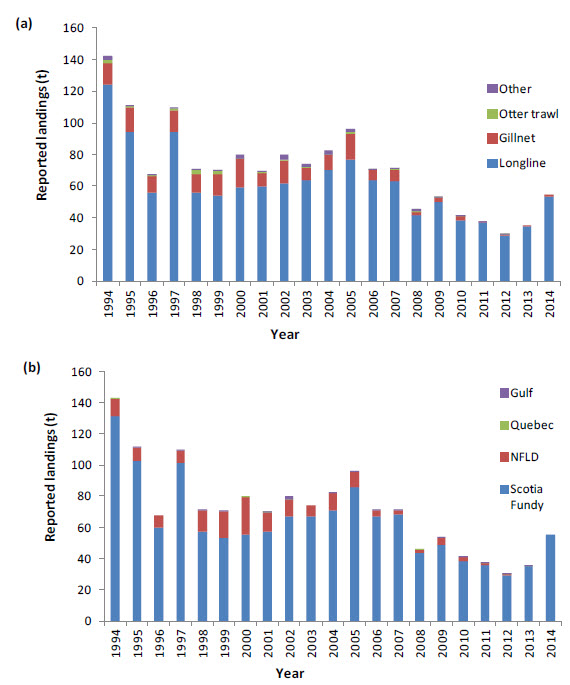
Long description for Figure 13
Charts illustrating Canadian reported Shortfin Mako landings (tonnes) by gear type (Chart a) and management region (Chart b), from 1994 to 2014.
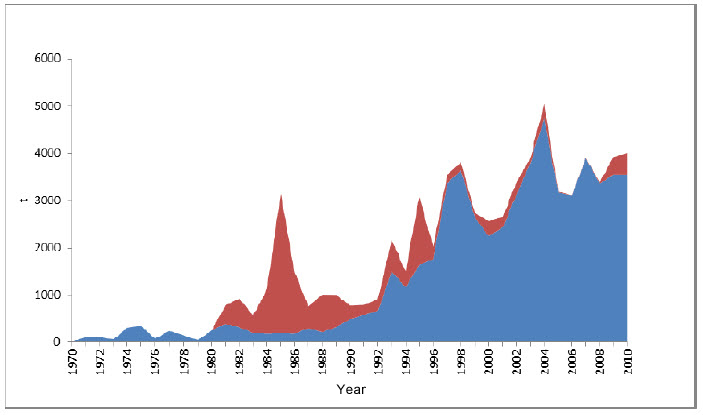
Long description for Figure 14
Chart tracking estimated Shortfin Mako catch (landings and discards) in the North Atlantic by longline gear and other types of gear, from 1970 to 2010.
Beginning in 2015, the Canadian longline fleet operating in the Maritimes Region has voluntarily supported management measures to release Shortfin Mako that are still alive when the fishing gear has been retrieved. Post-release survival of Shortfin Mako shark caught by longline gear has only recently been estimated (Campana et al. 2015). Survivorship of individuals released at sea depends on condition at capture and release, which varies with capture method, gear setting techniques, duration hooked before gear is retrieved, animal size, handling on board, and environmental conditions (Campana et al. 2015). Campana et al. (2015) estimated that mortality of released Shortfin Mako in the Canadian pelagic longline fishery would be 49% based on estimates of condition upon release (dead, injured, or healthy). Post-release survival of injured and healthy individuals was estimated using satellite tags (n=33) (Figure 15).
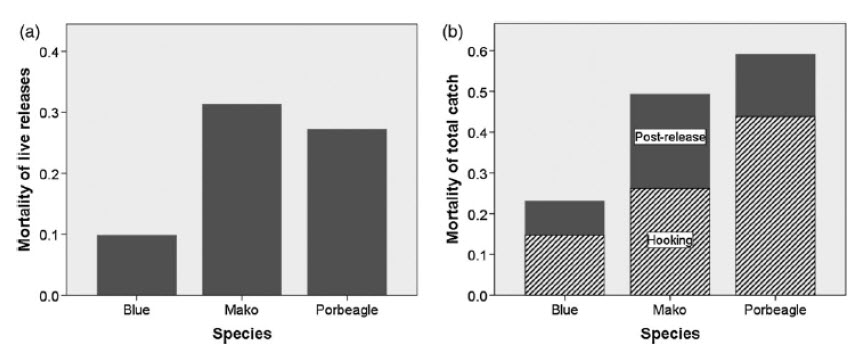
Long description for Figure 15
Charts illustrating shark mortality due to capture or hooking in Canadian commercial pelagic longline fishing according to species (Blue, Mako, Porbeagle). Chart a shows the proportion that die after release as recorded by PSATs; Chart b shows the proportion of the total catch that die during hooking and after release.
Total annual mortality in the Maritimes Region (1996-2014) was calculated by applying a 49% mortality rate to estimates of total discards (from observer reports) in pelagic longline fisheries, groundfish otter trawl, groundfish longline, and groundfish gillnet fisheries (Showell et al. 2017). The estimate of dead discards was added to the reported landings for a resultant average total mortality of 69 t/year (Range 42-115 t; 1996-2014) (Showell et al. 2017).
In the Newfoundland and Labrador Region, total bycatch estimates of Shortfin Mako were calculated by extrapolating ratios found in observed trips to non-observed trips between 1998-2010 for a variety of fisheries (Figure 16; Showell et al. 2017). Annual estimates of catch were highly variable due to low observer coverage (0-3%). Estimates range from near zero to 174 t with an annual average of 80 t (Figure 16). Most of this estimated catch was from cod-directed gillnet fisheries, which would have 100% mortality. Therefore, total Canadian annual mortality is estimated to be 150 t/yr.
Figure 16. Estimated annual total bycatch (t) of Shortfin Mako by directed species and gear (GN=gillnet; LL=longline; OTB=otter trawl-bottom) in Canada’s EEZ of Div. 3LNOP, 1998-2010. Data are from Canadian Fisheries Observers and DFO-NL ZIFF in comparable years. Note that these unweighted estimates are scaled up to the entire fishery, and contingent on whether Canadian landings were reported in ZIFF, and the annual degree of NL-ASO coverage of each fishery.
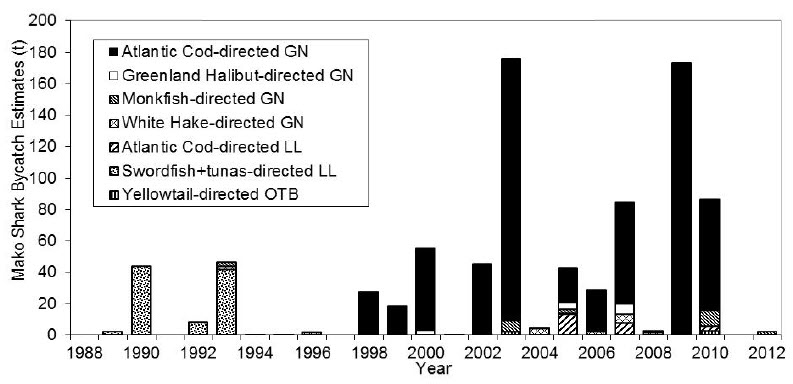
Long description for Figure 16
Chart illustrating estimated annual total bycatch (tonnes) of Shortfin Mako by directed species and gear (gillnet, longline, otter trawl-bottom) in Canada’s Exclusive Economic Zone of Division 3LNOP, from 1998 to 2010.
Substantial uncertainties regarding fishing mortality for the entire North Atlantic result from poor catch reporting, with virtually no estimates of discards at sea and incomplete reporting of landings. For example, the Northwest Atlantic Fisheries Organization (NAFO) does not require its member countries to record shark discards for any fishery conducted in the NAFO Regulatory Area (i.e., outside countries’ exclusive economic zones), thereby rendering unknown the total annual removals of Shortfin Mako on the high seas. Accuracy of reported landings improved after 1996 when ICCAT requested that landings of sharks be reported.
From 1996-2010, average reported landings were around 2395 t but this number is considered to be an underestimate. Due to under-reporting of landings and discards, ICCAT (2012) provided better estimates by calculating the ratio of Shortfin Mako landings to the total landings of tuna and Swordfish from each fleet in recent years, and multiplying this ratio by the tuna plus Swordfish landings in each historical year. Between 1996 and 2010 the ratio-based estimates of landings were on average 3527t (Range 2668-4648t). However, these landings-based estimates must be interpreted with caution, because they do not account for shark discards at sea and thus represent only minimum mortality levels. Using the total Canadian annual average mortality estimate (150 t), Canadian fisheries may contribute to approximately 4% of the overall mortality by weight. Voluntary release of live individuals since 2015 for pelagic longline fisheries in the Maritimes Region is anticipated to further decrease the mortality in Canadian waters but not the amount of interactions with the fishing gear.
As described in the ‘Biology’ section above, mature females are seldom caught in Canadian fisheries. Observer records from 2006 to 2015 indicate that only 1% of the observed females caught are reproductively mature. However, this must be interpreted with caution, because the majority of Shortfin Mako bycatch remains unreported as a consequence of low annual observer coverage of Atlantic Canadian fisheries that encounter sharks.
Shortfin Mako contain significant levels of contaminants, including PCBs, DDTs, pesticides, and mercury (Lyons et al. 2013). However, it is not known if these contaminants represent a source of mortality for the population.
Shortfin Mako populations, in comparison to other shark species, have relatively low productivity limiting capacity to recover once the population is depleted. ICCAT (2012) conducted a productivity-susceptibility analysis (PSA) of 20 shark populations and identified that the low productivity in comparison to the other shark species is primarily due to the long length of time for females to reach maturity and their three-year reproductive cycle (Table 1; ICCAT 2012).
| Stock | Productivity (r) | LCL | UCL | Generation time (yrs) |
|---|---|---|---|---|
| Blue Shark N. Atl. | 0.314 | 0.279 | 0.345 | 8.2 |
| Blue Shark S. Atl. | 0.299 | 0.264 | 0.327 | 9.8 |
| Pelagic Stingray N. Atl. | 0.230 | 0.181 | 0.279 | 6.2 |
| Smooth Hammerhead | 0.225 | 0.213 | 0.237 | 13.4 |
| Tiger Shark | 0.190 | 0.180 | 0.200 | 15.6 |
| Oceanic Whitetip Shark | 0.121 | 0.104 | 0.137 | 10.4 |
| Scallop Hammerhead S. Atl. | 0.121 | 0.110 | 0.132 | 21.6 |
| Thresher Shark | 0.121 | 0.099 | 0.143 | 11.0 |
| Scallop Hammerhead N. Atl. | 0.096 | 0.093 | 0.107 | 21.6 |
| Silky Shark N. Atl. | 0.078 | 0.065 | 0.090 | 14.4 |
| Great Hammerhead | 0.070 | 0.069 | 0.071 | 27.1 |
| Shortfin Mako | 0.058 | 0.049 | 0.068 | 25.0 |
| Porbeagle Shark | 0.052 | 0.044 | 0.059 | 20.3 |
| Pelagic Stingray S. Atl. | 0.051 | 0.004 | 0.096 | 6.6 |
| Dusky Shark | 0.043 | 0.035 | 0.050 | 29.6 |
| Silky Shark S. Atl. | 0.042 | 0.029 | 0.054 | 16.5 |
| Night Shark | 0.041 | 0.028 | 0.053 | 14.9 |
| Longfin Mako | 0.029 | 0.020 | 0.038 | 25.2 |
| Sandbar Shark | 0.010 | 0.005 | 0.024 | 21.8 |
| Bigeye Thresher | 0.009 | 0.001 | 0.018 | 17.8 |
Shortfin Mako Sharks are broadly distributed throughout the North Atlantic, and are subject to capture in a number (probably >10) of international fisheries. In a COSEWIC sense, each fishery could be considered a “location”, with a specific threat to the population associated with each location.
There is no directed fishery for Shortfin Mako sharks in Atlantic Canada, and there is no longer an Integrated Fisheries Management Plan (IFMP) to oversee the management of sharks. Shortfin Mako is instead managed within the IFMPs of the fisheries that catch sharks as bycatch (e.g., Maritimes Region pelagic longline Swordfish fishery). In addition, the Atlantic Canada Conservation Action Plan for Selected Shark Species (CAP) has recently been approved. This action plan was developed to update the National Plan of Action for Conservation and Management of Sharks (DFO 2007) in response to FAO’s International Plan of Action for sharks (FAO 1999). The CAP has a management focus on ensuring that human activity does not have unacceptably adverse effects on the ecosystem, but it does not provide any plan of action to help conserve pelagic shark species.
At present, there is a non-restrictive annual catch limit for Shortfin Mako of 100t for the pelagic longline fishery in the Maritimes Region. The Canadian pelagic longline fishery in the Maritimes Region has recently supported the voluntary release of live Shortfin Mako which is anticipated to reduce landings and mortality in the coming years but not shark interactions with fishing gear. To support this voluntary measure, a new Shark Fishing - Best Catch, Handle and Release Practices guide has been developed by the World Wildlife Fund-Canada and provided to shark derbies and fishery groups in Maritimes Region to help decrease shark post-release mortality. For the Canadian pelagic longline fishery in the Maritimes Region, Shortfin Mako must be recorded in logbooks as condition of license and there is a requirement to use corrodible circle hooks to reduce bycatch and post-release mortality. In the Newfoundland and Labrador Region groundfish fisheries, shark landings are regulated to 10% of the catch of the directed groundfish species by weight with no additional protective measures.
Shortfin Mako taken as bycatch is landed as a food product and is more valuable than Blue Shark (Prionace glauca) that are often caught in the same fisheries. For Atlantic Canadian groundfish fisheries using gillnets or longlines, Canada has adopted a mandatory “fins-attached” policy, in which pelagic sharks have their fins naturally attached until weighed and recorded by a Dockside Monitor at port of landing. Another Canadian shark management measure is the “5% ratio” regulation, which allows landings per fishing trip to a maximum of 5% fins relative to the weight of landed shark carcasses. Atlantic Canadian fisheries using bottom trawls or purse seines are not permitted to retain shark bycatch; although this prohibition does not reduce shark interactions with fishing gear. Shark finning (i.e., removing and retaining fins while discarding the shark’s body, sometimes still alive, at sea) has been banned since 1994 in Canada, although the value of Shortfin Mako as a meat has made finning less of an issue with this particular species. However, it must be noted that Canada allows the sale of Canadian shark fins within its own borders, as well as their export to international markets.
Shortfin Mako was first assessed as threatened by COSEWIC in 2006 but was not given legal protection under Canada’s Species at Risk Act. Shortfin Mako (Atlantic subpopulation) was last assessed in 2004 by the International Union for the Conservation of Nature (IUCN) as “vulnerable” (Cailliet et al. 2009) and is noted as “needs updating” in the website’s online annotation. The US National Oceanographic and Atmospheric Administration (NOAA) described the population status as “stock is healthy, because it is not overfished and the probability that overfishing is occurring is low” (NOAA 2015).
Shortfin Mako habitat is within Canada’s Exclusive Economic Zone (EEZ) off the Atlantic coast and is managed by Fisheries and Oceans Canada. There are presently no specific protection measures for habitat occupied by Shortfin Mako. In international waters outside Canada there are currently no areas identified for habitat protection for Shortfin Mako.
The writer is grateful to Mark Showell, Mark Fowler, Warren Joyce, Mike McMahon, Mark Simpson and Carolyn Miri for their work in the CSAS research document. Thank you to Christie Whelan for her assistance and Aurélie Cosandey-Godin from WWF for providing her analyses.
Bishop, S.D.H., M.P. Francis, C. Duffy, and J.C. Montgomery. 2006. Age, growth, longevity and natural mortality of the shortfin mako shark (Isurus oxyrinchus) in New Zealand waters. Marine and Freshwater Research. 57: 143-154.
Bowman, R.E., C. E. Stillwell, W.L. Michaels, and M.D. Grosslein. 2000. Food of northwest Atlantic fishes and two common species of squid. NOAA Technical Memorandum. NMFS-NE 155, 138 p.
Cailliet, G.M., R.D. Cavanagh, D.W. Kulka, J.D. Stevens, A. Soldo, S. Clo, D. Macias, J. Baum, S. Kohin, A. Duarte, J.A. Holtzhausen, E. Acuña, A. Amorim, and A. Domingo. 2009. Isurus oxyrinchus (Atlantic subpopulation). The The IUCN Red List of Threatened Species 2009: e.T161749A5494807. Downloaded on the 5 January 2016.
Campana, S.E., L. Marks, and W. Joyce. 2004a. Biology, fishery and stock status of shortfin mako sharks (Isurus oxyrinchus) in Atlantic Canadian Waters. Canadian Science Advisory Secretariat Research Document 2004/094.
Campana, S.L. Marks, W. Joyce, and N. Kohler. 2004b. Influence of recreational and commercial fishing on blue shark (Prionace glauca) population in Atlantic Canadian waters. Canadian Science Advisory Secretariat Research Document 2004/069. 67 p.
Campana, S.E., W. Joyce, M. Fowler, and M. Showell. 2015. Discards, hooking, and post-release mortality of porbeagle (Lamna nasus), shortfin mako (Isurus oxyrinchus), and blue shark (Prionace glauca) in the Canadian pelagic longline fishery. ICES Journal of Marine Science, doi:10.1093/icesjms/fsv234
Carey, F.G., J.M. Teal, and J.W. Kanwisher. 1981. The visceral temperature of mackerel sharks (Lamnidae). Physiological Zoology 54: 334-344.
Casey, J.G., and N.E. Kohler. 1992. Tagging studies on the shortfin mako shark (Isurus oxyrinchus) in the western North Atlantic. Australian Journal of Marine and Freshwater Research 43: 45-60.
Compagno, L.J.V. 2001. Sharks of the world. An annotated and illustrated catalogue of shark species known to date. Volume 2. Bullhead, mackerel and carpet sharks (Heterodontiformes, Lamniformes and Orectolobiformes). United Nations Food and Agricultural Organization Species Catalogue for Fishery Purposes 1(2) Rome, FAO. 269 pp.
DFO. 2007. National plan of action for the conservation and management of Sharks. Ottawa, Canada. 31 p.
DFO. 2016. Proceedings of the Zonal Peer Review Pre-COSEWIC Assessment for Shortfin Mako (Isurus oxyrinchus) in Atlantic Canada ; September 16-17, 2015. DFO Canadian Science Advisory Secretariat Proceedings Series. 2015/062.
Fowler, G.M., and S.E. Campana 2009. Commercial by-catch rates of Shortfin Mako (Isurus oxyrinchus) from longline fisheries in the Canadian Atlantic. Collective Volume of Scientific Papers. International Commission for the Conservation of Atlantic Tunas 64(5) 1668-1676.
Heist, E.J., J. A. Musick, and J. E. Graves. 1996. Genetic population structure of the shortfin mako (Isurus oxyrinchus) inferred from restriction fragment length polymorphism analysis of mitochondrial DNA. Canadian Journal of Fisheries and Aquatic Sciences 53:583–588.
Godin, A., T. Wimmer, and B. Worm. 2015. Pre-COSEWIC Assessment for Shortfin Mako: Bycatch and discard in Canadian fisheries. Unpublished paper presented to Pre-COSEWIC meeting, September 16-17, 2015, Bedford Institute of Oceanography, Bedford, Nova Scotia, Canada Correia.
FAO. 1999. International Plan of Action for reducing incidental catch of seabirds in longline fisheries. International Plan of Action for the conservation and management of sharks. International Plan of Action for the management of fishing capacity. Rome, FAO. 26p.
ICCAT. 2012. Shortfin mako stock assessment and ecological risk assessment meeting (PDF version; 5.8 MB). [accessed June 2016].
Kohler, N. E., J.G. Casey, and P.A. Turner. 1998. NMFS cooperative shark tagging program, 1962-93: an atlas of shark tag and recapture data. Marine Fisheries Review 60:1-87.
Loefer, J.K., G. R. Sedberry, and J.C. McGovern. 2005. Vertical movements of a shortfin mako in the western North Atlantic as determined by pop-up satellite tagging. Southeastern Naturalist 4:237–246.
Lyons, K., A. Carlisle, A. Preti, C. Mull, M. Blasius, J. O’Sullivan, C. Winkler, and C.G. Lowe. 2013. Effects of trophic ecology and habitat use on maternal transfer of contaminants in four species of young of the year lamniform sharks. Marine Environmental Research 90: 27-38.
Maia, A., N. Queiroz, H.N. Cabral, A. M. Santos, and J.P. Correia. 2007. Reproductive biology and population dynamics of the shortfin mako, Isurus oxyrinchus Rafinesque, 1810, off the southwest Portuguese coast, eastern North Atlantic. Journal of Applied Ichthyology 23: 246–251.
Mollet, H.F., G. Cliff, H.L. Pratt Jr., and J.D. Stevens. 2000. Reproductive biology of the female shortfin mako, Isurus oxyrinchus, with comments on the embryonic development of lamnoids. Fisheries Bulletin 98:299-318.
Natanson, L.J., N.E. Kohler, D. Ardizzone, G.M. Cailliet, S.P. Wintner, and H.F. Mollet 2006. Validated age and growth estimates for the shortfin mako, Isurus oxyrinchus, in the North Atlantic Ocean. Environmental Biology of Fishes. 77: 376-383.
NOAA. 2015. North Atlantic shortfin Mako shark stock status. Accessed January 2016.
Schrey, A.W., and E.J. Heist. 2003. Microsatellite analysis of population structure in the shortfin mako (Isurus oxyrinchus). Canadian Journal of Fisheries and Aquatic Sciences 60:670-675.
Showell, M.A., G.M. Fowler, W. Joyce, M. McMahon, C.M. Miri, and M.R. Simpson. 2017. Current Status and Threats to the North Atlantic Shortfin Mako Shark (Isurus oxyrinchus) Population in Atlantic Canada. DFO Can. Sci. Advis. Sec. Res. Doc. 2017/039.
Smith, S.E., D.W. Au, and C. Show. 1998. Intrinsic rebound potentials of 26 species of Pacific sharks. Marine and Freshwater Research 49:663-678.
Taguchi, M., T. Kitamura, and K. Yokawa. 2011. Genetic population structure of shortfin mako (Isurus oxyrinchus) inferred from mitochondrial DNA on inter-oceanic scale. International Scientific Committee for Tuna and Tuna-Like Species in the North Pacific Ocean Shark Working Group Workshop, 19-21 July 2011.
Vaudo, J. J., M.E. Byrne, B.M. Wetherbee, G.M. Harvey, and M.S. Shivji. 2016. Long-term satellite tracking reveals region-specific movements of a large pelagic predator, the shortfin mako shark, in the western North Atlantic Ocean. Journal of Applied Ecology. 10.1111/1365-2664.12852
Scott Wallace has worked in marine conservation and management since 1995, focusing on species at risk and sustainable fisheries. He has worked for government, ENGOs and academia. He wrote the 2006 Shortfin Mako status report and was a member of COSEWIC Marine Fishes SSC from 2007-2015. He holds a PhD from the University of British Columbia.