Turkey Lakes watershed study site: meteorology
Meteorology (precipitation quantity, air temperature, relative humidity, wind speed and direction, barometric pressure) and atmospheric deposition are measured at the "CAPMoN" (Canadian Air and Precipitation Monitoring Network) site just outside of the basin boundary (Figure 1).
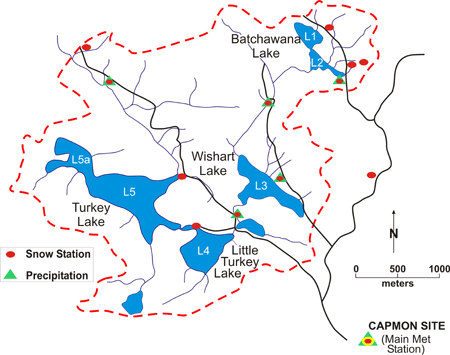
Figure 1: Location of CAPMoN and Snowpack sampling sites.
Please roll over with mouse on a desired station to view detail.
Precipitation quantity and snowpack water equivalent and chemistry are also monitored at several locations within the basin to quantify spatial variability. In addition, solar and ultra-violet radiation are measured at the CAPMoN site. National Water Research Institute (NWRI) and Meteorological Service of Canada (MSC) share responsibility for collecting this information (see Database Information for details).
An overall relief of 290 m and leeward position relative to Lake Superior influences the quantity of precipitation received by the Turkey LakesWatershed (TLW). As shown in Figure 2, annual total precipitation has ranged from 892 mm in 1997 to 1542 mm in 1988 (mean = 1215 mm). In comparison, Sault Ste. Marie, which lies south of the highlands containing the TLW, receives only 935 mm precipitation per year (long-term average). Rain has constituted 53 to 78% of the annual precipitation (mean = 65%). Extreme precipitation events over a 24-hour period are predominantly rain episodes. From 1980 to 2006, 23 days had rainfall quantities exceeding 50 mm whereas the greatest daily snowfall was 49 mm water equivalent.
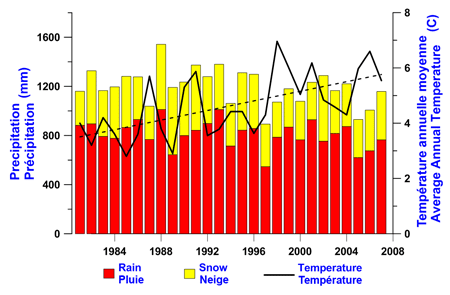
Figure 2: Long Description
Annual total precipitation and mean air temperature from 1982 to 2004. Annual temperature has been increasing approximately 0.1°C per year. About two-thirds of the annual precipitation occurs as rain.
From 1980 to 2006, the mean annual , maximum and minimum air temperature in the TLWwas 4.5oC, 6.9oC and 2.7oC, respectively. The annual mean daily air temperature has been increasing since 1980 at a rate of 0.118 Coyr-1 (slope of the linear regression line in Figure 2). On a monthly basis, the average mean daily air temperature is highest in July (17.7oC) and lowest in January (-11.1oC). June and September are the third and fourth warmest months on average, but it is increases in the air temperature for these months that is principally responsible for the rise in annual temperatures.
Wind direction and speed are extremely variable. The 1980-2001 wind direction record shows that northerly and westerly air flows are most common and easterly winds are least common. However, there are marked seasonal differences, i.e. northerly winds predominate in autumn and winter; easterly winds are relatively more important in spring; and westerly winds predominate in summer (Figure 3).
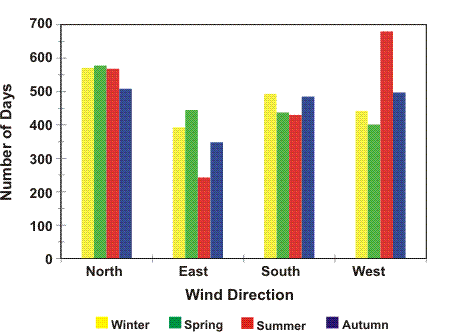
Figure 3: Long Description
Frequency distribution of mean daily wind direction by season 1980-2001. Wind occurs most frequently from the north and less frequently from the east except for summer when it is predominately from the west.
Mean daily wind speeds are in the range 1-2 m sec-1with some seasonal variation (Figure 4). On a seasonal basis, light winds (2 m sec-1 or less) generally predominate in winter and summer, while spring and to a lesser extent, autumn, experience days with winds >2 m sec-1.
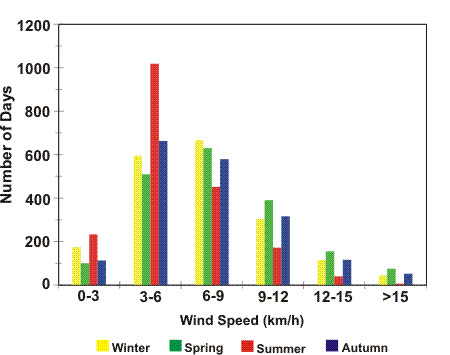
Figure 4: Long Description
Frequency distribution of mean daily wind speed by season 1980-2001. Winds of 3 to 9 km/hour predominate at the Turkey Lakes Watershed.
Global solar radiation is the total incoming direct and diffuse short-wave radiation received from the whole dome of the sky on a horizontal surface, usually expressed as megajoule per square metre (MJ m-2). The annual average daily global solar radiation was relatively constant over the 1980-2001 period, ranging from 10.6 to 12.53 MJ m-2. Monthly averages ranged from a low 2.41 MJ m-2 in December to a high of 20.63 MJ m-2 in June (Figure 5). The highest recorded value of daily solar radiation was 31.71 MJ m-2 on June 4th, 1982.
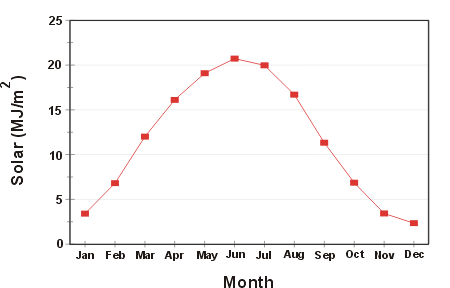
Figure 5: Long Description
Average monthly global solar radiation 1980-2001. Maximum solar radiation occurs in summer, and minimum occurs in winter.
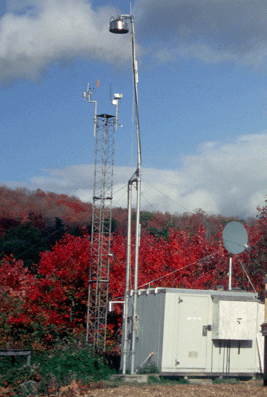
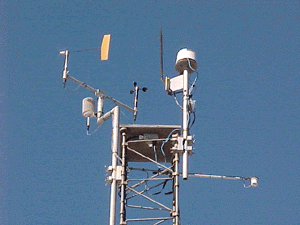
The 10m tower in the background of the picture above
supports all the sensors for measuring wind, temperature,
relative humidity, solar radiation, etc. (detail below)
