Turkey Lakes watershed study: streams
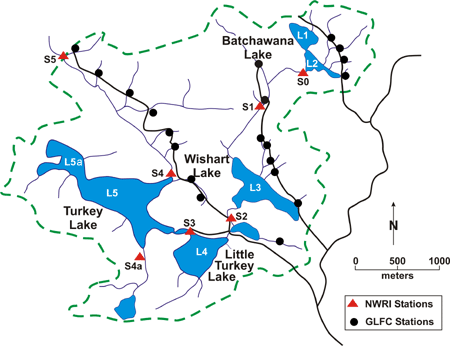
Figure 1: Location of NWRI and GLFC stream gauging and sampling stations.
Please roll over with mouse on a desired station to view detail.
Both flow and water chemistry are measured at several stream stations in the Turkey Lakes Watershed (TLW) to quantify mass fluxes, cycling and budgets. The National Water Research Institute (NWRI) tends to focus on lake outflow stations and other stations situated on Norberg Creek (the major drainage channel in the basin) while the Great Lakes Forest Centre (GLFC) tends to focus on headwater streams draining forested hill slopes (Figure 1). Monitoring began in 1980 but not all stations in Figure 1 have complete records through to the present. Stream flow is measured continuously while water chemistry is measured intermittently. The frequency of chemical sampling is variable with daily sampling during periods of high flow (usually at spring melt) and weekly sampling during low flow periods.
Hydrological gauging stations employing "flow-control" structures such as weirs or flumes facilitate monitoring of stream discharge. Water "stage" or depth within the structure (e.g in the pool behind the weir notch shown at right) is automatically and continuously recorded. These stage data are then converted to a continuous record of flow (e.g. Figure 2) using the relationship between stage and discharge determined from intermittent manual measurements.
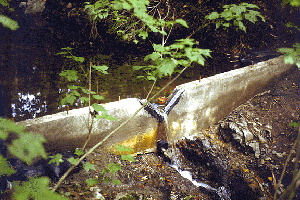
Weir at sampling site S1, Norberg Creek
The snowpack that accumulates in the TLW is usually much greater than 1 m thick due to "lake effect" snowfall. Hence, stream flow generated during spring snowmelt in March and April is almost always the largest hydrological event each year (i.e. the tallest peaks in Figure 2). Significant rainfall usually occurs in autumn so that sizeable sustained discharge and individual events are also common during September through November. Very dry years are usually distinguished by a lack of rainfall in summer and autumn rather than a lack of winter snow (see the differing pattern of stream flow between wet and dry years in Figure 2). The relatively cool, humid climate experienced by the TLW and its impermeable bedrock means that a relatively high proportion of the precipitation runs off in the streams.
Compare the precipitation and runoff data shown in Figure 3. From 1982 to 1997, between 59% and 81% of the annual precipitation flowed out of Turkey Lake. The proportion is even higher in the upper reaches of the basin because more precipitation falls at higher elevations.
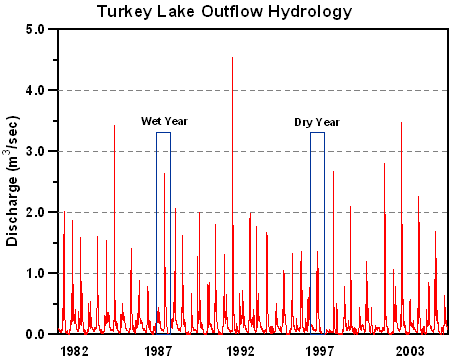
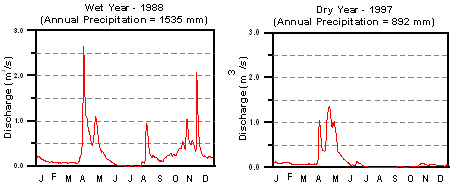
Figure 2: Long Description
Stream hydrology for the Turkey Lake outflow station. Expanded hydrographs for a wet and dry year are shown to illustrate the different flow patterns observed in the TLW.
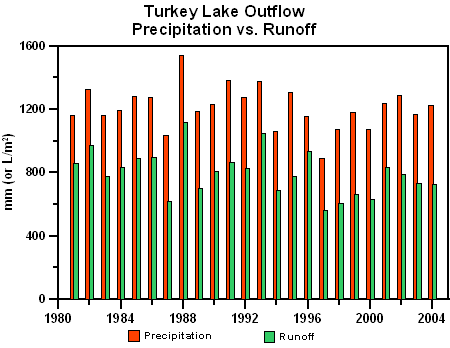
Figure 3: Long Description
Precipitation input measured at the main meteorological station and runoff measured at Turkey Lake outflow. Both variables are expressed in mm of water (equivalent to litres/sq m).
Stream water chemistry exhibits the same within-basin gradient discussed in the "Lakes" section. In addition, there have been significant temporal changes. Over the period of time that stream chemistry has been monitored at the TLW, there has been large reduction in North American emissions of sulphur dioxide, the pollutant most responsible for acid rain. The sulphur dioxide reductions are reflected in reduced sulphate concentrations in precipitation. Reduced precipitation sulphate has in turn caused a general downward trend in the concentration of sulphate and calcium in TLW stream water (Figure 4). The difference between sulphate concentrations in Norberg Creek (red lines in Figure 4) and precipitation (blue line) is much greater than that which should arise from evaporative concentration.
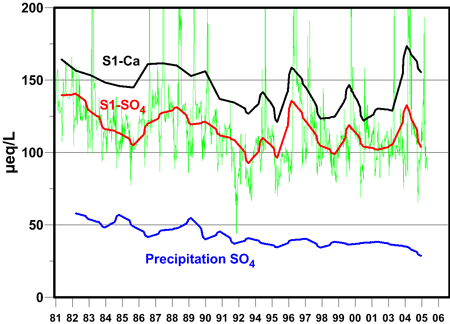
Figure 4: Long Description
Calcium (Ca) and sulphate (SO4) observed at stream station S1 and sulphate measured in precipitation. The thick lines are average annual concentrations. The thin green line shows weekly sulphate concentrations to illustrate the short-term variability normally present in monitoring data.
That is, the stream water levels are much higher than those expected if the ecosystem is in equilibrium with atmospheric sulphate deposition. The unexpectedly high stream water concentrations show that soils and wetlands in the TLW are releasing sulphate that was stored during past periods of higher deposition. Re-establishing an equilibrium between today's precipitation and stream water sulphate will take several years, perhaps even decades. Recovery of the ecosystem from the effects of acid rain will take just as long.
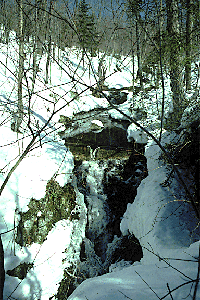
Stream site S1, Norberg Creek (between Batchawana
and Wishart Lakes) at the beginning of snow melt.
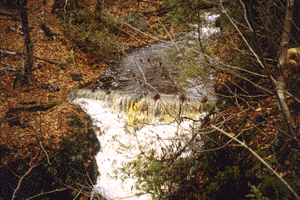
Same Norberg Creek station during an autumn high flow period.