
Flooding events in Canada: Ontario
In this Section:
Introduction
Floods in Ontario can result from snowmelt, spring rainfall storms, summer thunderstorms, tropical storms or hurricanes, or ice jams. The major cause, however, is spring snowmelt.
The most severe flooding on record in Ontario occurred in October 1954 when Hurricane Hazel passed over the Toronto area. Eighty-one lives were lost and damages were estimated at $25 million ($146.9 million in 1998 dollars).
Ice jams can occur when the spring thaw is early and rapid, and a strong ice cover exists. In May 1986, an ice jam destroyed the northern community of Winisk, causing two deaths.
These two events are described in more detail later in the write-up.
Hurricane Hazel - 1954
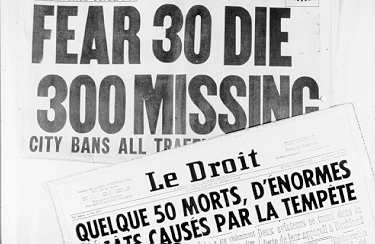
From 7:00 a.m. Thursday, October 14, to midnight on Friday, October 15, 1954, an estimated 210 millimetres of rain fell on the watersheds of the Don and Humber rivers and the Etobicoke and Mimico creeks. In its wake, Hurricane Hazel left the Toronto area devastated. Not only did the intensity of the storm catch people by surprise but the fact that the storm arrived at all was astonishing.
As it approached Ontario from the Caribbean, the storm showed signs of weakening. Since the extreme tropical low had moved inland, it still had to cross the Allegheny Mountains, and its wind velocity was falling off. However, when the warm moisture-laden air came in contact with the cold front, record levels of rainfall were deposited. The heaviest hit region was the Brampton area northwest of Toronto. By midnight of October 15, most of the rain had fallen. However, the heavy rain was followed shortly by severe flooding.
Streams in the Toronto area are characterized by steep slopes and little or no natural storage capacity. This leads to frequent inundation of the floodplains during intense storms and the spring snowmelt runoff. Even under the best of conditions the intense rainfall from Hurricane Hazel would have caused flooding. In this case, the situation was aggravated by already soaked soils. The autumn rainfall had been unusually heavy and had saturated the soils, thus preventing the absorption of any significant portion of Hurricane Hazel's downpour. It was estimated that 90% of the rainfall on the Humber River basin left as runoff. In fact, the area of highest rainfall was drained by the Humber River. On October 16, the flow of the river was four times greater than previously recorded.
Hurricane Hazel induced the most severe flooding in Toronto in over 200 years. As much of the floodplain had been developed, the flood damage was high, being estimated at $25 million ($146.9 million in 1998 dollars). Over 20 bridges were destroyed or damaged beyond repair, 81 lives lost, and 1868 families left homeless.
Damage from Hurricane Hazel - Toronto, 1954

The bridges at Bloor Street, Dundas Street, Old Mill, and Albion Road on the Humber River were badly damaged, while the bridge at Lawrence Avenue in Weston was washed out. All the flats were inundated, and roads and buildings were damaged. In Weston, the Humber River rose 6 metres, sweeping away a full block of homes on Raymore Drive, and killing 32 residents in a period of one hour.
Woodbridge during Hurricane Hazel - 1954

Twelve cottages were destroyed at a resort in Humber Summit, and cottages on Black Creek at Mount Dennis were flooded. Flooding destroyed a trailer camp in Woodbridge and left 20 dead. The village itself was severely flooded, with heavy damage to roads and houses.
At the mouth of the Etobicoke Creek at Long Branch, a cottage settlement was swept away, as was the Pleasant Valley trailer camp. At least 7 people were killed and 365 families left homeless.
People can clearly recall, as if it were yesterday, their personal experiences of Hurricane Hazel. On October 3, 1979, The Metropolitan Toronto and Region Conservation Authority held a 25th Anniversary Seminar commemorating Hurricane Hazel. Over 200 people attended.
Since 1957, the Conservation Authority has undertaken a comprehensive program of resource management on the watersheds under its jurisdiction, including flood control. It has acquired floodplain property, which has been cleared of residences and converted to parkland. In addition, the use of floodplain regulations enables the Conservation Authority to control activities in areas susceptible to flooding.
In a News Release re-issued by the Conservation Authority on October 4, 1984, rescue attempts of October 14 and 15, 30 years earlier, are recollected:
Police, firemen, soldiers, sailors, and ordinary citizens battled through the night saving those who had been trapped on river flats by the rampaging waters. Sometimes their rescue attempts were successful, but sometimes on the very brink of saving a life the rescuers were battered by a sudden surge of water and the ones they sought to save were swept away. Among the hurricane's victims were brave would-be rescuers who, like five volunteer fire-fighters from Etobicoke, were swept to their deaths in ill-fated efforts to reach marooned and endangered citizens. The five firemen lost their lives when the aerial ladder truck they had driven to the bank of the Humber River, to try to reach a trio of youths trapped atop a car was toppled into the frenzied waters.
Flooding during Hurricane Hazel - Toronto, 1954

This map shows the extent of Hurricane Hazel's of destruction:
Courtesy of The Metropolitan Toronto and Region Conservation authority.

See also: Anecdotes: Ontario
The Winisk Flood
On May 16, 1986, the Village of Winisk was swept from the northern landscape by massive chunks of ice carried by the floodwaters of the Winisk River. In just one day the village was levelled but for two buildings. Many homes were floated off their sites, some up to a kilometre down the coast and five or six kilometres inland.
An emergency team from Indian and Northern Affairs Canada and the Ontario Ministry of Natural Resources coordinated official relief efforts at the Winisk Airport, which was not flooded. Helicopters transported stranded people from canoes and the village to the airport.
Once the first 206 helicopter landed at Winisk Airport, I got in... and we headed out to pick up the people on the ridge. (We estimated fifty people were on the ridge from the beginning.) Since the fog had settled in over the entire area I had to go by memory finding the ridge again, as we had about 100-200 yards forward visibility and 50 foot ceiling. We found the ridge and began the airlift of people, commencing with kids and one or two mothers. In all, I made eight trips back and forth.... The pick-ups in the village were tricky. I assisted people, one by one, once they had climbed over jumbled ice chunks and crushed ice and fast-flowing water, until they were within arm's reach of the helicopter skid....
- Pilot
A man and a woman died during the flood. One drowned by being carried away by ice and water. The other was crushed by the flow of ice.
The entire community was destroyed and had to be re-established 30 kilometres south of its original location.
Coroner's inquest recommendations
Knowing that all of the coastal communities of the James and Hudson Bay area are located in a recognized flood zone; and in view of the distances, costs, and time involved, we, the jury, make the following recommendations as preventative measures:
- That a James and Hudson Bay Disaster Planning Committee be established and composed of representatives of each community and both federal and provincial governments to be the planning body for all possible disasters.
- That each have a Disaster Planning Committee and that its chairperson or alternate be the liaison person to the James and Hudson Bay Disaster Planning Committee.
- That each community be provided with a portable radio system.
- That the James and Hudson Bay Disaster Planning Committee hold annual reviews of the disaster plans and update data as required.
- That each community construct a helipad large enough to service their population size and elevated at least a minimum of eight feet above ground level with an independent lighting system.
- That each community organize an alternate escape route for other possible disasters with a connection from the community to the selected site.
- That helicopters be utilized for aerial surveillance instead of fixed wing aircraft to monitor river ice and snow conditions before and during breakup.
- That a warning system be set up in each community as part of the emergency evacuation plans.
- That the federal/provincial Flood Damage Reduction Program be the major funding source in order to implement all recommendations.
- That the proposed District Disaster Planning Committee make a request to Ontario Hydro that all power lines crossing river systems be elevated higher than the present height of the existing power lines.
- That all of the above recommendations be actively and immediately put in place.
The Timmins Storm
Many flash floods are localized situations, as was the case in Timmins on August 31, 1961. Temperatures during the afternoon were over 25°C, skies were cloudy and an occasional roll of thunder could be heard. By 6:00 in the evening, heavy rain began which lasted for a couple of hours. Light rain commenced again about 9:00 p.m. and continued until 11:00 p.m., when it became a torrential downpour for over an hour. During the heavy rains thunder was continuous and accompanied by an occasional burst of hail.
Town Creek, which runs through Timmins, has a small drainage area of about 10 square kilometres. During the afternoon the creek was in its normal state - nearly dry, a region of willows, bulrushes and rubbish. With the high drainage basin runoff rate from the torrential rains plus the runoff from streets and storm sewers, the small creek rapidly reached flood stage. It peaked by midnight in quick response to the rainfall and small drainage area, remaining high throughout the night as the rain continued at a reduced intensity. By early morning the rain had stopped and the streamflow steadily decreased thereafter.
Although the downpour only lasted a few hours, it ripped roads apart, smashed houses, undercut foundations, and damaged personal property. A mother and her four children were drowned in a house on the bank of the creek.
The Great Lakes
Two powerful forces are at work on the shorelines of the Great Lakes: flooding and erosion. Problems of flooding and erosion have been the most severe when Great Lakes water levels have been high, notably in 1952, 1972-73 and 1985-87.
Shorelines protected by bedrock do not experience erosion, such as the relatively unpopulated shorelines of Lake Superior and the northern shoreline of Lake Huron. Much of the shoreline from Port Severn on Georgian Bay to Gananoque located at the easterly end of Lake Ontario is prone to erosion. Large sections of this shore are lined with cottages and homes, which has greatly increased the cost of flooding and erosion damages.
Shoreline flooding occurs when water levels rise above their average height, either in the short term or for many months. The degree of flooding depends on the magnitude of the water level fluctuations and the elevation of the shorelands. Flooding is usually confined to low-lying areas and the lower reaches of tributaries which are affected by backed up water.
The water levels of the Great Lakes fluctuate both seasonally and annually. Levels on most lakes tend to be lower in midwinter and higher in midsummer. These seasonal fluctuations are typically in the range of 30 to 50 centimetres, while fluctuations over several years have been 1.2 to 1.8 metres.
Lake level change is primarily influenced by precipitation either directly into the lakes or in the form of runoff from the drainage basin. The 1960s were characterized by low precipitation rates and corresponding decreases in lake levels. On the other hand, 1972 and 1985 were high precipitation years (1985 was a record high), with correspondingly record high lake levels following. Lake levels can remain high for a few years, particularly in the lower lakes, as the higher lakes pass along their excess water. Other factors influencing lake levels are wind, evaporation, and control structures. Less influence is exerted by ice jams, dredging, and diversion. Crustal movement, or the rebounding of land depressed by the last ice age, causes very long-term water level changes.
Long-term flooding occurs when lakes reach record high levels and may persist for many months. Short-term flooding is caused by storms. Severe storms generate large waves and storm surges which may overtop banks and cause temporary flooding. Storms and seiches may also tilt the lake surface, causing sudden changes in lake levels. Factors influencing the extent of short-term fluctuations include lake depth, orientation of shoreline with respect to prevailing winds, and the length of open water (fetch).
Lakes Erie and St. Clair are particularly susceptible to flooding and storm damage. Lake Erie, with an average depth of only 19 metres, is one third of the depth of the next shallowest lake, Lake Huron. Storm surges of up to 2.5 metres have been experienced at the eastern end of Lake Erie. These conditions can persist from a few hours to several days. Lake St. Clair's shoreline is highly developed and even moderate storm surges can cause significant property damage.
There have been three instances of major flooding in the last 40 years: 1952, 1972-73, and 1985-87. These periods of flooding and erosion caused over $25 million ($84.7 million in 1998 dollars) in damages to the Canadian shore in 1972-73, and approximately $100 million ($124.3 million in 1998 dollars) in damages between 1985 and 1987.
1972-1973
In the late 1960s, persistently above-average precipitation began to raise the levels of the Great Lakes. In 1972, the precipitation rates were high. During this period a number of severe storms resulted in extensive shoreline damage. The storm waves imposed on the abnormally high lake levels compounded the extent and intensity of the damage incurred by shore property owners.
Northeast winds can have a major impact on Lake Erie shorelines, as evidenced by the storm of November 1972. Reaching velocities of over 50 kilometres per hour over shallow offshore areas, they inflicted severe damage to the shoreline.
Lake St. Clair, with a highly developed southern shoreline, is vulnerable to any winds from the north, and wave set-up is encouraged by the lake's shallow bathymetry. Northerly winds of long duration with peak velocities of 58 kilometres per hour caused considerable damage to shore property during the storm of November 13-15, 1972.
On Lake Huron, major storms were recorded on November 13 and 14, 1972, and during March and early April 1973. Constant, high velocity winds from the north and northwest maintained strong wave action along the shoreline, causing heavy damage in the area between Sarnia and the town of Bayfield. Shoreline damage did not prove to be severe in the Georgian Bay area.
A major storm occurred on Lake Ontario on April 10 and 11, 1973. In a matter of hours, strong winds from the northeast raised the water level at the west end of the lake by 0.76 metres above the mean level. Storms that occurred on Lake Erie in March and April also proved destructive. A storm on Lake St. Clair occurred on March 17 and 18, 1973, with floodwaters reaching areas inland, adding to the damage inflicted upon the shoreline itself.
1985-1987
Precipitation over the entire Great Lakes basin between November 1984 and April 1985 was 20% above average, and from May to December 1985, it was 27% above average. The 1985 spring runoff was 20% to 65% above normal, the highest in 20 years. The result was record high levels recorded on all lakes, except Lake Ontario, at some point during 1985. The levels of Lake Ontario are moderated by the regulated flow of water down the St. Lawrence River.
On March 31 and April 6, 1985, storms lashed Lake Erie. Hardest hit were Point Pelee and Long Point. The storms destroyed cottages, washed out access roads, eroded beaches, uprooted trees and breached dykes. There has been no accurate assessment of damages, but Essex County has estimated damages to be $8.1 million ($9.9 million in 1998 dollars).
On December 2, 1985, a storm with winds gusting up to 100 kilometres per hour severely affected shorelines with western exposures. Erosion occurred on Lake Huron, minor flooding took place on Lake St. Clair, and on the eastern end of Lake Erie cottages were destroyed and damage was done to property and shore protection structures.
Some of the areas severely damaged in 1985 and 1986 were either former marshlands or adjacent to them. Many of the cottages sat on sand bars or barrier beaches that were overtopped.
In 1986, precipitation was equivalent to the long-term average over the entire basin; runoff was about 10% above average. Lake Superior had record high lake levels during the first five months of the year, then the levels dropped below record levels for the remainder of the year. Lakes Huron, St. Clair and Erie all set record highs as lake levels rose throughout the year as a result of the high outflows from the lakes above. Even Lake Ontario's level, which is regulated, was 0.3-0.5 metres above average.
No severe storms occurred during 1986. However, several storms caused damage. A January storm with 80 kilometre per hour winds from the west caused minor flooding and erosion on Lake Erie shores. A June storm caused generalized flooding on the St. Clair River. In August, a storm with winds of up to 55 kilometres per hour caused flooding and erosion at Wasaga Beach on Georgian Bay. An October storm with northwest winds resulted in extensive damage to property at Southampton, Sarnia, and Wasaga Beach, as well as flooding on the south shore of Lake St. Clair. Another storm in November caused extensive property damage along Lake Huron from Port Elgin to Oliphant and Georgian Bay from Wasaga to Midland.
The most severe flood damages along Lake St. Clair during this high lake level period occurred on April 4, 1987. Northerly winds of almost 60 kilometres per hour forced the evacuation of 50 people, and first floor flooding occurred in 100 homes. Precipitation was slightly below normal over the entire basin during 1987 and runoff was 36% below the average. Lake Superior's levels dropped throughout the year but were about average. Lake Huron also dropped during the year but remained above average. Lake Erie had record highs in January and February but dropped through the rest of the year. Lake Ontario's level was below average, since large amounts of water had been discharged down the St. Lawrence River in anticipation of a greater inflow than occurred.
This graph shows annual precipitation in the Great Lakes Basin from 1900 to 2000:

Source: Atmospheric Environment Branch, Environment Canada-Ontario Region.
See also: Anecdotes: Ontario
Return to Flooding Events in Canada menu
Next page: Flooding Events in Canada - Quebec