
Guidance on Natural Organic Matter in Drinking Water
Download the alternative format
(PDF format, 808 KB, 73 pages)
Organization: Health Canada
Published: 2019-03-15
Document for Public Consultation
Consultation period ends May 21, 2019
Table of Contents
- Purpose of consultation
- Executive summary
- Part A. Guidance on natural organic matter in drinking water
- Part B. Supporting information
- B.1 Description of natural organic matter
- B.2 Sources and occurrence of natural organic matter
- B.3 Environmental considerations
- B.4 Impact of natural organic matter
- B.5 Measurement and characterization
- B.6 Treatment and distribution system considerations
- B.7 Monitoring and treated water quality targets
- B.8 International considerations
- Part C. References, acronyms and tables
- C.1 References
- C.2 Acronyms
- C.3 Tables
- Table C-3.1: Factors influencing allochthonous natural organic matter concentration and character
- Table C-3.2: Dissolved organic carbon data from Environment Canada (2000–2015)
- Table C-3.3: Spatial and temporal variation in NOM fractions for select Canadian water sources
- Table C-3.4: Conversion chart for UV transmittance and UV absorbance
- Table C-3.5: Suggested parameters to monitor
Guidance on Natural Organic Matter in Drinking Water
Purpose of consultation
The available information on natural organic matter in drinking water has been assessed with the intent of establishing a guidance document.
The document is being made available for a 60-day public consultation period. The purpose of this consultation is to solicit comments on this guidance document. Comments are appreciated, with accompanying rationale, where required. Comments can be sent to Health Canada via email at HC.water-eau.SC@canada.ca. If this is not feasible, comments may be sent by mail to the Water and Air Quality Bureau, Health Canada, 269 Laurier Avenue West, A.L. 4903D, Ottawa, Ontario K1A 0K9. All comments must be received before May 21, 2019.
Comments received as part of this consultation will be shared with members of the Federal-Provincial-Territorial Committee on Drinking Water (CDW), along with the name and affiliation of their author. Authors who do not want their name and affiliation to be shared with the CDW should provide a statement to this effect along with their comments.
It should be noted that this guidance document on natural organic matter in drinking water will be revised following an evaluation of the comments received, and the final document will be posted. This document should be considered as a draft for comment only.
Executive summary
Natural organic matter (NOM) is an extremely complex mixture of organic compounds and is found in all groundwater and surface waters. Although NOM has no direct impact on health, it affects the efficacy of drinking water treatment processes and consequently the safety of drinking water. NOM may also affect consumer satisfaction because it can contribute to undesirable colour, tastes and odours in drinking water.
Health Canada completed its review of NOM in drinking water and the impact that it can have on drinking water treatment processes. This guidance document reviews and assesses risks associated with the impact of NOM on drinking water treatment processes and the safety of drinking water.
This document, for public consultation, was developed in collaboration with the Federal-Provincial-Territorial Committee on Drinking Water.
Assessment
The health effects of NOM are due to its impact on drinking water treatment processes that are aimed to protect drinking water quality and public health. NOM can interfere with processes designed to remove or inactivate pathogens, contribute to the formation of disinfection by-products and favour the development of biofilms in the distribution system. It may also increase lead and/or copper concentrations in treated water.
The treatability and reactivity of NOM vary significantly in Canada, as each water source has unique features. Because NOM consists of numerous organic compounds, it cannot be measured directly. However, there are a number of other parameters that can be used to provide an indication of the concentration and character (i.e., chemical, physical and biodegradability properties) of NOM. It is important to understand variations in NOM concentrations and character in order to select, design and operate appropriate water treatment processes.
No practical health-based value can currently be derived for NOM in drinking water. The development of an effective NOM control strategy needs to be based on a good understanding of variations in the concentration and character of NOM in the source water, NOM’s impact on water treatment processes for the full range of water quality conditions and its potential impacts on water quality in the distribution system. Source-specific treatability studies are needed to determine the most effective treatment option(s) to remove NOM, decrease its reactivity to form disinfection by-products, reduce its potential to contribute to corrosion, and produce biologically stable water for distribution.
The intent of this document is to provide provinces, territories, other government departments and stakeholders (such as water system owners, consultants, equipment suppliers and laboratories) with guidance on the impacts of NOM on the overall quality of drinking water, including its potential effects on drinking water treatment processes and consequently on the safety of drinking water. It summarizes the factors that affect the concentration and character of NOM and discusses the points to consider when developing a NOM control strategy. It also provides specific guidance on treatment, monitoring, and water quality goals.
International considerations
Drinking water guidelines, standards and/or guidance from other national and international organizations may vary due to the date of the assessments as well as differing policies and approaches.
International organizations have not established numerical limits for NOM in drinking water. The U.S. Environmental Protection Agency’s rule for disinfectants and disinfection by-products requires removal of total organic carbon (TOC) by surface water facilities using conventional or lime softening water treatment with levels of TOC above 2 mg/L in their source water. The World Health Organization suggests optimized NOM removal as a means to minimize biofilm growth in the distribution system. The European Union regulations include TOC as a general water quality indicator. In Australia, guidance has been developed for water utilities to help them understand and control the impact of NOM.
Part A. Guidance on natural organic matter in drinking water
A.1 Introduction
Natural organic matter (NOM) is an extremely complex mixture of organic compounds that vary greatly in terms of their physical and chemical characteristics. NOM occurs naturally in the environment and may also be the result of human activities. NOM is found in particulate, colloidal and dissolved forms in all ground and surface waters, as well as in rainwater. While exposure to NOM in the environment is commonplace and is not associated with direct health effects, the presence and characteristics of NOM will have significant impacts on drinking water treatment processes aimed at protecting public health. NOM plays a critical role in drinking water treatment for a number of reasons:
First and foremost, NOM can contribute to indirect health impacts, including:
- a deterioration of pathogen log removal capability due to increased coagulant demand, which can lead to suboptimal coagulation conditions;
- a deterioration of pathogen log inactivation capability due to chemical disinfectant demand or interference with ultraviolet (UV) disinfection;
- the formation of disinfection by-products (DBPs);
- the development of distribution system biofilms that can harbour pathogens; and
- potential increases in lead and/or copper concentrations as a result of corrosion of lead- and/or copper-bearing materials (e.g., piping, fittings).
Water utilities can also be significantly impacted by a number of NOM-caused operational issues, namely:
- increased coagulant dose;
- poor floc formation or settling;
- shorter filter run times;
- more frequent backwashes;
- increased sludge production;
- reduced hydraulic capacity;
- membrane fouling, higher transmembrane pressure and energy consumption, more frequent chemical cleaning and shorter membrane life; and
- reduced effectiveness of adsorption and ion exchange processes.
Lastly, NOM can lead to an increase in consumer complaints because it can contribute to undesirable colour, tastes and odours in drinking water. These and other problems are further discussed in subsequent sections of this document.
A.2 Application
All water utilities should implement a risk management approach, such as the source-to-tap or water safety plan approach, to ensure water safety. These approaches require a system assessment that involves characterizing the water source, describing the treatment barriers that prevent or reduce contamination, highlighting the conditions that can result in contamination, and identifying control measures. Operational monitoring is then established and operational/ management protocols are instituted (e.g., standard operating procedures, corrective actions and incident responses). Compliance monitoring is determined and other protocols to validate the water safety plan are implemented (e.g., record keeping, consumer satisfaction). Operator training is also required to ensure the effectiveness of the water safety plan at all times.
A.2.1 Source-specific treatability study
Source-specific treatability studies are recommended to determine the most effective treatment option(s) to adequately remove NOM and to meet water quality goals related to microbial protection, DBPs, biological stability and corrosion control. The treatability study should assess seasonal variations in NOM and include DBP formation potential tests that are representative of distribution system conditions. As water utilities should aim to minimize DBP, lead and copper concentrations and to control biofilm formation in the distribution system, the goal of the NOM control strategy should be to reduce NOM concentrations to as low as reasonably achievable. Multiple treatment processes may be needed to adequately remove NOM at all times of the year.
A.2.2 Monitoring
The concentration and character of NOM should be monitored in raw, treated and distribution system water to ensure that:
- treatment is optimized for NOM and turbidity removal;
- DBP, lead and copper concentrations are as low as reasonably achievable; and
- biofilm formation is minimized.
A source-specific monitoring plan should be developed to ensure that water utilities are aware of:
- raw water quality changes with respect to NOM concentration and character;
- the impact that NOM has on water treatment processes through all water quality conditions;
- the impact that treatment has on NOM concentration and character; and
- the impacts on distribution water quality.
The monitoring plan should be comprehensive and include source characterization, operational and compliance monitoring; it should also demonstrate that water quality goals are consistently met for microbial protection, DBPs, biological stability and corrosion control. Ideally, continuous online monitoring should be used for highly variable sources (i.e., those that fluctuate with precipitation/snowmelt events) and critical processes (e.g., coagulation).
A.2.2.1 Source water assessments
Source water assessments should be part of routine system assessments. They should include an understanding of NOM sources in the watershed/aquifer, the conditions that lead to changes in the concentration and/or character of NOM (e.g., precipitation/snowmelt events, algal blooms, drought, fire), and the factors that enhance the reactivity of NOM to form DBPs (e.g., reaction conditions, water age, and inorganic compounds such as ammonia, bromide, iodide, and sulphur).
NOM concentration and character, and therefore its treatability and reactivity, can vary significantly with time and location, due to the unique hydrologic and biogeochemical processes associated with each individual water source. The concentration and character of NOM should be assessed for normal conditions, as well as for snowmelt/precipitation events, algal blooms and other events that can trigger a change in NOM character (e.g., drought, fire). Subsurface sources should also be characterized with regard to NOM and inorganic compounds that can enhance the reactivity of NOM (i.e., ammonia, bromide, iodide, sulphur). The frequency of source water characterization monitoring will depend on the variability of the source; highly variable sources should be monitored more frequently.
A.2.2.2 Treatment and operational monitoring
The concentration and/or character of NOM can have a significant influence on the selection, design and operation of water treatment processes. In order to determine the most appropriate treatment processes, water utilities should have knowledge about:
- the origin, occurrence and fluctuations in NOM;
- interactions between NOM and other water constituents (e.g., enhanced reactivity due to bromide);
- interactions with chemicals used during treatment (e.g., NOM creates a disinfectant and coagulant demand that must be overcome to produce microbiologically safe drinking water);
- interactions between NOM and unit processes (e.g., NOM fouls adsorbents and membranes); and
- its impacts on distribution system water quality.
The appropriate type and level of treatment should take into account source-specific fluctuations in water quality, including seasonal and/or short-term degradation, variability in treatment performance and distribution system conditions.
Ongoing operational monitoring and treatment optimization will help ensure that water utilities achieve water quality goals related to microbial protection, DBPs, biological stability and corrosion control, and that they maximize public health protection for the full range of water quality conditions. Maintaining current knowledge of best practices and remaining aware of advancements in the drinking water industry are important aspects of the source-to-tap or water safety plan approach to ensure water safety.
A.2.2.3 Distribution system
Biodegradable organic matter (BOM) encourages biofilm growth in the distribution system. Biofilms can provide a habitat for the survival of pathogens that may have passed through drinking water treatment barriers or entered the distribution system directly via an integrity breach. The most important elements for controlling the growth of bacteria in distribution systems are maintenance of a disinfectant residual, limitation of BOM, and corrosion control. Maintaining the physical/hydraulic integrity of the distribution system and minimizing negative- or low-pressure events are other key components of a source-to-tap or water safety plan approach.
Distribution system water quality should be regularly monitored, including biological stability indicators (e.g., variability of chlorine residual, biofilm formation rate, corrosion rate). Operations/maintenance programs should also be in place (e.g., water age control, water main cleaning, cross-connection control, asset management) and strict hygiene should be practiced during all water main construction (e.g., repair, maintenance, new installation) to ensure drinking water is transported to the consumer with minimal loss of quality.
Part B. Supporting information
B.1 Description of natural organic matter
NOM is an extremely complex mixture of organic compounds varying in polarity, acidity, charge density, molecular mass and biodegradability (i.e., labile, semi-labile, recalcitrant or refractory). Because NOM comprises numerous organic compounds, it is categorized based on its polarity (i.e., hydrophobic or hydrophilic) and acid/neutral/base properties. This approach results in six NOM fractions, as outlined in Table 1. Compound classes within these fractions have also been identified. Compound classes provide the highest level of specificity possible, due to the number of compounds that can be present (Minor et al., 2014).
Depending on the size and shape of NOM, which is influenced by the pH and ionic strength of the water (Ghosh and Schnitzer, 1980), some compounds can exhibit both hydrophobic and hydrophilic properties (i.e., amphipathic) (Leenheer and Croué, 2003) and possess both negative- and positive-charged functional groups (i.e., amphoteric) (Her et al., 2007; Amy, 2008). Fractions containing polysaccharides, proteins and amino sugars have the highest molecular weights (>10 kDa), whereas the molecular weights of humic and fulvic acids typically range from 2 kDa to 5 kDa and from 0.5 kDa to 2 kDa, respectively (Bond et al., 2012; Sillanpää et al., 2015a). Lignin and tannin derivatives are also abundant in the high to medium molecular weight fractions. The smallest NOM fractions (<0.5 kDa) tend to be hydrophilic compounds (Sillanpää et al., 2015a). The most biodegradable fractions include carbohydrates, amino acids and proteins while the most recalcitrant comprise lignins, tannins and terpenoids.
| Fraction | Compound classes |
|---|---|
| Hydrophobic | |
| Strong acids | Humic and fulvic acids, high molecular weight alkyl monocarboxylic and dicarboxylic acids, aromatic acids |
| Weak acids | Phenols (e.g., lignin), tannins, medium molecular weight alkyl monocarboxylic and dicarboxylic acids |
| Bases | Proteins, aromatic amines, high molecular weight alkyl amines |
| Neutrals | Hydrocarbons (e.g., terpenoids), aldehydes, high molecular weight methyl ketones and alkyl alcohols, ethers, furans, pyrrols |
| Hydrophilic | |
| Acids | Hydroxyl acids, sugars, sulphonics, low molecular weight alkyl monocarboxylic and dicarboxylic acids |
| Bases | Amino acids, purines, pyrimidines, low molecular weight alkyl amines |
| Neutrals | Proteins, carbohydrates (e.g., polysaccharides, low molecular weight alkyl alcohols, aldehydes and ketones), cellulose and cellulose derivatives |
|
|
B.2 Sources and occurrence of natural organic matter
The concentration and character (i.e., chemical, physical and biodegradability properties) of NOM can be highly variable because of the numerous hydrological and biogeochemical processes that affect the sources of NOM (Aiken and Cotsaris, 1995). As carbon is the key constituent of NOM, particulate, dissolved, and total organic carbon (POC, DOC and TOC) have historically been considered quantitative measures of particulate, dissolved and total organic matter, respectively. In most water sources, DOC accounts for greater than 90% of TOC (Thurman, 1985). DOC (i.e., colloidal and dissolved NOM) tends to be the most problematic component of NOM for water treatment (Karanfil et al., 2005). Colour has also been used in the past as a measure of humic and fulvic acids. Other parameters that can be used to measure and characterize NOM are discussed later in this document.
B.2.1 Sources
There are two natural sources of NOM: allochthonous (i.e., derived from the terrestrial ecosystem) and autochthonous (i.e., derived from the plants and microorganisms growing in the water body) (Aiken and Cotsaris, 1995). Anthropogenic (human) activities can also contribute to NOM.
Allochthonous NOM is exported to aquatic environments as precipitation moves through the atmosphere and vegetative canopy, infiltrates organic soil layers and percolates downward through mineral soil layers (Aitkenhead-Peterson et al., 2003). Soil humus, plant litter, microbial biomass and root exudates contribute to allochthonous NOM (Kalbitz et al., 2000). Aitkenhead-Peterson et al. (2003) estimated the relative contribution of allochthonous NOM as 88% from organic soil layers, 7% from plant litter and 1.5% from root exudates and decay. As a result, the presence or absence of organic soil layers can have a significant impact on DOC concentrations (Kerekes et al., 1982). Allochthonous NOM tends to be hydrophobic in nature. These and other factors that influence the concentration and character of allochthonous NOM are described in Table C-3.1 of this document.
Autochthonous NOM is derived from phytoplankton, algae, cyanobacteria and macrophytes (i.e., plants attached to or rooted in the substrata of lakes and streams) and can account for 5–100% of the DOC concentration, depending on certain conditions (Bertilsson and Jones, 2003; Wetzel, 2003; Bade et al., 2007; Tomlinson et al., 2016). When allochthonous inputs are high, such as in coloured water sources or during precipitation/snowmelt events (i.e., stormflow conditions), the proportion of autochthonous NOM tends to be low. Conversely, when allochthonous inputs are low, such as in clear water sources or during dry periods when there is little runoff, the proportion of autochthonous NOM tends to be high. Autochthonous NOM encompasses a wide range of compounds: mono- and polysaccharides, amino acids, peptides, proteins, nucleic acids, organic acids, lipids and fatty acids (Pivokonsky et al., 2006; Henderson et al., 2008). DOC is generated by the production and decomposition of the microbial and plant biomass within water sources (Nguyen et al., 2002; Zhou et al., 2014). Algal inputs tend to dominate in large lakes, whereas macrophytes tend to be the major contributor in small lakes (Wetzel, 1992; Bertilsson and Jones, 2003). Algal and cyanobacterial blooms, in particular, represent a source of DOC that can be periodic and intense. Cyanobacterial blooms may be associated with additional water quality issues due to the potential presence of cyanobacterial toxins. Autochthonous NOM tends to be hydrophilic in nature and nitrogen-rich.
Anthropogenic sources of NOM include septic systems, wastewater treatment and stormwater discharges, agricultural runoff and industrial discharges. Anthropogenic NOM is reported to be hydrophilic in nature (Imai et al., 2001) and nitrogen-rich (Dotson and Westerhoff, 2009; Mitch et al., 2009). Watersheds heavily impacted by anthropogenic sources may observe a decrease in TOC or DOC after the improvement of wastewater or stormwater treatment (Reckhow et al., 2007).
Raw water NOM concentrations represent the net effect of hydrological and biogeochemical processes in the watershed or aquifer (Eckhardt and Moore, 1990). The concentration and character of NOM, and therefore its treatability (i.e., potential to be removed) and reactivity (i.e., potential to form DBPs), vary significantly from one source to another because each water source has unique features. For example, Kerekes et al. (1982) reported that two lakes in Nova Scotia only 1 km apart had TOC concentrations of 5.6 and 17.2 mg/L, respectively. In the low TOC lake, the retention time was 1.27 years and organic soils were absent, whereas in the high TOC lake, the retention time was 0.35 years and organic soils were present. As noted above, organic soil layers contribute approximately 88% of allochthonous NOM; hence their presence or absence can significantly impact organic carbon concentrations (Aitkenhead-Peterson et al., 2003). In addition, longer retention times tend to lower the DOC concentration, as noted in Table C-3.1. However, Curtis and Adams (1995) reported that the evapoconcentration of refractory NOM resulted in increased DOC concentrations with retention time in the sub-humid and semi-arid zones of Alberta. Other researchers have reported similar findings regarding the variability and uniqueness of NOM for sources in close proximity to each other (Aiken and Cotsaris, 1995; Ågren et al., 2007; Reckhow et al., 2007; Goss and Gorczyca, 2013; Kent et al., 2014).
NOM concentrations are typically lower in groundwater sources because the organic matter is subjected to adsorption and microbial degradation processes as it is transported through the soil (Aiken and Cotsaris, 1995; Aitkenhead-Peterson et al., 2003). However, these processes are limited by the amount of biodegradable NOM that is present. The remaining NOM tends to be more hydrophilic and recalcitrant in nature (Diem et al., 2013) and almost as reactive as surface water NOM on a mg/L DOC basis (Owen et al., 1995; Reckhow et al., 2007; Tubić et al., 2013).
In summary, localized conditions play a very significant role in establishing the concentration and character of NOM (Bourbonniere, 1989; Mulholland, 2003; Reckhow et al., 2007; Sillanpää, 2015). Occurrence data presented below highlight the variability that can occur, with or without an associated change in DOC concentration. The data also show that although groundwater tends to have lower NOM concentrations, some sources can have elevated concentrations.
B.2.2 Occurrence
The concentration and character (i.e., chemical, physical and biodegradability properties) of NOM can be highly variable because of the numerous hydrological and biogeochemical processes that export, generate or degrade NOM, as described in Table C-3.1.
B.2.2.1 Concentration
Monitoring data from the provinces and territories for TOC and colour in raw water (Table 2) show the variability in NOM concentrations that can occur spatially and demonstrate that TOC concentrations and colour tend to be lower in groundwater (although some groundwater sources can have elevated concentrations). Table 3 presents the DOC monitoring data collected in 2009 and 2010 from select drinking water sources in Canada (Health Canada, 2016a). These data also demonstrate lower DOC concentrations in groundwater with minimal change between raw and treated water concentrations. For the surveyed surface water supplies, average treated water DOC ranges from 3.2–3.4 mg/L in summer and 2.8–3.5 mg/L in winter. Table C-3.2 presents Environment Canada’s long-term DOC monitoring data (2000–2015) for select regions or river basins across Canada (Environment Canada, 2017). These data also demonstrate that there is significant variability in NOM concentrations spatially. As localized conditions play a very significant role in establishing the concentration and character of NOM, it is important that each individual source be adequately monitored to capture the full range of conditions that can be encountered over the year.
| Jurisdiction | TOC (mg/L) |
Colour (TCU/ACU/CU)Footnote c |
|||
|---|---|---|---|---|---|
| Ground | Surface | Ground | Surface | ||
| Newfoundland and LabradorFootnote a (MDLFootnote b = 0.5 mg/L) (MDL = 2 TCU) |
No. detects/samples | 322/350 | 833/833 | 204/350 | 832/833 |
| Median | 1.2 | 6.5 | 6.0 | 43.0 | |
| Mean | 2.0 | 7.0 | 14.3 | 53.5 | |
| 90th percentile | 4.3 | 11.4 | 35.0 | 107.0 | |
| Nova Scotia (MDL = 0.5 mg/L) (MDL = 5 TCU) |
No. detects/samples | 53/126 | 136/140 | 50/152 | 142/149 |
| Median | 1.2 | 4.6 | 7.4 | 27.5 | |
| Mean | 2.3 | 5.8 | 11.7 | 43.5 | |
| 90th percentile | 6.7 | 10.9 | 22.0 | 86.7 | |
| New Brunswick (MDL = 0.2–1.0 mg/L) (MDL = 1-5 TCU/ACU) |
No. detects/samples | 893/1,389 | 324/324 | 231/539 | 65/67 |
| Median | 2.0 | 4.8 | 14.2 | 37.0 | |
| Mean | 2.1 | 4.8 | 16.0 | 40.5 | |
| 90th percentile | 3.4 | 6.0 | 28.3 | 60.5 | |
| Quebec (MDL = 0.2 mg/L) (MDL = 1 TCU) |
No. detects/samples | 129/129 | 91/91 | No data provided | 5/5 |
| Median | 2.8 | 6.0 | 52.0 | ||
| Mean | 3.1 | 6.2 | 53.2 | ||
| 90th percentile | 5.1 | 9.7 | 66.0 | ||
| Manitoba (MDL = 0.5–1.0 mg/L) (MDL = 5 CU) |
No. detects/samples | 564/723 | 456/458 | 225/721 | 433/458 |
| Median | 2.9 | 10.9 | 10.0 | 26.2 | |
| Mean | 4.0 | 11.6 | 14.0 | 31.5 | |
| 90th percentile | 8.2 | 16.2 | 30.0 | 60.0 | |
|
|||||
| Source Type | Sample Type | Summer DOC (mg/L)Footnote a | Winter DOC (mg/L)Footnote a | ||||||
|---|---|---|---|---|---|---|---|---|---|
| n | Median | Mean | 90th Percentile |
n | Median | Mean | 90th Percentile |
||
| Well | Raw | 18 | 0.7 | 1.8 | 4.0 | 16 | 0.7 | 2.0 | 4.4 |
| Treated | 17 | 0.8 | 1.6 | 4.3 | 15 | 0.8 | 1.7 | 4.5 | |
| Lake | Raw | 21 | 4.0 | 7.3 | 11.5 | 20 | 4.6 | 6.6 | 9.7 |
| Treated | 21 | 2.8 | 3.2 | 5.2 | 20 | 2.4 | 3.5 | 5.6 | |
| River | Raw | 26 | 5.9 | 7.2 | 14.2 | 21 | 4.7 | 5.8 | 10.0 |
| Treated | 26 | 2.6 | 3.4 | 6.0 | 21 | 2.6 | 2.8 | 5.4 | |
|
|||||||||
B.2.2.2 Character
A number of studies have characterized the NOM fractions found in several Canadian source waters (Montreuil, 2011; Newfoundland and Labrador Department of Environment and Conservation, 2011; Lamsal et al., 2012; Goss and Gorczyca, 2013). These studies are summarized in Table C-3.3. Montreuil (2011) studied a lake source in Nova Scotia and observed significant temporal variability in the six NOM fractions while DOC concentrations remained low with minimal change. Goss and Gorczyna (2013) studied a river source in Manitoba and also observed significant temporal variability in NOM fractions but with fluctuations in DOC concentrations. The other two studies demonstrate that NOM character can vary significantly by location.
The results of these fractionation studies demonstrate the variability that can occur in NOM character—with or without an associated change in DOC concentration. In addition, the results indicate that the hydrophilic neutral fraction can, at times, comprise a significant portion of NOM. This fraction can be particularly problematic, as discussed in subsequent sections.
NOM can also be fractionated according to its size, as outlined in section B.5.2.4. The biodegradability properties of NOM are discussed in detail in subsequent sections.
B.3 Environmental considerations
Environmental factors may change the NOM concentration and/or the relative contribution of allochthonous, autochthonous or anthropogenic inputs and thereby change its character. These changes can impact water sources and water treatment processes, as discussed below.
B.3.1 Seasonal or weather-related effects
A number of researchers have reported an increase in NOM concentration and a change in its character following snowmelt, spring runoff or heavy rain (Gregory, 1998; Billica and Gertig, 2000; Tseng et al., 2000; Goslan et al., 2002; Volk et al., 2002; Eikebrokk et al., 2004; Fearing et al., 2004a, 2004b; Hurst et al., 2004; Chow et al., 2006; Sharp et al., 2006; Parsons et al., 2007; Reckhow et al., 2007; Kraus et al., 2010; Carpenter et al., 2013; Kundert, 2014; McVicar et al., 2015; James et al., 2016). DOC concentrations can rapidly increase four- to five-fold during precipitation/snowmelt events that flush terrestrial NOM into a water body (Thurman, 1985; Saraceno et al., 2009). The highest concentrations can occur in the summer and autumn when temperatures are warmer, biological activity is high and high-intensity/short-duration rainstorms are frequent (Aitkenhead-Peterson et al., 2003).
Precipitation and snowmelt events can significantly impair the coagulation process for a number of reasons. First, water quality changes occur during stormflow conditions that create challenging coagulation conditions (e.g., pH, alkalinity, ionic strength, divalent ion concentration) (Gregory, 1998; Billica and Gertig, 2000; Tseng et al., 2000; Davis and Edwards, 2014). Second, NOM has been observed to increase prior to changes in turbidity or flow and can remain elevated after turbidity and flow have returned to baseline conditions (Soulsby, 1995; Hurst et al., 2004; McVicar et al., 2015; James et al., 2016). Thus, if the coagulant dose is controlled based on flow or turbidity, coagulant may be under-dosed, leading to suboptimal coagulation conditions (Hurst et al., 2004; Parsons et al., 2007; Kundert, 2014; McVicar et al., 2015; James et al., 2016). It is well known that suboptimal coagulation conditions lead to a significant deterioration in pathogen log removal credits (Ongerth and Pecoraro, 1995; Patania et al., 1995; Edzwald and Kelley, 1998; Coffey et al., 1999; Emelko et al., 1999; Dugan et al., 2001; Harrington et al., 2001; Huck et al., 2001, 2002; Dai and Hozalski, 2002; Betancourt and Rose, 2004; Hendricks et al., 2005; O’Melia, 2006; Hijnen and Medema, 2007). Rainstorms during winter or spring can be of particular concern, as low temperature can reduce the efficacy of the coagulation process (Hurst et al., 2004).
Several studies have reported the occurrence of waterborne disease outbreaks after extreme precipitation events. Curriero et al. (2001) evaluated the relationship between rainfall and waterborne disease in the United States and found that outbreaks were preceded by rainfall events above the 90th percentile of the monthly accumulated rainfall. Outbreaks due to surface water contamination were most significant for extreme precipitation during the month of the outbreak, whereas groundwater outbreaks showed the highest significance for extreme precipitation two months prior to the outbreak. In Canada, Thomas et al. (2006) reported that rainfall events above the 93rd percentile of the rolling 5-day average accumulated rainfall increased the risk of an outbreak by a factor of 2.3. A study in England determined that the risk of an outbreak was associated with two situations: low rainfall levels over the preceding 3 weeks, or excessive rainfall in the week prior to the outbreak (Nichols et al., 2009). Drayna et al. (2010) reported a significant association between rainfall and pediatric acute gastrointestinal illness emergency department visits for a community served by treated surface water; 4 days after rainfall, visits increased by 11%.
Reckhow et al. (2007) surveyed 249 surface water utilities in the United States serving a population of 50,000 or more to determine if storm events were monitored for water quality, flow or system response. A “no” response was provided by 60.6%, 66.2% and 82.4% of the water utilities, respectively, for these criteria. Pellerin et al. (2012) noted that a better understanding of NOM dynamics during storm events is necessary to understand the dominant drivers and effects it has on water treatment and drinking water quality.
B.3.2 Other environmental influences
An increase in DOC concentrations over the past several decades has been reported in North America (Driscoll et al., 2003; SanClements et al., 2012), the United Kingdom (Evans et al., 2005; Sharp et al., 2006; Worrall and Burt, 2009), northern Europe (Eikebrokk et al., 2004) and Japan (Imai et al., 2001). At sites where DOC has increased, waters have also often become more coloured (Ekström et al., 2011; Kritzberg and Ekström, 2012; Weyhenmeyer et al., 2014).
Pagano et al. (2014) conducted a comprehensive review of increasing DOC trends and noted that researchers suggest decreased atmospheric acid deposition (i.e., sulphur emission controls) and climate change agents as two key considerations. Monteith et al. (2007) reviewed data for North America, the United Kingdom and Europe and reported that declining acid deposition explained >85% of the increasing DOC trends, except in the United Kingdom and Newfoundland. In these regions, increasing sea salt deposition explained DOC declines in some areas. The authors found no trends between DOC and climate change agents (e.g., increasing temperature and atmospheric carbon dioxide concentration). Ekström et al. (2011) conducted plot-scale acidification experiments and confirmed that reduced acid deposition results in increased DOC and colour concentrations, implying an increase in NOM mobility with sulphur emission controls. With regard to colour, this trend has been linked to increasing iron concentrations (Kritzberg and Ekström, 2012) and iron complexing with DOC (Weyhenmeyer et al., 2014). However, the mechanisms are not completely understood. Black and Christman (1963) also found that iron was always present with colour but no relationship could be established between the iron content and colour.
Increasing DOC and/or colour concentrations can significantly impact water utilities using coagulation and filtration processes. Anderson et al. (2017) reported a four-fold increase in alum dose (i.e., 12.9 to 49.5 mg/L) and a 1.75-fold increase in lime use at a full-scale facility where colour increased from approximately 20 in 1990 to approximately 50 in 2015. The authors also reported that the plant hydraulic capacity was reduced by 26%. Parsons et al. (2007) reported that the average coagulant dose at full-scale facilities in the United Kingdom increased from approximately 40 mg/L in 1992–1997 to 70–100 mg/L in 1998–2002 due to increased colour. Eikebrokk et al. (2004) conducted pilot-scale studies and reported that a 75% increase in colour in low turbidity waters (<0.3 nephelometric turbidity unit [NTU]) increased the coagulant dose, sludge production, number of backwashes and residual TOC by 64%, 64%, 87%, and 26%, respectively. In addition, filter run times and hydraulic capacity were reduced by 47% and 10%, respectively. The authors also forecast increased chemical consumption for pH adjustment and increased biological growth in the distribution system due to higher residual organic carbon concentrations. Other researchers have noted that higher residual organic carbon concentrations contribute to increased DBP formation (Imai et al., 2001; Sharp et al., 2006).
A comprehensive review of the expected impacts of climate change on the treatability of NOM can be found elsewhere (Ritson et al., 2014). Arctic and sub-arctic regions are expected to respond differently from temperate regions (Pagano et al., 2014).
B.4 Impact of natural organic matter
Although NOM does not have direct health effects, it critically affects drinking water treatment and can contribute to indirect health impacts, as well as operational and aesthetic issues.
B.4.1 Indirect health impacts
B.4.1.1 Pathogen log reductions
Drinking water treatment typically comprises physical removal barriers (e.g., clarification, filtration) that are assigned pathogen “log removal” credits, and inactivation barriers (i.e., primary disinfection) that are assigned “log inactivation” credits. NOM critically impacts both.
For chemically assisted clarification/filtration processes, NOM exerts a coagulant demand that must be overcome before floc can form and, as a result, interferes with turbidity removal (Hall and Packham, 1965; Semmens and Field, 1980; Dempsey et al., 1984; Edwards and Amirtharajah, 1985; Amy et al., 1989; Edzwald and Van Benschoten, 1990; White et al., 1997; Shin et al., 2008). James et al. (2016) reported Cryptosporidium breakthrough and an increase in particle counts (2–5 μm, 5–10 μm and 10–15 μm) at a full-scale direct filtration treatment plant as a result of an increase in colour in the source water. McVicar (2014) reported coagulant under-dosing, by monitoring streaming current and UV absorbance at 254 nm (UV254), at a full-scale dissolved air flotation (DAF) treatment plant during three heavy rainstorms. Filter effluent turbidity also increased during these storms but remained below 0.244 NTU and 0.175 NTU for filters 1 and 2, respectively. Other researchers have reported the breakthrough of particles >2 μm at pilot-scale during periods of elevated TOC (Billica and Gertig, 2000; Carlson and Gregory, 2000). Several other studies (Ongerth and Pecoraro, 1995; Patania et al., 1995; Dugan et al., 2001; Huck et al., 2001) report that Cryptosporidium removal by clarification/filtration can significantly deteriorate during suboptimal coagulant conditions (e.g., treatment effectiveness decreased by 2.0 to 3.4 logs as compared with optimal conditions).
It is well known that NOM exerts a chemical oxidant demand (i.e., chlorine, chlorine dioxide, ozone) that must be overcome before pathogen log inactivation requirements can be met (AWWA, 2011a; MWH, 2012). As a result, disinfection is typically applied after treatment processes that remove NOM. This strategy helps to ensure efficient inactivation of pathogens and minimizes the formation of DBPs (see section B.4.1.2). Additional information on how NOM affects chemical oxidant demand, decay and disinfection is published elsewhere (Health Canada, 2009a, 2018a).
Several studies have examined the effect of particles on UV disinfection efficacy, and most have concluded that the UV dose–response of microorganisms is not affected by variations in turbidity up to 10 NTU (Christensen and Linden, 2002; Batch et al., 2004; Mamane-Gravetz and Linden, 2004; Passantino et al., 2004). However, the presence of humic acid particles and coagulants has been shown to significantly affect UV disinfection efficacy, with lower inactivation levels being achieved. Templeton et al. (2005, 2007) found that in unfiltered influent samples (range = 4.4–9.4 NTU), UV disinfection of bacteriophages in the presence of humic acid flocs was reduced by a statistically significant degree (≈0.5 log) as compared with particle-free water. Templeton et al. (2005) also found that UV-absorbing organic particles (i.e., NOM) shielded particle-associated bacteriophages from UV light, whereas inorganic kaolin clay particles (i.e., turbidity) did not. The extent of shielding is more likely to depend on the particle type (e.g., size, structure, chemical composition), the number of large particles (e.g., ≥25 µm), the level of pathogen aggregation with particulate matter and the desired inactivation level than on the turbidity level (Caron et al., 2007; Hargy and Landry, 2007; Templeton et al., 2008; Kollu and Örmeci, 2012). In addition, UV transmittance at a wavelength of 254 nm is affected by dissolved and particulate matter that inhibits the penetration of UV light through the water. In general, every 10% decrease in UV transmittance results in a 50% reduction in the UV dose (Hofmann, 2008). As a result, the flow through the UV reactor must be reduced, thereby increasing the number of reactors required to achieve pathogen log inactivation requirements. Pretreatment to remove NOM may be necessary to meet the manufacturer’s specification for minimum UV transmittance, in order to to achieve pathogen log inactivation requirements and ensure safe operation of the equipment.
It is important that water utilities understand the pathogen log reductions that can be achieved when operating under optimal conditions and the impact of short- and long-term treatment upsets (Hurst et al., 2004). The application of the “robustness index” suggested by Huck et al. (2001) provides a simple and practical means of identifying events and periods when the coagulation and clarification processes become unstable. Information on how to use quantitative microbial risk assessment (QMRA) to evaluate the robustness of physical removal and/or inactivation barriers is also available (Health Canada, 2018b).
B.4.1.2 Formation of disinfection by-products
Chemical disinfectants react with NOM to form potentially harmful DBPs (Rook, 1974; Stevens et al., 1976). After many years of research, it is generally accepted that all NOM fractions contribute to DBP formation, although some fractions form more DBPs than others (Hoehn et al., 1980; Croué et al., 1993; Owen et al., 1993, 1995; Martin-Mousset et al., 1997; Goslan et al., 2002; Liang and Singer, 2003; Hua and Reckhow, 2007a; Bond et al., 2014; Hua et al., 2014). It is also recognized that the formation pathways and reaction rates are different for trihalomethanes (THMs) and haloacetic acids (HAAs) (Reckhow and Singer, 1984; Liang and Singer, 2003; Hua and Reckhow, 2007a; Bond et al., 2012). For example, Plourde-Lescelleur et al. (2015) reported THM:HAA formation potential ratios of 0.66–3.35 for six Canadian surface water sources (test conditions = pH 8.0, residual chlorine 1.0 mg/L at 22°C for 24 h). Archer and Singer (2006a) reported that, as the hydrophilic fraction increases, THMs are preferentially produced over HAAs.
Other factors that affect DBP formation include water temperature, pH, disinfection conditions (i.e., disinfectant, dose, contact time, residual) and the presence of reactive species such as bromide, iodide, ammonia and sulphur (Liang and Singer, 2003; Ates et al., 2007; Hua and Reckhow, 2007b; Reckhow et al., 2007; Fabris et al., 2008; Kristiana et al., 2009). Bromide, in particular, has been shown to increase DBP formation rates three- to ten-fold (Symons et al., 1993; Westerhoff et al., 2004; Heeb et al., 2014). As a result, similar DOC concentrations can produce a wide range of DBP concentrations, depending on the character and reactivity of the NOM (Fabris et al., 2008). For example, Hua and Reckhow (2007a) reported that the reactivity of the raw water for Winnipeg, Manitoba, (DOC = 7.9 mg/L; bromide <10 µg/L) was approximately half that of Repentigny, Quebec, (DOC = 7.1 mg/L; bromide = 46 µg/L). In some cases, NOM is nitrogen-rich and contributes to the formation of nitrogenous DBPs (N-DBPs) (Leenheer and Croué, 2003; Mitch et al., 2009). Rain events can also transport DOC that is rich in precursors, resulting in elevated DBP concentrations (Goslan et al., 2002; Fearing et al., 2004a, 2004b; Reckhow et al., 2007; Kraus et al., 2010; Delpla and Rodriguez, 2016; Wright et al., 2016).
Bond et al. (2011, 2012) completed a comprehensive review of the literature and summarized the potential for various NOM components to form THMs, HAAs and N-DBPs, as outlined in Table 4. Reckhow et al. (2007) reported that tannin and lignin were significant precursors, representing 60% and 25–30% of the THM formation potential, respectively. The authors also suggested that proteins could be important precursors during early stages of NOM formation, but these would biodegrade (see section B.4.1.3) and terpenoids would take their place as another important source of THM precursors.
| Precursor | Potential for removal by coagulation | Formation potential | ||
|---|---|---|---|---|
| THMs | HAAs | N-DBPs | ||
| Humic and fulvic acids | High | Primary source | Primary source | Possibly important for halonitromethanes |
| Carboxylic acids | Medium | β-dicarbonyl species important precursors | β-dicarbonyl species important precursors | Probably minor |
| Amino acids | Low | Low except for two compoundsFootnote b | Important for some compoundsFootnote c | Significant |
| Proteins | Low | Variable; important during algal blooms | Not known; may be significant | Uncertain |
| Carbohydrates | Low | Important at pH 8 | Probably minor | Insignificant |
|
||||
It is important that water utilities understand the source-specific reactivity of NOM when selecting a disinfectant, in order to mitigate the formation of potentially harmful DBPs (Hua and Reckhow, 2007a). Determining the specific DBP yield (i.e., μg DBP/mg DOC) can help, because DOC removal is generally easier to achieve than a decrease in reactivity, particularly when bromide is present (Croué et al., 1993; Goslan et al., 2002; Reckhow et al., 2007; Fabris et al., 2008; Tubić et al., 2013). Different mitigative measures may be necessary to minimize one group of DBPs compared with another, depending on NOM reactivity; technologies targeting the removal of specific NOM fractions may be necessary (Bond et al., 2011). In addition, Kastl et al. (2016) reported that NOM removal requirements should be linked to distribution system conditions. For example, a distribution system with a residence time of 7 days and temperature of >15°C will require a different level of NOM removal to meet DBP guidelines than one with a residence time of 3 days and temperature of >4°C (Rodriguez and Sérodes, 2001; Kastl et al., 2016).
Source-specific treatability studies, including DBP formation potential tests, should be conducted when evaluating different mitigative measures and/or alternative treatment options. To ensure that an effective NOM control strategy is implemented, the treatability study should be specifically designed to: 1) assess seasonal variations in NOM; and 2) be representative of distribution system conditions. It is important to note that the guideline technical documents for THMs and HAAs specify that water utilities should make every effort to maintain concentrations as low as reasonably achievable. Hence, the aim of the NOM control strategy should be to reduce precursor concentrations to as low as reasonably achievable. It is critical that efforts made to minimize DBP formation not compromise the effectiveness of disinfection. More information can be obtained from the appropriate guideline technical documents for THMs, HAAs, chlorite/chlorate, N-nitrosodimethylamine and bromate (Health Canada, 2006, 2008a, 2008b, 2011, 2018a).
B.4.1.3 Biological stability
The biological stability of drinking water refers to the concept of maintaining microbiological water quality from the point of production to the point of consumption (Prest et al., 2016). Heterotrophic organisms make up the majority of bacteria in drinking water and draw their energy for growth, multiplication and production of biofilm matrix materials from the degradation of organic carbon compounds (Vu et al., 2009; Prest et al., 2016). BOM encourages bacterial growth and biofilm development in the distribution system and premise plumbing, which can lead to issues that have public health significance. Biofilms provide a habitat for the survival of faecal pathogens that may have passed through drinking water treatment barriers or entered the distribution system directly via an integrity breach (Leclerc, 2003). It has been shown that enteric viruses and protozoa can be detected in biofilms (Howe et al., 2002; LeChevallier, 2003; Chang and Jung, 2004); although these organisms cannot grow in this environment, they can accumulate and be released over an extended period of time (Howe et al., 2002; Warnecke, 2006; Wingender and Flemming, 2011). Additionally, opportunistic premise plumbing pathogens (OPPPs) such as Legionella pneumophila and non-tuberculous mycobacteria (e.g., M. avium, M. intracellulare) have adapted to grow and persist in distribution and plumbing system biofilms. Biofilms can also create difficulties with maintaining adequate disinfectant residuals and can be involved in nitrification in distribution systems where chloramine is used (Wilczak, 2006).
While biofilm microorganisms utilize the constituents with the shortest biodegradation half-lives first, they are adept at consuming all types of available NOM constituents leaving a treatment facility to support their growth in the distribution system (Fischer, 2003; Camper, 2014). Table 5 summarizes the biodegradation half-life for NOM constituents (Reckhow et al., 2007).
Treatment processes also significantly impact the composition and concentration of organic nutrients. For example, oxidants such as chlorine and ozone produce biodegradable products upon reaction with NOM (Alarcon-Herrera et al., 1993; Bursill, 2001; Reckhow et al., 2007). It is well known that ozone transforms NOM to BOM (Owen et al., 1993, 1995); thus biologically active filtration may be necessary to stabilize treated water (GLUMRB, 2012). Chlorine can also react with organic matter thereby increasing the amounts of assimilable organic carbon (AOC) and biodegradable DOC (BDOC) which can exacerbate the problem of biofilm growth in distribution systems (Drikas et al., 2003; Reckhow et al., 2007; Croft, 2012; Camper, 2014).
| Constituent | Biodegradation half-life(days) |
|---|---|
| Sugars and starches | 2 |
| Proteins | 8 |
| Hemicellulose | 25 |
| Cellulose | 40 |
| Lipids (e.g., fats and waxes) | 60 |
| Lignins | 150 |
| Tannins | 200 |
| Terpenoids (e.g., geosmin and 2-methylisoborneol) | 400 |
|
|
Limited publications have measured this aspect, and the numerical values reported have varied from site to site (Camper, 2014). LeChevallier et al. (1992) observed AOC increases of 20% and 44% when samples of GAC-sand filter effluent were treated with 1 mg/L free chlorine or 2 mg/L monochloramine for 30 min, respectively. Zacheus et al. (2001) reported biomass production values for 16 full-scale distribution systems in Finland. The mean production was found to increase from 0.22 ng carbon/L/h in water leaving the treatment facilities to 1.0 ng carbon/L/h in the distribution system. Liu et al. (2002) noted that variations of AOC in distribution systems were affected by chlorine oxidation (increase in AOC) and bacterial activity (decrease in AOC). Different patterns were observed in different distribution systems and by season. In one system, a 120% increase in AOC concentrations was observed from the treatment plant to the end of the distribution system during December, whereas a 35% decrease in AOC concentrations was observed across the same sites in the spring of the following year (Liu et al., 2002).
In drinking water supplies in North America, minimum disinfectant residuals are typically recommended to control biofilm growth (LeChevallier et al., 1996; LeChevallier and Au, 2004). In some European countries, the approach taken to achieve biological stability is through the reduction of growth-supporting nutrients in water (Lautenschlager et al., 2013). In the Netherlands, water supply companies aim at limiting regrowth in distributed water in the absence of a disinfectant residual by meeting stringent targets for AOC (10 μg/L) (Lautenschlager et al., 2013). Levels of BOM (e.g., AOC, BDOC) are an important factor in the biostability of potable water supplies but are only one component influencing changes in water quality (Prest et al., 2016). Other compounds have been identified as having roles in controlling microbial growth in the distribution system: phosphorus, ammonia, manganese, iron and humic substances (Camper, 2004; Prest et al., 2016).
Multiple factors affect the biostability of distributed water: type and concentration of organic and inorganic nutrients, type and concentration of residual disinfectant, biofilms and sediments, and distribution system conditions (e.g., disinfectant residual decay, water temperature, residence time, hydraulic conditions, pipe material and diameter, pH, corrosion rate) (LeChevallier et al., 2015a; Prest et al., 2016).
Comprehensive reviews of biological stability can be found elsewhere (Prévost et al., 2005; van der Kooij and van der Wielen, 2014; LeChevallier et al., 2015a, 2015b; Prest et al., 2016). In general, strategies to improve biostability and minimize biofilm development in the distribution system and premise plumbing include optimized NOM removal, maintaining an effective disinfectant residual, maintaining low levels of biostability indicators in treated water (e.g., AOC, BDOC, biofilm formation rate), controlling corrosion and managing water temperatures.
B.4.1.4 Corrosion impacts
Corrosion is the deterioration of a material that results from a reaction with its environment. Corrosion in drinking water distribution systems can be caused by several factors, including the type of materials used in pipes and fittings, the age of the piping and fittings, the stagnation time of the water and the water quality in the system (including its pH and alkalinity). Other drinking water quality parameters that can influence corrosion include temperature, calcium, free chlorine residual, chloramines, chloride, sulphate and NOM (Health Canada, 2009b).
NOM has been shown to affect lead and copper corrosion (Korshin et al., 1996, 2000, 2005; Edwards and Sprague, 2001; Dryer and Korshin, 2007; Liu et al., 2009; Valentine and Lin, 2009; Schock and Lytle, 2011; Arnold et al., 2012; Zhou et al., 2015; Masters et al., 2016). The effects of NOM on metal surfaces can be varied. NOM can provide a protective film, decreasing corrosion (especially over a long timeframe), or it can increase corrosion through a variety of mechanisms: 1) NOM could complex with calcium ion and prevent protective scale formation; or 2) NOM could act as a food source for microorganisms, which could in turn attack the pipe surface and increase corrosion (Schock and Lytle, 2011).
Schock et al. (1996) reported varied impacts of NOM on lead and copper solubility. In some instances, NOM was observed to form soluble organic complexes with lead, resulting in an increase in dissolved lead concentrations. NOM can also adsorb/adhere to the interior surface of lead pipes, decreasing lead solubility. Korshin et al. (2005) demonstrated that NOM can impact both the morphology (physical structure) and size distribution of lead particles and can prevent or impair the formation of the more stable scales of cerrusite and hydrocerrusite. NOM was observed to prevent the formation of cerrusite and impair the formation of hydrocerrusite (i.e., imperfect and dispersed crystals were observed). Specifically, in the absence of NOM, approximately 90% of lead particles were found to be >5 µm. The addition of NOM decreased particle size, as larger particles broke down due to the accumulation of surface charge. The sharpest increases in soluble lead concentrations were observed between 0 and 3.5 mg/L DOC (Korshin et al., 2005) and between 0 and 2 mg/L DOC (Korshin et al., 2000). In a factorial experiment, Zhou et al. (2015) observed that NOM increases (from 1 mg/L to 7 mg/L DOC) resulted in significant increases in lead release in simulated partial lead service line replacements. In recent bench-scale work by Trueman et al. (2017), the authors observed that the presence of humic acid increased lead release from lead coupons both as a result of uniform corrosion and as a result of galvanic corrosion. Although the addition of orthophosphate lowered the lead release, the addition of humic substances made the orthophosphate less effective. The authors suggested that the complexation of lead and humic substances inhibits lead precipitation with phosphate.
Similarly, NOM has also been observed to increase copper release even at low concentrations (0.1–0.2 mg/L DOC), although the relationship between DOC and copper release was not observed to be linear (Korshin et al., 1996). The authors suggested that NOM adsorbs to the inorganic crystal structures at high DOC concentrations, causing mobilization and dispersion, whereas at very low concentrations, NOM cannot cover the entire surface, which results in patchy crystalline product coverage and creates conditions for copper pitting. The apparent contradictory effects of NOM on copper release were further explored by Edwards and Sprague (2001). The authors observed that NOM interferes with pipe ageing by forming the more soluble cupric-hydroxide, copper carbonate and copper-NOM complexes that prevent the formation of the more stable malachite. Copper pipe ageing is a significant factor in copper release control, with older copper pipes being associated with the more stable tenorite and malachite scales (Lagos et al., 2001; Edwards and McNeill, 2002). NOM can also be protective of copper, by acting as a food source for bacteria, consuming dissolved oxygen and triggering re-deposition when a suitable catalyst is present (Edwards and Sprague, 2001). The presence of NOM can lead to decreased copper release, as the NOM can sorb onto freshly formed copper pipe surfaces, which decreases soluble copper complexation capacity and causes re-deposition (Edwards and Sprague, 2001). In practice, Arnold et al. (2012) demonstrated that removing NOM was an effective method to decrease blue-water issues in a school with new copper plumbing. The authors suggested that NOM removal accelerated the natural ageing process.
Peng et al. (2013) observed that iron release increased in the presence of NOM (DOC = 1 mg/L) and that other inorganics (lead, vanadium, chromium, copper and arsenic) could be released from iron at various levels of chloride (0–250 mg/L).
The interactions of NOM with metal surfaces are complex, with multiple factors influencing the interactions such as exposure time and pH (Korshin et al., 2005; Liu et al., 2009). NOM characteristics have also been observed to be important for lead and copper release (Willison and Boyer, 2012) and inconsequential for lead (Dryer and Korshin, 2007). Further research is needed to explore the significant impact and mechanisms of NOM and metal release in both distribution system and premise plumbing materials. Researchers currently recommend that NOM be removed to minimize lead and copper concentrations (Valentine and Lin, 2009; Arnold et al., 2012; Zhou et al., 2015). More information on corrosion control, lead and copper is available elsewhere (Health Canada, 2009b, 2017, 2018c).
B.4.2 Operational issues
B.4.2.1 Coagulation process
The goal of coagulation is to destabilize (i.e., neutralize the charge of) colloidal particles (including pathogens) so that they effectively aggregate during flocculation and are subsequently removed by clarification and/or filtration. Coagulation also deals with removing NOM by a phase change that converts dissolved organic matter into particles: either directly by precipitation or by adsorption onto particles created by the coagulant (Edzwald and Haarhoff, 2012). When metal coagulants are added to the water, chemical reactions occur with both particles and NOM. Therefore, when a coagulant is added, the NOM acts as a ligand that complexes the positively charged metal ions, exerting a coagulant demand that must be overcome before flocculation can occur (Edzwald and Haarhoff, 2012). The character of NOM also has a significant impact on the coagulation process. For example, a two-fold increase in coagulant dose is needed to coagulate equal mass concentrations of fulvic acids as compared with humic acids (Edzwald, 1993; Rigobello et al., 2011).
Thus, coagulation should be viewed as an “integrated” process that considers both NOM and particles (i.e., turbidity) while having regard to their different coagulation characteristics (Edzwald and Haarhoff, 2012). For example, for the pH conditions of most water sources (pH 6–8), NOM and particles carry a negative charge that becomes more negative with increasing pH. However, the negative charge of NOM is typically between 5–15 µeq/mg carbon, while that of particles is between 0.05–0.5 µeq/mg carbon, depending on the particle type (Edzwald, 1993). Pernitsky (2003) estimated the charge for both the NOM and particle components for a variety of water sources to demonstrate that, in most cases, coagulant dosing is controlled by NOM, not by turbidity. Turbidity must increase significantly, in the absence of an associated NOM increase, for turbidity to control the coagulant dose. As NOM concentrations can rapidly increase four- to five-fold during storm events, it is important that water utilities have a good understanding of NOM’s impact on coagulant dosing (Edzwald, 1993; Pernitsky, 2003; Hurst et al., 2004; McVicar et al., 2015; James et al., 2016). Failure to adjust the coagulant dose in accordance with a change in NOM may contribute to suboptimal coagulation conditions and a decrease in pathogen log removal capability (Edzwald, 2017).
Given the importance of coagulation chemistry to ensure pathogen log removals, water utilities should consider both NOM and turbidity when defining optimum pH and coagulant dose conditions (Edzwald, 1993; Edzwald and Tobiason, 1999; Edzwald and Haarhoff, 2012). Jar testing is one of the most commonly used techniques to simulate coagulation treatment and to determine the coagulation potential for a water source (Black and Willems, 1961; Chow et al., 2004). It should be noted, however, that some NOM fractions cannot be removed by coagulation at any pH or dose (Kavanaugh, 1978; Babcock and Singer, 1979; Owen et al., 1993, 1995; Volk et al., 2002; Chow et al., 2004, 2006; Carpenter et al., 2013). More detailed discussions on the principles of coagulation and process optimization are presented elsewhere (Edzwald and Van Benschoten, 1990; Edzwald, 1993; Gregor et al., 1997; Edzwald and Tobiason, 1999; Pernitsky, 2003; Eikebrokk et al., 2006; Dempsey, 2006; Pernitsky and Edzwald, 2006; Edzwald and Kaminski, 2009; AWWA, 2011a, 2011b; Edzwald and Haarhoff, 2012; Davis and Edwards, 2014).
B.4.2.2 Membrane treatment
NOM has been identified in numerous studies as being responsible for membrane fouling, which can significantly impair water treatment operations. It is generally accepted that the hydrophilic neutral fraction of NOM, comprising polysaccharides and proteins in macromolecular and/or colloidal form (i.e., biopolymers), is responsible for membrane fouling (Carroll et al., 2000; Cho et al., 2000; Fan et al., 2001; Kimura et al., 2004; Lee et al., 2006; Her et al., 2007; Amy, 2008; Kennedy et al., 2008; Hallé et al., 2009; Peldszus et al., 2011; Croft, 2012; Chen et al., 2014; Kimura et al., 2014; Rahman et al., 2014; Siembida-Lösch et al., 2014, 2015; Yamamura et al., 2014; Chon and Cho, 2016). No correlations have been observed between fouling and the following:
- hydrophobic NOM (Cho et al., 2000; Croft, 2012; Rahman et al., 2014);
- turbidity (Hallé et al., 2009; Peldszus et al., 2011; Croft, 2012; Kimura et al., 2014; Rahman et al., 2014);
- DOC (Kimura et al., 2014; Rahman et al., 2014);
- UV absorbance (Kimura et al., 2014); or
- calcium concentration (Amy and Cho, 1999; Kennedy et al., 2008; Kimura et al., 2014).
It is hypothesized that once fouling is initiated by biopolymers, a decrease in electrostatic forces allows hydrophobic NOM to adsorb to the membranes, resulting in further fouling (Peldszus et al., 2011; Croft, 2012; Chon and Cho, 2016). Rahman et al. (2014) reported that biopolymer concentrations as low as 0.1 mg/L resulted in reversible (i.e., removable by backwashing/air scour) and irreversible (i.e., removable by chemical cleaning) fouling. Her et al. (2007) reported fouling by protein-like substances that were not detected in the feed water due to low concentrations (detection limit not given).
Other factors that influence membrane fouling include membrane characteristics (type of membrane, pore size distribution, material, surface charge, hydrophobicity), operating conditions (flux, recovery, pretreatment, backwashing, chemical cleaning), and water quality (pH, ionic strength, concentration and character of the foulants) (Amy, 2008; Huck and Sozański, 2011).
Water utilities should have a good understanding of how the NOM in their source water will interact with membranes to avoid configurations that incur significant fouling. Pretreatment (e.g., biofiltration) may be necessary to reduce biopolymer concentrations (Carroll et al., 2000; Peldszus et al., 2011; Siembida-Lösch et al., 2014; Chon and Cho, 2016). Pretreatment should be customized to each individual source, as effectiveness is source-specific (Fabris et al., 2007; Siembida-Lösch et al., 2015). A program of regular backwashing and periodic chemical cleaning, using proper foulant-based cleaning chemicals, should also be in place to remove accumulated foulants (Alspach et al., 2014).
B.4.3 Aesthetic
It is well established that NOM is responsible for such aesthetic concerns as colour, taste and odour (Hassler, 1947).
Colour caused by the presence of organic substances can occur in both surface and ground waters (Black and Christman, 1963; Tan and Sudak, 1992). Organic colour tends to be caused by the presence of humic and fulvic acids, which are black- to yellow-coloured substances (Stevenson, 1982). Black and Christman (1963) reported that 87% of the compounds responsible for colour in 10 U.S. sources were colloidal and 3.5–10 nm in size. By contrast, Ratnaweera et al. (1999) reported that 40% of the compounds responsible for colour in seven Finnish sources were <10 kDa (approximately 1 nm). Highly coloured sources tend to have a higher concentration of high molecular weight humic acids, which may account for these differences in size distribution (Edwards and Amirtharajah, 1985; Aitkenhead-Peterson et al., 2003). Fulvic acids represent a more complex mixture of low molecular weight compounds that are more hydrophilic than humic acids, and they have a significant impact on the required coagulant dose (see section B.4.2.1). Also, a higher proportion of fulvic acids are non-coagulable at any pH or coagulant dose (Hall and Packham, 1965; Kavanaugh, 1978; Babcock and Singer, 1979). As humic and fulvic acids are important DBP precursors, adequate colour removal may be necessary to meet DBP guidelines (Chaulk, 2015). For example, Tan and Sudak (1992) reported THM formation potentials of 250–262 μg/L for a highly coloured groundwater supply (7-day formation potential test at 20°C and at around pH 8).
Tastes and odours can be caused by volatile compounds produced by the microbial biomass (e.g., actinomycetes, cyanobacteria, fungi) that is washed in from the terrestrial environment or is naturally present in the aquatic system/aquifer (Hrudey et al., 1992; Zaitlin and Watson, 2006; AWWA, 2011a). Watson (2003) identified approximately 200 volatile organic compounds that produce undesirable tastes and odours. Terpenoids (e.g., geosmin and 2-methylisoborneol), sulphides and polyunsaturated fatty acids were identified as the most odorous. Geosmin and 2-methylisoborneol are environmentally stable compounds (i.e., not easily biodegraded) that can be transported significant distances from where the compounds are produced (Satchwill et al., 2007). Other researchers identified pyrimidines as problematic (Chorus et al., 1992; Zaitlin and Watson, 2006; Peter et al., 2009). Zacheus et al. (2001) found that actinomycetes and fungi can survive in the soft deposits (i.e., accumulated deposits containing organic and inorganic matter) of water distribution systems. As a result, the distribution system may constitute a source of taste and odour problems. Chlorine reactions with NOM may also contribute to tastes and odours (AWWA, 2011a). Guidance material to assist water utilities assess and minimize objectionable tastes and odours is available elsewhere (AWWA, 2011c).
B.5 Measurement and characterization
An effective NOM control strategy requires a good understanding of the origin, occurrence and variation that occurs in the source water (Volk et al., 2002). Water utilities should have a good understanding of:
- their water source and the nature and generation of NOM;
- whether NOM changes seasonally or with precipitation/snowmelt events; and
- how NOM interacts with treatment processes.
B.5.1 Considerations for quantifying NOM
Although the numerous organic compounds that contribute to NOM cannot be measured directly, there are a number of surrogates that can be used to provide an indication of the NOM concentration. The most commonly used surrogates include TOC, DOC, UV absorbance and chemical oxygen demand (Sillanpää et al., 2015b). In addition, UV absorbance and UV transmittance are mathematically related; hence the latter can also provide an indication of NOM concentration. As NOM is a major contributor to colour, this parameter may also be relevant (Matilainen et al., 2011).
TOC quantifies all organic carbon in a water sample and is the sum of POC and DOC. DOC is operationally defined as the organic carbon that has passed through a 0.45 μm filter. As the filter can leach some organic carbon to the sample, it is recommended that at least 50 mL of organic-free water be passed through the filter and filter assembly before filtering the DOC sample (Karanfil et al., 2002). TOC and DOC are measured indirectly from the carbon dioxide that is produced by UV-catalyzed chemical oxidation or by high-temperature combustion.
UV-visible light absorbance at 254, 350 and 440 nm can be linearly correlated to DOC concentration in some freshwater systems. However, linear correlations are less likely to be found in sources with strong autochthonous or anthropogenic inputs or where DOC has been extensively degraded by natural UV light (e.g., long retention time in lake) (Minor et al., 2014). The measurement of UV254 has historically been used in the water industry (Edzwald et al., 1985). It is generally accepted that a change in UV absorbance provides a good indication of changes in NOM (Pernitsky, 2003; Wright et al., 2016). Online or daily monitoring of UV absorbance provides valuable information to operators about pending impacts to the coagulant dose, as NOM concentrations can change without any observed fluctuation in flow or turbidity (see section B.3.1). Otherwise, operators are not aware of coagulant under-dosing until turbidity spikes are observed in clarified water or filter effluent. It is important that correlations be developed on a source-specific basis, because the relationship between NOM and UV absorbance is unique to each source (Pernitsky, 2003). In some cases, it is not possible to establish a correlation between UV254 and DOC (Cho et al., 2010; Sadrnourmohamadi et al., 2013; Minor et al., 2014). Monitoring UV-visible light absorbance over a broader range of wavelengths may be more appropriate in some cases (Wright et al., 2016). Alternatively, the lack of a correlation may be due to the presence of NOM that has low UV absorbance (e.g., proteins, sugars) or a high nitrate content, which may interfere with this measurement (Leenheer and Croué, 2003). Monitoring UV-visible light absorbance over a broader range of wavelengths may also provide a more advanced characterization.
UV transmittance is a relative measure of how much light passes through a water sample (at a wavelength of 254 nm typically through a 1 cm path length) compared with how much light passes through pure deionized water (which has a UV transmittance of 100%). Since UV absorbance and UV transmittance are mathematically related as per the formula below (Bolton, 2013), no information is lost by choosing one parameter over the other.

Equation - Text equivalent
UV absorbance (in cm-1) is equal to 2 minus the log10 of the UV transmittance (in percent).
A chart to convert UV transmittance to UV absorbance (and vice versa) is provided in Table C-3.4 of this document.
Chemical oxygen demand serves to give some indication of the concentration of oxidizable organic matter in a water sample (Frisch and Kunin, 1960; Stoddart and Gagnon, 2014). Historically, the chemical oxygen demand test method was not sensitive enough for drinking water (Rittman and Huck, 1989). A more sensitive photoelectrochemical oxygen demand (peCOD) method has been developed (Zhao et al., 2004) and is now commercially available (Stoddart and Gagnon, 2014; ASTM, 2017).
Colour has historically been measured using colorimeteric methods. True colour is operationally defined as the colour that has passed through a 0.45 μm filter, whereas apparent colour applies to unfiltered samples. Researchers have also used visible light absorbance at 420 nm as a measure for colour (Ekström et al., 2011; Kritzberg and Ekström, 2012; Weyhenmeyer et al., 2014). However, a wavelength between 450 nm and 465 nm is proposed as a standard spectrophotometric method (APHA et al., 2012).
Measurement of the above-noted parameters is simple and fast to perform, and some tests can be automated. They can indicate a change in water quality is occurring; however, they do not offer information about the character of the NOM. Edzwald et al. (1985) found that UV254 divided by the mg/L of DOC was a helpful indicator of NOM character. This concept later became known as specific UV absorbance (SUVA), which is discussed below. The calculation of specific colour (i.e., colour divided by mg/L DOC) may also provide useful information (Chow et al., 2005).
B.5.2 NOM characterization
B.5.2.1 Specific ultraviolet absorbance
The concept of SUVA has been developed as an operational indicator of NOM character and coagulation effectiveness for NOM removal (Edzwald and Van Benschoten, 1990; Edzwald and Tobiason, 1999). Table 6 presents the generally accepted relationships between SUVA, NOM composition, UV absorbance, coagulation and potential TOC removal. The calculation of SUVA is widely used to assess NOM character because it is easy and inexpensive to determine and is a good indicator of changes in source water quality (Westerhoff et al., 1999; Imai et al., 2001; Weishaar et al., 2003; Reckhow et al., 2007). For example, Volk et al. (2002) monitored DOC and UV254 for the White River (Muncie, Indiana) on a daily basis for 22 months. During this period, SUVA ranged from 1.40 L/mg∙m to 10.51 L/mg∙m. Lower values were associated with periods of low runoff and high algal activity (i.e., hydrophilic, autochthonous NOM), whereas high values were associated with snowmelt and storm runoff. During a typical rainfall event, SUVA increased from 2.6 L/mg∙m to 4.5 L/mg∙m within 12 h, indicating that hydrophobic, allochthonous NOM was being flushed into the source from the terrestrial watershed. Archer and Singer (2006b) analyzed 18 months of surface water data from the U.S. EPA Information Collection Rule and found a clear relationship between SUVA, source water characteristics and the effectiveness of coagulation for the removal of organic carbon.
In general, high SUVA sources (>4 L/mg∙m) have NOM that is amenable to coagulation. However, the hydrophilic neutral fraction can have a high SUVA, which can be misleading with respect to the potential for organic carbon removal using coagulation (Edzwald, 1993). Also, achieving DBP guideline limits will depend on the raw water NOM concentration and whether a sufficient amount of reactive NOM can be removed. If the post-coagulation DOC residual remains reactive with respect to DBP formation, other technologies targeting the removal of specific NOM fractions may be necessary (Bond et al., 2011). As humic and fulvic acids are important DBP precursors, adequate colour removal may be necessary to meet DBP guidelines (Chaulk, 2015). Low SUVA sources tend to have NOM that is not amenable to coagulation (Pernitsky, 2003).
| SUVA (L/mg∙m) |
NOM composition | UV absorbance | Coagulation | Potential TOC removal |
|---|---|---|---|---|
| <2 | Mostly hydrophilicFootnote b and low molecular weight compounds | Low | NOM has little influence on coagulant dose (i.e., mainly non-coagulable NOM) | 0Footnote c–40%; higher end for waters with high TOC |
| 2–4 | Mixture of hydrophilic and hydrophobic compounds; mixture of molecular weights | Medium | NOM influences coagulant dose | 40–60%; higher end for waters with high TOC |
| >4 | Mostly hydrophobic and high molecular weight compounds | High | NOM controls coagulant dose | 60–80%; higher end for waters with high TOC |
|
||||
B.5.2.2 Chemical usage
Tracking chemical usage (e.g., coagulant dose, chlorine demand) and calculating the specific dose or demand (i.e., mg/L per mg/L DOC) can help water utilities assess changes in NOM character. For example, Chow et al. (2005) reported that the specific coagulant dose decreased when allochthonous NOM inputs increased. Also, Hwang et al. (2001) reported that the hydrophilic base fraction of NOM produces significant chlorine demand, as outlined in Table 7. This fraction comprises compounds that are biodegradable (e.g., amino acids). Thus, the removal of these compounds using biological filtration techniques (see section B.6.2.5) may decrease chlorine demand and DBPs (Prévost et al., 1998). Summers et al. (2013) cautioned that DOC and chlorine demand do not correlate to THMs and HAA5 (i.e., monochloroacetic acid, monobromoacetic acid, dichloroacetic acid, dibromoacetic acid and trichloroacetic acid) due to the presence of some compounds that exhibit strong chlorine demand but do not produce DBPs. By contrast, Roccaro et al. (2008) reported a linear correlation between THMs and chlorine consumption (R2 = 0.94). The authors noted that chlorine consumption could be used to predict THM concentrations in the distribution system when NOM oxidation and halogenation processes dominate, compared with other reactions that consume chorine (e.g., oxidation of inorganic species, photolytical and corrosion processes). Caution is recommended when assessing trends related to chlorine demand or specific chlorine demand, as reactions are likely to be source-specific and may vary with seasonal and weather-related effects.
| Fraction | Chlorine demand |
|---|---|
| Hydrophobic | + |
| Hydrophilic – acids and neutrals | ++ |
| Hydrophilic – bases | ++++ |
| Colloidals | + |
+ Lowest demand
|
|
B.5.2.3 Disinfection by-products
Actual DBP concentrations measured in the distribution system provide a good indication of the reactivity of NOM. It is recommended that parameters used to characterize NOM be measured in conjunction with DBP samples to estimate the specific DBP yield (e.g., μg DBP/mg DOC). Also, inorganic compounds that enhance the reactivity of NOM to form DBPs should be characterized (i.e., ammonia, bromide, iodide and sulphur).
As noted above, DBP formation potential tests should be conducted when evaluating alternative treatment options, as it is typically easier to remove DOC than to decrease reactivity, particularly when bromide is present. The formation potential test method selected should also be representative of distribution system residence time (Kastl et al., 2016). It is important to note that formation potential test methods that use very high chlorine doses may not correctly determine differences in DBP yield when bromide is present (Bond et al., 2014). This is because chlorine can outcompete bromine when it is in excess relative to bromine. Under typical operating conditions, bromine is much more effective at forming DBPs than chlorine (Bond et al., 2014).
B.5.2.4 Other methods
NOM compounds can be fractionated using commercially available solid-phase extraction sorbents. However, measurement of the six NOM fractions (see Table C-3.3) is time- and labour-intensive (Minor et al., 2014; Goss et al., 2015) and may not correlate well with DBP formation potential results (Wright et al., 2016). Several researchers have investigated more rapid assessment methods (Chow et al., 2004, 2006; Rosario-Ortiz et al., 2007; Dittmar et al., 2008; Ratpukdi et al., 2009). Goss et al. (2017) compared three prepackaged solid phase extraction cartridges for the isolation of hydrophobic and hydrophilic fractions from three surface waters in Manitoba. The authors reported that the method could be used at water treatment plants to rapidly assess raw water quality, adapt treatment processes and verify treatment performance. By contrast, Wright et al. (2016) reported that solid phase extraction cartridges leaked variable amounts of organic carbon, skewed TOC results and correlated poorly with DBP formation potential results. The authors did not recommend using this method as a monitoring tool.
NOM compounds can also be physically fractionated based on differences in molecular size using membrane fractionation or size exclusion chromatography (Koudjonou et al., 2005). NOM is typically fractionated into four size ranges: <1, 1–10, 10–30 and >30 kDa. Size exclusion chromatography can also be supplemented with organic carbon and/or organic nitrogen detection (Huber et al., 2011). These methods are commonly reported in peer reviewed literature but are not yet used routinely by water utilities.
Fluorescence is another method that shows promise (Wright et al., 2016). The fluorescent fractions of NOM exhibit intensity peaks at specific wavelengths; this allows their classification as humic-, fulvic- or protein-like compounds. However, the method has considerable requirements for equipment, user training and data processing, and its connection with water treatment practices and treated water quality is not well established.A comprehensive review of these and other methods for the isolation and analysis of NOM is presented elsewhere (Minor et al., 2014).
B.5.3 Biological stability
BDOC and AOC are the two most widely used parameters for measuring the biological stability of water.
BDOC refers to the portion of DOC available to be utilized by heterotrophic bacteria (Escobar and Randall, 2001). Testing consists of measuring the DOC in the water before and after incubation with an inoculum of a natural bacterial population. The BDOC value is considered a measure of the hydrolyzable pool of carbon available for bacterial regrowth.
AOC represents the most readily degradable portion of the BDOC that can be taken up by bacteria and converted into organic biomass (Escobar and Randall, 2001). The test for AOC determines the growth potential of the water by measuring the growth yield of two pure strains of bacteria (Pseudomonas fluorescens strain P17, Spirillum strain NOX) over several days and comparing these observations against a calibration curve for the growth produced using solutions of organic carbon standards (e.g., acetate or oxalate) (LeChevallier et al., 2015a). The AOC concentration is considered one measure of the biostability of water for heterotrophic bacterial growth (Escobar and Randall, 2001). AOC is often used as the method to predict bacterial regrowth, as it returns a value that corresponds to a bacterial count (Escobar and Randall, 2001).
It has been suggested that the AOC:BDOC ratio can be used as an indication of the relative biological stability of the biodegradable organic compounds present in drinking water (Escobar and Randall, 2001). Both methods are time-consuming and require a high level of analytical expertise. Camper (2004) and van der Kooij et al. (2015) reported that carbon compounds not measured by AOC and BDOC may also influence biofilm growth and that these measurements alone may not be sufficient for estimating regrowth potential.
The water industry has been investigating the benefits of more rapid methods that use adenosine triphosphate (ATP) measurements or flow cytometry technology (Hammes et al., 2012; Besmer et al., 2014; Nescerecka et al., 2014; Pharand et al., 2014; Gilmore and Summers, 2015; Liu et al., 2015; van der Kooij et al., 2015; Besmer and Hammes, 2016; Elhadidy et al., 2016).
ATP measurements are gaining popularity as an indicator of microbiological biomass (Siebel et al., 2008). ATP methods are low cost, rapid and require a modest amount of training (LeChevallier et al., 2015a). Still, an understanding of the meaning of the measurements as they relate to other water quality dimensions such as viable and culturable cell counts is necessary when considering the inclusion of ATP analysis in a monitoring program (Siebel et al., 2008; Hammes et al., 2010).
Flow cytometry has also emerged as a potential tool for rapid online monitoring of general microbial water quality (Prest et al., 2013, 2016). Because of its ability to measure changes in bacterial cell counts, flow cytometry has been proposed as one of several methods for assessing biological stability (Lautenschlager et al., 2013; Prest et al., 2013, 2016; Nescerecka et al., 2014). The technology is advanced and has considerable requirements for equipment, user training and data processing (Hammes and Egli, 2010). Several studies have investigated online biostability monitoring using flow cytometry, but standardized methods have not yet been developed for drinking water applications (Hammes and Egli, 2010; Lautenschlager et al., 2013; Prest et al., 2013). In an investigation of a full-scale chlorinated drinking water system, Nescerecka et al. (2014) found that flow cytometry, in combination with ATP measurements, provided more meaningful information than heterotrophic plate counts for assessing and understanding biological stability at various points in the distribution system. In van der Kooij et al. (2015) it is reported that the use of ATP methods to assess biofilm formation potential and biofilm accumulation rates provided an improved understanding of biological instability in distributed water (without a disinfectant residual) that would not have been revealed based on the assessment of AOC only.
LeChevallier et al. (2015a) completed a statistical analysis of full-scale data for six water utilities and concluded that the most useful measures to assess biological stability were variability in disinfectant residual (measured by the coefficient of variation), biofilm formation rate (measured by ATP accumulated on mild steel coupons) and changes in corrosion rates (measured by linear polarization resistance using mild steel coupons). LeChevallier et al. (2015b) provide guidance to help water utilities produce biologically stable water and establish an appropriate system-specific monitoring program.
B.6 Treatment and distribution system considerations
An effective NOM control strategy is required to meet concomitant water quality goals related to microbial protection, DBPs, biological stability and corrosion control (Brown and Cornwell, 2011). The goal of the NOM control strategy should therefore be to reduce NOM concentrations to as low as reasonably achievable.
The source-to-tap or water safety plan approach, which includes careful selection of the highest quality water source and source water protection, is a universally accepted approach to manage risks to drinking water safety (O’Connor, 2002; CCME, 2004; WHO, 2012). Source-specific treatability studies, including bench- and/or pilot-scale testing, should be conducted to determine the most suitable treatment alternatives for the full range of water quality conditions (Valade et al., 2009; Huck and Sozański, 2011).
Temporal variations in the concentration and character of NOM can have a significant influence on the selection, design and operation of water treatment processes (Sillanpää, 2015). More variable weather patterns associated with climate change will place increased importance on proper process selection (Huck and Coffey, 2004) and day-to-day process control (Wright et al., 2016).
B.6.1 Choice of appropriate treatment
To appropriately select, design and operate water treatment facilities, an understanding of the variations in the concentration and character of NOM is necessary—for the full range of conditions encountered over the year, for both surface and groundwater sources (AWWA, 2011a; Sillanpää, 2015). To determine the most appropriate treatment processes, water utilities should have knowledge regarding the following (Ivančev-Tumbas, 2014):
- the origin, occurrence and fluctuations in NOM;
- interactions with other water constituents (e.g., enhanced reactivity due to bromide);
- interactions with chemicals used during treatment (e.g., NOM creates a disinfectant and coagulant demand that must be overcome to produce microbiologically safe drinking water);
- interactions with unit processes (e.g., NOM fouls adsorbents and membranes); and
- impacts on distribution system water quality.
The appropriate type and level of treatment should take into account source-specific fluctuations in water quality, including short-term degradation, variability in treatment performance and distribution system conditions (Kastl et al., 2016).
A source-specific treatability study should be conducted to assess and compare treatment options for the removal of NOM (Goss and Gorczyca, 2013; Plourde-Lescelleur et al., 2015; Kastl et al., 2016). The treatability study should include bench- and/or pilot-scale testing and consider concomitant water quality goals related to microbial protection, DBPs, biological stability and corrosion control. Parameters to be considered as part of a treatability study include chemical doses and residuals, turbidity, organic content (e.g., DOC, UV254, peCOD, colour), organic character (e.g., hydrophobicity, size, specific UV absorbance), pH and alkalinity, anions (e.g., bromide, chloride, fluoride, nitrate/nitrite, orthophosphate, sulphate), DBP formation potential that is representative of the distribution system, biostability, and corrosion characteristics (Gregor et al., 1997; Karanfil et al., 2007; Shin et al., 2008; Cho et al., 2010; Brown and Cornwell, 2011). The optimum solution will be source-specific, and multiple treatment processes may be needed to adequately remove NOM at all times of the year (Collins et al., 1986; Chang et al., 2001; Hua and Reckhow, 2007a; Karanfil et al., 2007; Fabris et al., 2008; Kristiana et al., 2009; Carpenter et al., 2013; Hua et al., 2015; Sillanpää, 2015).
B.6.2 Treatment options
A number of treatment options are available to remove NOM. Although optimized coagulation is the most commonly used method, its applicability should be carefully analyzed: it can only remove some NOM fractions, and NOM may remain reactive post-coagulation such that DBP guidelines are not achieved. For example, allochthonous NOM tends to be hydrophobic in nature and is generally amenable to coagulation, whereas hydrophilic NOM tends to be more difficult to treat (Volk et al., 2002; Chow et al., 2004, 2006). In fact, for sources high in hydrophilic neutral NOM, coagulation will be ineffective (Chow et al., 2006). As a result, it is very important that jar testing and DBP formation potential testing be performed to determine the feasibility of optimized coagulation for NOM removal. Additional or alternative treatment options include nanofiltration, ion exchange, activated carbon, biological filtration and oxidation processes.
The literature cautions that the specific DBP yield (i.e., μg DBP/mg DOC) can sometimes be greater in the treated water than in the disinfected raw water (Jacangelo et al., 1995; Singer et al., 2007; de la Rubia et al., 2008; Newfoundland and Labrador Department of Environment and Conservation, 2011). This is attributed to a higher bromide:DOC ratio following treatment. Because bromide is not removed by most treatment processes, more brominated DBPs may form following treatment if NOM removal is inadequate. As a result, it is very important that a source-specific treatability study be performed to assess and compare treatment options; this study should include bench- and/or pilot-scale testing to determine the DBP formation potential.
Treatment options are briefly discussed below. More detailed information regarding treatment is available in other sources (Parsons et al., 2007; AWWA, 2011a; Bond et al., 2011; Huck and Sozański, 2011; Sillanpää, 2015).
It is important that water treatment operators understand the NOM removal mechanisms, since changes in treatment practices can significantly impact water quality (Ivančev-Tumbas, 2014). Thus, operator training is also needed to ensure the effective operation of treatment barriers at all times (Smeets et al., 2009). Maintaining current knowledge of best practices and remaining aware of advancements in the drinking water industry are important to ensure water safety.
B.6.2.1 Optimized coagulation
Coagulation is a very complex process because NOM comprises a mixture of compounds having different affinities for the coagulant (Hall and Packham, 1965). Coagulation involves two primary mechanisms: one consists of charge neutralization and the formation of insoluble precipitates; the other involves adsorption onto aluminum or ferric hydroxide floc (i.e., sweep coagulation) (Dempsey et al., 1984). Each mechanism is favoured by a particular set of operating conditions related to pH and coagulant dose. As pH increases, NOM becomes increasing negatively charged, but coagulant hydrolysis products with lower positive charge dominate. Thus, at pH >7 a four-fold increase in the coagulant dose is necessary to overcome NOM’s negative charge compared with that required at pH 5.5. Above pH 7, NOM removal is poor (Semmens and Field, 1980; Edzwald and Van Benschoten, 1990; Edzwald and Tobiason, 1999). Physical factors (such as mixing of the coagulant and mixing conditions in the flocculator) can affect floc formation; in most cases, however, the coagulation chemistry controls the process (Kavanaugh, 1978; Vadasarukkai and Gagnon, 2015; Vadasarukkai, 2016).
The choice of coagulant will depend on the characteristics of the water to be treated. Sillanpää and Matilainen (2015) discuss the available coagulant choices (e.g., aluminum- and ferric-based coagulants, inorganic polymer flocculants, organic polyelectrolytes, composite coagulants and novel coagulants). While some coagulants provide a wider operational window with respect to pH, it is noteworthy that for all metal coagulants the pH of minimum solubility increases as temperature decreases (Pernitsky, 2003). For alum, optimum performance generally occurs at pH values close to the pH of minimum solubility (i.e., 6.5–6.7 at 4°C and 6.0–6.2 at 20°C) (Edzwald and Kaminski, 2009). As the pH of minimum solubility is higher at lower temperatures, a higher coagulant dose may be needed to overcome the more negative charge on NOM with the lower positive charge on coagulant hydrolysis products, as noted above. Strict pH control is necessary for optimum coagulation; even a small pH change can release NOM that was previously incorporated into flocs (Slavik et al., 2012).
NOM also determines the size, structure, and strength of the flocs, controlling both the extent and the rate of the clarification or filtration processes (Eikebrokk and Saltnes, 2001; Newcombe and Dixon, 2006; Parsons et al., 2007). Several studies have demonstrated that low-density NOM flocs are more amenable to flotation than to sedimentation (Plummer et al., 1995; Edzwald and Kelley, 1998; Edzwald et al., 1999, 2000, 2003; Harrington et al., 2001; Edzwald, 2010; Gregory and Edzwald, 2011). Alternatively, the addition of a coagulant aid (e.g., activated silica, bentonite, lime, polymer) may be needed to form settleable flocs (Semmens and Field, 1980; Edwards and Amirtharajah, 1985; Gregor et al., 1997).
The charge-driven nature of NOM coagulation means that electrophoretic monitoring is appropriate (Bond et al., 2011). Otherwise, operators are not aware of coagulant under-dosing until spikes in settled water or filter effluent turbidity are observed (Pernitsky, 2003). Ideally, the raw water should be continuously monitored to optimize the coagulant dose (Pernitsky, 2003; Newcombe and Dixon, 2006; Sharp et al., 2006; Shin et al., 2008). Online monitoring tools for NOM include TOC, DOC, UV absorbance/transmittance and peCOD; for particle destabilization they include zeta potential or streaming current (Conio et al., 2002; Newcombe and Dixon, 2006; AWWA, 2011b). Maximum NOM removals have been reported when the zeta potential is between –10 mV and +5 mV (Sharp et al., 2006; Sharp, 2015). For streaming current, optimum coagulation occurs at the point of zero charge (isoelectric point) (McVicar et al., 2015).
Optimized coagulation involves integrating both NOM and turbidity reduction requirements into the decision-making process (Edzwald and Haarhoff, 2012). For many water supplies, coagulant dosing will be controlled by NOM rather than turbidity, as stated above. Jar testing should be conducted to ensure that coagulation is optimized for both NOM and turbidity removal. Online monitoring of UV absorbance/transmittance, zeta potential or streaming current provides valuable information to operators about pending impacts to the coagulant dose, particularly for highly variable sources. Failure to adjust the coagulant dose in accordance with a change in NOM may contribute to suboptimal coagulation conditions and a decrease in pathogen log removal capability (Edzwald, 2017).
B.6.2.2 Membrane filtration
Four types of pressure-driven membranes are currently used in drinking water treatment: microfiltration (MF), ultrafiltration (UF), nanofiltration (NF) and reverse osmosis (RO). Membranes are generally classified by the type of substances they remove, operating pressure and pore size or molecular weight cut-off. MF and UF are referred to as low-pressure membranes and are used for particle/pathogen removal. The predominant removal mechanism is straining or size exclusion. NF and RO are referred to as high-pressure membranes and are used for the removal of NOM and inorganics (e.g., sodium, chloride, calcium, magnesium). The predominant removal mechanism is differences in solubility or diffusivity.
The size distribution of NOM varies between sources, but generally over 50% of NOM molecules have a molecular weight of <1kDa and 80% have a molecular weight of <10kDa (Sillanpää et al., 2015a). As a result, a tight NF membrane is required to remove the majority of DBP precursors, as shown in Figure 1. Studies indicate that the optimum molecular weight cut-off for NOM removal is 0.2–0.3 kDa (Jacangelo et al., 1995, 1997; Bond et al., 2011; Sillanpää et al., 2015a). NF can achieve high removals of DOC, UV254 and DBP precursors, as discussed in section B.6.3.
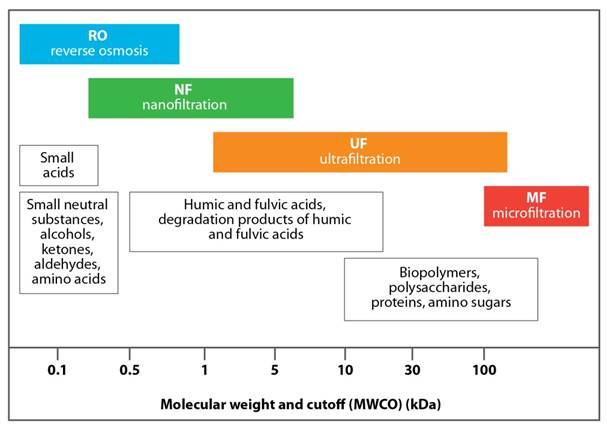
Figure 1 - Text equivalent
This is an illustration of the organic matter fractions removed by membrane processes. At the bottom of the illustration, a scale of molecular weight begins at the left with a value of 0.1 kDa and increases to the right, reaching a maximum of 100 kDa. Reverse Osmosis (RO) removes a range from less than 0.1 kDa to nearly 1 kDa, nanofiltration (NF) removes a range from about 0.3 kDa to about 7 kDa, ultrafiltration (UF) removes a range from about 1 kDa to just over 100 kDa and microfiltration (MF) removes a range that extends upwards of 100 kDa.
Figure 1 illustrates that MF membranes cannot remove any NOM fractions other than biopolymers. UF membranes may remove some NOM, as shown in Figure 1, but DBP formation potential may not decrease adequately. For example, Lamsal et al. (2012) reported an overall DOC removal of 66% from UF membranes (absolute pore size = 0.01 μm). THM and HAA formation potentials decreased by 54% and 77%, respectively but remained high at 200 μg/L and 80 μg/L, respectively (test conditions = chlorine 1.0±0.4 mg/L at room temperature for 24 h). Also, UF membranes cannot remove AOC (usually <1 kDa) unless combined with a tight NF or RO membrane or biological treatment (Sillanpää et al., 2015a). The use of a coagulant or absorbent may improve DBP precursor removal by MF/UF processes (Jacangelo et al., 1997). Pretreatment requirements for NOM removal should be considered as part of a source-specific treatability study whenever the optimum molecular weight cut-off for NOM removal (i.e., 0.2–0.3 kDa) is not used.
Membrane fouling is a complex process and should also be assessed. Indicators of fouling potential include low SUVA, high hydrophilic fraction, high dissolved nitrogen or high biopolymer concentration (Lee et al., 2006; Amy, 2008; Croft, 2012; Kimura et al., 2014; Siembida-Lösch et al., 2014).
B.6.2.3 Ion exchange
Ion exchange is a process in which ions from the raw water are exchanged with ions within the solid phase of a resin. It was recognized in the early 1960s that ion exchange processes could remove NOM, mainly because NOM was found to foul ion exchange resins used to remove other contaminants (Frisch and Kunin, 1960; Ungar, 1962; AWWA, 2011a).
The dominant removal mechanism involves ion exchange (i.e., electrostatic), with hydrophobic adsorption and hydrogen bonding also playing a role (Fu and Symons, 1990; Bolto et al., 2002). Ion exchange has received significant attention since 2000 as a result of the development of the MIEX® resin (magnetic ion exchange resin), which was specially designed for NOM removal (Slunjski et al., 2000; Drikas et al., 2003; Fearing et al., 2004c; Budd et al., 2005; Parsons et al., 2007; Singer et al., 2007, 2009; Humbert et al., 2008; Bond et al., 2010; Brown and Cornwell, 2011).
Factors influencing the performance of ion exchange include NOM concentration and character, water quality (particularly the concentration of competing anions such as bicarbonate and sulphate), resin properties (polymer composition, porosity and charged functional groups) and operational variables (resin dose, contact time, regeneration frequency). However, ion exchange processes do not remove turbidity; hence they are typically applied with a turbidity removal process (Drikas et al., 2003).
Several researchers reported that ion exchange was more effective than coagulation for NOM removal, either on its own (Drikas et al., 2003; Singer et al., 2007, 2009) or in combination with coagulation (Drikas et al., 2003; Brown and Cornwell, 2011; Braun et al., 2014). Drikas et al. (2003) conducted bench-scale experiments for MIEX® alone (resin dose = 6–8 mL/L with 15 min contact) and observed removals of 64–74% and 82–84% for DOC and UV254, respectively. When used in combination with coagulation (alum dose = 20–30 mg/L; resin dose = 6 mL/L with 10–15 min contact), removals ranged from 64–76% and 82–90% for DOC and UV254, respectively. Singer et al. (2009) completed a comprehensive review of numerous full- and pilot-scale studies involving 21 sources in Australia and the United States and reported DOC removals of 36–80% (resin dose ≈0.2–2.8 mL/L; contact time not given). The authors attributed the wide range in DOC removal to the presence of hydrophilic NOM with base and neutral charge.
The use of ion exchange in combination with other processes can have some operational benefits and impacts that should be considered in a source-specific treatability study. For example, ion exchange prior to coagulation can reduce the coagulant dose and associated sludge production, lower the settled water turbidity, reduce the use of pH adjustment chemicals, reduce the disinfectant dose, and stabilize distribution system chlorine residuals (Budd et al., 2005; Brown and Cornwell, 2011). Ion exchange processes may also remove some bromide from sources that have low alkalinity and sulphate concentrations, due to minimal competition for ion exchange sites (Singer et al., 2007). Humbert et al. (2008) reported improved performance of activated carbon for pesticide removal when ion exchange was used to enhance NOM removal. However, Brown and Cornwell (2011) noted that ion exchange treatment and lower doses of sulphate-based coagulants could increase the potential for corrosion, due to changes in the chloride:sulphate mass ratio.
Water utilities that use ion exchange for the removal of other anions (e.g., arsenic, chromium, nitrate, uranium) should be aware that NOM competes for ion exchange sites and can decrease process efficacy (Frisch and Kunin, 1960; Ungar, 1962). Pretreatment for NOM removal may be required to ensure that the process remains economical for its intended purpose (Bursill, 2001).
B.6.2.4 Activated carbon
Activated carbon is an absorbent material that provides a surface on which ions or molecules in the raw water can concentrate. It can be applied in two ways: slurry applications using powdered activated carbon (PAC) or fixed bed reactors with granular activated carbon (GAC) (AWWA, 2011a). The removal mechanisms involve adsorption of dissolved organic matter onto PAC or GAC, as well as biodegradation of BOM in GAC fixed bed reactors if an active biofilm forms. Chowdhury et al. (2010) found that biofilms can form in GAC macropores even in the presence of chlorine.
The primary use of PAC and GAC in water treatment is to remove micropollutants as well as taste- and odour-causing compounds. The use of PAC offers the advantage of providing virgin carbon when required (e.g., during the taste and odour season). GAC fixed bed reactors are operated similarly to conventional rapid rate filters; hence the GAC characteristics (e.g., type, particle size, reactivation method) and operating conditions (e.g., filter velocity, empty bed contact time, backwashing regime, filter run time) influence their performance.
The large specific surface area and well-developed porous structure of GAC can provide high sorption capacity for organic molecules (Simpson, 2008). However, GAC has not been widely used as a primary NOM control strategy because the adsorption capacity of GAC tends to be quickly exhausted (i.e., in the order of months) and regeneration can be costly (Prévost et al., 1998; Huck and Sozański, 2011). For example, the U.S. EPA (2016) reports a 120-day reactivation frequency for systems with TOC of <6 mg/L using an empty bed contact time of 10 min. The removal of high molecular weight hydrophobic NOM by conventional treatment processes can significantly increase the operational life of GAC filters (Karanfil et al., 2007). In addition, once the adsorption capacity is exhausted, GAC filters can continue to remove NOM through the biodegradation mechanism, albeit at lower efficiencies (Bond et al., 2011; Gibert et al., 2013a).
Studies indicate that for GAC to be effective for NOM removal, the pore volume should be in a size range that matches the source-specific NOM (Karanfil et al., 2007; Gibert et al., 2013b). As noted by Karanfil et al. (2007), the surface area and total pore volume are not sufficient criteria for selecting a GAC for NOM removal, because these parameters do not provide information about the accessible pore region. The authors suggest that water utilities request detailed information about the pore size distribution and the pH of the point of zero charge for candidate GACs. Rapid small-scale column tests should be conducted to compare the performance of alternative GACs, particularly for low SUVA sources (Ates et al., 2007; Karanfil et al., 2007). Abrasion of GAC particles should also be considered, as abrasion can lead to the loss of GAC material and stratification within the bed, both of which are undesirable (Gibert et al., 2013b).
Water utilities that use activated carbon for the removal of pesticides or other trace contaminants should be aware that NOM competes for adsorption sites and can decrease process efficacy (Haist-Gulde and Happel, 2012). Pretreatment may be required for NOM removal, to ensure that the process remains economical for its intended purpose (Bursill, 2001).
B.6.2.5 Biological treatment
Biological treatment involves targeting the removal of the BOM fraction that encourages biofilm growth in the distribution system (section B.4.1.3) and increases chlorine demand (section B.5.2.2) (Prévost et al., 1998). The effectiveness of biological treatment therefore depends on the amount of BOM that is present in the water to be treated, the microbial community consuming the BOM and the temperature (Drewes et al., 2009; Diem et al., 2013). Recalcitrant or refractory NOM is unlikely to be removed by biological processes unless it is oxidized to transform it into BOM. Biological treatment generally improves the biological stability of the water and decreases DBP concentrations, as well as tastes and odours (Servais et al., 2005).
The main biological treatment processes for drinking water include riverbank filtration, rapid granular media filtration without the maintenance of a disinfectant residual across the bed and slow sand filtration.
Riverbank filtration
Riverbank filtration (RBF) involves locating vertical or horizontal water supply wells near a river to use the riverbank and adjacent aquifer as a natural filter to remove contaminants, including BOM. As water proceeds to the groundwater table, concentrations are lowered through adsorption, biodegradation and dilution with groundwater (Piet and Zoeteman, 1980; Bize et al., 1981; Kuehn and Mueller, 2000; Ray et al., 2002).
Kuehn and Mueller (2000) reported that RBF decreased DOC and AOC concentrations by 27% and 63%, respectively. Weiss et al. (2003) monitored three full-scale RBF sites and reported that TOC/DOC concentrations and THM/HAA formation potentials were lower in the RBF wells by approximately 35–70% and 50–80%, respectively. Wang et al. (2002) found that TOC concentrations decreased by approximately 50% through the RBF process while BDOC was completely removed. Drewes et al. (2009) reported that TOC concentrations at three full-scale RBF sites were consistently decreased from 3–10 mg/L to 1–3.5 mg/L.
Water utilities considering RBF should be aware that the oxygen demand created by the biodegradable NOM and other contaminants such as ammonia can change redox conditions and cause the dissolution of manganese, which may require treatment (Appelo and Postma, 1996). More information on manganese in drinking water is available elsewhere (Health Canada, 2016b).
Engineered biological filtration
Engineered biological filtration involves the use of granular media filters (i.e., anthracite/sand or GAC) without the maintenance of a disinfectant residual across the bed. Biological activity within the filters can be influenced by a number of factors: water quality, temperature, oxidant dose and type, and backwashing procedures (Huck et al., 2001). The process is typically preceded by an oxidation step (e.g., ozonation) that transforms NOM into BOM to make it more readily biodegradable (Evans et al., 2013a). If a biological treatment step is not used after ozonation, increased biofilm growth in the distribution system is highly likely (Juhna and Melin, 2006).
Emelko et al. (2006) reported TOC removals of 13–23% and BOM removals of 72–93% (measured as oxalate) for a full-scale plant at warm (21–25°C) and cold (1–3°C) temperatures. Evans et al. (2013b) reported average AOC removals of 31–42% for 14 full-scale biological filters over a one-year timeframe. Stoddart and Gagnon (2015) reported a decrease in THMs and HAAs of 10–20 μg/L and 6–10 μg/L, respectively, following the conversion of anthracite-sand filters to biological filters in a full-scale direct filtration plant.
Water utilities considering biological filtration for an existing facility should be aware that some utilities have reported unwanted algae or biogrowth, shorter filter run times and problems maintaining a chlorine residual (Brown et al., 2016). There is extensive guidance available to help water utilities understand the mechanisms associated with biological filtration, as well as to identify and implement appropriate monitoring (Prévost et al., 2005; Juhna and Melin, 2006; Evans et al., 2013a, 2013b; Brown et al., 2016; Nyfennegger et al., 2016).
Slow sand filtration
Slow sand filtration (SSF) generally consists of untreated water flowing by gravity at a slow rate through a bed of submerged porous sand. During operation, biological growth occurs within the sand bed and gravel support. In addition, bacteria and other materials in the source water accumulate on the surface to form a “schmutzdecke”, the layer of solids and biological growth that forms on top of a slow sand filter. The biological growth within the filter and the schmutzdecke both contribute to the effectiveness of SSF. Depending on the source water quality, it may take weeks or months for this biological growth to develop (Bellamy et al., 1985a, 1985b; Logsdon et al., 2002).
Amy et al. (2006) reported that conventional SSF can decrease BDOC and AOC concentrations by <80% and <65%, respectively, whereas DOC and THM precursor removal was limited to between <15–30% and <20–35%, respectively. This level of removal, however, is generally not sufficient to comply with DBP drinking water guidelines (Pyper, 1985; Collins et al., 1991; Graham, 1999), particularly in winter when low temperatures reduce biological activity (Collins et al., 1992). The addition of ozone or GAC has been reported to achieve colour reduction and improve DBP precursor removal (Graham, 1999; Di Bernardo and Pereira Tangerino, 2006; Ødegaard et al., 2006; Steele et al., 2006).
In a review of the literature, Graham (1999) reported that with pre-ozonation, DOC and THM formation potential removals ranged from 18% to 55% and from 20% to 64%, respectively. Overall, the author suggested that the addition of ozone increased DOC removal by 10% while THM formation potential was halved. DiBernardo and Pereira Tangerino (2006) used bench-scale experiments and observed that colour removal increased from 33% to 63% when GAC was added (after SSF) and ranged from 21.5% to 53% when the water was oxidized (before SSF) with ozone or ozone/hydrogen peroxide (H2O2). When both GAC and oxidation with ozone or ozone/ H2O2 were used in combination with SSF, colour removal ranged from 44% to 68%.
The enhancement of SSF with ozone and/or GAC can create a number of operational issues. Ozone can increase filter headloss and thereby shorten filter runs (Graham, 1999; Logsdon et al., 2002; Di Bernardo and Pereira Tangerino, 2006). The ozone residual should also be quenched before it reaches the schmutzdecke; otherwise the biomass becomes inactive, and biologically unstable water will be produced (Melin et al., 2006; Ødegaard et al., 2006). The filtered effluent may also contain high concentrations of heterotrophic bacteria that should be removed/inactivated (Ødegaard et al., 2006). Steele et al. (2006) cautioned that the dissolved oxygen demand associated with the inclusion of a GAC layer must be considered. In addition, water temperature is an important design factor when considering SSF and the selection of any ancillary processes (Jabur, 2006).
Although Gottinger et al. (2011) conclude that enhanced SSF can provide significant reductions in colour and organic matter, pilot testing is recommended to ensure that the source water can be successfully treated (Logsdon et al., 2002). It should also be noted that the ozonation of water containing naturally occurring bromide can result in the formation of bromate. Water utilities using ozone should characterize their source water to assess water quality parameters (i.e., bromide, temperature, pH, alkalinity, NOM, ammonia) and how these change on a seasonal basis. Quarterly monitoring of raw water bromide is recommended to characterize the source water and allow correlation to bromate (and brominated DBPs). More information on bromate can be obtained from Health Canada (2016b).
B.6.2.6 Oxidation processes
Oxidation processes include ozone, chlorine dioxide and advanced oxidation processes such as ozone/UV, ozone/H2O2, UV/H2O2, and Fenton’s reaction. Under typical water treatment conditions, oxidation processes transform the nature of the organics rather than remove bulk NOM (Owen et al., 1993; Świetlik et al., 2004). As a result, oxidation processes are generally used for disinfection, taste and odour control and degradation of target organic contaminants. Ozone and chlorine dioxide tend to make NOM less reactive with chlorine, which generally results in decreases in THMs and tri-HAAs; however, some DBPs may increase, such as halonitromethanes and haloketones (Reckhow, 2017). Advanced oxidation processes can, in principle, remove a variety of NOM, but they can also increase the formation of DBPs and dichloroacetic acid (DCAA) in particular (Bond et al., 2011). The authors recommended careful assessment of oxidation processes when they are used for DBP control.
As oxidative processes can result in the reduction of some DBPs while increasing others, mitigative measures tend to focus first on minimizing DBP formation by maximizing NOM removal (AWWA, 2011a). The use of alternative disinfectants to reduce DBP formation should therefore be considered with caution (Reid Crowther & Partners, 2000).
Water utilities should be aware that all oxidants, including chlorine, produce biodegradable products upon reaction with NOM (see section B.4.1.3). As a result, biologically active filtration may be necessary to stabilize treated water (see section B.6.2.5). Water utilities should also be aware that all oxidants reduce UV absorbance, which affects SUVA without an associated reduction in NOM concentration.
B.6.3 Treatment performance
Considerable research has been conducted to assess the performance of the treatment options available to remove NOM. However, published full-scale data tends to be limited to chemically assisted filtration, with the exception of the limited data presented in section B.6.2 for UF membranes, ion exchange and biological filtration. As a result, pilot- and bench-scale data are presented in this section for the other treatment options.
The results demonstrate that NOM removal can be variable; hence it is highly recommended that a source-specific treatability study be conducted to assess and compare treatment options (Goss and Gorczyca, 2013; Plourde-Lescelleur et al., 2015; Kastl et al., 2016). In general, if UV254 removal is greater than DOC removal, it can be concluded that the process is preferentially removing high molecular weight and hydrophobic NOM that absorbs UV light; an increase in SUVA after treatment indicates that the process is removing more DOC relative to the reduction in UV absorbance (Lamsal et al., 2012).
B.6.3.1 Full-scale results
Table 8 summarizes the variability in DOC removal achieved at several full-scale chemically assisted filtration plants. Low to zero organic carbon removals are reported for certain periods. Hargesheimer et al. (1994) reported 0% removal at various times during 1993, namely early March, May, August and December. It is possible that these timeframes represent snow cover or base flow conditions with low allochthonous NOM inputs. Carpenter et al. (2013) reported 0% removal in early September 2011 for Plant 1 and in August 2011 for Plant 2. NOM is expected to be generated by autochthonous sources at this time (i.e., late summer) and would likely be hydrophilic in nature. These studies demonstrate that NOM removal by conventional treatment can be variable and that little to no removal may occur, particularly for the hydrophilic neutral fraction (Chow et al., 2006). As noted above, jar testing is recommended to determine the feasibility of optimized coagulation for NOM removal.
| Reference | Source water quality | Treatment processes | TOC/DOC % removal (mean) |
|||
|---|---|---|---|---|---|---|
| ParameterFootnote a | Min | Max | Mean | |||
| Hargesheimer et al., 1994 | TOC | 0.9 | 4.5 | 2.4 | Conventional filtration | 0–28 (8.7) |
| Jacangelo et al., 1995 | DOC | 1.2 | 7.8 | 2.1–3.5Footnote b | Conventional with GAC | 8–48Footnote c |
| Volk et al., 2002Footnote d | DOC | 2.15 | 11.90 | 4.00 | Coagulation, flocculation, clarification | 7.1–66 (34.7) |
| UV254 | 0.037 | 0.830 | 0.118 | |||
| SUVA | 1.40 | 10.51 | 2.81 | |||
| Volk et al., 2002Footnote d | DOC | 2.15 | 11.90 | 4.00 | Conventional with GAC | 16.9–72.9 (41.9) |
| UV254 | 0.037 | 0.830 | 0.118 | |||
| SUVA | 1.40 | 10.51 | 2.81 | |||
| Chow et al., 2005Footnote e | DOC | 8.2Footnote f | 11.8 | Not given | Conventional filtration | 36–57 (47) |
| Chow et al., 2005Footnote e | DOC | 11.6Footnote f | 15.8 | Not given | DAF filtration | 56–65 (62) |
| Carpenter et al., 2013Footnote g | DOC | 0.9 | 2.2 | 1.3 | Direct filtration (Plant 1) | 0–50 (28.2) |
| UV254 | 0.01 | 0.10 | 0.03 | |||
| SUVA | 2.00 | 4.41 | 2.73 | |||
| Carpenter et al., 2013Footnote g | DOC | 0.9 | 2.2 | 1.3 | Direct filtration (Plant 2) | 0–45 (27.9) |
| UV254 | 0.01 | 0.10 | 0.03 | |||
| SUVA | 2.00 | 4.41 | 2.73 | |||
|
||||||
Table 9 summarizes the TOC compliance monitoring data published by the U.S. EPA (2016) as part of its third Six-Year Review. The data represent the TOC removal (in percent) achieved at conventional surface water treatment plants as a function of the influent water quality matrix established by the Disinfectants/DBP Rule. In general, the U.S. EPA concluded that regulated facilities are achieving higher removals than mandated (see section B.8), although some facilities have not been able to achieve removal requirements. The report cautioned that the data analysis could not determine which facilities are permitted to determine alternative performance criteria or which may have treated water TOC less than 2 mg/L (U.S. EPA, 2016). Three earlier studies found that 32 of 69 water sources (46%) with a wide range of water quality (TOC = 2.0–27.0 mg/L; alkalinity = 4–250 mg/L as CaCO3; turbidity = 0.2–151.0 NTU) would not achieve the mandated TOC removal requirements (Krasner and Amy, 1995; White et al., 1997; Archer and Singer, 2006b). The authors suggested that alternative performance criteria would apply for numerous sources.
| Influent TOC (mg/L) |
Influent alkalinity (mg/L CaCO3) | ||
|---|---|---|---|
| 0–60 mg/L | >60–120 mg/L | >120 mg/L | |
| >2–4 | MeanFootnote b 41.7% MedianFootnote c 41.6% |
Mean 35.2% Median 35.1% |
Mean 30.4% Median 30.1% |
| >4–8 | Mean 54.7% Median 54.3% |
Mean 46.8% Median 46.3% |
Mean 44.1% Median 43.9% |
| >8 | Mean 66.2% Median 66.4% |
Mean 46.3% Median 44.2% |
Mean 46.9% Median 47.8% |
|
|||
In full-scale treatment facilities in Nova Scotia, TOC removal was approximately 46% for a direct filtration plant, and ranged from –12% to 82% and from 1% to 77% for the conventional and DAF treatment plants, respectively. Treated water TOC tends to be below 2 mg/L for approximately 60% of the facilities. Colour removal was approximately 72% for a direct filtration plant, and ranged from -113% to 96% and from 38% to 93% for the conventional and DAF treatment plants, respectively. In general, treated water colour is below 15 TCU. However, NOM may remain reactive post-treatment such that DBP guideline limits are not achieved; colour removal to 5–10 TCU may be needed (Chaulk, 2015) or biofiltration (Stoddart and Gagnon, 2015).
B.6.3.2 Pilot-scale results
Table 10 summarizes the results from several pilot-scale studies. Braun et al. (2014) assessed four processes in parallel for a three-year period that included an extended drought and two distinct flood periods. The authors found that the more advanced treatment processes (e.g., ion exchange, GAC, membrane filtration) removed more DOC and were less variable than conventional treatment, with MF/NF achieving the lowest treated water DOC concentrations.
Researchers studying MIEX® (alone or with coagulation) reported a wide variability in DOC removal (see Table 10); removal was reported to be affected by the NOM character (Fearing et al., 2004c; Singer et al., 2007; Braun et al., 2014), with higher DOC removals being observed with increasing SUVA (Singer et al., 2009). Braun et al. (2014) noted that water quality was the best during the drought period, but all treatment processes achieved their lowest organic carbon removal and highest variability during this period. During drought periods, NOM tends to be generated by autochthonous sources and be hydrophilic in nature. This supports the full-scale study results indicating that hydrophilic NOM can be challenging to treat.
Fearing et al. (2004c) highlighted the variability that occurs due to resin dose and contact time. Pilot testing is recommended to determine the optimum configuration to ensure ion exchange will successfully treat a source water (Fearing et al., 2004c).
| Treatment processes | DOC percent removal | Process details | Reference |
|---|---|---|---|
| Conventional filtration | 32–61Footnote a | Alum dose = 20–160 mg/L Coagulation pH = 6.0–6.5 |
Braun et al., 2014 |
| MIEX® | 35–67 | Resin dose = 15–20 mL/L Contact time = 15–20 min |
Singer et al. 2007 |
| 64–74 | Resin dose = 6–8 mL/L Contact time = 15 min |
Drikas et al., 2003 | |
| MIEX® with coagulation | 64–76 | Resin dose = 6 mL/L Contact time = 10–15 min |
Drikas et al., 2003 |
| 10–20 | Resin dose = 2 mL/L Contact time = 10–20 min |
Fearing et al., 2004c | |
| ≈50 | Resin dose = 20 mL/L contact time = 5 min |
Fearing et al., 2004c | |
| 66.1–82.1 | Resin dose = 30 mL/L Contact time = 60 min |
Fearing et al., 2004c | |
| 52–81Footnote a,Footnote b | Resin dose = 15 mL/L Contact time = 10 min |
Braun et al., 2014 | |
| MIEX® with coagulation and GAC | 74–91Footnote a,Footnote b | Resin dose = 15 mL/L Contact time = 10 min |
Braun et al., 2014 |
| MF/NF | 89–97Footnote a,Footnote b | MF size = 0.2 μm (nominal) NF MWCOFootnote c = 270 Da |
Braun et al., 2014 |
|
|||
B.6.3.3 Bench-scale results
Bond et al. (2011) completed a comprehensive review of the literature and summarized the results from numerous bench-scale studies that examined various treatment processes (outlined in Table 11). In these studies, removal percentages were determined for DOC, UV254, THM precursors and HAA precursors. In a few studies, differences between DCAA and trichloroacetic acid (TCAA) formation were also studied. Table 11 also summarizes bench-scale results published by Plourde-Lescelleur et al. (2015) for six Canadian surface water sources. In this study, treatment alternatives were tested in parallel for each surface water upon reception at the laboratory to allow direct comparison of NOM removal.
The differences between THM and HAA precursor removals are clearly demonstrated in Table 11. In cases denoted by negative values, an increase in DBPs occurred as a result of treatment. This tends to occur with ozone or advanced oxidation processes, reiterating the need to carefully study the impacts of applying oxidation for DBP control.
| Process | Percent removal (mean) | ||||
|---|---|---|---|---|---|
| DOC | UV254 | THM precursors | HAA precursors | ||
| Coagulation Bond et al., 2011Footnote a |
17–33 (25) | 3–80 (46) | 7–71 (36) | 15–78 (38) | |
| Plourde-Lescelleur et al., 2015Footnote b Alum Ferric |
26–70 (54) 13–74 (53) |
34–85 (69) 30–88 (68) |
48–83 (70) 44–90 (72) |
48–93 (79) 69–97 (81) |
|
| Ion exchange–coagulation Bond et al., 2011Footnote a |
42–76 (59) | 47–96 (79) | 27–88 (70) | 52–80 (67) | |
| Plourde-Lescelleur et al., 2015Footnote b | 39–75 (63) | 47–90 (77) | 50–92 (76) | 61–97 (84) | |
| NanofiltrationFootnote c Bond et al., 2011Footnote a |
86–93 (90) | 89–99 (96) | 66–98 (87) | 67–99 (87) | |
| Plourde-Lescelleur et al., 2015Footnote b | 77–89 (84) | 79–93 (87) | 75–98 (89) | 88–100 (97) | |
| Pre-ozonation–coagulation Bond et al., 2011Footnote a |
0–30 (15) | 42–69 (60) | 51–66 (57) | 48–76 (66) | |
| Coagulation–ozonation Bond et al., 2011Footnote a |
16–34 (23) | 49–69 (61) | 47–58 (51) | 60–81 (71) | |
| Plourde-Lescelleur et al., 2015Footnote b | 21–69 (54) | 55–93 (82) | 59–90 (78) | 48–97 (80) | |
| Ozonation Bond et al., 2011Footnote a |
8–16 (12) | 28–77 (58) | 0–43 (14) | -50 to 20 (4) | |
| Ozonation–biological sand Bond et al., 2011Footnote a |
Not available | Not available | -5 to 54 (42) | -4 to 68 (51) | |
| Coagulation–PAC Plourde-Lescelleur et al., 2015Footnote b |
58–86 (77) | 57–96 (88) | 73–93 (85) | 91–99 (96) | |
| Ozonation–UV Bond et al., 2011Footnote a |
17–56 (33) | 90–94 (92) | 48–89 (67) | Not available | |
| UV–H2O2 Bond et al., 2011Footnote a |
-11 to 20 (-1) | 20–59 (34) | 8–73 (43) | DCAA -197 to -11 (-79) |
TCAA 6–69 (24) |
| UV–H2O2–biological sand Bond et al., 2011Footnote a |
38–80 (59) | 45–81 (64) | 42–85 (60) | DCAA 3–63 (36) |
TCAA 42–85 (62) |
|
|||||
B.6.4 Distribution system
The biodegradable portion of NOM (i.e., BOM) impacts distribution system water quality by providing a source of nutrients that contributes to bacterial regrowth and biofilm development. Biofilms can provide a habitat for the survival of pathogens of faecal origin that may have passed through drinking water treatment barriers. OPPPs such as Legionella and non-tuberculous mycobacteria (e.g., M. avium, M. intracellulare) are also commonly found in biofilms of piped drinking water supplies (Fricker, 2003; Falkinham, 2015). The potential for the multiplication of OPPPs in distribution system and plumbing system biofilms is of increasing concern to the water industry. In the United States, the most frequently reported cause of outbreaks associated with drinking water is Legionella associated with building plumbing systems (largely in hospitals or health care facilities that fall outside the jurisdiction of water utilities) (Beer et al., 2015).
The impact of organic carbon levels on the growth and survival of OPPPs after drinking water treatment has been investigated. Falkinham et al. (2001) observed higher mycobacterial numbers in distribution system samples than in those collected immediately downstream from treatment facilities, and the increase was correlated with AOC and BDOC levels (r2 = 0.65). M. avium and M. intracellulare were not detected in any water samples collected immediately after treatment; however, they could be recovered in the distribution system and in biofilm samples from water meters on these same systems (Falkinham et al., 2001).
Studies on the effects of organic carbon on OPPP numbers in drinking water distribution systems in the absence of a disinfectant residual have also been conducted in order to provide specific information on the impact of nutrient levels on their growth in biofilms. Norton et al. (2004) reported that M. avium could be recovered from biofilms at nutrient levels as low as 50 µg/L AOC in model distribution systems where no disinfection was applied. Van der Wielen and van der Kooij (2013) observed that gene copies of L. pneumophila were sporadically found in unchlorinated distributed water from surface water and groundwater treatment plants with AOC levels above 10 µg/L and were not observed in systems with AOC levels below 5 µg/L. Wullings et al. (2011) observed that L. pneumophila DNA was detected more frequently in biofilm samples in a distribution system fed with drinking water with a high NOM concentration (8 ppm carbon) than in biofilm samples from a distribution system fed with drinking water having a low NOM concentration (<0.5 ppm carbon).
Collectively, these studies highlight the importance of organic carbon removal and the maintenance of an effective disinfectant residual in order to minimize biofilm development in the distribution system and premise plumbing. Guidance material to assist water utilities to develop control programs for treated drinking water is available elsewhere (LeChevallier and Au, 2004). In general, the most important elements for controlling the growth of bacteria in distribution systems are maintenance of a disinfectant residual, limitation of BOM and corrosion control.
Water utilities should be aware that, when applied as secondary disinfectants, free chlorine and chloramines possess different capabilities in terms of disinfectant power, reactivity with organic and inorganic material, biofilm penetration, potential for DBP formation and potential for nitrification. There is extensive guidance available in other publications to assist water utilities in selecting chemical disinfectants (LeChevallier and Au, 2004; AWWA, 2011a; Health Canada, 2013).
A well-maintained distribution system is a critical component of the source-to-tap or water safety plan approach to provide safe drinking water (Fisher et al., 2000). Distribution system optimization is a complex process involving numerous concomitant goals (e.g., microbial, DBPs, corrosion, physical integrity). Distribution system water quality should be regularly monitored, including indicators of biological stability (see section B.5.3). Operations/maintenance programs should be in place (e.g., water age control, watermain cleaning, cross-connection control, asset management) and strict hygiene should be practiced during watermain repairs to ensure drinking water is transported to the consumer with minimum loss of quality (Kirmeyer et al., 2001, 2014).
B.7 Monitoring and treated water quality targets
Water system owners should collect water quality information to optimize their water treatment processes, meet regulatory requirements related to DBPs, lead and copper, as well as minimize biofilm formation. Site-specific conditions and treatment objectives influence monitoring requirements, including, but not limited to parameter selection, analysis method and frequency. The monitoring frequency is typically based on source variability and/or the critical nature of a treatment process. Highly variable water sources and critical processes should therefore be monitored on a more frequent basis.
Raw water monitoring should be conducted to characterize the source and better understand the conditions that lead to changes in the concentrations and/or character of NOM (e.g., precipitation/snowmelt events, algal blooms, drought, fire), and the factors that enhance the reactivity of NOM to form DBPs (e.g., reaction conditions, water age, inorganic compounds such as ammonia, bromide, iodide and sulphur). Ongoing operational monitoring and treatment optimization will help to ensure that water utilities adequately remove NOM to meet concomitant water quality goals related to microbial protection, DBPs, biological stability and corrosion control. Table C-3.5 suggests parameters and recommends sampling frequencies. Additional guidance is available elsewhere (Kornegay et al., 2000; WHO, 2014).
Once data is collected, it should be analyzed to assess the following:
- if, and how, source water quality is changing (e.g., colour, UV absorbance/transmittance, DOC, SUVA);
- if a correlation exists between raw water DOC and other surrogates used to measure NOM concentration (e.g., colour, UV absorbance, UV transmittance);
- how NOM is impacting water treatment processes (e.g., chemical usage and specific chemical dose/demand) and if control limits should be established;
- how treatment is impacting NOM (e.g., residual NOM concentration, change in SUVA, specific DBP yields, specific colour) and if control limits should be established;
- distribution system impacts (e.g., DBP concentrations, lead/copper concentrations);
- biological stability (e.g., variability in disinfectant residual, biofilm formation rate, changes in corrosion rates); and
- if a correlation exists between treated water NOM surrogates (e.g., DOC, colour, UV absorbance, UV transmittance) and distribution system water quality (e.g., DBPs, specific DBP yields, lead, copper, biological stability).
A continuous improvement process should be in place to ensure water treatment is optimized to achieve water quality goals and maximize public health protection for the full range of water quality conditions. As water utilities should aim to minimize DBP, lead and copper concentrations and control biofilm formation in the distribution system, the aim of the continuous improvement process should be to reduce NOM to the lowest possible concentration. Treated water quality targets are suggested in Table 12 for the surrogate parameters most commonly used to provide an indication of NOM concentrations. Treated water quality targets will be source- and system-specific for the following reasons.
- Some sources can have a higher specific DBP yield (e.g., μg DBP/mg DOC) than other sources, as discussed in section B.4.1.2. This may be due to source-specific differences in NOM character (e.g., some NOM fractions form more DBPs than others) or the presence of inorganic compounds that increase DBP formation rates (e.g., ammonia, bromide, iodide and sulphur). Source-specific DBP yields can be determined as discussed in section B.5.2.3. Sources with higher specific DBP yields are considered more “reactive.”
- Some systems have extensive distribution systems. As noted in section B.4.1.2, a distribution system with a residence time of 7 days and a temperature of >15°C will require a different level of NOM removal to meet DBP guidelines than one with a residence time of 3 days and a temperature of >4°C.
For more reactive sources and extensive distribution systems, water should be treated to more stringent requirements, as there is a greater potential for DBP formation. Less reactive sources have more flexibility with respect to upper control limits for most of the parameters listed in Table 12, with the following exceptions.
- COD: because COD only measures oxidizable organic matter, a highly reactive source with 2 mg/L TOC and a less reactive source with 4 mg/L TOC can have comparable COD concentrations (Stoddart and Gagnon, 2014; Dabrowska, 2016).
- DOC for biological stability: a DOC of less than 1.8 mg/L is suggested to minimize the biofilm formation rate and disinfectant variability regardless of source water quality or secondary disinfectant used for residual control (free chlorine or chloramine) (LeChevallier et al., 2015a, 2015b).
As noted in section B.6.1, multiple treatment processes may be needed to adequately remove NOM for the full range of conditions encountered over the year. A monitoring program as suggested in Table C-3.5 and water quality targets as outlined in Table 12 are critical components of a successful continuous improvement program.
Table 12 is provided as guidance only. As some water sources can be extremely reactive, more stringent water quality targets may be required. It is the water system owner’s responsibly to ensure that NOM is appropriately characterized and adequately removed to achieve water quality goals related to microbial protection, DBPs, biological stability and corrosion control. Water system owners should contact the appropriate drinking water authority in the affected jurisdiction to confirm if specific requirements will apply to their source/system.
| Parameter | Units | Source with higher specific DBP yield or System with extensive distribution system |
Source with lower specific DBP yield |
Reference(s) |
|---|---|---|---|---|
| Colour | TCU | 5–10 | <15 | Chaulk, 2015 |
| UV254 | cm-1 | 0.02–0.04 | 0.02–0.07 | Edzwald and Kaminski, 2009; Elliot, 2017 |
| UV transmittance | Percent | 90–95 | 85–95 | Chaulk, 2015; Elliot, 2017 |
| COD | mg/L O2 | <5 | <5 | EU, 2014; Stoddart and Gagnon, 2014; Dabrowska, 2016 |
| DOC-for DBP control | mg/L C | <2 | <4 | U. S. EPA, 1998 |
| DOC-for biological stability | mg/L C | <1.8 | <1.8 | LeChevallier et al., 2015a, 2015b |
|
O2 = oxygen; C = carbon |
||||
B.8 International considerations
NOM has a fundamental impact on drinking water treatment processes aimed at protecting public health. As a result, some jurisdictions have established regulatory requirements or voluntary targets to minimize its impacts on drinking water quality.
The U.S. EPA (1998) mandates a treatment technique for removal of TOC to reduce the formation of DBPs. It applies to surface water facilities using conventional or lime softening water treatment when the TOC in the source water exceeds 2 mg/L. Performance criteria for the treatment technique are based on the raw water TOC and alkalinity. Utilities with raw water sources containing NOM that is poorly removed by coagulation are permitted to conduct jar testing to determine alternative performance criteria for avoiding the use of excessive alum dosages that result in limited additional TOC removal. The rule requires monitoring of DBPs, disinfectant residuals, TOC and alkalinity. Facilities with alternative performance criteria must also monitor magnesium hardness removal, DOC, UV254 and SUVA. A monitoring plan must be developed and implemented that includes monthly sampling for TOC in the raw water and filter effluent, as well as total THM (i.e., chloroform, bromoform, bromodichloromethane, chlorodibromomethane) and HAA5 monitoring that is representative of the entire distribution system. TOC removal is calculated as a running annual average computed quarterly from monthly samples.
The World Health Organization suggests optimized NOM removal as a means to minimize biofilm growth in the distribution system (WHO, 2011). Organic carbon is also suggested as an operational parameter in water safety plans to monitor control measures.
The European Union drinking water regulations include TOC as a general water quality indicator parameter for supplies ≥10,000 m3/d (EU, 2014). The regulations specify “no abnormal change” as the parametric value. In some jurisdictions, oxidizability (measured as chemical oxygen demand) can be used in place of TOC. A parametric guideline value of 5 mg/L O2 is specified (EU, 2014). French regulations specify guideline limits for treated water intended for human consumption for several chemical and organoleptic parameters, including TOC (i.e., 2 mg/L and no abnormal change) and oxidizability (i.e., 5 mg/L O2) (Government of France, 2007).
The Dutch approach to safe drinking water includes measures to control or limit microbial activity in the distribution system in the absence of a disinfectant residual (Smeets et al., 2009). This requires the production of biologically stable drinking water with an AOC target of below 10 μg/L (van der Kooij, 2000; Smeets et al., 2009; Lautenschlager et al., 2013). Investment in both advanced treatment and distribution system infrastructure is necessary to achieve the AOC target. Groundwater supplies typically use aeration and filtration with GAC in some cases to remove chemical contaminants, followed by UV disinfection to reduce the colony counts after GAC. Locations with high methane concentrations require more aeration, whereas locations with high ammonia concentrations use “dry rapid sand filtration” (e.g., the sand bed is not saturated) to allow more oxygen transfer to the water. Surface water and riverbank filtration systems have unique combinations of multiple treatment processes that may include coagulation–sedimentation, rapid sand filtration, GAC, dune filtration, softening, advanced oxidation or ozonation, membrane filtration (UF and/or RO) and slow sand filtration (Smeets, 2017).
In Australia, guidance has been developed to help water utilities understand and control the impact of NOM within the context of the Australian Drinking Water Guidelines Framework (Cooperative Research Centre for Water Quality and Treatment, 2005).
Part C. References, acronyms and tables
C.1 References
Ågren, A., Buffam, I., Jansson, M. and Laudon, H. (2007). Importance of seasonality and small streams for the landscape regulation of dissolved organic carbon export. J. Geophys. Res. Biogeosci., 112(3), doi:10.1029/2006JG000381.
Aiken, G. and Cotsaris, E. (1995). Soil and hydrology: Their effect on NOM. J. Am. Water Works Assoc., 87(1): 36–45.
Aitkenhead-Peterson, J.A., McDowell, W.H. and Neff, J.C. (2003). Sources, production and regulation of allochthonous dissolved organic matter inputs to surface waters. Chapter 2 in: Aquatic ecosystems: Interactivity of dissolved organic matter. Findlay, S.E.G. and Sinsabaugh, R.L. (eds.). Academic Press, San Diego, California. pp. 25–70.
Alarcon-Herrera, M.T., Bewtra, J.K. and Biswas, N. (1994). Seasonal variations in humic substances and their reduction through water treatment processes. Can. J. Civ. Eng., 21(2): 173–179.
Alspach, B., Delphos, P., Pressman, J., Beaty, J., Cooke, T., Voutchkov, N., Schaefer, J., Noack, R., Marascia, F. and Konstanski, D. (2014). Metrics and methods for MF/UF system optimization. In: Proceedings of the Membrane Technology Conference. American Water Works Association, Denver, Colorado.
Amy, G. (2008). Fundamental understanding of organic matter fouling of membranes. Desalination, 231(1–3): 44–51.
Amy, G. and Cho, J. (1999). Interactions between natural organic matter (NOM) and membranes: Rejection and fouling. Wat. Sci. Tech. 40(9): 131–139.
Amy, G.F., Collins, M.R., Kuo, C.J., Chowdhury, Z.K. and Bales, R.C. (1989). Effect of humic substances on particle formation, growth, and removal during coagulation. Chapter 27 in: Aquatic humic substances: Influence on fate and treatment of pollutants. Suffet, I.H. and MacCarthy, P. (eds.). American Chemistry Society, Washington, DC., pp. 443–452.
Amy, G., Carlson, K., Collins, M.R., Drewes, J., Gruenheid, S. and Jekel, M. (2006). Integrated comparison of biofiltration in engineered versus natural systems. Chapter 1 in: Recent progress in slow sand and alternative biofiltration processes. Gimbel, R., Graham, N.J.D. and Collins, M.R. (eds.). IWA Publishing, London, UK. pp. 3–12.
Anderson, L.E., Krkošek, W.H., Stoddart, A.K., Trueman, B.F. and Gagnon, G.A. (2017). Lake recovery through reduced sulfate deposition: A new paradigm for drinking water treatment. Environ. Sci. Technol., 51(3): 1414–1422.
Appelo, C.A.J. and Postma, D. (1996). Geochemistry, groundwater and pollution. 3rd edition. A.A. Balkema, Rotterdam, Netherlands.
APHA/AWWA/WEF (2012). Standard methods for the examination of water and wastewater. 22nd edition. American Public Health Association, American Water Works Association, Water Environment Federation, Washington, DC. 9711D.
ASTM (2017). Standard test method for phototelectrochemical oxygen demand of freshwater sources for drinking water treatment plants and treated drinking water. ASTM International, West Conshohocken, Pennsylvania.
Archer, A.D. and Singer, P.C. (2006a). Effect of SUVA and enhanced coagulation on removal of TOX precursors. J. Am. Water Works Assoc., 98(8): 97–107.
Archer, A.D. and Singer, P.C. (2006b). An evaluation of the relationship between SUVA and NOM coagulation using the ICR database. J. Am. Water Works Assoc., 98(7): 110–123.
Arnold, R.B., Griffin, A. and Edwards, M. (2012). Controlling copper corrosion in new construction by organic matter removal. J. Am. Water Works Assoc., 104(5): E310–E317.
Ates, N., Kitis, M. and Yetis, U. (2007). Formation of chlorination by-products in waters with low SUVA—correlations with SUVA and differential UV spectroscopy. Water Res., 41(18): 4139–4148.
AWWA (2011a). Water quality and treatment: a handbook of community water supplies. 6th edition. J.K. Edzwald (ed.). McGraw-Hill, New York, New York.
AWWA (2011b). Operational control of coagulation and filtration processes: Manual of water supply practices—M37. 3rd edition. American Water Works Association, Denver, Colorado.
AWWA (2011c). Diagnosing taste and odor problems field guide. American Water Works Association, Denver, Colorado.
Babcock, D.B. and Singer, P.C. (1979). Chlorination and coagulation of humic and fulvic acids. J. Am. Water Works Assoc., 71(3): 149–152.
Bade, D.L., Carpenter, S.R., Cole, J.J., Pace, M.L., Kritzberg, E., Van de Bogert, M.C., Cory, R.M. and McKnight, D.M. (2007). Sources and fates of dissolved organic carbon in lakes as determined by whole-lake carbon isotope additions. Biogeochemistry, 84(2): 115–129.
Batch, L.F., Schulz, C.R. and Linden, K.G. (2004). Evaluating water quality effects on UV disinfection of MS2 coliphage. J. Am. Water Works Assoc., 96(7): 75–87.
Beer, K.D., Gargano, J.W., Roberts, V.A., Hill, V.R., Garrison, L.E., Kutty, P.K., Hilborn, E.D., Wade, T.J., Fullerton, K.E. and Yoder, J.S. (2015). Surveillance for waterborne disease outbreaks associated with drinking water—United States, 2011–2012. Morb. Mortal. Wkly Rep. , 64(31): 842–848.
Bellamy, W.D., Silverman, G.P., Hendricks, D.W. and Logsdon, G.S. (1985a). Removing Giardia cysts with slow sand filtration. J. Am. Water Works Assoc., 77(2): 52–60.
Bellamy, W.D., Hendricks, D.W. and Logsdon, G.S. (1985b). Slow sand filtration: Influences of selected process variables. J. Am. Water Works Assoc., 77(12): 22–66.
Bertilsson, S. and Jones Jr., J.B. (2003). Supply of dissolved organic matter to aquatic ecosystems: Autochthonous sources. Chapter 1 in: Aquatic ecosystems: Interactivity of dissolved organic matter. Findlay, S.E.G. and Sinsabaugh, R.L. (eds.). Academic Press, San Diego, California. pp. 3–24.
Besmer, M.D. and Hammes, F. (2016). Short-term microbial dynamics in a drinking water plant treating groundwater with occasional high microbial loads. Water Res., 107: 11–18.
Besmer, M.D., Weissbrodt, D.G., Kratochvil, B.E., Sigrist, J.A., Weyland, M.S. and Hammes, F. (2014). The feasibility of automated online flow cytometry for in-situ monitoring of microbial dynamics in aquatic ecosystems. Front. Microbiol., 5(JUN): 1–11.
Betancourt, W.Q. and Rose, J.B. (2004). Drinking water treatment processes for removal of Cryptosporidium and Giardia. Vet. Parasitol., 126(1–2): 219–234.
Billica, J.A. and Gertig, K.R. (2000). Optimization of a coagulation process to treat high TOC, low alkalinity water and its impact on filtration performance. In: Proceedings of the AWWA Water Quality Technology Conference, Salt Lake City, Utah. American Water Works Association, Denver, Colorado.
Bize, J., Grenet, B. and Maneglier, H. (1981). Purifying capacity of the alluvial complex bordering a river. Tech. Sci. Munic., 76(7): 393–401.
Black, A.P. and Willems, D.G. (1961). Electrophoretic studies of coagulation for removal of organic color. J. Am. Water Works Assoc., 53(5): 589–604.
Black, A.P. and Christman, R.F. (1963). Characteristics of colored surface waters. J. Am. Water Works Assoc., 55(6): 753–770.
Bolto, B., Dixon, D., Eldridge, R., King, S. and Linge, K. (2002). Removal of natural organic matter by ion exchange. Water Res., 36(20): 5057–5065.
Bolton, J.R. (2013). Ultraviolet applications handbook. 3rd edition. Bolton Photosciences Inc., Edmonton, Alberta.
Bond, T., Goslan, E.H., Parsons, S.A. and Jefferson, B. (2010). Disinfection by-product formation of natural organic matter surrogates and treatment by coagulation, MIEX® and nanofiltration. Water Res., 44(5): 1645–1653.
Bond, T., Goslan, E.H., Parsons, S.A. and Jefferson, B. (2011). Treatment of disinfection by-product precursors. Environ. Technol., 32(1): 1–25.
Bond, T., Goslan, E.H., Parsons, S.A. and Jefferson, B. (2012). A critical review of trihalomethane and haloacetic acid formation from natural organic matter surrogates. Environ. Technol. Reviews, 1(1): 93–113.
Bond, T., Huang, J., Graham, N.J.D. and Templeton, M.R. (2014). Examining the interrelationship between DOC, bromide and chlorine dose on DBP formation in drinking water—A case study. Sci. Total Environ., 470–471: 469–479.
Bourbonniere, R.A. (1989). Distribution patterns of dissolved organic matter fractions in natural waters from eastern Canada. Org. Geochem., 14(1): 97–107.
Braun, K., Fabris, R., Morran, J., Ho, L. and Drikas, M. (2014). Drought to flood: A comparative assessment of four parallel surface water treatments during the 2010–2012 inflows to the Murray–Darling Basin, South Australia. Sci. Total Environ., 488–489(1): 36–45.
Brown, J., Upadhyaya, G., Carter, J., Brown, T. and Lauderdale, C. (2016). North American biofiltration knowledge base. Report number 4459. Water Research Foundation, Denver, Colorado.
Brown, R.A. and Cornwell, D.A. (2011). Impact of anion exchange pre-treatment on downstream processes. Report number 4298. Water Research Foundation, Denver, Colorado.
Budd, G.C., Long, B.W., Edwards-Brandt, J.C., Singer, P.C. and Meisch, M. (2005). Evaluation of MIEX® process impacts on different source waters. Water Research Foundation, Denver, Colorado.
Bursill, D. (2001). Drinking water treatment—understanding the processes and meeting the challenges. Water Sci. Technol. Water Supply, 1(1): 1–7.
Camper, A.K. (2004). Involvement of humic substances in regrowth. Int. J. Food Microbiol., 92(3): 355–364.
Camper, A.K. (2014). Organic matter, pipe materials, disinfectants and biofilms in distribution systems. Chapter 4 in: Microbial growth in drinking-water supplies: Problems, causes, control and research needs. van der Kooij, D. and van der Wielen, P.W.J.J. (eds.). IWA Publishing, London, United Kingdom. pp. 73–94.
Carlson, K.H. and Gregory, D. (2000). Optimizing water treatment with two-stage coagulation. J. Environ. Eng., 126(6): 556–561.
Carpenter, K.D., Kraus, T.E.C., Goldman, J.H., Saraceno, J.F., Downing, B.D., Bergamaschi, B.A., McGhee, G. and Triplett, T. (2013). Sources and characteristics of organic matter in the Clackamas River, Oregon, related to the formation of disinfection by-products in treated drinking water. U.S. Geological Survey Scientific Investigation Report 2013–5001, 78 pp.
Caron, E., Chevrefils Jr., G., Barbeau, B., Payment, P. and Prévost, M. (2007). Impact of microparticles on UV disinfection of indigenous aerobic spores. Water Res., 41(19): 4546–4556.
Carroll, T., King, S., Gray, S.R., Bolto, B.A. and Booker, N.A. (2000). The fouling of microfiltration membranes by NOM after coagulation treatment. Water Res., 34(11): 2861–2868.
CCME (2004). From source to tap: Guidance on the multi-barrier approach to safe drinking water. Canadian Council of Ministers of the Environment, Winnipeg, Manitoba. Available at: www.ccme.ca/assets/pdf/mba_guidance_doc_e.pdf
Chang, E.E., Chiang, P-C., Ko, Y-W. and Lan, W-H. (2001). Characteristics of organic precursors and their relationship with disinfection by-products. Chemosphere, 44(5): 1231–1236.
Chang, Y-C. and Jung, K. (2004). Effect of distribution system materials and water quality on heterotrophic plate counts and biofilm proliferation. J. Microbiol. Biotechnol., 14(6): 1114–1119.
Chaulk, M. (2015). Personal communication. CBCL Limited, Halifax, Nova Scotia.
Chen, F., Peldszus, S., Peiris, R.H., Ruhl, A.S., Mehrez, R., Jekel, M., Legge, R.L. and Huck, P.M. (2014). Pilot-scale investigation of drinking water ultrafiltration membrane fouling rates using advanced data analysis techniques. Water Res., 48(1): 508–518.
Cho, J., Amy, G. and Pellegrino, J. (2000). Membrane filtration of natural organic matter: Factors and mechanisms affecting rejection and flux decline with charged ultrafiltration (UF) membrane. J. Membr. Sci., 164(1–2): 89–110.
Cho, S., Gorczyca, B. and Goss, C.D. (2010). Factors affecting THM formation in a typical prairie water supply system. In: Proceedings of the CSCE 11th International Environmental Specialty Conference, Winnipeg, Manitoba. pp. 751–758.
Chon, K. and Cho, J. (2016). Fouling behavior of dissolved organic matter in nanofiltration membranes from a pilot-scale drinking water treatment plant: An autopsy study. Chem. Eng. J., 295: 268–277.
Chorus, I., Klein, G., Fastner, J. and Rotard, W. (1992). Off-flavors in surface waters—how efficient is bank filtration for their abatement in drinking water? Water Sci. Technol., 25(2): 251–258.
Chow, C.W.K., Fabris, R. and Drikas, M. (2004). A rapid fractionation technique to characterise natural organic matter for the optimisation of water treatment processes. J. Water Supply Res. Technol. Aqua, 53(2): 85–92.
Chow, C.W.K., Fabris, R., Drikas, M. and Holmes, M. (2005). A case study of treatment performance and organic character. J. Water Supply Res. Technol. Aqua, 54(6): 385–395.
Chow, C., Fabris, R., Wilkinson, K., Fitzgerald, F. and Drikas, M. (2006). Characterising NOM to assess treatability. Water, 33(2): 74–85.
Chowdhury, Z., Traviglia, A., Carter, J., Brown, T., Summers, R.S., Corwin, C., Zearley, T., Thurman, M., Ferrara, I., Olson, J., Thacker, R. and Barron, P. (2010). Cost-effective regulatory compliance with GAC biofilters. Report number 4155. Water Research Foundation, Denver, Colorado.
Christensen, J. and Linden, K. (2002). New findings regarding the impacts of suspended particles on UV disinfection of drinking water. In: Proceedings of the Annual Conference of the American Water Works Association, New Orleans, LA. American Water Works Association, Denver, Colorado.
Coffey, B.M., Huck, P.M., Maurizio, D.D., Emelko, M.B., Douglas, I.P. and Van den Oever, J. (1999). The effect of optimizing coagulation on the removal of Cryptosporidium parvum and Bacillus subtilis. In: Proceedings of the AWWA Water Quality Technology Conference, Tampa, Florida. American Water Works Association, Denver, Colorado.
Collins, M.R., Army, G.L. and Steelink, C. (1986). Molecular weight distribution, carboxylic acidity, and humic substances content of aquatic organic matter: Implications for removal during water treatment. Environ. Sci. Technol., 20(10): 1028–1032.
Collins, M.R., Eighmy, T.T. and Malley, Jr., J.P. (1991). Evaluating modifications to slow sand filters. J. Am. Water Works Assoc., 83(9): 62–70.
Collins, M.R., Eighmy, T.T., Fenstermacher Jr., J.M. and Spanos, S.K. (1992). Removing natural organic matter by conventional slow sand filtration. J. Am. Water Works Assoc., 84(5): 80–90.
Conio, O., Chioetto, M. and Hargesheimer, E. (2002). Organic monitors. In: Online monitoring for drinking water utilities. Hargesheimer, E., Conio, O. and Papovicova, J. (eds.). AWWA Research Foundation, Denver, Colorado. pp. 163–202.
Cool, G., Lebel, A., Sadiq, R. and Rodriguez, M.J. (2014). Impact of catchment geophysical characteristics and climate on the regional variability of dissolved organic carbon (DOC) in surface water. Sci. Total Environ., 490: 947–956.
Cooperative Research Centre for Water Quality and Treatment (2005). Natural organic matter: Understanding and controlling the impact on water quality and water treatment processes: Management implications from the Research Programs of the Cooperative Research Centre for Water Quality Treatment.
Croft, J. (2012). Natural organic matter characterization of different source and treated waters; implications for membrane fouling control. M.A. Sc. Thesis, University of Waterloo, Waterloo, Ontario. Available at: https://uwspace.uwaterloo.ca/handle/10012/7107
Cronan, C.S. and Aiken, G.R. (1985). Chemistry and transport of soluble humic substances in forested watersheds of the Adirondack park, New York. Geochim. Cosmochim. Acta, 49(8): 1697–1705.
Croué, J.P., Lefebvre, E., Martin, B. and Legube, B. (1993). Removal of dissolved hydrophobic and hydrophilic organic substances during coagulation/flocculation of surface waters. Water Sci. Technol., 27(11): 143–152.
Curriero, F.C., Patz, J.A., Rose, J.B. and Lele, S. (2001). The association between extreme precipitation and waterborne disease outbreaks in the United States, 1948–1994. Am. J. Public Health, 91(8): 1194–1199.
Curtis, P.J. and Adams, H.E. (1995). Dissolved organic matter quantity and quality from freshwater and saltwater lakes in east-central Alberta. Biogeochemistry, 30(1): 59–76.
Dabrowska, L. (2016). Removal of organic matter from surface water using coagulants with various basicity. J. Ecol. Eng., 17(3): 66–72.
Dai, X. and Hozalski, R.M. (2002). Effect of NOM and biofilm on the removal of Cryptosporidium parvum oocysts in rapid filters. Water Res., 36(14): 3523–3532.
Dalva, M. and Moore, T.R. (1991). Sources and sinks of dissolved organic carbon in a forested swamp catchment. Biogeochemistry, 15(1): 1–19.
Davis, C.C. and Edwards, M. (2014). Coagulation with hydrolyzing metal salts: Mechanisms and water quality impacts. Crit. Rev. Environ. Sci. Technol., 44(4): 303–347.
Delpla, I. and Rodriguez, M.J. (2016). Experimental disinfection by-product formation potential following rainfall events. Water Res., 104: 340–348.
de la Rubia, A., Rodriguez, M., León, V.M. and Prats, D. (2008). Removal of natural organic matter and THM formation potential by ultra- and nanofiltration of surface water. Water Res., 42(3): 714–722.
Dempsey, B.A. (2006). Coagulant characteristics and reactions. Chapter 2 in: Interface science in drinking water treatment—theory and applications. Newcombe, G. and Dixon, D. (eds.). Academic Press, London, United Kingdom. pp. 5–24.
Dempsey, B.A., Ganho, R.M. and O'Melia, C.R. (1984). The coagulation of humic substances by means of aluminum salts. J. Am. Water Works Assoc., 76(4): 141–150.
Di Bernardo, L. and Pereira Tangerino, E. (2006). Removal of humic substances in slow sand and in slow sand/activated carbon filtration using ozone and hydrogen peroxide as pre-oxidants. Chapter 26 in: Recent progress in slow sand and alternative biofiltration processes. Gimbel, R., Graham, N.J.D. and Collins, M.R. (eds.). IWA Publishing, London, United Kingdom. pp. 224–230.
Diem, S., Rudolf Von Rohr, M., Hering, J.G., Kohler, H-E., Schirmer, M. and Von Gunten, U. (2013). NOM degradation during river infiltration: Effects of the climate variables temperature and discharge. Water Res., 47(17): 6585–6595.
Dittmar, T., Koch, B., Hertkorn, N. and Kattner, G. (2008). A simple and efficient method for the solid-phase extraction of dissolved organic matter (SPE-DOM) from seawater. Limnol. Oceanogr. Methods, 6(JUN): 230–235.
Dotson, A. and Westerhoff, P. (2009). Occurrence and removal of amino acids during drinking water treatment. J. Am. Water Works Assoc., 101(9): 101–115.
Drayna, P., McLellan, S.L., Simpson, P., Li, S-H. and Gorelick, M.H. (2010). Association between rainfall and pediatric emergency department visits for acute gastrointestinal illness. Environ. Health Perspect., 118(10): 1439–1443.
Drewes, J.E., Hoppe, C., Oldham, G., McCray, J. and Thompson, K. (2009). Removal of bulk organic matter, organic micropollutants, and nutrients during riverbank filtration. Report number 3180. Water Research Foundation, Denver, Colorado.
Drikas, M., Chow, C.W.K. and Cook, D. (2003). The impact of recalcitrant organic character on disinfection stability, trihalomethane formation and bacterial regrowth: An evaluation of magnetic ion exchange resin (MIEX®) and alum coagulation. J. Water Supply Res. Technol. Aqua, 52(7): 475–487.
Driscoll, C.T., Driscoll, K.M., Roy, K.M. and Mitchell, M.J. (2003). Chemical response of lakes in the Adirondack region of New York to declines in acidic deposition. Environ. Sci. Technol., 37(10): 2036–2042.
Dryer, D.J. and Korshin, G.V. (2007). Investigation of the reduction of lead dioxide by natural organic matter. Environ. Sci. Technol., 41(15): 5510–5514.
Dugan, N.R., Fox, K.R., Owens, J.H. and Miltner, R.J. (2001). Controlling Cryptosporidium oocysts using conventional treatment. J. Am. Water Works Assoc., 93(12): 64–76.
Eckhardt, B.W. and Moore, T.R. (1990). Controls on dissolved organic carbon concentrations in streams, Southern Quebec. Can. J. Fish. Aquat. Sci., 47(8): 1537–1544.
Edwards, G.A. and Amirtharajah, A. (1985). Removing color caused by humic acids. J. Am. Water Works Assoc., 77(3): 50–57.
Edwards, M. and Sprague, N. (2001). Organic matter and copper corrosion by-product release: A mechanistic study. Corros. Sci., 43(1): 1–18.
Edwards, M. and McNeill, L.S. (2002). Effect of phosphate inhibitors on lead release from pipes. J. Am. Water Works Assoc., 94(3): 79–90.
Edzwald, J.K. (1993). Coagulation in drinking water treatment: Particles, organics and coagulants. Water Sci. Technol., 27(11): 21–35.
Edzwald, J.K. (2010). Dissolved air flotation and me. Water Res., 44(7): 2077–2106.
Edzwald, J.K. (2017). Personal communication. Clarkson University, Potsdam, New York.
Edzwald, J.K. and Van Benschoten, J.E. (1990). Aluminum coagulation of natural organic matter. In: Chemical water and wastewater treatment. In: Proceedings of the 4th Gothenburg Symposium, Madrid, Spain. pp. 341–359.
Edzwald, J.K. and Kelley, M.B. (1998). Control of Cryptosporidium: From reservoirs to clarifiers to filters. Water Sci. Technol., 37(2): 1–8.
Edzwald, J.K. and Tobiason, J.E. (1999). Enhanced coagulation: US requirements and a broader view. Wat. Sci. Tech., 40(9): 63–70.
Edzwald, J.K. and Kaminski, G.S. (2009). A practical method for water plants to select coagulant dosing. J. N. Engl. Water Works Assoc., 123(1): 15–31.
Edzwald, J.K. and Haarhoff, J. (2012). Dissolved air flotation for water clarification. McGraw Hill, New York.
Edzwald, J.K., Becker, W.C. and Wattier, K.L. (1985). Surrogate parameters for monitoring organic matter and THM precursors. J. Am. Water Works Assoc., 77(4): 122–131.
Edzwald, J.K., Tobiason, J.E., Parento, L.M, Kelley, M.B., Kaminski, G.S., Dunn, H.J. and Gallant, P.B. (1999). Clarification and filtration performance for removal of Giardia and Cryptosporidium. In: Proceedings of the AWWA Water Quality Technology Conference, Tampa, Florida. American Water Works Association, Denver, Colorado.
Edzwald, J.K., Tobiason, J.E., Parento, L.M., Kelley, M.B., Kaminski, G.S., Dunn, H.J. and Galant, P.B. (2000). Giardia and Cryptosporidium removals by clarification and filtration under challenge conditions. J. Am. Water Works Assoc., 92(12): 70–84.
Edzwald, J.K., Tobiason, J.E., Udden, C.T., Kaminski, G.S., Dunn, H.J., Gallant, P.B. and Kelley, M.B. (2003). Evaluation of the effect of recycle of waste filter backwash water on plant removals of Cryptosporidium. J. Water Supply Res. Technol. Aqua, 52(4): 243–258.
Eikebrokk, B. and Saltnes, T. (2001). Removal of natural organic matter (NOM) using different coagulants and lightweight expanded clay aggregate filters. Water Sc. Technol. Water Supply, 1(2): 131–140.
Eikebrokk, B., Vogt, R.D. and Liltved, H. (2004). NOM increase in northern European source waters: Discussion of possible causes and impacts on coagulation/contact filtration processes. Water Sci. Technol. Water Supply, 4(4): 47–54.
Eikebrokk, B., Juhna, T. and Østerhus, S.W. (2006). Water treatment by enhanced coagulation: Operational status and optimization issues. Techneau D 5.3.1a, 107 pp.
Ekström, S.M., Kritzberg, E.S., Kleja, D.B., Larsson, N., Nilsson, P.A., Graneli, W. and Bergkvist, B. (2011). Effect of acid deposition on quantity and quality of dissolved organic matter in soil-water. Environ. Sci. Technol., 45(11): 4733–4739.
Elhadidy, A.M., Van Dyke, M.I., Peldszus, S. and Huck, P.M. (2016). Application of flow cytometry to monitor assimilable organic carbon (AOC) and microbial community changes in water. J. Microbiol. Methods, 130: 154–163.
Elliot, J. (2017). Personal communication. City of Ottawa, Ontario.
Emelko, M. B., Huck, P. M., and Slawson, R. M. (1999). Design and operational strategies for optimizing Cryptosporidium removal by filters. In: Proceedings of the AWWA Water Quality Technology Conference, Tampa, Florida. American Water Works Association, Denver, Colorado.
Emelko, M.B., Huck, P.M., Coffey, B.M. and Smith, E.F. (2006). Effects of media, backwash, and temperature on full-scale biological filtration. J. Am. Water Works Assoc., 98(12): 61–73.
Environment Canada (2017). National long-term water quality monitoring data. Available at: http://donnees.ec.gc.ca/data/substances/monitor/national-long-term-water-quality-monitoring-data/
Escobar, I.C. and Randall, A.A. (2001). Assimilable organic carbon (AOC) and biodegradable dissolved organic carbon (BDOC): Complementary measurements. Water Res., 35(18): 4444–4454.
EU (2014). European Union (Drinking Water) Regulations 2014, Statutory Instruments. S.I. No. 122 of 2014. Available at: www.fsai.ie/uploadedFiles/Legislation/Food_Legisation_Links/Water/SI122_2014.pdf
Evans, C.D., Monteith, D.T. and Cooper, D.M. (2005). Long-term increases in surface water dissolved organic carbon: Observations, possible causes and environmental impacts. Environ. Pollut., 137(1): 55–71.
Evans, P.J., Smith, J.L., LeChevallier, M.W., Schneider, O.D., Weinrich, L.A. and Jjemba, P.K. (2013a). Biological filtration monitoring and control toolbox: Guidance manual. Report number 4231a. Water Research Foundation, Denver, Colorado.
Evans, P.J., Smith, J.L., LeChevallier, M.W., Schneider, O.D., Weinrich, L.A. and Jjemba, P.K. (2013b). A monitoring and control toolbox for biological filtration. Report number 4231. Water Research Foundation, Denver, Colorado.
Fabris, R., Lee, E.K., Chow, C.W.K., Chen, V. and Drikas, M. (2007). Pre-treatments to reduce fouling of low pressure micro-filtration (MF) membranes. J. Membr. Sci., 289(1–2): 231–240.
Fabris, R., Chow, C.W.K., Drikas, M. and Eikebrokk, B. (2008). Comparison of NOM character in selected Australian and Norwegian drinking waters. Water Res., 42(15): 4188–4196.
Falkinham III, J.O., Norton, C.D. and Lechevallier, M.W. (2001). Factors influencing numbers of Mycobacterium avium, Mycobacterium intracellulare, and other Mycobacteria in drinking water distribution systems. Appl. Environ. Microbiol., 67(3): 1225–1231.
Falkinham, J.O. (2015). Common features of opportunistic premise plumbing pathogens. Int. J. Environ. Res. Public Health, 12(5): 4533–4545.
Fan, L., Harris, J.L., Roddick, F.A. and Booker, N.A. (2001). Influence of the characteristics of natural organic matter on the fouling of microfiltration membranes. Water Res., 35(18): 4455–4463.
Fearing, D.A., Banks, J., Wilson, D., Hillis, P.H., Campbell, A.T. and Parsons, S.A. (2004a). NOM control options: The next generation. Water Sci. Technol. Water Supply, 4(4): 139–145.
Fearing, D.A., Goslan, E.H., Banks, J., Wilson, D., Hillis, P., Campbell, A.T. and Parsons, S.A. (2004b). Staged coagulation for treatment of refractory organics. J. Environ. Eng., 130(9): 975–982.
Fearing, D.A., Banks, J., Guyetand, S., Eroles, C.M., Jefferson, B., Wilson, D., Hillis, P., Campbell, A.T. and Parsons, S.A. (2004c). Combination of ferric and MIEX® for the treatment of a humic rich water. Water Res., 38(10): 2551–2558.
Fischer, H. (2003). The role of biofilms in the uptake and transformation of dissolved organic matter. Chapter 12 in: Aquatic Ecosystems: Interactivity of dissolved organic matter. Findlay, S.E.G. and Sinsabaugh, R.L. (eds.). Academic Press, San Diego, California. pp. 285–313.
Fisher, I., Angles, M., Chandy, J., Cox, P., Warnecke, M., Kastl, G. and Jegatheesan, V. (2000). Biofilms - a sticky situation for drinking water? Water (Australia), 27(2): 33–37.
Fricker, C.R. (2003). The presence of bacteria in water after regrowth. In: Heterotrophic plate counts and drinking-water safety. The significance of HPCs for water quality and human health. Bartram, J., Cotruvo, J., Exner, M., Fricker, C. and Glasmacher, A. (eds.). IWA Publishing, London, United Kingdom. pp. 137–145.
Frisch, N.W. and Kunin, R. (1960). Organic fouling of anion-exchange resins. J. Am. Water Works Assoc., 52(7): 875–887.
Fu, P.L.K. and Symons, J.M. (1990). Removing aquatic organic substances by anion exchange resins. J. Am. Water Works Assoc., 82(10): 70–77.
Ghosh, K. and Schnitzer, M. (1980). Macromolecular structures of humic substances. Soil Sci., 129(5): 266–276.
Gibert, O., Lefèvre, B., Fernández, M., Bernat, X., Paraira, M., Calderer, M. and Martínez-Lladó, X. (2013a). Characterising biofilm development on granular activated carbon used for drinking water production. Water Res., 47(3): 1101–1110.
Gibert, O., Lefèvre, B., Fernández, M., Bernat, X., Paraira, M. and Pons, M. (2013b). Fractionation and removal of dissolved organic carbon in a full-scale granular activated carbon filter used for drinking water production. Water Res., 47(8): 2821–2829.
Gilmore, P.L. and Summers, R.S. (2015). Organic matter removal via biological drinking water filters: removal efficacy based on quantifiable system factors. In: Proceedings of the AWWA Water Quality Technology Conference, Salt Lake City, Utah. American Water Works Association, Denver, Colorado.
GLUMRB (2012). Recommended standards for water works. Health Education Services, Great Lakes – Upper Mississippi River Board of State and Provincial Public Health and Environmental Managers, Albany, New York.
Goslan, E.H., Fearing, D.A., Banks, J., Wilson, D., Hillis, P., Campbell, A.T. and Parsons, S.A. (2002). Seasonal variations in the disinfection by-product precursor profile of a reservoir water. J. Water Supply Res. Technol. Aqua, 51(8): 475–482.
Goss, C.D. and Gorczyca, B. (2013). Trihalomethane formation potential of DOC fractions isolated from two Canadian Prairie surface water sources. Water Sci. Technol. Water Supply, 13(1): 114–122.
Goss, C.D., Brezinski, K., Epp, T. and Gorczyca, B. (2015). Monitoring the natural organic matter composition of surface waters using simple solid phase extraction method. In: Proceedings of the IWA Specialist Conference on Natural Organic Matter in Drinking Water, Malmo, Sweden.
Goss, C.D., Wiens, R., Gorczyca, B. and Gough, K.M. (2017). Comparison of three solid phase extraction sorbents for the isolation of THM precursors from Manitoban surface waters. Chemosphere, 168: 917–924.
Gottinger, A.M., McMartin, D.W., Price, D. and Hanson, B. (2011). The effectiveness of slow sand filters to treat Canadian rural prairie water. Can. J. Civ. Eng., 38(4): 455–463.
Government of France (2007). Journal Officiel de la République Francaise (JORF), 31(6): 2180. Available at: www.legifrance.gouv.fr/affichTexte.do?cidTexte=JORFTEXT000000465574&dateTexte=&categorieLien=id
Graham, N.J.D. (1999). Removal of humic substances by oxidation/biofiltration processes - A review. Water Sci. Technol., 40(9): 141–148.
Gregor, J.E., Nokes, C.J. and Fenton, E. (1997). Optimising natural organic matter removal from low turbidity waters by controlled pH adjustment of aluminium coagulation. Water Res., 31(12): 2949–2958.
Gregory, D. (1998). Enhanced coagulation for treating spring runoff water. Opflow, 24(2): 12–13.
Gregory, R. and Edzwald, J. K. (2011). Sedimentation and flotation. Chapter 9 in: Water quality and treatment. J. K. Edzwald (ed.). McGraw Hill, New York. pp. 9.1–9.98
Grieve, I.C. (1994). Dissolved organic carbon dynamics in two streams draining forested catchments at Loch Ard, Scotland. Hydrol. Process., 8(5): 457–464.
Haist-Gulde, B. and Happel, O. (2012). Removal of pesticides and their ionic degradates by adsorptive processes. Report number 4022. Water Research Foundation, Denver, Colorado.
Hall, E.S. and Packham, R.F. (1965). Coagulation of organic color with hydrolyzing coagulants. J. Am. Water Works Assoc., 57(9): 1149–1166.
Hallé, C., Huck, P.M., Peldszus, S., Haberkamp, J. and Jekel, M. (2009). Assessing the performance of biological filtration as pretreatment to low pressure membranes for drinking water. Environ. Sci. Technol., 43(10): 3878–3884.
Hammes, F. and Egli, T. (2010). Cytometric methods for measuring bacteria in water: Advantages, pitfalls and applications. Anal. Bioanal. Chem., 397(3): 1083–1095.
Hammes, F., Goldschmidt, F., Vital, M., Wang, Y. and Egli, T. (2010). Measurement and interpretation of microbial adenosine tri-phosphate (ATP) in aquatic environments. Water Res., 44(13): 3915–3923.
Hammes, F., Broger, T., Weilenmann, H-U., Vital, M., Helbing, J., Bosshart, U., Huber, P., Odermatt, R.P. and Sonnleitner, B. (2012). Development and laboratory-scale testing of a fully automated online flow cytometer for drinking water analysis. Cytometry Part A, 81 A(6): 508–516.
Hanson, P.C., Hamilton, D.P., Stanley, E.H., Preston, N., Langman, O.C. and Kara, E.L. (2011). Fate of allochthonous dissolved organic carbon in lakes: A quantitative approach. PLoS One, 6(7): e21884. https://doi.org/10.1371/journal.pone.0021884.
Hargesheimer, E.E., Satchwill, T. and Beese, G. (1994). Evaluation of total organic carbon removal and disinfection by-product control strategies. In: Proceedings of the Sixth National Conference on Drinking Water, Victoria, British Columbia.
Hargy, T. and Landry, L. (2007). An evaluation of the effects of Coquitlam source water turbidity on ozone and UV disinfection. In: Proceedings of the AWWA Water Quality Technology Conference, Charlotte, North Carolina. American Water Works Association, Denver, Colorado.
Harrington, G. W., Chen, H-W., Harris, A. J., Xagoraraki, I., Battigelli, D. A. and Standridge, J. H. (2001). Removal of emerging waterborne pathogens. AWWA Research Foundation and American Water Works Association, Denver, Colorado.
Hassler, W.W. (1947). Taste and odor control in water purification. Githens-Sohl Corporation, New York.
Health Canada (2006). Guidelines for Canadian drinking water quality: Guideline technical document—Trihalomethanes. Water Quality and Health Bureau, Healthy Environments and Consumer Safety Branch, Health Canada, Ottawa, Ontario. Available at: https://www.canada.ca/en/health-canada/services/publications/healthy-living/guidelines-canadian-drinking-water-quality-trihalomethanes.html
Health Canada (2008a). Guidelines for Canadian drinking water quality: Guideline technical document—Haloacetic acids. Water Quality and Health Bureau, Healthy Environments and Consumer Safety Branch, Health Canada, Ottawa, Ontario. Available at: https://www.canada.ca/en/health-canada/services/publications/healthy-living/guidelines-canadian-drinking-water-quality-guideline-technical-document-haloacetic-acids.html
Health Canada (2008b). Guidelines for Canadian drinking water quality: Guideline technical document—Chlorite and chlorate. Water Quality and Health Bureau, Healthy Environments and Consumer Safety Branch, Health Canada, Ottawa, Ontario. Available at: https://www.canada.ca/en/health-canada/services/publications/healthy-living/guidelines-canadian-drinking-water-quality-guideline-technical-document-chlorite-chlorate.html
Health Canada (2009a). Guidelines for Canadian drinking water quality: Guideline technical document—Chlorine. Water Quality and Health Bureau, Healthy Environments and Consumer Safety Branch, Health Canada, Ottawa, Ontario. Available at: www.canada.ca/en/health-canada/services/publications/healthy-living/guidelines-canadian-drinking-water-quality-chlorine-guideline-technical-document.html
Health Canada (2009b). Guidance on controlling corrosion in drinking water distribution systems. Water Quality and Health Bureau, Healthy Environments and Consumer Safety Branch, Health Canada, Ottawa, Ontario. Available at: www.canada.ca/en/health-canada/services/ publications/ healthy-living/guidance-controlling-corrosion-drinking-water-distribution-systems.html
Health Canada (2011). Guidelines for Canadian drinking water quality: Guideline technical document—N-nitrosodimethylamine (NDMA). Water Quality and Health Bureau, Healthy Environments and Consumer Safety Branch, Health Canada, Ottawa, Ontario. Available at: www.canada.ca/en/health-canada/services/publications/healthy-living/guidelines-canadian-drinking-water-quality-guideline-technical-document-n-nitrosodimethylamine-ndma.html
Health Canada (2013). Guidance on the use of the microbiological drinking water quality guidelines. Water and Air Quality Bureau, Healthy Environments and Consumer Safety Branch, Health Canada, Ottawa, Ontario. Available at: www.hc-sc.gc.ca/ewh-semt/pubs/water-eau/micro/index-eng.php
Health Canada (2016a). Personal communication with Anca-Maria Tugulea.
Health Canada (2016b). Guidelines for Canadian drinking water quality: Manganese in drinking water. Document for public consultation. Water and Air Quality Bureau, Healthy Environments and Consumer Safety Branch, Health Canada, Ottawa, Ontario. Available at: www.canada.ca/ content/dam/canada/health-canada/migration/healthy-canadians/health-system-systeme-sante/consultations/manganese/alt/manganese-eng.pdf
Health Canada (2017). Guidelines for Canadian drinking water quality: Lead in drinking water. Document for public consultation. Water and Air Quality Bureau, Healthy Environments and Consumer Safety Branch, Health Canada, Ottawa, Ontario. Available at: www.canada.ca/ en/health-canada/programs/consultation-lead-drinking-water/document.html
Health Canada (2018a). Guidelines for Canadian drinking water quality: Guideline technical document—Bromate. Water and Air Quality Bureau, Healthy Environments and Consumer Safety Branch, Health Canada, Ottawa, Ontario. Available at: https://www.canada.ca/en/health-canada/services/publications/healthy-living/guidelines-canadian-drinking-water-quality-guideline-technical-document-bromate.html
Health Canada (2018b). Guidance on the use of quantitative microbial risk assessment in drinking water. Document for public consultation. Water and Air Quality Bureau, Healthy Environments and Consumer Safety Branch, Health Canada, Ottawa, Ontario. Available at: www.canada.ca/en/health-canada/programs/consultations-guidance-quantitative-microbial-risk-assessment-drinking-water.html
Health Canada (2018c). Guidelines for Canadian drinking water quality: Guideline technical document—Copper. Document for public consultation. Water and Air Quality Bureau, Healthy Environments and Consumer Safety Branch, Health Canada, Ottawa, Ontario. Available at: www.canada.ca/en/health-canada/programs/consultation-copper-drinking-water.html
Heeb, M.B., Criquet, J., Zimmermann-Steffens, S.G. and Von Gunten, U. (2014). Oxidative treatment of bromide-containing waters: Formation of bromine and its reactions with inorganic and organic compounds—A critical review. Water Res., 48(1): 15–42.
Henderson, R.K., Baker, A., Parsons, S.A. and Jefferson, B. (2008). Characterisation of algogenic organic matter extracted from cyanobacteria, green algae and diatoms. Water Res., 42(13): 3435-3445.
Hendricks, D.W., Clunie, W.F., Sturbaum, G.D., Klein, D.A., Champlin, T.L., Kugrens, P., Hirsch, J., McCourt, B., Nordby, G.R., Sobsey, M.D., Hunt, D.J. and Allen, M.J. (2005). Filtration removals of microorganisms and particles. J. Environ. Eng., 131(12): 1621–1632.
Her, N., Amy, G., Plottu-Pecheux, A. and Yoon, Y. (2007). Identification of nanofiltration membrane foulants. Water Res., 41(17): 3936–3947.
Hijnen, W.A.M. and Medema, G. (2007). Microbial elimination capacity of conventional water treatment for viruses, bacteria and protozoan (oo)cysts. In: Proceedings of the AWWA Water Quality Technology Conference, Charlotte, North Carolina. American Water Works Association, Denver, Colorado.
Hoehn, R.C., Barnes, D.B., Thompson, B.C., Randall, C.W., Grizzard, T.J. and Shaffer, T.B. (1980). Algae as sources of trihalomethane precursors. J. Am. Water Works Assoc., 72(6): 344–350.
Hofmann, R. (2008). Ultraviolet disinfection: Everything you need to know but were afraid to ask. Drinking Water Research Group.
Howe, A.D., Forster, S., Morton, S., Marshall, R., Osborn, K.S., Wright, P. and Hunter, P.R. (2002). Cryptosporidium oocysts in a water supply associated with a cryptosporidiosis outbreak. Emerg. Infect. Dis., 8(6): 619–624.
Hrudey, S.E., Rector, D. and Motkosky, N. (1992). Characterization of drinking water odour arising from spring thaw for an ice-covered upland river source. Water Sci. Technol., 25(2): 65–72.
Hua, G. and Reckhow, D.A. (2007a). Characterization of disinfection byproduct precursors based on hydrophobicity and molecular size. Environ. Sci. Technol., 41(9): 3309–3315.
Hua, G. and Reckhow, D.A. (2007b). Comparison of disinfection byproduct formation from chlorine and alternative disinfectants. Water Res., 41(8): 1667–1678.
Hua, G., Kim, J. and Reckhow, D.A. (2014). Disinfection byproduct formation from lignin precursors. Water Res., 63: 285–295.
Hua, G., Reckhow, D.A. and Abusallout, I. (2015). Correlation between SUVA and DBP formation during chlorination and chloramination of NOM fractions from different sources. Chemosphere, 130: 82–89.
Huber, S.A., Balz, A., Abert, M. and Pronk, W. (2011). Characterisation of aquatic humic and non-humic matter with size-exclusion chromatography–organic carbon detection–organic nitrogen detection (LC-OCD-OND). Water Res., 45(2): 879–885.
Huck, P.M. and Coffey, B.M. (2004). The importance of robustness in drinking-water systems. J. Toxicol. Environ. Health–Part A, 67(20–22): 1581–1590.
Huck, P. and Sozański, M. (2011). Chemical basis for water technology. Chapter 3.16 in: Treatise on water science. Wilderer, P. (ed.). Elsevier, Oxford, United Kingdom. pp. 429–469.
Huck, P.M., Emelko, M.B., Coffey, B.M., Maurizio, D. and O’Melia, C. (2001). Filter operation effects on pathogen passage. Report number 90874. AWWA Research Foundation, Denver, Colorado.
Huck, P.M., Coffey, B.M., Emelko, M.B., Maurizio, D.D., Slawson, R.M., Anderson, W.B., Van den Oever, J., Douglas, I.P. and O'Melia, C.R. (2002). Effects of filter operation on Cryptosporidium removal. J. Am. Water Works Assoc., 94(6): 97–111.
Humbert, H., Gallard, H., Suty, H. and Croué, J-P. (2008). Natural organic matter (NOM) and pesticides removal using a combination of ion exchange resin and powdered activated carbon (PAC). Water Res., 42(6–7): 1635–1643.
Hurst, A.M., Edwards, M.J., Chipps, M., Jefferson, B. and Parsons, S.A. (2004). The impact of rainstorm events on coagulation and clarifier performance in potable water treatment. Sci. Total Environ., 321(1–3): 219–230.
Hwang, C.J., Krasner, S.W., Sclimenti, M.J., Amy, G.L., Dickenson, E., Bruchet, A., Prompsy, C., Filippi, G., Croué. J-P., Violleau, D. and Leenheer, J.A. (2001). Polar NOM: characterization, DBPs, treatment. Report number 90877. AWWA Research Foundation, Denver, Colorado.
Imai, A., Fukushima, T., Matsushige, K. and Hwan Kim, Y. (2001). Fractionation and characterization of dissolved organic matter in a shallow eutrophic lake, its inflowing rivers, and other organic matter sources. Water Res., 35(17): 4019–4028.
Ivančev-Tumbas, I. (2014). The fate and importance of organics in drinking water treatment: A review. Environ. Sci. Pollut. Res., 21(20): 11794–11810.
Jabur, H.S. (2006). The effect of water temperature on the slow sand filter process. Chapter 9 in: Recent progress in slow sand and alternative biofiltration processes. Gimbel, R., Graham, N.J.D., and Collins, M.R. (eds.). IWA Publishing, London, United Kingdom. pp. 74–77.
Jacangelo, J.G., DeMarco, J., Owen, D.M. and Randtke, S.J. (1995). Selected processes for removing NOM: An overview. J. Am. Water Works Assoc., 87(1): 64–77.
Jacangelo, J.G., Trussell, R.R. and Watson, M. (1997). Role of membrane technology in drinking water treatment in the United States. Desalination, 113(2–3): 119–127.
James, W., Craik, S., Shu, T., Solomynko, G. and Xie, T. (2016). Using zeta potential to determine coagulant and polymer dosage. Environmental Science & Engineering magazine, April: 58–61.
Juhna, T. and Melin, E. (2006). Ozonation and biofiltration in water treatment—Operational status and optimization issues. Techneau D 5.3.1 B, 79 p.
Kalbitz, K., Solinger, S., Park, J-H., Michalzik, B. and Matzner, E. (2000). Controls on the dynamics of dissolved organic matter in soils: A review. Soil Sci., 165(4): 277–304.
Kalbitz, K., Kaiser, K., Bargholz, J. and Dardenne, P. (2006). Lignin degradation controls the production of dissolved organic matter in decomposing foliar litter. Eur. J. Soil Sci., 57(4): 504–516.
Karanfil, T., Schlautman, M.A. and Erdogan, I. (2002). Survey of DOC and UV measurement practices with implications for SUVA determination. J. Am. Water Works Assoc., 94(12): 68–80.
Karanfil, T., Erdogan, I. and Schlautman, M. (2005). The role of filtration in DOC, UV-254 and SUVA-254 determinations. Report number 91060F. AWWA Research Foundation, Denver, Colorado.
Karanfil, T., Cheng, W., Guo, Y., Dastgheib, S.A. and Song, H. (2007). DBP formation control by modified activated carbons. Report number 91181. AWWA Research Foundation, Denver, Colorado.
Kastl, G., Sathasivan, A. and Fisher, I. (2016). A selection framework for NOM removal process for drinking water treatment. Desalin. Water Treat., 57(17): 7679–7689.
Kavanaugh, M.C. (1978). Modified coagulation for improved removal of trihalomethane precursors. J. Am. Water Works Assoc., 70(11): 613–620.
Kennedy, M.D., Kamanyi, J., Heijman, B.G.J. and Amy, G. (2008). Colloidal organic matter fouling of UF membranes: Role of NOM composition & size. Desalination, 220(1–3): 200–213.
Kent, F.C., Montreuil, K.R., Stoddart, A.K., Reed, V.A. and Gagnon, G.A. (2014). Combined use of resin fractionation and high performance size exclusion chromatography for characterization of natural organic matter. J. Environ. Sci. Health A, 49(14): 1615–1622.
Kerekes, J., Howell, G., Beauchamp, S. and Pollock, T. (1982). Characterization of three lake basins sensitive to acid precipitation in central Nova Scotia (June, 1979 to May, 1980). Int. Revue ges. Hydrobiol., 67(5): 679–694.
Kimura, K., Hane, Y., Watanabe, Y., Amy, G. and Ohkuma, N. (2004). Irreversible membrane fouling during ultrafiltration of surface water. Water Res., 38(14–15): 3431–3441.
Kimura, K., Tanaka, K. and Watanabe, Y. (2014). Microfiltration of different surface waters with/without coagulation: Clear correlations between membrane fouling and hydrophilic biopolymers. Water Res., 49: 434–443.
Kirmeyer, G.J., Friedman, M., Martel, K., Howie, D., LeChevallier, M., Abbaszadegan, M., Karim, M., Funk J. and Harbour, J. (2001). Pathogen intrusion into the distribution system. Report number 90835. AWWA Research Foundation and American Water Works Association, Denver, Colorado.
Kirmeyer, G.J., Thomure, T.M., Rahman, R., Marie, J.L, LeChevallier, M.W., Yang, J., Hughes, D.M. and Schneider, O. (2014). Effective microbial control strategies for main breaks and depressurization. Report number 4037a. Water Research Foundation, Denver, Colorado.
Kollu, K. and Örmeci, B. (2012). Effect of particles and bioflocculation on ultraviolet disinfection of Escherichia coli. Water Res., 46(3): 750–760.
Kornegay, B.H., Kornegay, K.J. and Torres, E. (2000). Natural organic matter in drinking water: Recommendations to water utilities. AWWA Research Foundation and American Water Works Association, Denver, Colorado.
Korshin, G.V., Perry, S.A.L. and Ferguson, J.F. (1996). Influence of NOM on copper corrosion. J. Am. Water Works Assoc., 88(7): 36–47.
Korshin, G.V., Ferguson, J.F. and Lancaster, A.N. (2000). Influence of natural organic matter on the corrosion of leaded brass in potable water. Corros. Sci., 42(1): 53–66.
Korshin, G.V., Ferguson, J.F. and Lancaster, A.N. (2005). Influence of natural organic matter on the morphology of corroding lead surfaces and behavior of lead-containing particles. Water Res., 39(5): 811–818.
Koudjonou, B., Prévost, M. and Merlet, N. (2005). Characterization of organic matter in water resources and supplies. Chapter 1 in: Biodegradable organic matter in drinking water treatment and distribution. Prévost, M., Laurent, P., Servais, P. and Joret, J-C., (eds.). American Water Works Association, Denver, Colorado. pp. 1–29.
Krasner, S.W. and Amy, G.L. (1995). Jar-test evaluations of enhanced coagulation. J. Am. Water Works Assoc., 87(10): 93–107.
Kraus, T.E.C., Anderson, C.A., Morgenstern, K., Downing, B.D., Pellerin, B.A. and Bergamaschi, B.A. (2010). Determining sources of dissolved organic carbon and disinfection byproduct precursors to the McKenzie River, Oregon. J. Environ. Qual., 39(6): 2100–2112.
Kristiana, I., Gallard, H., Joll, C. and Croué, J-P. (2009). The formation of halogen-specific TOX from chlorination and chloramination of natural organic matter isolates. Water Res., 43(17): 4177–4186.
Kritzberg, E.S. and Ekström, S.M. (2012). Increasing iron concentrations in surface waters—A factor behind brownification? Biogeosciences, 9(4): 1465–1478.
Kuehn, W. and Mueller, U. (2000). Riverbank filtration: An overview. J. Am. Water Works Assoc., 92(12): 60–69.
Kundert, K. (2014). Alberta Flood 2013—City of Calgary water treatment system resiliency. Canadian National Conference on Drinking Water, Ottawa, Ontario.
Lagos, G.E., Cuadrado, C.A. and Letelier, M.V. (2001). Aging of copper pipes by drinking water. J. Am. Water Works Assoc., 93(11): 94–103.
Lamsal, R., Montreuil, K.R., Kent, F.C., Walsh, M.E. and Gagnon, G.A. (2012). Characterization and removal of natural organic matter by an integrated membrane system. Desalination, 303: 12–16.
Lautenschlager, K., Hwang, C., Liu, W-T., Boon, N., Köster, O., Vrouwenvelder, H., Egli, T. and Hammes, F. (2013). A microbiology-based multi-parametric approach towards assessing biological stability in drinking water distribution networks. Water Res., 47(9): 3015–3025.
LeChevallier, M.W. (2003). Conditions favouring coliform and HPC bacterial growth in drinking-water and on water contact surfaces. In: Heterotrophic plate counts and drinking-water safety. The significance of HPCs for water quality and human health. Bartram, J., Cotruvo, J., Exner, M., Fricker, C. and Glasmacher, A. (eds.). IWA Publishing, London, United Kingdom. pp. 177–197.
LeChevallier, M.W. and Au, K-K. (2004). Water treatment and pathogen control. Process efficiency in achieving safe drinking water. World Health Organization, 2004. IWA Publishing. London.
LeChevallier, M.W., Becker, W.C., Schorr, P. and Lee, R.G. (1992). Evaluating the performance of biologically active rapid filters. J. Am. Water Works Assoc., 84(4): 136–140.
LeChevallier, M.W., Welch, N.J. and Smith, D.B. (1996). Full-scale studies of factors related to coliform regrowth in drinking water. App. Environ. Microbiol., 62(7): 2201–2211.
LeChevallier, M.W., Schneider, O.D., Weinrich, L.A., Jjemba, P.K., Evans, P.J., Hooper, J.L. and Chappell, R.W. (2015a). An operational definition of biostability in drinking water. Report number 4312b. Water Research Foundation, Denver, Colorado.
LeChevallier, M.W., Schneider, O.D., Weinrich, L.A., Jjemba, P.K., Evans, P.J., Hooper, J.L. and Chappell, R.W. (2015b). Guidance manual for control of biostability in drinking water. Report number 4312a. Water Research Foundation, Denver, Colorado.
Leclerc, H. (2003). Relationships between common water bacteria and pathogens in drinking-water. In: Heterotrophic plate counts and drinking-water safety. The significance of HPCs for water quality and human health. Bartram, J., Cotruvo, J., Exner, M., Fricker, C. and Glasmacher, A. (eds.). IWA Publishing, London, United Kingdom. pp. 80–118.
Lee, N., Amy, G. and Croué, J-P. (2006). Low-pressure membrane (MF/UF) fouling associated with allochthonous versus autochthonous natural organic matter. Water Res., 40(12): 2357–2368.
Leenheer, J.A. and Croué, J-P. (2003). Characterizing aquatic dissolved organic matter. Environ. Sci. Technol., 37(1): 18a–26a.
Liang, L. and Singer, P.C. (2003). Factors influencing the formation and relative distribution of haloacetic acids and trihalomethanes in drinking water. Environ. Sci. Technol., 37(13): 2920–2928.
Liu, W., Wu, H., Wang, Z., Ong, S.L., Hu, J.Y. and Ng, W.J. (2002). Investigation of assimilable organic carbon (AOC) and bacterial regrowth in drinking water distribution systems. Water Res. 36(4): 891–898.
Liu, H., Korshin, G.V. and Ferguson, J.F. (2009). Colloidal mobilization of PbO2 by chloramine and NOM and effects of phosphate corrosion inhibitors. In: Proceedings of the AWWA Water Quality Technology Conference, Seattle, Washington. American Water Works Association, Denver, Colorado.
Liu, X., Wang, J., Liu, T., Kong, W., He, X., Jin, Y. and Zhang, B. (2015). Effects of assimilable organic carbon and free chlorine on bacterial growth in drinking water. Plos One, 10(6): https://doi.org/10.1371/journal.pone.0128825.
Logsdon, G.S., Kohne, R., Abel, S. and LaBonde, S. (2002). Slow sand filtration for small water systems. J. Environ. Eng. Sci., 1(5): 339–348.
Mamane-Gravetz, H. and Linden, K.G. (2004). Impact of particle aggregated microbes on UV disinfection. In: Proceedings of the AWWA Water Quality Technology Conference, San Antonio, Texas. American Water Works Association, Denver, Colorado.
Martin-Mousset, B., Croué, J-P., Lefebvre, E. and Legube, B. (1997). Distribution and characterization of dissolved organic matter of surface waters. Water Res., 31(3): 541–553.
Masters, S., Welter, G.J. and Edwards, M. (2016). Seasonal variations in lead release to potable water. Environ. Sci. Technol., 50(10): 5269–5277.
Matilainen, A., Gjessing, E.T., Lahtinen, T., Hed, L., Bhatnagar, A. and Sillanpää, M. (2011). An overview of the methods used in the characterisation of natural organic matter (NOM) in relation to drinking water treatment. Chemosphere, 83(11): 1431–1442.
McVicar, M. (2014). Use of online monitoring instrumentation for coagulation optimization. M.A. Sc. Thesis, Dalhousie University, Halifax, Nova Scotia.
McVicar, M., Bickerton, B., Chaulk, M. and Walsh, M. (2015). UV254 and streaming current monitors can improve coagulation control in challenging conditions. Opflow, 41(7): 26–28.
Melin, E., Skog, R. and Ødegarrd, H. (2006). Ozonation/biofiltration with calcium carbonate as biofilter media. Chapter 49 in: Recent progress in slow sand and alternative biofiltration processes. Gimbel, R., Graham, N.J.D. and Collins, M.R. (eds.). IWA Publishing, London, UK. pp. 406–413.
Minor, E.C., Swenson, M.M., Mattson, B.M. and Oyler, A.R. (2014). Structural characterization of dissolved organic matter: A review of current techniques for isolation and analysis. Environ. Sci. Process. Impacts, 16(9): 2064–2079.
Mitch, W.A., Krasner, S.W., Westerhoff, P. and Dotson, A. (2009). Occurrence and formation of nitrogenous disinfection by-products. Report number 91250. Water Research Foundation, Denver, Colorado.
Monteith, D.T., Stoddard, J.L., Evans, C.D., de Wit, H.A., Forsius, M., Høgåsen, T., Wilander, A., Skjelkvåle, B.L., Jeffries, D.S., Vuorenmaa, J., Keller, B., Kopécek, J. and Vesely, J. (2007). Dissolved organic carbon trends resulting from changes in atmospheric deposition chemistry. Nature, 450(7169): 537–-540.
Montreuil, K.R. (2011). Natural organic matter characterization in drinking water. M.A. Sc. Thesis, Dalhousie University, Halifax, Nova Scotia.
Mulholland, P.J. (2003). Large-scale patterns in dissolved organic carbon concentration, flux and sources. Chapter 6 in: Aquatic ecosystems: Interactivity of dissolved organic matter. Findlay, S.E.G. and Sinsabaugh, R.L. (eds.). Academic Press, San Diego, California. pp. 139–159.
MWH (2012). Water treatment principles and design. 3rd edition. John Wiley & Sons, New York, New York.
Nescerecka, A., Rubulis, J., Vital, M., Juhna, T. and Hammes, F. (2014). Biological instability in a chlorinated drinking water distribution network. Plos One, 9(5): https://doi.org/10.1371/ journal.pone.0096354.
Newcombe, G. and Dixon, D. (2006). Introduction. Chapter 1 in: Interface science in drinking water treatment—theory and applications. Newcombe, G. and Dixon, D. (eds.). Academic Press, London, United Kingdom. pp. 1–4.
Newfoundland and Labrador Department of Environment and Conservation (2011). Study on characteristics and removal of natural organic matter in drinking water systems in Newfoundland and Labrador. Available at: https://www.mae.gov.nl.ca/waterres/reports/index.html
Nguyen, M-L., Baker, L.A. and Westerhoff, P. (2002). DOC and DBP precursors in western US watersheds and reservoirs. J. Am. Water Works Assoc., 94(5): 98–112.
Nichols, G., Lane, C., Asgari, N., Verlander, N.Q. and Charlett, A. (2009). Rainfall and outbreaks of drinking water related disease and in England and Wales. J. Water Health, 7(1): 1–8.
Norton, C.D., LeChevallier, M.W. and Falkinham III, J.O. (2004). Survival of Mycobacterium avium in a model distribution system. Water Res., 38(6): 1457–1466.
Nyfennegger, J., Burns, S., Ross, N., Upadhyaya, G., Brown, J., Lauderdale, C., Kirisits, M.J., Keithley, S. and Bae, S. (2016). Full-scale engineered biofiltration evaluation and development of a performance tracking tool. Report number 4525. Water Research Foundation, Denver, Colorado.
O’Connor, D. R. (2002). Part two report on the Walkerton inquiry: A strategy for safe drinking water. Ontario Ministry of the Attorney General (ISBN 0-7794-25600X).
Ødegaard, H., Melin, E. and Leiknes, T. (2006). Ozonation/biofiltration for treatment of humic surface water. Chapter 48 in: Recent progress in slow sand and alternative biofiltration processes. Gimbel, R., Graham, N.J.D. and Collins, M.R. (eds.). IWA Publishing, London, UK. pp. 397–405.
O'Melia, C.R. (2006). Fundamentals of particle stability. Chapter 18 in: Interface science in drinking water treatment—theory and applications. Newcombe, G., and Dixon, D. (eds.). Academic Press, London, United Kingdom. pp. 317–362.
Ongerth, J.E. and Pecoraro, J.P. (1995). Removing Cryptosporidium using multimedia filters. J. Am. Water Works Assoc., 87(12): 83–89.
Owen, D.M., Amy, G.L. and Chowdhury, Z.K. (1993). Characterization of natural organic matter and its relationship to treatability. Report number 90631. AWWA Research Foundation, Denver, Colorado.
Owen, D.M., Amy, G.L., Chowdhury, Z.K., Paode, R., McCoy, G. and Viscosil, K. (1995). NOM characterization and treatability. J. Am. Water Works Assoc., 87(1): 46–63.
Pagano, T., Bida, M. and Kenny, J.E. (2014). Trends in levels of allochthonous dissolved organic carbon in natural water: A review of potential mechanisms under a changing climate. Water, 6(10): 2862–2897.
Parsons, S.A., Jefferson, B., Jarvis, P., Sharp, E., Dixon, D., Bolto, B. and Scales, P. (2007). Treatment of waters with elevated organic carbon. Report Number 91161. AWWA Research Foundation, Denver, Colorado.
Passantino, L., Malley Jr., J., Knudson, M., Ward, R. and Kim, J. (2004). Effect of low turbidity and algae on UV disinfection performanceJ. Am. Water Works Assoc., 96(6): 128–137.
Patania, N.L, Jacangelo, J.G., Cummings, L., Wilczak, A., Riley, K., and Oppenheimer, J. (1995). Optimization of filtration for cyst removal. Report number 90699. American Water Works Association Research Foundation and American Water Works Association, Denver, Colorado.
Peldszus, S., Hallé, C., Peiris, R.H., Hamouda, M., Jin, X., Legge, R.L., Budman, H., Moresoli, C. and Huck, P.M. (2011). Reversible and irreversible low-pressure membrane foulants in drinking water treatment: Identification by principal component analysis of fluorescence EEM and mitigation by biofiltration pretreatment. Water Res., 45(16): 5161–5170.
Pellerin, B.A., Saraceno, J.F., Shanley, J.B., Sebestyen, S.D., Aiken, G.R., Wollheim, W.M. and Bergamaschi, B.A. (2012). Taking the pulse of snowmelt: In situ sensors reveal seasonal, event and diurnal patterns of nitrate and dissolved organic matter variability in an upland forest stream. Biogeochemistry, 108(1–3): 183–198.
Peng, C-Y., Ferguson, J.F. and Korshin, G.V. (2013). Effects of chloride, sulfate and natural organic matter (NOM) on the accumulation and release of trace-level inorganic contaminants from corroding iron. Water Res., 47(14): 5257–5269.
Pernitsky, D.J. (2003). Coagulation 101. In: Proceedings of the Technology Transfer Conference, University of Calgary, Alberta, Canada.
Pernitsky, D.J. and Edzwald, J.K. (2006). Selection of alum and polyaluminum coagulants: Principles and applications. J. Water Supply Res. Technol. Aqua, 55(2): 121–141.
Peter, A., Köster, O., Schildknecht, A. and von Gunten, U. (2009). Occurrence of dissolved and particle-bound taste and odor compounds in Swiss lake waters. Water Res., 43(8): 2191–2200.
Pharand, L., Van Dyke, M.I., Anderson, W.B. and Huck, P.M. (2014). Assessment of biomass in drinking water biofilters by adenosine triphosphate. J. Am. Water Works Assoc., 106(10): E433–E444.
Piet, G.J. and Zoeteman, B.C.J. (1980). Organic water quality changes during sand bank and dune filtration of surface waters in the Netherlands. J. Am. Water Works Assoc., 72(7): 400–404.
Pivokonsky, M., Kloucek, O. and Pivokonska, L. (2006). Evaluation of the production, composition and aluminum and iron complexation of algogenic organic matter. Water Res., 40(16): 3045–3052.
Plourde-Lescelleur, F., Papineau, I., Carrière, A., Gadbois, A. and Barbeau, B. (2015). NOM removal: Evaluating five process alternatives to alum coagulation. J. Water Supply Res. Technol. Aqua, 64(3): 278–289.
Plummer, J.D., Edzwald, J.K. and Kelley, M.B. (1995). Removing Cryptosporidium by dissolved air flotation. J. Am. Water Works Assoc., 87(9):85–95.
Prest, E.I., Hammes, F., Kötzsch, S., van Loosdrecht, M.C.M. and Vrouwenvelder, J.S. (2013). Monitoring microbiological changes in drinking water systems using a fast and reproducible flow cytometric method. Water Res., 47(19): 7131–7142.
Prest, E.I., Hammes, F., van Loosdrecht, M.C.M. and Vrouwenvelder, J.S. (2016). Biological stability of drinking water: Controlling factors, methods, and challenges. Front. Microbiol., 7: 45.
Prévost, M., Gauthier, C., Hureïki, L., Desjardins, R. and Servais, P. (1998). Removal of amino acids, biodegradable organic carbon and chlorine demand by biological filtration in cold water. Environ. Technol., 19(9): 903–911.
Prévost, M., Laurent, P., Servais, P. and Joret, J-C. (2005). Biodegradable organic matter in drinking water treatment and distribution. American Water Works Association, Denver, Colorado.
Pyper, G.R. (1985). Slow sand filter and package treatment plant evaluation: Operating costs and removal of bacteria, Giardia, and trihalomethanes. U.S. Environmental Protection Agency, Cincinnati, Ohio. EPA/600/S2‑85/052.
Rahman, I., Ndiongue, S., Jin, X., Van Dyke, M.I., Anderson, W.B. and Huck, P.M. (2014). Fouling of low-pressure membranes during drinking water treatment: Effect of NOM components and biofiltration pretreatment. Water Sc. Technol. Water Supply, 14(3): 453–460.
Ratnaweera, H., Gjessing, E. and Oug, E. (1999). Influence of physical-chemical characteristics of natural organic matter (NOM) on coagulation properties: An analysis of eight Norwegian water sources. Water Sci. Tech., 40(4–5): 89–95.
Ratpukdi, T., Rice, J.A., Chilom, G., Bezbaruah, A. and Khan, E. (2009). Rapid fractionation of natural organic matter in water using a novel solid-phase extraction technique. Water Environ. Res., 81(11): 2299–2308.
Ray, C., Grischek, T., Schubert, J., Wang, J.Z. and Speth, T.F. (2002). A perspective of riverbank filtration. J. Am. Water Works Assoc., 94(4): 149–160.
Reckhow, D.A. (2017). Personal communication. University of Massachusetts, Amherst, Massachusetts.
Reckhow, D.A. and Singer, P.C. (1984). The removal of organic halide precursors by preozonation and alum coagulation. J. Am. Water Works Assoc., 76(4): 151–157.
Reckhow, D.A., Rees, P.L., Nüsslein, K., Makdissy, G., Devine, G., Conneely, T., Boutin, A. and Bryan, D. (2007). Long-term variability of BDOM and NOM as precursors in watershed sources. Report number 91186. AWWA Research Foundation, Denver, Colorado.
Reid Crowther and Partners Ltd. (2000). Canadian Water Treatment Study Contract H4092-0-0001/001/SS Water Treatment and Disinfection Byproducts. Prepared for Public Works Canada and Government Services Canada, Health Canada, Environment Canada.
Rigobello, E.S., Dantas, A.D., Di Bernardo, L. and Vieira, E.M. (2011). Influence of the apparent molecular size of aquatic humic substances on colour removal by coagulation and filtration. Environ. Technol., 33(15–16): 1767–1777.
Ritson, J.P., Graham, N.J.D., Templeton, M.R., Clark, J.M., Gough, R. and Freeman, C. (2014). The impact of climate change on the treatability of dissolved organic matter (DOM) in upland water supplies: A UK perspective. Sci. Total Environ., 473–474: 714–730.
Rittmann, B.E. and Huck, P.M. (1989). Biological treatment of public water supplies. Crit. Rev. Environ. Control, 19(2): 119–184.
Roccaro, P., Chang, H-S., Vagliasindi, F.G.A. and Korshin, G.V. (2008). Differential absorbance study of effects of temperature on chlorine consumption and formation of disinfection by-products in chlorinated water. Water Res., 42(8–9): 1879–1888.
Rodriguez, M.J. and Sérodes, J-B. (2001). Spatial and temporal evolution of trihalomethanes in three water distribution systems. Water Res., 35(6): 1572–1586.
Rook, J.J. (1974). Formation of haloforms during chlorination of natural waters. Water treatment and examination, 23: 234–243.
Rosario-Ortiz, F.L., Snyder, S. and Suffet, I.H. (2007). Characterization of the polarity of natural organic matter under ambient conditions by the polarity rapid assessment method (PRAM). Environ. Sci. Technol., 41(14): 4895–4900.
Sadrnourmohamadi, M., Goss, C.D. and Gorczyca, B. (2013). Removal of DOC and its fractions from surface waters of the Canadian Prairie containing high levels of DOC and hardness. Water Sc. Technol. Water Supply, 13(3): 864–870.
SanClements, M.D., Oelsner, G.P., McKnight, D.M., Stoddard, J.L. and Nelson, S.J. (2012). New insights into the source of decadal increases of dissolved organic matter in acid-sensitive lakes of the northeastern United States. Environ. Sci. Technol., 46(6): 3212–3219.
Saraceno, J.F., Pellerin, B.A., Downing, B.D., Boss, E., Bachand, P.A.M. and Bergamaschi, B.A. (2009). High-frequency in situ optical measurements during a storm event: Assessing relationships between dissolved organic matter, sediment concentrations, and hydrologic processes. J. Geophys. Res. Biogeosci., 114(4).
Satchwill, T., Watson, S.B. and Dixon, E. (2007). Odourous algal-derived alkenes: Differences in stability and treatment responses in drinking water. Water Sci. Tech., 55(5): 95–102.
Schock, M. and Lytle, D. (2011). Internal corrosion and deposition control. Chapter 20 in: Water quality and treatment. Edzwald, J. K. (ed.). McGraw Hill, New York. pp. 20.1–20.103.
Schock, M.R., Wagner, I. and Oliphant, R.J. (1996). Corrosion and solubility of lead in drinking water. In: Internal corrosion of water distribution systems. 2nd edition. American Water Works Association Research Foundation and DVGW Technologiezentrum Wasser, Denver, Colorado, pp. 131–230.
Semmens, M.J. and Field, T.K. (1980). Coagulation: Experiences in organics removal. J. Am. Water Works Assoc., 72(8): 476–483.
Servais, P., Prévost, M., Laurent, P., Joret, J-C., Summers, S., Hamsch, B. and Ventresque, C. (2005). Biodegradable organic matter in drinking water treatment. Chapter 3 in: Biodegradable organic matter in drinking water treatment and distribution. Prévost, M., Laurent, P., Servais, P. and Joret, J-C., (eds.). American Water Works Association, Denver, Colorado. pp. 61–145.
Sharp, E. (2015). Using online zeta potential measurements for coagulation control: A first for the UK water industry. In: Proceedings of the IWA Specialist Conference on Natural Organic Matter in Drinking Water, Malmo, Sweden.
Sharp, E.L., Parsons, S.A. and Jefferson, B. (2006). Seasonal variations in natural organic matter and its impact on coagulation in water treatment. Sci. Total Environ., 363(1–3): 183–194.
Shin, J.Y., Spinette, R.F. and O'Melia, C.R. (2008). Stoichiometry of coagulation revisited. Environ. Sci. Technol., 42(7): 2582–2589.
Siebel, E., Wang, Y., Egli, T. and Hammes, F. (2008). Correlations between total cell concentration, total adenosine tri-phosphate concentration and heterotrophic plate counts during microbial monitoring of drinking water. Drink. Water Eng. Sci., 1(1): 1–6.
Siembida-Lösch, B., Anderson, W.B., Bonsteel, J. and Huck, P.M. (2014). Pretreatment impacts on biopolymers in adjacent ultrafiltration plants. J. Am. Water Works Assoc., 106(9): E372–E382.
Siembida-Lösch, B., Anderson, W.B., Wang, Y., Bonsteel, J. and Huck, P.M. (2015). Effect of ozone on biopolymers in biofiltration and ultrafiltration processes. Water Res., 70: 224–234.
Sillanpää, M. (2015). General introduction. Chapter 1 in: Natural organic matter in water: Characterization and treatment methods. M. Sillanpää (ed.). IWA Publishing, Oxford, United Kingdom. pp 1–15.
Sillanpää, M. and Matilainen, A. (2015). NOM removal by coagulation. Chapter 3 in: Natural organic matter in water: Characterization and treatment methods. M. Sillanpää (ed.). IWA Publishing, Oxford, United Kingdom. pp 55–80.
Sillanpää, M., Metsämuuronen, S. and Mänttäri, M. (2015a). Membranes. Chapter 5 in: Natural organic matter in water: Characterization and treatment methods. M. Sillanpää (ed.). IWA Publishing, Oxford, United Kingdom. pp. 113–157.
Sillanpää, M., Matilainen, A. and Lahtinen, T. (2015b). Characterization of NOM. Chapter 2 in: Natural organic matter in water: Characterization and treatment methods. M. Sillanpää (ed.). IWA Publishing, Oxford, United Kingdom. pp. 17–53.
Simpson, D.R. (2008). Biofilm processes in biologically active carbon water purification. Water Res., 42(12): 2839–2848.
Singer, P.C., Schneider, M., Edwards-Brandt, J. and Budd, G.C. (2007). MIEX for removal of DBF precursors: Pilot-plant findings. J. Am. Water Works Assoc., 99(4): 128–139.
Singer, P.C., Boyer, T., Holmquist, A., Morran, J. and Bourke, M. (2009). Integrated analysis of NOM removal by magnetic ion exchange. J. Am. Water Works Assoc., 101(1): 65–73.
Sinsabaugh, R.L. and Findlay, S. (2003). Dissolved organic matter: Out of the black box into the mainstream. Chapter 20 in: Aquatic Ecosystems: Interactivity of dissolved organic matter. Findlay, S.E.G. and Sinsabaugh, R.L. (eds.). Academic Press, San Diego, California. pp. 479–498.
Slavik, I., Müller, S., Mokosch, R., Azongbilla, J.A. and Uhl, W. (2012). Impact of shear stress and pH changes on floc size and removal of dissolved organic matter (DOM). Water Res., 46(19): 6543–6553.
Slunjski, M., Cadee, K. and Tettersal, J. (2000). MIEX® resin water treatment process. In: Proceedings of the Annual Conference and Exhibition of the American Water Works Association, Denver, Colorado.
Smeets, P.W.M.H. (2017). Personal communication. KWR Watercycle Research Institute, Nieuwegein, the Netherlands.
Smeets, P.W.M.H., Medema, G.J. and Van Dijk, J.C. (2009). The Dutch secret: How to provide safe drinking water without chlorine in the Netherlands. Drink. Water Eng. Sci., 2(1): 1–14.
Soulsby, C. (1995). Contrasts in storm event hydrochemistry in an acidic afforested catchment in upland Wales. J. Hydrol., 170(1–4): 159–179.
Steele, M.E.J, Evans, H.L., Stephens, J., Rachal, A. and Clarke, B.A. (2006). Dissolved oxygen issues with granular activated carbon sandwichTM slow sand filtration. Chapter 11 in: Recent progress in slow sand and alternative biofiltration processes. Gimbel, R., Graham, N.J.D. and Collins, M.R. (eds.). IWA Publishing, London, United Kingdom. pp. 83–94.
Stevens, A.A., Slocum, C.J., Seeger, D.R and Robeck, G.G. (1976). Chlorination of organics in drinking water. J. Am. Water Works Assoc., 68(11): 615–620.
Stevenson, F.J. (1982). Humus chemistry: Genesis, composition, reactions. John Wiley & Sons, New York, New York.
Stoddart, A.K. and Gagnon, G.A. (2014). Application of photoelectrochemical chemical oxygen demand to drinking water. J. Am. Water Works Assoc., 106(9): E383–E390.
Stoddart, A.K. and Gagnon, G.A. (2015). Full-scale prechlorine removal: Impact on filter performance and water quality. J. Am. Water Works Assoc., 107(12): E638–E647.
Summers, R.S., Beggs, K.M.H., McKnight, D.M., Rosario-Ortiz, F.L. and Billica, J.A. (2013). Watershed analysis of dissolved organic matter and control of disinfection by-products. Report number 4282. Water Research Foundation, Denver, Colorado.
Świetlik, J., Dąbrowska, A., Raczyk-Stanislawiak, U. and Nawrocki, J. (2004). Reactivity of natural organic matter fractions with chlorine dioxide and ozone. Water Res., 38(3): 547–558.
Symons, J.M., Krasner, S.W., Simms, L.A. and Sclimenti, M. (1993). Measurement of THM and precursor concentrations revisited: The effect of bromide ion. J. Am. Water Works Assoc., 85(1): 51–62.
Tan, L. and Sudak, R.G. (1992). Removing color from a groundwater source. J. Am. Water Works Assoc., 84(1): 79–87.
Templeton, M.R., Andrews, R.C. and Hofmann, R. (2005). Inactivation of particle-associated viral surrogates by ultraviolet light. Water Res., 39(15): 3487–3500.
Templeton, M.R., Andrews, R.C. and Hofmann, R. (2007). Removal of particle-associated bacteriophages by dual-media filtration at different filter cycle stages and impacts on subsequent UV disinfection. Water Res., 41(11): 2393–2406.
Templeton, M.R., Andrews, R.C. and Hofmann, R. (2008). Particle-associated viruses in water: Impacts on disinfection processes. Crit. Rev. Environ. Sci. Technol., 38(3): 137–164.
Thomas, M.K., Charron, D.F., Waltner-Toews, D., Schuster, C., Maarouf, A.R. and Holt, J.D. (2006). A role of high impact weather events in waterborne disease outbreaks in Canada, 1975–2001. Int. J. Environ. Health Res., 16(3): 167–180.
Thurman, E.M. (1985). Organic geochemistry of natural waters. Kluwer Academic Publishers Group, Dordrecht, The Netherlands.
Tomlinson, A., Drikas, M. and Brookes, J.D. (2016). The role of phytoplankton as pre-cursors for disinfection by-product formation upon chlorination. Water Res., 102: 229–240.
Trueman, B.F., Sweet, G.A., Harding, M.D., Estabrook, H., Bishop, D.P. and Gagnon, G.A. (2017). Galvanic corrosion of lead by iron (oxyhydr)oxides: potential impacts on drinking water quality. Environ. Sci. Technol., 51: 6812–6820.
Tseng, T., Segal, B.D. and Edwards, M. (2000). Increasing alkalinity to reduce turbidity. J. Am. Water Works Assoc., 92(6): 44–54.
Tubić, A., Agbaba, J., Dalmacija, B., Molnar, J., Maletic, S., Watson, M. and Perovic, S.U. (2013). Insight into changes during coagulation in NOM reactivity for trihalomethanes and haloacetic acids formation. J. Environ. Manage., 118: 153–160.
Ungar, J. (1962). Anion exchange resin fouling. Effluent Water Treat. J., June: 331–334.
U.S. EPA (1998). National primary drinking water regulations: Disinfectants and disinfection byproducts; final rule. Federal Register, 63(241): 69390-69476. Available at: www.gpo.gov/ fdsys/pkg/FR-1998-12-16/pdf/98-32887.pdf
U.S. EPA (2016). Six-year review 3 technical support document for disinfectants/disinfection byproducts rules. Office of Water, U.S. Environmental Protection Agency, Washington, DC. (EPA-810-R-16-012).
Vadasarukkai, Y.S. and Gagnon, G.A. (2015). Application of low-mixing energy input for the coagulation process. Water Res., 84: 333–341.
Vadasarukkai, Y.S. (2016). Investigation of the mixing energy consumption affecting coagulation and floc aggregation. Ph. D. dissertation, Dalhousie University, Halifax, Nova Scotia.
Valade, M.T., Becker, W.C. and Edzwald, J.K. (2009). Treatment selection guidelines for particle and NOM removal. J. Water Supply Res. Technol. Aqua, 58(6): 424–432.
Valentine, R.L. and Lin, Y-P. (2009). The role of free chlorine, chloramines, and NOM on the release of lead into drinking water. Report number 91243. Water Research Foundation, Denver, Colorado.
van der Kooij, D. (2000). Biological stability: A multidimensional quality aspect of treated water. Water Air Soil Pollut. 123(1–4): 25–34.
van der Kooij, D. and van der Wielen, P.W.J.J. (2014). Microbial growth in drinking-water supplies: Problems, causes, control and research needs. IWA Publishing, London, United Kingdom.
van der Kooij, D., Martijn, B., Schaap, P.G., Hoogenboezem, W., Veenendaal, H.R. and van der Wielen, P.W.J.J. (2015). Improved biostability assessment of drinking water with a suite of test methods at a water supply treating eutrophic lake water. Water Res., 87: 347–355.
van der Wielen, P.W.J.J. and van der Kooij, D. (2013). Nontuberculous mycobacteria, fungi, and opportunistic pathogens in unchlorinated drinking water in the Netherlands. Appl. Environ. Microbiol., 79(3): 825–834.
Volk, C., Wood, L., Johnson, B., Robinson, J., Zhu, H.W. and Kaplan, L. (2002). Monitoring dissolved organic carbon in surface and drinking waters. J. Environ. Monit., 4(1): 43–47.
Vu, B., Chen, M., Crawford, R.J. and Ivanova, E.P. (2009). Bacterial extracellular polysaccharides involved in biofilm formation. Molecules, 14(7): 2535–54.
Wang, J.Z., Hubbs, S.A. and Song, R. (2002). Evaluation of riverbank filtration as a drinking water treatment process. Report number 90922. AWWA Research Foundation and American Water Works Association, Denver, Colorado.
Warnecke, M. (2006). Cryptosporidium oocyst interactions with drinking water pipe biofilms. Cooperative Research Centre for Water Quality and Treatment, Salisbury, Australia.
Watson, S.B. (2003). Cyanobacterial and eukaryotic algal odour compounds: Signals or by-products? A review of their biological activity. Phycologia, 42(4): 332–350.
Weishaar, J.L., Aiken, G.R., Bergamaschi, B.A., Fram, M.S., Fujii, R. and Mopper, K. (2003). Evaluation of specific ultraviolet absorbance as an indicator of the chemical composition and reactivity of dissolved organic carbon. Environ. Sci. Technol., 37(20): 4702–4708.
Weiss, W.J., Bouwer, E.J., Ball, W.P., O'Melia, C.R., LeChevallier, M.W., Arora, H. and Speth, T.F. (2003). Riverbank filtration—fate of DBP precursors and selected microorganisms. J. Am. Water Works Assoc., 95(10): 68–81.
Westerhoff, P., Aiken, G., Amy, G. and Debroux, J. (1999). Relationships between the structure of natural organic matter and its reactivity towards molecular ozone and hydroxyl radicals. Water Res., 33(10): 2265–2276.
Westerhoff, P., Chao, P. and Mash, H. (2004). Reactivity of natural organic matter with aqueous chlorine and bromine. Water Res., 38(6): 1502–1513.
Wetzel, R.G. (1992). Gradient-dominated ecosystems: Sources and regulatory functions of dissolved organic matter in freshwater ecosystems. Hydrobiologia, 229(1): 181–198.
Wetzel, R.G. (2003). Dissolved organic carbon: Detrital energetics, metabolic regulators, and drivers of ecosystem stability of aquatic ecosystems. Chapter 19 in: Aquatic ecosystems: Interactivity of dissolved organic matter. Findlay, S.E.G., and Sinsabaugh, R.L. (eds.). Academic Press, San Diego, California. pp. 455–477.
Weyhenmeyer, G.A., Prairie, Y.T. and Tranvik, L.J. (2014). Browning of boreal freshwaters coupled to carbon-iron interactions along the aquatic continuum. Plos One, 9(2): https://doi.org/10.1371/ journal.pone.0088104
White, M.C., Thompson, J.D., Harrington, G.W. and Singer, P.C. (1997). Evaluating criteria for enhanced coagulation compliance. J. Am. Water Works Assoc., 89(5): 64–77.
WHO (2011). Guidelines for drinking-water quality. 4th edition. World Health Organization. Geneva, Switzerland. Available at: www.who.int/water_sanitation_health/publications/ 2011/dwq_guidelines/en/
WHO (2012). Water safety planning for small community water supplies. World Health Organization, Geneva, Switzerland. Available at: http://www.who.int/water_sanitation_health/ publications/small-comm-water_supplies/en/
WHO (2014). Water safety in distribution systems. World Health Organization, Geneva, Switzerland. Available at: http://www.who.int/water_sanitation_health/publications/water-safety-in-distribution-system/en/
Wilczak, A. (2006). Nitrification in drinking water distribution systems. In: Fundamentals and control of nitrification in chloraminated drinking water distribution systems. Manual of Water Supply Practices – M56. 1st edition. American Water Works Association, Denver, Colorado.
Willison, H. and Boyer, T.H. (2012). Secondary effects of anion exchange on chloride, sulphate, and lead release: Systems approach to corrosion control. Water Res., 46:2385–2394.
Wingender, J. and Flemming, H-C. (2011). Biofilms in drinking water and their role as reservoir for pathogens. Int. J. Hyg. Environ. Health, 214(6): 417–423.
Worrall, F. and Burt, T.P. (2009). Changes in DOC treatability: Indications of compositional changes in DOC trends. J. Hydrol., 366(1–4): 1–8.
Wright, B., Becker, W., Irving, J., Reinert, A., Stanford, B., Reckhow, D., Wittbold, P. and Zhao, R. (2016). Advanced techniques for monitoring changes in NOM and controlling DBPs under dynamic weather conditions. Report number 4422. Water Research Foundation, Denver, Colorado.
Wullings, B.A., Bakker, G. and Van Der Kooij, D. (2011). Concentration and diversity of uncultured Legionella spp. in two unchlorinated drinking water supplies with different concentrations of natural organic matter. Appl. Environ. Microbiol., 77(2): 634–641.
Yamamura, H., Okimoto, K., Kimura, K. and Watanabe, Y. (2014). Hydrophilic fraction of natural organic matter causing irreversible fouling of microfiltration and ultrafiltration membranes. Water Res., 54: 123–136.
Zacheus, O.M., Lehtola, M.J., Korhonen, L.K. and Martikainen, P.J. (2001). Soft deposits, the key site for microbial growth in drinking water distribution networks. Water Res., 35(7): 1757–1765.
Zaitlin, B. and Watson, S.B. (2006). Actinomycetes in relation to taste and odour in drinking water: Myths, tenets and truths. Water Res., 40(9): 1741–1753.
Zhao, H., Jiang, D., Zhang, S., Catterall, K. and John, R. (2004). Development of a direct photoelectrochemical method for determination of chemical oxygen demand. Anal. Chem., 76(1): 155–160.
Zhou, E., Payne, S.J.O., Hofmann, R. and Andrews, R.C. (2015). Factors affecting lead release in sodium silicate-treated partial lead service line replacements. J. Environ. Sci. Health Part A Toxic Hazard. Subst. Environ. Eng., 50(9): 922–930.
Zhou, S., Shao, Y., Gao, N., Deng, Y., Li, L., Deng, J. and Tan, C. (2014). Characterization of algal organic matters of microcystis aeruginosa: Biodegradability, DBP formation and membrane fouling potential. Water Res., 52: 199–207.
C.2 Acronyms
- ACU
- apparent colour units
- AOC
- assimilable organic carbon
- ATP
- adenosine triphosphate
- BDOC
- biodegradable organic carbon
- BOM
- biodegradable organic matter
- CU
- colour units
- DAF
- dissolved air flotation
- DCAA
- dichloroacetic acid
- DBP
- disinfection by-product
- DOC
- dissolved organic carbon
- EPA
- Environmental Protection Agency (United States)
- EU
- European Union
- GAC
- granular activated carbon
- GLUMRB
- Great Lakes – Upper Mississippi River Board
- H2O2
- hydrogen peroxide
- HAA
- haloacetic acid
- HAA5
- haloacetic acid 5
- MDL
- method detection limit
- MF
- microfiltration
- N-DBPs
- nitrogenous-DBPs
- NF
- nanofiltration
- NOM
- natural organic matter
- NTU
- nephelometric turbidity unit
- OPPP
- opportunistic premise plumbing pathogen
- PAC
- powdered activated carbon
- peCOD
- photoelectrochemical oxygen demand
- POC
- particulate organic carbon
- RO
- reverse osmosis
- SSF
- slow sand filtration
- SUVA
- specific UV absorbance
- THM
- trihalomethane
- TCAA
- trichloroacetic acid
- TCU
- total colour units
- TOC
- total organic carbon
- UF
- ultrafiltration
- UV
- ultraviolet
- UV254
- ultraviolet absorbance at 254 nm wavelength
- WHO
- World Health Organization
C.3 Tables
| Factor | Comment | Reference(s) |
|---|---|---|
| Percent wetlands in the watershed | Wetlands have a high DOC production rate and the DOC tends to be high in organic acidity. Even 1% wetlands cover can influence DOC concentrations and character. | Eckhardt and Moore, 1990; Grieve, 1994; Dalva and Moore, 1991; Cool et al., 2014 |
| Soil composition | Soils with the highest organic content (i.e., humus) export more DOC to aquatic environments. Mineral soils, particularly those rich in iron, aluminum or clay, tend to adsorb DOC. | Dalva and Moore, 1991; Kalbitz et al., 2000; Aitkenhead-Peterson et al., 2003 |
| Forest cover | Coniferous-dominated watersheds can produce approximately 50% more DOC than hardwood- dominated watersheds. | Cronan and Aiken, 1985; Dalva and Moore, 1991; Kalbitz et al., 2000, 2006 |
| Retention time | In general, the longer the retention time the lower the DOC concentration, due to biogeochemical processes that degrade and adsorb DOC. The residual DOC tends to be recalcitrant (i.e., not easily biodegraded). | Aiken and Cotsaris, 1995; Hanson et al., 2011; Reckhow et al., 2007 |
| Watershed hydrology | In the absence of wetlands, DOC concentrations tend to increase relative to streamflow. However, not all storms elicit the same response, due to variations in soil texture, antecedent soil moisture and precipitation/ snowmelt conditions. | Eckhardt and Moore, 1990; Grieve, 1994; Soulsby, 1995; Carpenter et al., 2013 |
| Flow pathways | Water passes through different soil layers depending on soil texture and antecedent moisture conditions. Variations in flow pathways can result in five-fold increases in DOC in short periods of time (i.e., hours to days). | Thurman, 1985; Aitkenhead-Peterson et al., 2003; Saraceno et al., 2009; Pellerin et al., 2012 |
| Channel slope | Mildly sloped watersheds tend to have higher DOC concentrations than steeply sloped watersheds. | Eckhardt and Moore, 1990; Aitkenhead-Peterson et al., 2003; Cool et al., 2014 |
| Watershed size | Small watersheds tend to have highly variable DOC concentrations, whereas large watersheds tend to be less variable. Watersheds with a high land-to-water ratio tend to have higher DOC concentrations. | Sinsabaugh and Findlay, 2003; Eikebrokk et al., 2004; Ågren et al., 2007 |
| Region | River Basin | Number of Samples | Number of DetectsFootnote a | 10th Percentile (mg/L) |
Median (mg/L) |
Mean (mg/L) |
90th Percentile (mg/L) |
|---|---|---|---|---|---|---|---|
| East | Maritime Coast | 94 | 92 | 1.00 | 2.25 | 3.43 | 8.65 |
| Newfoundland–Labrador | 1,111 | 1,111 | 2.60 | 4.70 | 5.02 | 7.60 | |
| North Shore–Gaspé | 42 | 42 | 5.01 | 6.25 | 6.34 | 7.99 | |
| Saint John–St. Croix | 89 | 89 | 3.48 | 4.40 | 5.79 | 9.92 | |
| Central | Winnipeg | 136 | 136 | 9.10 | 9.75 | 9.81 | 10.55 |
| Prairie | Assiniboine–Red | 1,153 | 1,153 | 8.14 | 10.90 | 12.46 | 18.80 |
| Churchill | 292 | 292 | 6.64 | 11.80 | 11.12 | 16.60 | |
| Lower Saskatchewan–Nelson | 507 | 507 | 4.77 | 14.00 | 12.89 | 20.80 | |
| Missouri | 188 | 188 | 1.62 | 4.02 | 4.56 | 8.33 | |
| North Saskatchewan | 594 | 594 | 0.24 | 2.01 | 4.98 | 14.40 | |
| South Saskatchewan | 818 | 818 | 0.49 | 1.24 | 2.15 | 4.79 | |
| Pacific | Columbia | 4,308 | 3,175 | 0.73 | 1.34 | 1.77 | 3.00 |
| Fraser | 3,503 | 3,374 | 1.20 | 2.95 | 3.58 | 6.70 | |
| Okanagan–Similkameen | 1,118 | 1,079 | 1.10 | 2.86 | 3.15 | 5.59 | |
| Pacific Coastal | 2,510 | 2,217 | 0.90 | 2.00 | 2.67 | 4.70 | |
| Peace–Athabasca | 443 | 442 | 0.34 | 2.00 | 2.34 | 4.89 | |
| Arctic | Arctic Coast | 148 | 136 | 0.60 | 2.45 | 3.09 | 6.50 |
| Keewatin–Southern Baffin Island | 40 | 40 | 1.98 | 3.45 | 3.26 | 4.20 | |
| Lower Mackenzie | 697 | 690 | 1.10 | 3.60 | 6.26 | 16.44 | |
| Yukon | 619 | 518 | 0.70 | 1.90 | 3.51 | 9.23 | |
|
|||||||
| Study/Source | Sample Date | DOC (mg/L) |
Hydrophobic (%) | Hydrophilic (%) | ||||
|---|---|---|---|---|---|---|---|---|
| Acid | Base | Neutral | Acid | Base | Neutral | |||
| Montreuil, 2011 | ||||||||
| Pockwock Lake, Nova Scotia | Jun 2009 | 2.6 | 8.3 | 17.6 | 20.5 | 0.0 | 19.2 | 34.5 |
| Aug 2009 | 2.5 | 3.6 | 0.4 | 36.8 | 6.8 | 6.4 | 46.0 | |
| Oct 2009 | 2.9 | 0.0 | 1.3 | 31.7 | 19.1 | 35.5 | 12.4 | |
| Dec 2009 | 2.8 | 19.1 | 29.6 | 7.6 | 2.5 | 8.3 | 32.9 | |
| Jan 2010 | 2.9 | 16.1 | 2.1 | 22.4 | 3.5 | 11.2 | 44.8 | |
| Jul 2010 | 2.5 | 14.0 | 1.9 | 3.2 | 7.0 | 2.5 | 71.3 | |
| Aug 2010 | 2.1 | 28.0 | 4.9 | 0.9 | 12.0 | 0.9 | 53.3 | |
| Range (Mean) |
2.1-2.9 (2.6) |
0.0-28.0 (12.7) |
0.4-29.6 (8.3) |
0.9-36.8 (17.6) |
0.0-19.1 (7.3) |
0.9-35.5 (12.0) |
12.4-71.3 (42.2) |
|
| Newfoundland and Labrador Department of Environment and Conservation, 2011 | ||||||||
| Community A | Feb 2011 | 3.6 | 29.7 | 2.9 | 2.9 | 8.8 | 1.8 | 53.8 |
| Community B | Sep 2010 | 7.7 | 22.0 | 1.1 | 3.4 | 50.7 | 1.6 | 21.2 |
| Community C | Sep 2010 | 10.8 | 62.4 | 0.9 | 0.0 | 5.5 | 0.2 | 31.0 |
| Community D | Jan 2011 | 5.2 | 60.5 | 1.6 | 2.0 | 9.2 | 2.0 | 24.9 |
| Community E | Sep 2010 | 8.3 | 57.7 | 1.0 | 3.0 | 3.5 | 1.0 | 33.9 |
| Community F | Dec 2010 | 9.0 | 63.5 | 6.8 | 2.1 | 11.6 | 0.8 | 15.2 |
| Range (Mean) |
3.6-10.8 (7.4) |
22.0-63.5 (49.3) |
0.9-6.8 (2.4) |
0.0-3.4 (2.2) |
3.5-50.7 (14.9) |
0.2-2.0 (1.2) |
15.2-53.8 (30.0) |
|
| Lamsal et al., 2012 | ||||||||
| French River, Nova Scotia | Not given | 5.3 | 35.3 | 2.2 | 4.5 | 6.1 | 1.5 | 50.4 |
| Goss and Gorczyca, 2013 | ||||||||
| Red River, Manitoba | Sep 2010 | 11.3 | 21.8 | 1.9 | 21.8 | 12.9 | 1.9 | 39.7 |
| Nov 2010 | 12.0 | 36.0 | 3.6 | 18.2 | 11.6 | 5.6 | 25.1 | |
| Feb 2011 | 8.0 | 37.1 | 7.7 | 13.2 | 17.1 | 7.0 | 17.9 | |
| Jun 2011 | 8.7 | 27.1 | 2.4 | 11.5 | 2.3 | 5.3 | 51.3 | |
| Range (Mean) |
8.0-12.0 (10.0) |
21.8-37.1 (30.5) |
1.9-7.7 (3.9) |
11.5-21.8 (16.2) |
2.3-17.1 (11.0) |
1.9-7.0 (4.9) |
17.9-51.3 (33.5) |
|
| UVT (%) |
UVA (cm-1) |
UVT (%) |
UVA (cm-1) |
UVT (%) |
UVA (cm-1) |
UVT (%) |
UVA (cm-1) |
|---|---|---|---|---|---|---|---|
| 1 | 2.0000 | 26 | 0.5850 | 51 | 0.2924 | 76 | 0.1192 |
| 2 | 1.6990 | 27 | 0.5686 | 52 | 0.2840 | 77 | 0.1135 |
| 3 | 1.5229 | 28 | 0.5528 | 53 | 0.2757 | 78 | 0.1079 |
| 4 | 1.3979 | 29 | 0.5376 | 54 | 0.2676 | 79 | 0.1024 |
| 5 | 1.3010 | 30 | 0.5229 | 55 | 0.2596 | 80 | 0.0969 |
| 6 | 1.2218 | 31 | 0.5086 | 56 | 0.2518 | 81 | 0.0915 |
| 7 | 1.1549 | 32 | 0.4949 | 57 | 0.2441 | 82 | 0.0862 |
| 8 | 1.0969 | 33 | 0.4815 | 58 | 0.2366 | 83 | 0.0809 |
| 9 | 1.0458 | 34 | 0.4685 | 59 | 0.2291 | 84 | 0.0757 |
| 10 | 1.0000 | 35 | 0.4559 | 60 | 0.2218 | 85 | 0.0706 |
| 11 | 0.9586 | 36 | 0.4437 | 61 | 0.2147 | 86 | 0.0655 |
| 12 | 0.9208 | 37 | 0.4318 | 62 | 0.2076 | 87 | 0.0605 |
| 13 | 0.8861 | 38 | 0.4202 | 63 | 0.2007 | 88 | 0.0555 |
| 14 | 0.8539 | 39 | 0.4089 | 64 | 0.1938 | 89 | 0.0506 |
| 15 | 0.8239 | 40 | 0.3979 | 65 | 0.1871 | 90 | 0.0458 |
| 16 | 0.7959 | 41 | 0.3872 | 66 | 0.1805 | 91 | 0.0410 |
| 17 | 0.7696 | 42 | 0.3768 | 67 | 0.1739 | 92 | 0.0362 |
| 18 | 0.7447 | 43 | 0.3665 | 68 | 0.1675 | 93 | 0.0315 |
| 19 | 0.7212 | 44 | 0.3565 | 69 | 0.1612 | 94 | 0.0269 |
| 20 | 0.6990 | 45 | 0.3468 | 70 | 0.1549 | 95 | 0.0223 |
| 21 | 0.6778 | 46 | 0.3372 | 71 | 0.1487 | 96 | 0.0177 |
| 22 | 0.6576 | 47 | 0.3279 | 72 | 0.1427 | 97 | 0.0132 |
| 23 | 0.6383 | 48 | 0.3188 | 73 | 0.1367 | 98 | 0.0088 |
| 24 | 0.6198 | 49 | 0.3098 | 74 | 0.1308 | 99 | 0.0044 |
| 25 | 0.6021 | 50 | 0.3010 | 75 | 0.1249 | 100 | 0.0000 |
Conversion formula: UV absorbance (cm-1) = 2 – log10 UV transmittance (%) |
|||||||
| Parameter | Location | Frequency | ||
|---|---|---|---|---|
| Variable source | Stable source | Ideal | ||
| Colour | Raw and treated | Daily | Weekly | Online |
| UV254 or UV transmittance | Raw and filteredFootnote a | Daily | Weekly | Online |
| COD (optional) | Raw, treatment processesFootnote b and treated | Daily | Weekly | Online |
| DOC | Raw and treated | Weekly | Monthly | Online |
| SUVA—calculate from UV254 and DOC | Raw and treatedFootnote a | Weekly | Monthly | Daily |
| DBPsFootnote c | Distribution system | Quarterly (measure DOC on same day to calculate specific DBP yields to assess NOM reactivity)Footnote c | ||
| Lead | In accordance with corrosion control program | |||
| Copper | In accordance with corrosion control program | |||
| Biological stability -Disinfectant residual -ATP accumulated on mild steel coupons -Linear polarization resistance using mild steel coupons |
Distribution system | Weekly Monthly Monthly |
Weekly Monthly Monthly |
Online |
| Coagulant demand | Coagulation processFootnote d | Daily | Daily | Online |
| Zeta potential or streaming current-when NOM controls or influences coagulant dose | Coagulation processd | Online | Online | Online |
|
||||