
Update on Canadian Bee Incident Reports 2012-2016
Table of Contents
- Introduction
- Background
- Symptoms reported by Beekeepers
- Pollinator Incidents Potentially Associated with Pesticide Spray
- Table 1 Number of bee yards with reported incidents potentially associated with pesticide spray application in Canada 2012–2016
- Table 2 Number of beekeepers who reported incidents potentially associated with pesticide spray application in Canada 2012–2016.
- Pollinator Incidents Reported During the Planting Period of Treated Corn and Soybean Seed
- Pollinator Incidents Occurring After the Completion of Planting of Treated Corn and Soybean Seed
- Table 3 Number of bee yards with reported incidents potentially associated with corn/soybean planting in Canada 2012–2016.
- Table 4 Number of beekeepers reporting incidents potentially associated with corn/soybean planting in Canada 2012–2016.
- Number of colonies reported as potentially affected by pesticides 2012-2016
- Table 5 Number of honey bee colonies reporting potential pesticide related incidents compared to total number of honey bee colonies in Canada.
- Table 6 Number of honey bee colonies reporting potential pesticide related incidents compared to the total number of honey bee colonies per province
Introduction
The intent of this document is to provide an overview of the honey bee incident reports received by Health Canada between 2012 and 2016. Reported incidents include those potentially related to spray events and to dust generated during planting of treated corn/soybean seed. A bee incident is defined as atypical (adverse) effects observed in honey bee colonies suspected by the beekeeper to be related to pesticide exposure. The adverse effects typically observed by the beekeepers include mortality or sub-lethal effects (i.e. twitching, decrease in foragers, etc). Health Canada receives bee incident reports directly from beekeepers and generally considers each potentially affected bee yard a single incident.
Following the increased reporting of honey bee incidents in 2012 during the early spring planting period, Health Canada initiated a program to investigate the potential causes of the increased number of incident reports. It was determined that pesticide-containing dust generated during planting of neonicotinoid-treated corn and soybean seed contributed to the mortalities. Bee mortality incidents continued to be reported in 2013 and the number of reports remained high. Mandatory measures to reduce exposure to pesticide-containing dust during planting of neonicotinoid treated seed were put in place prior to the 2014 planting season. Following implementation of these measures, a significant decrease in the number of incidents was realized during the planting periods in 2014, 2015 and 2016 as compared to 2013. Health Canada continues to monitor and receive information regarding honey bee mortality incidents.
In 2013, in addition to reporting incidents during corn and soy planting, beekeepers began to report symptoms in their bee yards later in the season after the planting of corn and soybean was completed. Symptoms reported during this time were described by beekeepers as strange laying patterns, queen loss and problems establishing queens, lack of foragers and "colonies going backwards". It remains unclear if these later season effects are a result of exposure to low levels of neonicotoinoids in the hives or other factors that affect bee health such as pests and pathogens; habitat loss and food supply or hive management. Health Canada is examining the information collected in an attempt to answer these questions.
To try and better understand the potential factors leading to incidents reported throughout the season, Health Canada, with the assistance of provinces across Canada, monitored selected bee yards to gather information on pesticide exposure and colony health. A more intensive program was completed in Ontario where, with the assistance of the Ontario Ministry of the Environment, Energy and Climate Change and the Ontario Ministry of Agriculture, Food and Rural Affairs, 12 bee yards were monitored over two years to examine pesticide exposure, presence and levels of various pathogens and the surrounding agriculture practices. Results of the 2014/2015 hive monitoring project are being analyzed.
Information on bee incident reports from each province between 2012 and 2016 is presented in this document, including the type of incidents, timing of incidents, and symptoms observed. In order to address the requests of different stakeholders, the information is presented by year and province according to various parameters: the number of potentially affected bee yards reported, the number of colonies potentially affected, and the number of beekeepers reporting incidents.
The numbers presented in this document reflect the information as reported to Health Canada by the beekeepers and/or inspectors through an initial inspection. Beekeepers reported these incidents to Health Canada as they thought the effects observed were associated with pesticide exposure. Additional analysis is being completed by Health Canada to determine the causality of each individual incident which may conclude that factors other than pesticides contributed to the effects observed in some yards. In addition to the causality analysis of the individual reported incidents, Health Canada is currently analysing the honey bee mortality incident data available across all years (2012-2016) to investigate potential trends and factors that may be contributing to bee incidents.
Bee health is a complex issue and evidence suggests that bees are increasingly stressed by a combination of factors. According to Agriculture and Agri-Food Canada, factors that may also impact honey bee health include parasites, pests and pathogens; habitat loss and food supply; queen bee quality; weather; general hive management and exposure to pesticides.
Background
Health Canada’s Pest Management Regulatory Agency (PMRA) regulates pesticide registration in Canada. The registration process involves an assessment of potential health and environmental risks as well as the value of the pesticide. Following initial registrations, Health Canada continues to monitor the acceptability of pesticides through incident reporting, re-evaluation and special review programs.
When assessing the potential risk to pollinators from pesticide exposure, Health Canada considers all potential exposure routes from all application methods and uses. This is true whether the assessment is made pre-market (i.e. prior to registration), or whether it is a post-registration assessment such as a re-evaluation. The most common routes of exposure to pollinators are through application of pesticide sprays and spray drift and the movement of systemic pesticides through the plant to pollen and nectar. To determine the potential for risk to bees, estimated exposure levels from the identified exposure routes are compared to levels at which toxicity to bees is expected. When a potential risk to pollinators is identified, restrictions are put in place to protect pollinators (for example, use of a spray pesticide on flowering crops may be restricted during the bloom period). Even with mitigation measures in place to reduce the risk to pollinators, incidents may still occur. The reporting of incidents allows Health Canada to detect trends in adverse effects or potential risks that may not have been evident during the initial registration of a pesticide. Assessment of these incident reports may lead to additional restrictions and/or label improvements.
When Health Canada receives a report of an incident, an analysis is conducted to determine the causality of each reported incident. Information considered in the causality analysis of incident evaluations includes: potential pesticide exposure and surrounding agriculture (i.e. crops planted and use of pesticides in the area), timing of incident relative to potential pesticide exposure, pesticide residue information, symptoms observed and likelihood they are pesticide related, colony management, and colony health.
It is reiterated that the incident numbers presented in this document are based on the information that has been reported to Health Canada by the beekeepers and/or inspectors through an initial inspection and, at this time, a causality evaluation has not been completed for all incident reports.
Symptoms reported by Beekeepers
Various descriptions were used by beekeepers to describe the symptoms observed in the colonies in their yards. Symptoms reported included, but were not limited to: adult symptoms (mortality, deformed wings, disjointed wings, darkened hairless bodies, twitching, disorientation, crawling, paralysis, loss of foragers); brood symptoms (mortality, uncapping of cells, spotty brood, reduced brood production); and queen symptoms (queen loss, increased supersedures, difficulty establishing queens).
Symptoms typically associated with neurotoxic insecticides include, but are not limited to: adult, brood and queen mortality; twitching; and loss of foragers. These symptoms, as well as other reported symptoms (for example, deformed wings, darkened hairless bodies), can also be associated with the presence of pests and diseases in the colonies.
In order to standardize the symptoms reported and to allow for comparison between provinces and years, Health Canada has classified the symptoms reported into three main categories:
- Dead bees: if the beekeeper only reported observing dead bees, then the yard was counted in this category. The number of dead bees observed by the beekeeper at the hives varies and was recorded by the inspectors. This information will be considered during the assessment of the individual incident report.
- Colony effects: if the beekeeper only reported observing symptoms that are classified as colony effects then the yard was counted in this category. Colony effects were defined as one or more of the following symptoms reported: colony not developing as expected, colonies dwindling, low population, low number of foragers, queen loss or issues establishing queen, loss of population but generally no large number of dead bees.
- Dead bees and colony effects: if the beekeeper reported seeing dead bees and observing symptoms that were classified as colony effects then the yard was counted in this category.
Differences in the symptoms reported with incidents occurring at different times of the season are discussed further in other sections of this document.
Pollinator Incidents Potentially Associated with Pesticide Spray
Figure 1 - Number of bee yards reported as potentially associated with pesticide spray
The title of the graph is "Number of bee yards reported as potentially associated with pesticide spray "
This is a vertical bar chart.
The horizontal axis is "Year"
There are in total 5 categories in the horizontal axis starting at 2012 and ending at 2016.
The vertical axis is "number of bee yards reported as affected"
The vertical axis starts at 0 and ends at 35 with ticks every 5 points.
There is 1 data series in this graph.
The minimum value is 6 and it corresponds to "2013."
The maximum value is 31 and it corresponds to "2012."
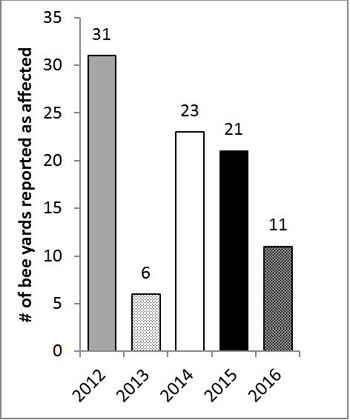
Bee mortality incidents associated with pesticide spraying or spray drift can still occur, even with label restrictions in place. Various factors can result in bee mortality incidents from the foliar spray of pesticides, including pesticide applicators being unaware of honey bee colonies near the application site, or not following label restrictions. If it is determined that the label was not followed correctly, a compliance investigation will occur with appropriate action taken.
Figure 1 summarizes the number of yards across Canada each year that reported incidents potentially associated with pesticide spray application. Of all bee incidents reported to Health Canada between 2012 and 2016 only a small percentage (3 to 13%), were potentially associated with spray application. The information provided for these incidents indicates potential exposure to a variety of pesticides, typically insecticides, used on a variety of crops (Tables 1 and 2). Table 1 presents the number of individual bee yards reported in each province whereas Table 2 presents the number of individual beekeepers that reported in each province. In many cases individual beekeepers reported more than one affected yard.
When a potential spray incident is reported to the PMRA, the information received along with supporting scientific information is used to complete an assessment to determine if the pesticide contributed to the reported effects. If an evaluation of this information identifies a need for further mitigation, Health Canada will act accordingly.
Table 1 Number of bee yards with reported incidents potentially associated with pesticide spray application in Canada 2012–2016
Province |
Number of yards |
||||
|---|---|---|---|---|---|
2012 |
2013 |
2014 |
2015 |
2016* |
|
British Columbia |
--- |
--- |
--- |
1 |
1 |
Alberta |
2 |
--- |
--- |
1 |
1 |
Saskatchewan |
16 |
--- |
--- |
2 |
--- |
Manitoba |
1 |
--- |
1 |
--- |
1** |
Ontario |
1 |
3 |
13 |
14 |
7 |
Quebec |
9 |
3 |
7 |
3 |
1 |
Nova Scotia |
2 |
--- |
2 |
--- |
--- |
National total |
31 |
6 |
23 |
21 |
11 |
* Reported as of 15 November 2016
** This incident was reported in 2016 as an overwintering mortality potentially related to an aerial application of Concept (containing imidacloprid and deltamethrin) in August of 2015
Potential Pesticide Spray: effects reported as potentially associated with pesticide spraying.
Pesticides detected: dimethoate, phosmet, carbaryl, chlorpyrifos, diazinon, clothianidin, permethrin, pyridaben, spinosad; chlorantraniliprole, imidacloprid, lambda-cyhalothrin
Crops mentioned in reports included: Soybean, canola, cucumber, ginseng, watermelon, beans, cranberry, strawberry, cereals, apples, kale/cabbage
Table 2 Number of beekeepers who reported incidents potentially associated with pesticide spray application in Canada 2012–2016
| Province | Number of beekeepers |
||||
|---|---|---|---|---|---|
2012 |
2013 |
2014 |
2015 |
2016* |
|
British Columbia |
--- |
--- |
--- |
1 |
1 |
Alberta |
2 |
--- |
--- |
1 |
1 |
Saskatchewan |
7 |
--- |
--- |
1 |
--- |
Manitoba |
1 |
--- |
1 |
--- |
1 |
Ontario |
1 |
2 |
9 |
2 |
3 |
Quebec |
1 |
2 |
4 |
3 |
1 |
Nova Scotia |
2 |
--- |
2 |
--- |
--- |
National total |
14 |
4 |
16 |
8 |
7 |
* Reported as of 15 November 2016
Potential Pesticide Spray: effects reported as potentially associated with pesticide spraying.
Pesticides detected: dimethoate, phosmet, carbaryl, chlorpyrifos, diazinon, clothianidin, permethrin, pyridaben, spinosad; chlorantraniliprole, imidacloprid, lambda-cyhalothrin
Crops mentioned in reports included: Soybean, canola, cucumber, ginseng, watermelon, beans, cranberry, strawberry, cereals, apples, kale/cabbage
Pollinator Incidents Reported During the Planting Period of Treated Corn and Soybean Seed
Historically, pollinator exposure to pesticides from pesticide-treated seeds was considered to only occur through movement of the pesticide through the plant into pollen and nectar once the plant developed. Through the reporting of honey bee incidents, a new exposure route was identified during planting of treated seed. Reported incidents occurring during planting in the major corn and soybean growing areas of Canada suggested that pollinator exposure to pesticide-containing dust generated during planting of neonicotinoid-treated (imidacloprid,1 clothianidin and thiamethoxam) corn or soybean seed is an exposure route. As a result, Health Canada implemented mitigation measures to reduce potential pollinator exposure to pesticide-containing dust emitted from planters used for corn and soybeans. With this mitigation in place for the 2014 planting, the number of reported incidents during the planting period decreased (Figure 2).
The following describes the history of incident reports and mitigation associated with planting of neonicotinoid treated corn and soybean seed.
Pre-2012
From 2009 to 2011, a total of four honey bee mortality incidents occurring in Quebec, were reported to Health Canada. Three of the incidents were reported to have occurred around the time of planting and the fourth incident occurred in June. A causality evaluation of these incidents concluded that it was highly probable that clothianidin and/or thiamethoxam contributed to the reported mortality; however it was unclear at the time of the assessment if the route of exposure was related to seed dust generated during planting.
2012
During the spring and summer of 2012, a high number of honey bee mortality incidents from the corn growing regions of Ontario and Quebec were reported to Health Canada (Figure 2 and Table 3). Large numbers of dead and/or dying honey bees were observed in bee yards during or shortly after the planting of corn and soybeans in Ontario and Quebec, with dead bees observed in nearly all of the yards reported (Figure 2). The timing and location of these honey bee mortalities appeared to coincide with planting of corn seed treated with neonicotinoids. Health Canada concluded that planting of corn seeds treated with neonicotinoid insecticides contributed to the majority of the bee mortalities that occurred in the major corn growing regions of Ontario and Quebec in 2012, with the likely route of exposure being dust generated during the planting of treated seed containing neonicotinoids (Evaluation of Canadian Bee Mortalities that Coincided with Corn Planting in Spring 2012). To reduce the exposure to dust generated during planting of neonicotinoids treated corn seed Health Canada implemented a mitigation strategy (Pollinator Protection: Reducing Risk from Treated Seed). This strategy included short term measures to be implemented in 2013 and long term measures to be implemented as soon as possible. The measures implemented in 2013 included best management practices (BMPs) for pollinator protection when planting treated seeds; treated seed dust standard; labelling on treated seed tags to alert growers and applicators of the potential hazard treated dust can pose to bees and improved labelling of Pest Control Products. The identified longer term measures that required further technical development included: improved seed coat quality, seed flow lubricants that would reduce dust, technical standards for planting equipment (ISO 17962) and treated seed bag disposal.
2013
Reports of honey bee mortality incidents in 2013 began at the time of corn and soybean planting (Figure 2 and Table 3), continuing to suggest exposure during the spring planting period. With this continued reporting, particularly during the planting period, Health Canada concluded that current agriculture practices related to the use of neonicotinoid treated corn and soybean were not sustainable and implemented additional mitigation measures to reduce the potential exposure of pollinators to rogue dust from planters used for corn and soybean (Notice of Intent, NOI2013-01, Action to Protect Bees from Exposure to Neonicotinoid Pesticides; Update on Actions to Protect Bees from Exposure to Neonicotinoid Pesticides, Notice of Intent, NOI2013-01). These measures included the mandatory use of a new dust-reducing fluency agent for those growers that plant neonicotinoid treated corn or soybean seeds using vacuum planters, along with improved label statements on both product labels and treated seed tags which indicated the toxicity of the pesticides to pollinators and the measures to reduce exposure to dust during planting of treated seed (Requirement when using Treated Corn / Soybean Seed). In addition to the measures outlined above, Health Canada continued to encourage the use of BMPs for the protection of pollinators from both the use of treated seed and spray applications (Pollinator Protection and Responsible Use of Treated Seed - Best Management Practices and Protecting Pollinators during Pesticide Spraying - Best Management Practices).
2014
With the mandatory use of a dust-reducing fluency agent and improved label statements in place for the start of the 2014 planting season, Health Canada continued to receive reports of honey bee mortalities in the spring. The number of reports received at the time of planting was reduced by 70% in comparison to the number of reports in 2013 (Figure 2 and Table 3). While this reduction seemed to suggest that the mitigation measures implemented were reducing exposure, there was some uncertainty given the cool and wet weather experienced during the spring of 2014 in Southwestern Ontario, where the majority of the reports had previously occurred. These weather conditions meant that corn seed could not always be planted, resulting in an extended corn planting period where some growers switched to soybeans (Update on Neonicotinoid Pesticides and Bee Health - Conclusions and Next Steps).
2015
In 2015, with mitigation measures still in place and more typical planting weather, the number of reported incidents during the planting period decreased further, with the number of incidents reported being ~80% less than in 2013 (Figure 2 and Table 3).
2016
In 2016, Health Canada again received reports of honey bee mortalities coinciding with corn planting in Southwestern Ontario. The number of bee yards with reported effects during the planting period is similar to that reported in 2014 and 2015 (Figure 2 and Table 3), representing a 75% decrease from 2013. The severity and symptoms reported in 2016 appear to be similar to those observed in 2014 and 2015 (Figure 2).
Figure 2 - Number of yards reported as potentially associated with planting of treated corn and soybean during the planting period 2012-2016. Total number of yards reported during the planting period as well as the number and proportion of different symptoms reported are presented.
The title of this figure is "Number of yards reported as potentially associated with planting of treated corn and soybean during the planting period 2012-2016. Total number of yards reported during the planting period as well as the number and proportion of different symptoms reported are presented"
This figure contains two plots
Plot 1 presents the number of yards reported at planting with various symptoms.
This is a stacked vertical bar chart.
The horizontal axis is "Year"
There are in total 5 categories in the horizontal axis starting at 2012 and ending at 2016.
The vertical axis is "number of bee yards reported at planting"
The vertical axis starts at 0 and ends at 300 with ticks every 50 points.
There are 3 data series in this graph.
The title of series 1 is "Number of bee yards reported at planting with dead bees"
The minimum value is 42 and it corresponds to "2015."
The maximum value is 243 and it corresponds to "2012."
The title of series 2 is "Number of bee yards reported at planting with dead bees and colony effects"
The minimum value is 0 and it corresponds to "2012."
The maximum value is 15 and it corresponds to "2013."
The title of series 3 is "Number of bee yards reported at planting with colony effects"
The minimum value is 0 and it corresponds to "2016."
The maximum value is 61 and it corresponds to "2013."
Plot 2 presents the proportion of yards each year reported at planting with various symptoms
This is a stacked vertical bar chart.
The horizontal axis is "Year"
There are in total 5 categories in the horizontal axis starting at 2012 and ending at 2016.
The vertical axis is "proportion of bee yards reported at planting"
The vertical axis starts at 0 and ends at 100% with tick every 10%.
There are 3 data series in this graph.
The title of series 1 is "Proportion of bee yards reported at planting with dead bees"
The minimum value is 71% and it corresponds to "2013."
The maximum value is 97.6% and it corresponds to "2012."
The title of series 2 is "Proportion of bee yards reported at planting with dead bees and colony effects"
The minimum value is 0% and it corresponds to "2012."
The maximum value is 9.9% and it corresponds to "2016."
The title of series 3 is "Number of bee yards reported at planting with colony effects"
The minimum value is 0% and it corresponds to "2016."
The maximum value is 23% and it corresponds to "2013."
Figure 2, Plot 1: Number of yards with various symptoms reported as potentially associated with planting of treated corn and soybean during the planting period 2012-2016.
Figure 2, Plot 2: Proportion of yards with various symptoms reported as potentially associated with planting of treated corn and soybean during the planting period 2012-2016.

Pollinator Incidents Occurring After the Completion of Planting of Treated Corn and Soybean Seed
In 2012, the pollinator incidents reported in corn and soybean growing regions occurred primarily during the planting period of corn and soybean (Figure 2 and Figure 3). Starting in 2013 the number of pollinator incident reports increased after the planting of treated corn and soybean seed was completed. A further increase in the number of post-plant reports was observed in 2014 with a decrease in 2015 and 2016 (Figure 3).
Following the initial year of reporting, the beekeepers began to report different types of symptoms (i.e. strange laying patterns, queen loss and problems establishing queens, lack of foragers, "colonies going backwards", etc.). While some of these symptoms were documented in those reports that occurred during planting (Figure 2), the majority of these were reported after planting was completed. These types of reports began in 2013 (Figure 3). The proportion of the number of yards reporting these colony effect symptoms during the post-plant period increased to > 70% of the total reports during the post-plant period in 2014 and 2015 (Figure 3, plot 2).
It remains unclear if these later season effects are a result of exposure to low levels of neonicotinoids in the hives or other factors that affect bee health, such as pests and pathogens, habitat loss and food supply, or hive management. Following the 2012 reporting season beekeepers have become more vigilant of reporting unusual symptoms observed in their colonies which could account for some of the increased reporting observed following planting. Health Canada is examining the information gathered for these post-plant incidents to try to determine if pesticides or other factors may have contributed to the effects observed. Additionally, information collected in the hive monitoring project will be considered along with the incident data to try to answers these questions.
Figure 3 - Number of yards reported as potentially associated with planting of treated corn and soybean after the planting period 2012-2016. Total number of yards reported during the planting period as well as the number and proportion of different symptoms reported are presented
The title of this figure is "Number of yards reported as potentially associated with planting of treated corn and soybean after the planting period 2012-2016. Total number of yards reported during the planting period as well as the number and proportion of different symptoms reported are presented"
This figure contains two plots
Plot 1 presents the number of yards reported after planting with various symptoms.
This is a stacked vertical bar chart.
The horizontal axis is "Year"
There are in total 5 categories in the horizontal axis starting at 2012 and ending at 2016.
The vertical axis is "number of bee yards reported at planting"
The vertical axis starts at 0 and ends at 350 with ticks every 50 points.
There are 3 data series in this graph.
The title of series 1 is "Number of bee yards reported after planting with dead bees"
The minimum value is 2 and it corresponds to "2012."
The maximum value is 89 and it corresponds to "2013."
The title of series 2 is "Number of bee yards reported after planting with dead bees and colony effects"
The minimum value is 0 and it corresponds to "2015."
The maximum value is 43 and it corresponds to "2013."
The title of series 3 is "Number of bee yards reported after planting with colony effects"
The minimum value is 0 and it corresponds to "2012."
The maximum value is 204 and it corresponds to "2014."
Plot 2 presents the proportion of yards each year reported at planting with various symptoms
This is a stacked vertical bar chart.
The horizontal axis is "Year"
There are in total 5 categories in the horizontal axis starting at 2012 and ending at 2016.
The vertical axis is "proportion of bee yards reported after planting"
The vertical axis starts at 0 and ends at 100% with tick every 10%.
There are 3 data series in this graph.
The title of series 1 is "Proportion of bee yards reported after planting with dead bees"
The minimum value is 23% and it corresponds to "2015."
The maximum value is 66.7% and it corresponds to "2012."
The title of series 2 is "Proportion of bee yards reported after planting with dead bees and colony effects"
The minimum value is 0% and it corresponds to "2015."
The maximum value is 33% and it corresponds to "2012."
The title of series 3 is "Number of bee yards reported after planting with colony effects"
The minimum value is 0% and it corresponds to "2012."
The maximum value is 76.9% and it corresponds to "2015."
Figure 3, Plot 1: Number of yards with various symptoms reported as potentially associated with planting of treated corn and soybean after the planting period 2012-2016.
Figure 3, Plot 2: Proportion of yards with various symptoms reported as potentially associated with planting of treated corn and soybean after the planting period 2012-2016.
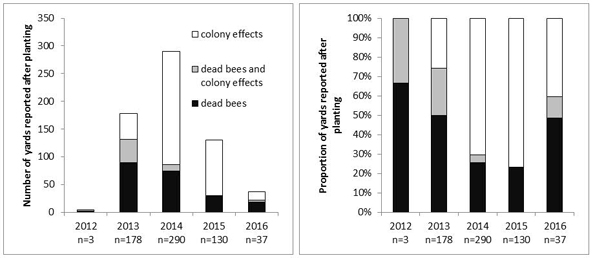
Table 3 presents the number of individual bee yards reported in the corn and soybean growing region in each province whereas Table 4 presents the number of individual beekeepers that reported from the corn and soybean growing region in each province. In many cases individual beekeepers reported more than one affected yard.
Table 3 Number of bee yards with reported incidents potentially associated with corn/soybean planting in Canada 2012–2016
[yards are tabulated according to season reported]
Province |
Season |
Number of yards |
||||
|---|---|---|---|---|---|---|
2012 |
2013 |
2014 |
2015 |
2016** |
||
Potential Corn/Soy Planting: effects reported as potentially associated with planting of neonicotinoid treated seed |
||||||
Ontario |
Overwinter |
--- |
3 |
36 |
31 |
--- |
Pre-plant |
--- |
--- |
6 |
2 |
3 |
|
At-plant |
241 |
248 |
66 |
40 |
56 |
|
Post-plant |
3 |
170 |
280 |
126 |
30 |
|
Off-season |
--- |
--- |
29 |
--- |
--- |
|
Ontario total* |
|
244 |
421 |
416 |
199 |
89 |
Ontario unique*** |
|
241 |
393 |
377 |
188 |
80 |
Quebec |
Pre-plant |
--- |
--- |
--- |
--- |
--- |
At-plant |
8 |
8 |
8 |
4 |
6 |
|
Post-plant |
--- |
4 |
6 |
1 |
7**** |
|
Quebec total* |
|
8 |
12 |
14 |
5 |
13 |
Quebec unique*** |
|
8 |
12 |
14 |
5 |
13 |
Manitoba |
Pre-plant |
--- |
--- |
--- |
--- |
--- |
At-plant |
--- |
6 |
1 |
3 |
1 |
|
Post-plant |
--- |
4 |
4 |
3 |
--- |
|
Manitoba total* |
|
--- |
10 |
5 |
6 |
1 |
Manitoba unique*** |
|
--- |
10 |
5 |
6 |
1 |
Alberta |
Pre-plant |
--- |
--- |
--- |
--- |
--- |
At-plant |
--- |
--- |
--- |
3† |
--- |
|
Post-plant |
--- |
--- |
--- |
--- |
--- |
|
Alberta total* |
|
--- |
--- |
--- |
3 |
--- |
Alberta unique*** |
|
--- |
--- |
--- |
3 |
--- |
National unique total*** |
|
249 |
415 |
396 |
202 |
94 |
* Column totals: Each yard is counted once in each season it was reported; some yards may have been reported in more than one season.
** The post-plant period for 2016 is not complete, the numbers presented in this table are as of 15 November 2016
*** The unique number counts each bee yard once even if the same bee yard is reported during different seasons
**** At the time of the reporting of these reports the potential contribution of pesticides was in question
† these yards were reported during planting period; however, not located in a corn/soybean growing region
Season Definitions |
|
|---|---|
Overwinter |
reports indicated that overwintering losses were suspected to be related to pesticide exposure and pesticide-related poor colony condition in the fall before overwintering |
Pre-plant |
yard reported with pesticide related symptoms prior to start of corn and soybean planting season |
At plant |
yard reported during the corn and soybean planting season (based on Ontario corn and soybean planting dates - 2012:2012-04-04–2012-05-14; 2013:2013-05-01–2013-05-30; 2014:2014-05-01–2014-06-10; 2015:2015-05-02–2015-05-30; 2016: 2016-04-28 – 2016-05-30). |
Post-plant |
incidents that occurred following corn/soy planting |
Off season |
very late season reports; many of the hives had been or were in the process of being winterized |
Table 4 Number of beekeepers reporting incidents potentially associated with corn/soybean planting in Canada 2012–2016
[beekeepers are tabulated according to season reported]
Province |
Season |
Number of beekeepers |
||||
|---|---|---|---|---|---|---|
2012 |
2013 |
2014 |
2015 |
2016** |
||
Potential Corn/Soy Planting: effects reported as potentially associated with planting of neonicotinoid treated seed |
||||||
Ontario |
Overwinter |
--- |
3 |
9 |
7 |
--- |
Pre-plant |
--- |
--- |
3 |
1 |
2 |
|
At-plant |
40 |
63 |
30 |
19 |
20 |
|
Post-plant |
|
45 |
37 |
15 |
12 |
|
Off-season |
--- |
--- |
9 |
--- |
--- |
|
Ontario total* |
|
|
111 |
88 |
42 |
34 |
Ontario unique*** |
|
40 |
76 |
61 |
34 |
28 |
Quebec |
Pre-plant |
--- |
--- |
--- |
--- |
--- |
At-plant |
1 |
5 |
7 |
3 |
6 |
|
Post-plant |
--- |
4 |
2 |
1 |
2 |
|
Quebec total* |
|
|
9 |
9 |
4 |
8 |
Quebec unique*** |
|
1 |
9 |
9 |
4 |
8 |
Manitoba |
Pre-plant |
--- |
--- |
--- |
--- |
--- |
At-plant |
--- |
2 |
1 |
2 |
1 |
|
Post-plant |
--- |
2 |
1 |
2 |
--- |
|
Manitoba total* |
|
--- |
4 |
2 |
4 |
1 |
Manitoba unique*** |
|
--- |
4 |
2 |
4 |
1 |
Alberta |
Pre-plant |
--- |
--- |
--- |
--- |
--- |
At-plant |
--- |
--- |
--- |
1† |
--- |
|
Post-plant |
--- |
--- |
--- |
--- |
--- |
|
Alberta total* |
|
--- |
--- |
--- |
1 |
--- |
Alberta unique*** |
|
--- |
--- |
--- |
1 |
--- |
National unique total*** |
|
41 |
89 |
72 |
43 |
37 |
* Column totals: Each beekeeper is counted once in each season they reported; some beekeepers may have reported in more than one season.
** The numbers presented in this table are as of 15 November 2016
*** The unique number counts each beekeeper once even if the same beekeeper reported during different seasons
† This beekeeper reported during planting period; however, not located in a corn/soybean growing region.
Season Definitions |
|
|---|---|
Overwinter |
reports indicated that overwintering losses were suspected to be related to pesticide exposure and pesticide-related poor colony condition in the fall before overwintering |
Pre-plant |
yard reported with pesticide related symptoms prior to start of corn and soybean planting season |
At plant |
yard reported during the corn and soybean planting season (based on Ontario corn and soybean planting dates - 2012:2012-04-04–2012-05-14; 2013:2013-05-01–2013-05-30; 2014:2014-05-01–2014-06-10; 2015:2015-05-02–2015-05-30; 2016: 2016-04-28 – 2016-05-30). |
Post-plant |
incidents that occurred following corn/soy planting |
Off season |
very late season reports; many of the hives had been or were in the process of being winterized |
Number of colonies reported as potentially affected by pesticides 2012-2016
The number of honey bee colonies reported to be potentially affected by pesticides is small in comparison to the total number of colonies managed in Canada. Statistics Canada reports on the total number of honey bee colonies managed in each province per year. The data from 2012–2015 (Statistics Canada) is presented in Table 5 and 6. The numbers of colonies reported to Health Canada as potentially affected by pesticides at national and provincial levels are also presented in Table 5 and 6, respectively. The data presented in these tables are not separated into planting and post-plant incidents. While the percentage of colonies potentially affected by pesticides is small relative to the total number of colonies managed in Canada, it is important to note that the majority of the incidents reported are located in a localized area of Southwestern Ontario and that data from Statistics Canada considers the entire province.
Table 5 Number of honey bee colonies reporting potential pesticide related incidents compared to total number of honey bee colonies in Canada
Year |
Number of colonies in Canada* |
Colonies reported as potentially affected by pesticides through planting of neonicotinoid treated seed |
Colonies reported as potentially affected by pesticide spraying |
||
|---|---|---|---|---|---|
Number (i) |
% National total |
Number (i) |
% of National total |
||
2012 |
690 037 |
6530 |
0.95% |
1975 |
0.3% |
2013 |
667 397 |
10 930 |
1.6% |
485 |
0.07% |
2014 |
696 252 |
9260 |
1.3% |
1427 |
0.2% |
2015 |
721 106 |
3470 |
0.5% |
828 |
0.1% |
2016 |
Not available |
3855 |
Not available |
170 |
Not available |
*Source Statistics Canada; data for 2016 not available
(i) As of 15 November 2016: The number of colonies is the estimated number of colonies reported as potentially affected. In most cases the number of colonies in each yard and the number of potentially affected colonies were available. However, for some yards, this information was not available and was estimated as follows. If the number of colonies present in the yard was reported but the numbers of colonies potentially affected were not reported, it was assumed that all the colonies in the yard were potentially affected. Where no information was available about the number of colonies in a yard, an average of 20 colonies potentially affected per yard was used as an estimate.
Table 6 Number of honey bee colonies reporting potential pesticide related incidents compared to the total number of honey bee colonies per province
Province |
2012 |
2013 |
2014 |
2015 |
2016 (i) |
|---|---|---|---|---|---|
# of colonies maintained by beekeepers in Canada (ii) |
|||||
British Columbia |
42 560 |
42 544 |
44 999 |
45 571 |
NA |
Alberta |
278 400 |
278 100 |
282 900 |
295 000 |
NA |
Saskatchewan |
110 000 |
100 000 |
95 000 |
101 000 |
NA |
Manitoba |
80 000 |
73 800 |
78 700 |
90 909 |
NA |
Ontario |
101 000 |
97 500 |
112 800 |
101 135 |
NA |
Quebec |
49 708 |
47 203 |
49 635 |
53 000 |
NA |
New Brunswick |
5650 |
4318 |
5441 |
6710 |
NA |
Nova Scotia |
19 000 |
19 500 |
23 000 |
23 776 |
NA |
Prince Edward Island |
3719 |
4432 |
3777 |
4005 |
NA |
National |
690 037 |
667 397 |
696 252 |
721 106 |
NA |
|
# of colonies reported as potentially affected by pesticides through planting of neonicotinoid treated seed (iii) |
||||
Ontario |
5750 |
10 400 |
8970 |
3100 |
3075 |
Quebec |
780 |
260 |
220 |
270 |
740 |
Manitoba |
--- |
305 |
70 |
100 |
40 |
National |
6530 |
10 930 |
9260 |
3470 |
3855 |
|
# of colonies reported as potentially affected by pesticide spraying (iii) |
||||
British Columbia |
--- |
--- |
--- |
3 |
1 |
Alberta |
60 |
--- |
--- |
100 |
21 |
Saskatchewan |
1135 |
--- |
--- |
185 |
--- |
Manitoba |
20 |
--- |
25 |
--- |
--- |
Ontario |
4 |
65 |
200 |
355 |
128 |
Quebec |
615 |
420 |
1200 |
185 |
20 |
Nova Scotia |
140 |
--- |
2 |
--- |
--- |
National |
1975 |
485 |
1427 |
828 |
170 |
--- means that no reports were received
NA = not available
(i) As of 15 November 2016
(ii) Source Statistics Canada; data for 2016 not available
(iii) The # of colonies is the estimated number of colonies reported as potentially affected by pesticide exposure. In most cases the number of colonies in each yard and the number of potentially affected colonies were available. However, for some yards, this information was not available and was estimated as follows. If the number of colonies present in the yard was reported but the numbers of colonies potentially affected were not reported, it was assumed that all the colonies in the yard were potentially affected. Where no information was available about the number of colonies in a yard, an average of 20 colonies potentially affected per yard was used as an estimate.
As stated, the intent of this document was to provide an overview of the honey bee incident reports received by Health Canada between 2012 and 2016. Information on bee incident reports from each province between 2012 and 2016 was presented in this document, including the type of incidents, timing of incidents, and symptoms observed. The numbers presented in this document reflect the information as reported to Health Canada by the beekeepers and/or inspectors. Further work is being completed to analyse the honey bee mortality incident data available across all years (2012-2016) to investigate potential trends and factors that may be contributing to bee incidents. Concurrently, data collected in the hive monitoring project is being analyzed by Health Canada, the Ontario Ministry of Agriculture, Food and Rural Affairs and the Ontario Ministry of the Environment and Climate Change.
1
Imidacloprid is registered for use as a seed treatment on corn and soybean; however, in practice it is generally not used on corn and soybean. This active ingredient was included in the mitigation as it is registered for this use.