
Lead in Canadians
Download the alternative format
(PDF format, 415 KB, 13 pages)
Organization: Health Canada
Date published: 2021-12-14
Information on human biomonitoring of lead in Canada with results from the Canadian Health Measures Survey.
On this page
Background
What is lead?
Lead (CASRN 7439-92-1) is a naturally occurring metal. It enters the environment through both natural and industrial processes. Lead persists in the environment and can accumulate over time.
Where is lead found?
Lead is present in bedrock, soils, sediments and bodies of water. Lead released from industrial emissions can be a major source of environmental contamination, especially near smelters or refineries. Lead is used in some consumer products and can be found in many foods.
How are people exposed to lead?
Canadian adults are exposed to lead mainly in food and drinking water. Infants and children may be further exposed by ingesting non-food items, such as house dust, paint, soil and consumer products.
How is lead measured in people?
Lead is absorbed into the bloodstream after being ingested. Measurement of lead in blood is the preferred indicator of exposure.
What are the potential health impacts of lead?
Chronic low-level exposure to lead has been associated with nervous system effects, cardiovascular disease, decreased kidney function and reproductive problems. Lead exposure in infants and children is associated with lowered intelligence quotient (IQ) and a greater risk of attention-related behaviours. No safe level of exposure is known to exist for these neurodevelopmental outcomes. The International Agency for Research on Cancer has classified inorganic lead compounds as probably carcinogenic to humans.
What is the Government of Canada doing to lower human exposures to lead?
Lead is identified as toxic under the Canadian Environmental Protection Act, 1999. It is subject to numerous federal risk management initiatives directed toward industrial releases. Regulations under the Canada Consumer Product Safety Act limit the amount of lead in various consumer products. Health Canada has established maximum levels for lead in some foods. There are also guidelines in place for lead in Canadian drinking water. Health Canada's risk management strategy for lead outlines additional regulations. The Government of Canada continues to monitor and assess lead.
Data sources
| Initiative | Target population |
|---|---|
| Canadian Health Measures Survey (CHMS) | General Canadian population living in the 10 provinces |
| First Nations Biomonitoring Initiative (FNBI) | First Nations people living on-reserve south of the 60° parallel |
| Maternal-Infant Research on Environmental Chemicals (MIREC) study | Pregnant women and their infants recruited from obstetric and prenatal clinics in 10 cities across Canada |
| International Polar Year Inuit Health Survey (IPY IHS) | Inuit populations from the Inuvialuit Settlement Region (ISR), Nunavut and Nunatsiavut |
| U.S. National Health and Nutrition Examination Survey (NHANES) | General U.S. population |
This fact sheet presents nationally representative data from the CHMS. These data are compared with data from the FNBI, the MIREC study, the IPY IHS and the U.S. NHANES.
| Collection period | Age range (years) | Matrix | Biomarker |
|---|---|---|---|
| CHMS | |||
| 2007–2009 | 6 to 79 | Blood | Lead |
| 2009–2011 | 3 to 79 | Blood | Lead |
| 2012–2013 | 3 to 79 | Blood | Lead |
| 2014–2015 | 3 to 79 | Blood | Lead |
| 2016–2017 | 3 to 79 | Blood | Lead |
| 2018–2019 | 3 to 79 | Blood | Lead |
| FNBI | |||
| 2011 | 20+ | Blood | Lead |
| MIREC study | |||
| 2008–2011 | 18+ | Blood | Lead |
| IPY IHS | |||
| 2007–2008 | 18+ | Blood | Lead |
| U.S. NHANES | |||
| 2007–2008 | 1+ | Blood | Lead |
| 2009–2010 | 1+ | Blood | Lead |
| 2011–2012 | 1+ | Blood | Lead |
| 2013–2014 | 1+ | Blood | Lead |
| 2015–2016 | 1+ | Blood | Lead |
Results
Canadian population
This figure shows the geometric mean concentrations of lead in blood (µg/dL) in the Canadian population from the CHMS (2007–2019).
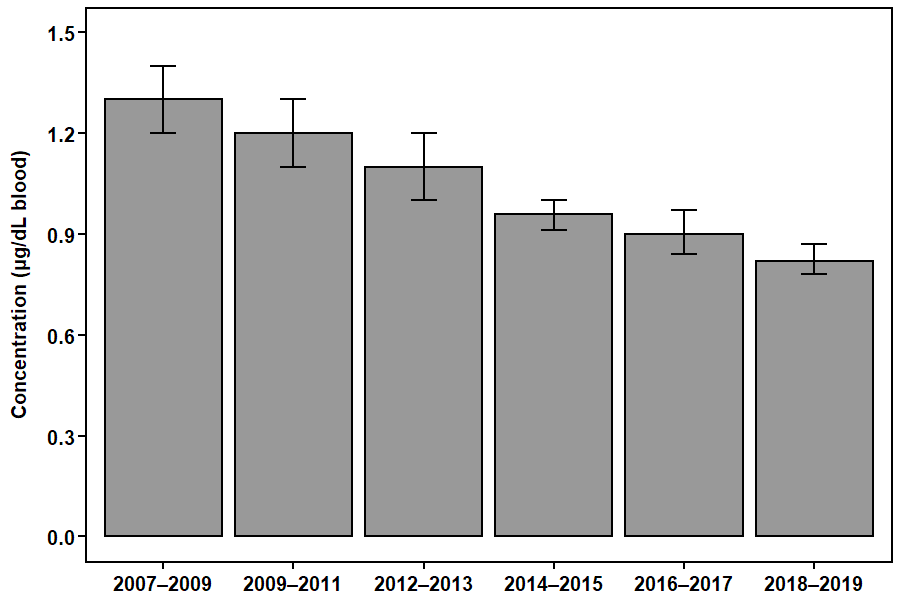
Figure 1: Text description
| Collection period | Geometric mean |
|---|---|
| 2007–2009 | 1.3 |
| 2009–2011 | 1.2 |
| 2012–2013 | 1.1 |
| 2014–2015 | 0.96 |
| 2016–2017 | 0.90 |
| 2018–2019 | 0.82 |
There was a statistically significant decreasing trend (P < 0.001) in lead concentrations in the Canadian population aged 6 to 79. Concentrations declined by 38% between 2007–2009 and 2018–2019.
Canadian population, by age group
This figure shows the geometric mean concentrations of lead in blood (µg/dL) in the Canadian population by age group from the CHMS (2007–2019). Lead was measured in individuals aged 6 to 79 in 2007–2009. Concentrations were therefore not available (NA) for individuals aged 3 to 5.
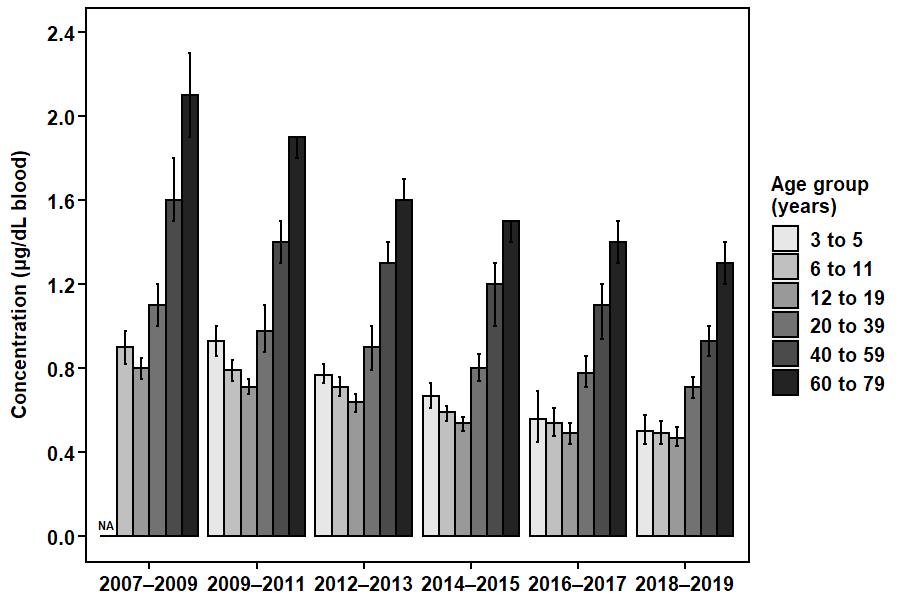
Figure 2: Text description
| Collection period | Age group (years) | Geometric mean |
|---|---|---|
| 2007–2009 | 3 to 5 | NA |
| 2007–2009 | 6 to 11 | 0.90 |
| 2007–2009 | 12 to 19 | 0.80 |
| 2007–2009 | 20 to 39 | 1.1 |
| 2007–2009 | 40 to 59 | 1.6 |
| 2007–2009 | 60 to 79 | 2.1 |
| 2009–2011 | 3 to 5 | 0.93 |
| 2009–2011 | 6 to 11 | 0.79 |
| 2009–2011 | 12 to 19 | 0.71 |
| 2009–2011 | 20 to 39 | 0.98 |
| 2009–2011 | 40 to 59 | 1.4 |
| 2009–2011 | 60 to 79 | 1.9 |
| 2012–2013 | 3 to 5 | 0.77 |
| 2012–2013 | 6 to 11 | 0.71 |
| 2012–2013 | 12 to 19 | 0.64 |
| 2012–2013 | 20 to 39 | 0.90 |
| 2012–2013 | 40 to 59 | 1.3 |
| 2012–2013 | 60 to 79 | 1.6 |
| 2014–2015 | 3 to 5 | 0.67 |
| 2014–2015 | 6 to 11 | 0.59 |
| 2014–2015 | 12 to 19 | 0.54 |
| 2014–2015 | 20 to 39 | 0.80 |
| 2014–2015 | 40 to 59 | 1.2 |
| 2014–2015 | 60 to 79 | 1.5 |
| 2016–2017 | 3 to 5 | 0.56 |
| 2016–2017 | 6 to 11 | 0.54 |
| 2016–2017 | 12 to 19 | 0.49 |
| 2016–2017 | 20 to 39 | 0.78 |
| 2016–2017 | 40 to 59 | 1.1 |
| 2016–2017 | 60 to 79 | 1.4 |
| 2018–2019 | 3 to 5 | 0.50 |
| 2018–2019 | 6 to 11 | 0.49 |
| 2018–2019 | 12 to 19 | 0.47 |
| 2018–2019 | 20 to 39 | 0.71 |
| 2018–2019 | 40 to 59 | 0.93 |
| 2018–2019 | 60 to 79 | 1.3 |
Concentrations of lead were higher in older adults than in children, adolescents and younger adults in the Canadian population.
Canadian population, by sex
This figure shows the geometric mean concentrations of lead in blood (µg/dL) in the Canadian population by sex from the CHMS (2007–2019).
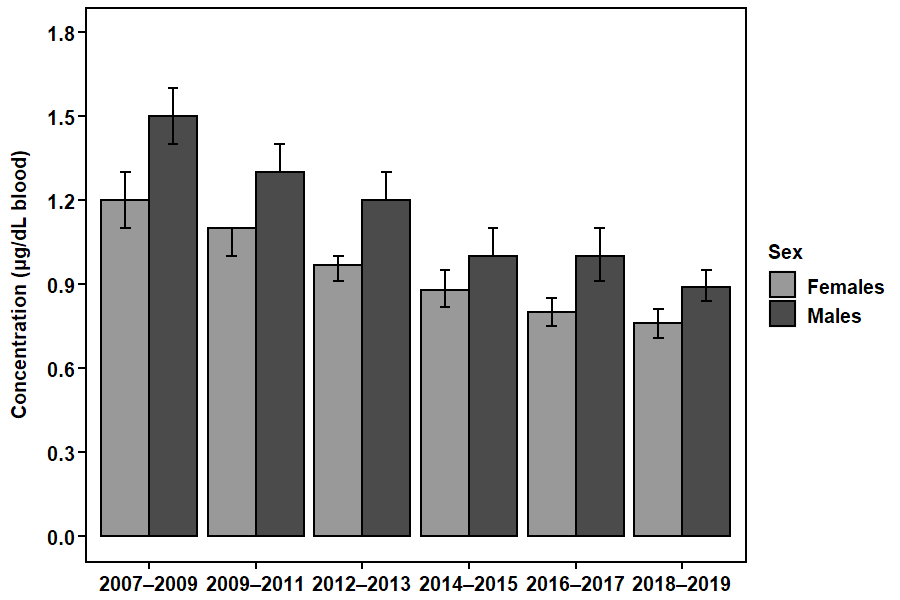
Figure 3: Text description
| Collection period | Sex | Geometric mean |
|---|---|---|
| 2007–2009 | Females | 1.2 |
| 2007–2009 | Males | 1.5 |
| 2009–2011 | Females | 1.1 |
| 2009–2011 | Males | 1.3 |
| 2012–2013 | Females | 0.97 |
| 2012–2013 | Males | 1.2 |
| 2014–2015 | Females | 0.88 |
| 2014–2015 | Males | 1.0 |
| 2016–2017 | Females | 0.80 |
| 2016–2017 | Males | 1.0 |
| 2018–2019 | Females | 0.76 |
| 2018–2019 | Males | 0.89 |
Concentrations of lead were higher in males than in females in the Canadian population.
Comparison of the general population and First Nations on-reserve population in Canada
This figure shows the geometric mean concentrations of lead in blood (µg/dL) in the general population aged 20 to 79 from the CHMS (2009–2011) and in the First Nations on-reserve population aged 20 and older from the FNBI (2011).
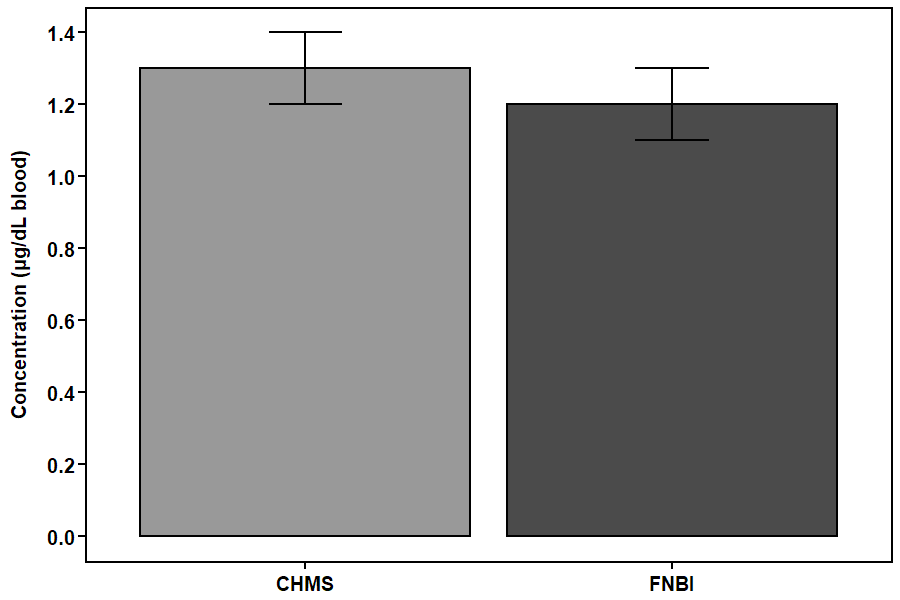
Figure 4: Text description
| Biomonitoring initiative | Geometric mean |
|---|---|
| CHMS | 1.3 |
| FNBI | 1.2 |
Concentrations of lead were similar between the general population and First Nations on-reserve population in Canada.
Comparison of women of child-bearing age and pregnant women in Canada
This figure shows the geometric mean concentrations of lead in blood (µg/dL) for women of child-bearing age (18 to 49) in the general population from the CHMS (2009–2011) and for women in the first or third trimester of pregnancy from the MIREC study (2008–2011).
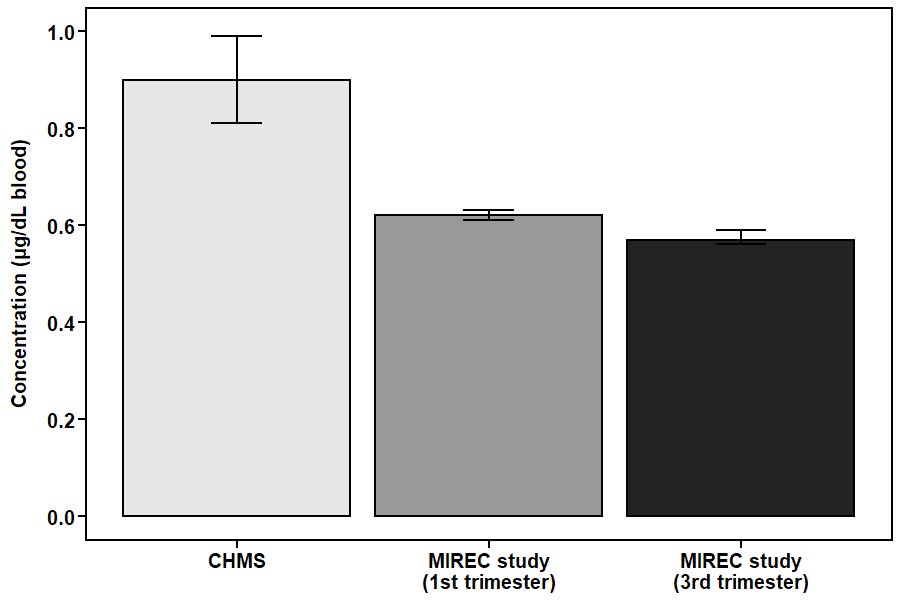
Figure 5: Text description
| Biomonitoring initiative | Geometric mean |
|---|---|
| CHMS | 0.90 |
| MIREC study (1st trimester) | 0.62 |
| MIREC study (3rd trimester) | 0.57 |
Concentrations of lead were higher in women of child-bearing age in the general population than in women in the first or third trimester of pregnancy in cities across Canada.
Comparison of the general population and Inuit populations in Canada
This figure shows the geometric mean concentrations of lead in blood (µg/dL) in females and males in the general population aged 18 to 79 from the CHMS (2007–2009) and in Inuit populations aged 18 and older in the ISR, Nunavut and Nunatsiavut from the IPY IHS (2007–2008).
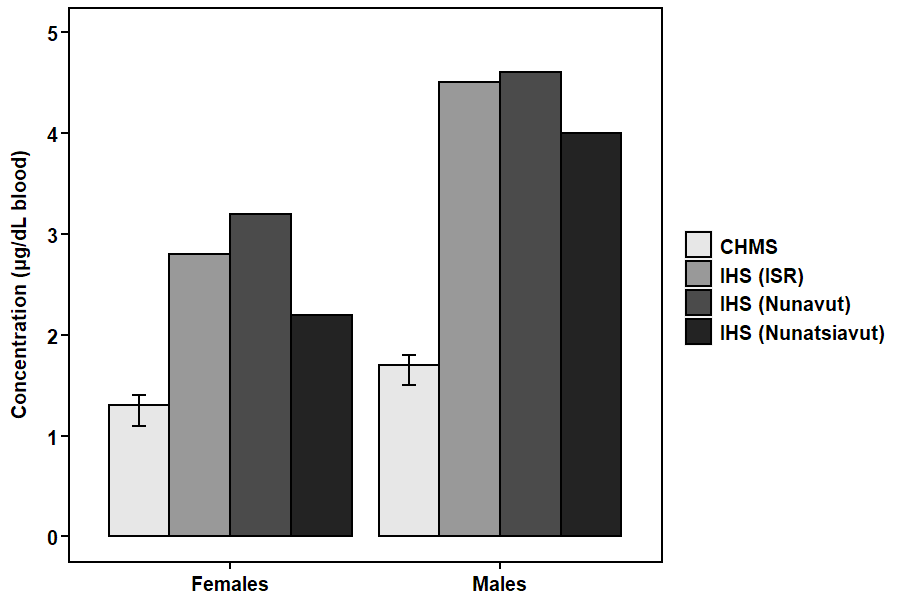
Figure 6: Text description
| Biomonitoring initiative | Sex | Geometric mean |
|---|---|---|
| CHMS | Females | 1.3 |
| CHMS | Males | 1.7 |
| IHS (ISR) | Females | 2.8 |
| IHS (ISR) | Males | 4.5 |
| IHS (Nunavut) | Females | 3.2 |
| IHS (Nunavut) | Males | 4.6 |
| IHS (Nunatsiavut) | Females | 2.2 |
| IHS (Nunatsiavut) | Males | 4.0 |
Concentrations of lead were higher in Inuit populations in the ISR, Nunavut and Nunatsiavut than in the general population in Canada.
Comparison of the Canadian and U.S. populations
This figure shows the geometric mean concentrations of lead in blood (µg/dL) in the Canadian population from the CHMS (2007–2019) and in the U.S. population from the NHANES (2007–2016). Note that there are slight differences between the surveys in sampling (such as the age ranges of participants) and analysis (such as the limits of detection).
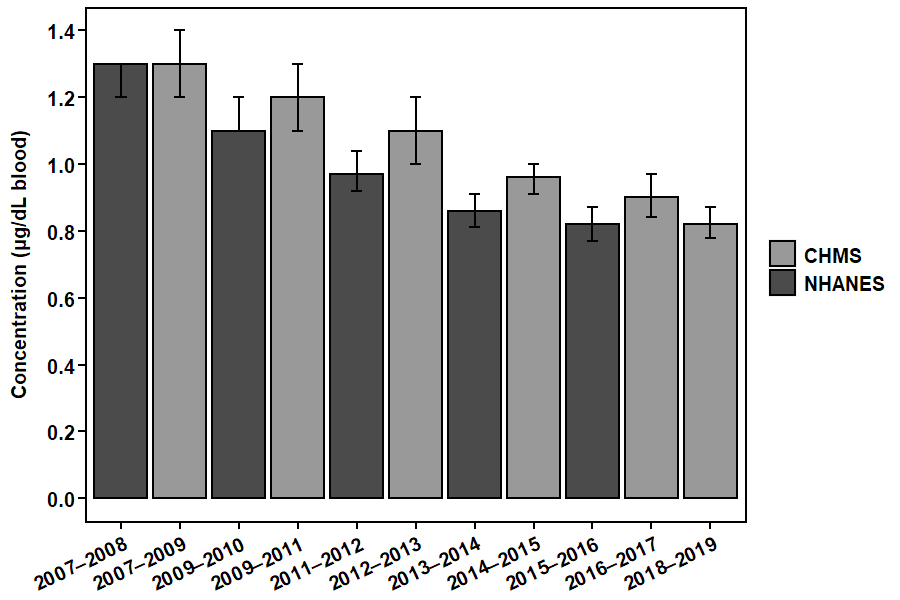
Figure 7: Text description
| Biomonitoring initiative | Collection period | Geometric mean |
|---|---|---|
| CHMS | 2007–2009 | 1.3 |
| CHMS | 2009–2011 | 1.2 |
| CHMS | 2012–2013 | 1.1 |
| CHMS | 2014–2015 | 0.96 |
| CHMS | 2016–2017 | 0.90 |
| CHMS | 2018–2019 | 0.82 |
| NHANES | 2007–2008 | 1.3 |
| NHANES | 2009–2010 | 1.1 |
| NHANES | 2011–2012 | 0.97 |
| NHANES | 2013–2014 | 0.86 |
| NHANES | 2015–2016 | 0.82 |
Concentrations of lead were similar between the Canadian and U.S. populations.
Suggested citation
Health Canada. 2021. Lead in Canadians. Ottawa, ON. Available: https://www.canada.ca/en/health-canada/services/environmental-workplace-health/reports-publications/environmental-contaminants/human-biomonitoring-resources/lead-canadians.html
Additional information
- Arbuckle TE, Liang CL, Morisset A-S, Fisher M, Weiler H, Cirtiu CM, Legrand M, Davis K, Ettinger AS, Fraser WD, MIREC Study Group. 2016. Maternal and fetal exposure to cadmium, lead, manganese and mercury: The MIREC study. Chemosphere, 163: 270–282.
- Assembly of First Nations. 2013. First Nations Biomonitoring Initiative: National Results (2011). Ottawa, ON, Canada.
- Centers for Disease Control and Prevention. 2021. National Report on Human Exposure to Environmental Chemicals. Atlanta, GA, USA.
- Crown-Indigenous Relations and Northern Affairs Canada. 2017. Canadian Arctic Contaminants Assessment Report (CACAR IV): Human Health Assessment. Ottawa, ON, Canada.
- Government of Canada. 2020. Evaluation of the effectiveness of risk management measures for lead. Ottawa, ON, Canada.
- Health Canada. 2010. Report on Human Biomonitoring of Environmental Chemicals in Canada: Results of the Canadian Health Measures Survey Cycle 1 (2007–2009). Ottawa, ON, Canada.
- Health Canada. 2013. Risk Management Strategy for Lead. Ottawa, ON, Canada.
- Health Canada. 2013. Second Report on Human Biomonitoring of Environmental Chemicals in Canada: Results of the Canadian Health Measures Survey Cycle 2 (2009–2011). Ottawa, ON, Canada.
- Health Canada. 2015. Third Report on Human Biomonitoring of Environmental Chemicals in Canada: Results of the Canadian Health Measures Survey Cycle 3 (2012–2013). Ottawa, ON, Canada.
- Health Canada. 2017. Fourth Report on Human Biomonitoring of Environmental Chemicals in Canada: Results of the Canadian Health Measures Survey Cycle 4 (2014–2015). Ottawa, ON, Canada.
- Health Canada. 2019. Fifth Report on Human Biomonitoring of Environmental Chemicals in Canada: Results of the Canadian Health Measures Survey Cycle 5 (2016–2017). Ottawa, ON, Canada.
- Health Canada. 2021. Sixth Report on Human Biomonitoring of Environmental Chemicals in Canada: Results of the Canadian Health Measures Survey Cycle 6 (2018–2019). Ottawa, ON, Canada.