
Enteric Protozoa: Giardia and Cryptosporidium
Download the alternative format
(PDF format, 1.1 MB, 121 pages)
Organization: Health Canada
Type: Guideline
Published: 2019-04-12
Health Canada, Ottawa, Ontario
April, 2019
Table of Contents
- Part I. Overview and Application
- 1.0 Guideline
- 2.0 Executive summary
- 3.0 Application of the guideline
- Part II. Science and Technical Considerations
- 4.0 Description
- 5.0 Sources and exposure
- 6.0 Analytical methods
- 6.1 Sample collection
- 6.2 Sample filtration and elution
- 6.3 Sample concentration and separation
- 6.4 (Oo)cyst identification
- 6.5 Recovery efficiencies
- 6.6 Assessing viability and infectivity
- 7.0 Treatment technology
- 7.1 Municipal scale
- 7.2 Residential scale
- 8.0 Health effects
- 9.0 Risk assessment
- 10.0 Rationale
- 11.0 References
- Appendix A: Other enteric waterborne protozoa of interest: Toxoplasma gondii, Cyclospora cayetanensis, Entamoeba histolytica, and Blastocystis hominis
- Appendix B: Selected outbreaks related to Giardia and Cryptosporidium
- Appendix C: List of acronyms
Part I. Overview and Application
1.0 Guideline
Where treatment is required for enteric protozoa, the guideline for Giardia and Cryptosporidium in drinking water is a health-based treatment goal of a minimum 3 log removal and/or inactivation of cysts and oocysts. Depending on the source water quality, a greater log removal and/or inactivation may be required. Treatment technologies and source water protection measures known to reduce the risk of waterborne illness should be implemented and maintained if source water is subject to faecal contamination or if Giardia or Cryptosporidium have been responsible for past waterborne outbreaks.
2.0 Executive summary
Protozoa are a diverse group of microorganisms. Most are free-living organisms that can reside in fresh water and pose no risk to human health. Some enteric protozoa are pathogenic and have been associated with drinking water related outbreaks. The main protozoa of concern in Canada are Giardia and Cryptosporidium. They may be found in water following direct or indirect contamination by the faeces of humans or other animals. Person-to-person transmission is a major route of exposure for both Giardia and Cryptosporidium.
Health Canada recently completed its review of the health risks associated with enteric protozoa in drinking water. This guideline technical document reviews and assesses identified health risks associated with enteric protozoa in drinking water. It evaluates new studies and approaches and takes into consideration the methodological limitations for the detection of protozoa in drinking water. Based on this review, the drinking water guideline is a health-based treatment goal of a minimum 3 log reduction of enteric protozoa.
2.1 Health effects
The health effects associated with exposure to Giardia and Cryptosporidium (oo)cysts, like those of other pathogens, depend upon features of the host, pathogen and environment. The immune status of the host, virulence of the strain, infectivity and viability of the cyst or oocyst, and the degree of exposure are all key determinants of infection and illness. Infection with Giardia or Cryptosporidium can result in both acute and chronic health effects.
Theoretically, a single cyst of Giardia would be sufficient to cause infection. However, studies have only demonstrated infection being caused by more than a single cyst, and the number of cysts needed is dependent on the virulence of the particular strain. Typically, Giardia is non-invasive and results in asymptomatic infections. Symptomatic giardiasis can result in nausea, diarrhea (usually sudden and explosive), anorexia, an uneasiness in the upper intestine, malaise and occasionally low-grade fever or chills. The acute phase of the infection commonly resolves spontaneously, and organisms generally disappear from the faeces. Some patients (e.g., children) suffer recurring bouts of the disease, which may persist for months or years.
As is the case for Giardia and other pathogens, a single organism of Cryptosporidium can potentially cause infection, although studies have only demonstrated infection being caused by more than one organism. Individuals infected with Cryptosporidium are more likely to develop symptomatic illness than those infected with Giardia. Symptoms include watery diarrhea, cramping, nausea, vomiting (particularly in children), low-grade fever, anorexia and dehydration. The duration of infection depends on the condition of the immune system. Immunocompetent individuals usually carry the infection for a maximum of 30 days. In immunocompromised individuals, infection can be life-threatening and can persist throughout the immunosuppression period.
2.2 Exposure
Giardia cysts and Cryptosporidium oocysts can survive in the environment for extended periods of time, depending on the characteristics of the water. They have been shown to withstand a variety of environmental stresses, including freezing and exposure to seawater. (Oo)cysts are commonly found in Canadian surface waters. The sudden and rapid influx of these microorganisms into surface waters, for which available treatment may not be adequate, is likely responsible for the increased risk of exposure through drinking water. (Oo)cysts have also been detected at low concentrations in groundwater supplies; contamination is usually as a result of the proximity of the well to contamination sources, including inadequate filtration in some geological formations, as well as improper design and/or maintenance of the well.
Giardia and Cryptosporidium are common causes of waterborne disease outbreaks and have been linked to both inadequately treated surface water and untreated well water. Giardia is the most commonly reported intestinal protozoan in Canada, North America and the world.
2.3 Analysis and treatment
A risk management approach, such as the source-to-tap approach or a water safety plan approach, is the best method to reduce enteric protozoa and other waterborne pathogens in drinking water. This type of approach requires a system assessment to characterize the source water, describe the treatment barriers that are in place, identify the conditions that can result in contamination, and implement the control measures needed to mitigate risks. One aspect of source water characterization is routine and targeted monitoring for Giardia and Cryptosporidium. Monitoring of source water for protozoa can be targeted by using information about sources of faecal contamination, together with historical data on rainfall, snowmelt, river flow and turbidity, to help identify the conditions that are likely to lead to peak concentrations of (oo)cysts. A validated method that allows for the simultaneous detection of these protozoa is available. Where monitoring for Giardia and Cryptosporidium is not feasible (e.g., small community water supplies), identifying the conditions that can result in contamination can provide guidance on necessary risk management measures to implement (e.g., source water protection, adequate treatment, operational monitoring, standard operating procedures and contingency plans).
Once the source has been characterized, pathogen reduction targets should be established and effective treatment barriers should be in place to achieve safe levels in the treated drinking water. In general, all water supplies derived from surface water sources or groundwater under the direct influence of surface waters (GUDI) should include adequate filtration (or equivalent technologies) and disinfection. The combination of physical removal (e.g., filtration) and inactivation barriers (e.g., ultraviolet light disinfection) is the most effective way to reduce protozoa in drinking water, because of their resistance to commonly used chlorine-based disinfectants.
The absence of indicator bacteria (e.g., Escherichia coli, total coliforms) does not necessarily indicate the absence of enteric protozoa. The application and control of a source-to-tap or water safety plan approach, including process and compliance monitoring (e.g., turbidity, disinfection conditions, E. coli), is important to verify that the water has been adequately treated and is therefore of an acceptable microbiological quality. In the case of untreated groundwater, testing for indicator bacteria is useful in assessing the potential for faecal contamination, which may include enteric protozoa.
2.4 Quantitative microbial risk assessment
Quantitative microbial risk assessment (QMRA) is a tool that uses source water quality data, treatment barrier information and pathogen-specific characteristics to estimate the burden of disease associated with exposure to pathogenic microorganisms in drinking water. QMRA is generally used for two purposes. It can be used to set pathogen reduction targets during the development of drinking water quality guidelines, such as is done in this document. It can also be used to prioritize risks on a site-specific basis as part of a source-to-tap or water safety plan approach.
Specific enteric protozoa whose characteristics make them a good representative of all similar pathogenic protozoa are reference protozoan pathogens. It is assumed that controlling the reference protozoan would ensure control of all other similar protozoa of concern. Giardia lamblia and Cryptosporidium parvum have been selected as the reference protozoa for this risk assessment because of their high prevalence rates, potential to cause widespread disease, resistance to chlorine disinfection and the availability of dose-response models.
2.5 International considerations
Drinking water guidelines, standards and/or guidance from other national and international organizations may vary due to the age of the assessments as well as differing policies and approaches.
Various organizations have established guidelines or standards for enteric protozoa in drinking water. The U.S. EPA generally requires drinking water systems to achieve a 3 log removal or inactivation of Giardia, and a minimum 2-log removal or inactivation of Cryptosporidium. More treatment may be required for Cryptosporidium depending on the results of Cryptosporidium monitoring in the water source. The World Health Organization recommends providing QMRA-based performance targets as requirements for the reduction of enteric protozoa. Neither the European Union nor the Australian National Health and Medical Research Council have established a guideline value or standard for enteric protozoa in drinking water.
3.0 Application of the guideline
Note: Specific guidance related to the implementation of drinking water guidelines should be obtained from the appropriate drinking water authority in the affected jurisdiction.
Exposure to Giardia and Cryptosporidium should be reduced by implementing a risk management approach to drinking water systems, such as the source-to-tap or a water safety plan approach. These approaches require a system assessment that involves: characterizing the water source; describing the treatment barriers that prevent or reduce contamination; highlighting the conditions that can result in contamination; and identifying control measures to mitigate those risks through the treatment and distribution systems to the consumer.
3.1 Source water assessments
Source water assessments should be part of routine system assessments. They should include: the identification of potential sources of human and animal faecal contamination in the watershed/aquifer; potential pathways and/or events (low to high risk) by which protozoa can make their way into the source water and affect water quality; and conditions likely to lead to peak concentrations. Ideally, they should also include routine monitoring for Giardia and Cryptosporidium in order to establish a baseline, followed by long-term targeted monitoring to identify peak concentrations during specific events (e.g., rainfall, snowmelt, low flow conditions for rivers receiving discharges from wastewater treatment plants). Where monitoring for Giardia and Cryptosporidium is not feasible (e.g., small community water supplies), other approaches, such as implementing a source-to-tap or water safety plan approach, can provide guidance on identifying and implementing necessary risk management measures (e.g., source water protection, adequate treatment, operational monitoring, standard operating procedures and contingency plans).
Where monitoring is possible, sampling sites and frequencies can be targeted by using information about sources of faecal contamination, together with historical data on rainfall, snowmelt, river flow and turbidity. Source water assessments should also consider the "worst-case" scenario for that source water. It is important to understand the potential faecal inputs to the system to determine "worst-case" scenarios, as they will be site-specific. For example, there may be a short period of poor source water quality following a storm. This short-term degradation in water quality may in fact embody most of the risk in a drinking water system. Collecting and analyzing source water samples for Giardia and Cryptosporidium can provide important information for determining the level of treatment and mitigation (risk management) measures that should be in place to reduce the concentration of (oo)cysts to an acceptable level.
Subsurface sources should be evaluated to determine if the supply is vulnerable to contamination by enteric protozoa (i.e., GUDI) and other enteric pathogens. These assessments should include, at a minimum, a hydrogeological assessment, an evaluation of well integrity and a survey of activities and physical features in the area. Chlorophyll-containing algae are considered unequivocal evidence of surface water. Jurisdictions that require microscopic particulate analysis (MPA) as part of their GUDI assessment should ensure chlorophyll-containing algae are a principal component of any MPA test. Subsurface sources determined to be GUDI should achieve a minimum 3 log removal and/or inactivation of enteric protozoa. Subsurface sources that have been assessed as not vulnerable to contamination by enteric protozoa, if properly classified, should not have protozoa present. However, all groundwater sources will have a degree of vulnerability and should be periodically reassessed. It is important that subsurface sources be properly classified as numerous outbreaks have been linked to the consumption of untreated well water contaminated with enteric protozoa and/or other enteric pathogens.
3.2 Appropriate treatment barriers
As most surface waters and GUDI supplies are subject to faecal contamination, treatment technologies should be in place to achieve a minimum 3 log (99.9%) removal and/or inactivation of Giardia and Cryptosporidium. In many surface water sources, a greater log reduction may be necessary.
Log reductions can be achieved through physical removal processes, such as filtration, and/or inactivation processes, such as UV light disinfection. Generally, minimum treatment of supplies derived from surface water or GUDI sources should include adequate filtration (or technologies providing an equivalent log reduction credit) and disinfection. The appropriate type and level of treatment should take into account potential fluctuations in water quality, including short-term water quality degradation, and variability in treatment performance. Pilot testing or other optimization processes may be useful for determining treatment variability.
Private well owners (i.e., semi-public supply or individual household) should assess the vulnerability of their well to faecal contamination to determine if the water should be treated. Well owners should have an understanding of the well construction, type of aquifer material surrounding the well and location of the well in relation to sources of faecal contamination (i.e., septic systems, sanitary sewers, animal waste, etc.). General guidance on well construction, maintenance, protection and testing is typically available from provincial/territorial jurisdictions. If a private well owner is not able to determine if their well is vulnerable to faecal contamination, the responsible drinking water authority in the affected jurisdiction should be contacted to identify possible treatment options.
3.3 Appropriate maintenance and operation of distribution systems
Contamination of distribution systems with enteric protozoa has been responsible for waterborne illness. As a result, maintaining the physical/hydraulic integrity of the distribution system and minimizing negative- or low-pressure events are key components of a source-to-tap or water safety plan approach. Distribution system water quality should be regularly monitored (e.g., microbial indicators, disinfectant residual, turbidity, pH), operations/maintenance programs should be in place (e.g., water main cleaning, cross-connection control, asset management) and strict hygiene should be practiced during all water main construction (e.g., repair, maintenance, new installation) to ensure that drinking water is transported to the consumer with minimum loss of quality.
Part II. Science and Technical Considerations
4.0 Description
Protozoa are a diverse group of eukaryotic, typically unicellular, microorganisms. The majority of protozoa are free-living organisms that can reside in fresh water and pose no risk to human health. However, some protozoa are pathogenic to humans. These protozoa fall into two functional groups: enteric protozoa and free-living protozoa. Human infections caused by free-living protozoa (e.g., Naegleria, Acanthamoeba spp.) are generally the result of contact during recreational bathing (or domestic uses of water other than drinking); as such, this group of protozoa is addressed in the Guidelines for Canadian Recreational Water Quality (Health Canada, 2012a). Enteric protozoa, on the other hand, have been associated with several drinking water-related outbreaks, and drinking water serves as a significant route of transmission for these organisms. A discussion of enteric protozoa is therefore presented here.
Enteric protozoa are common parasites in the gut of humans and other mammals. They, like enteric bacteria and viruses, can be found in water following direct or indirect contamination by the faeces of humans and other animals. These microorganisms can be transmitted via drinking water and have been associated with several waterborne outbreaks in North America and elsewhere (Schuster et al., 2005; Karanis et al., 2007; Baldursson and Karanis, 2011; Efstratiou et al., 2017). The ability of this group of microorganisms to produce (oo)cysts that are extremely resistant to environmental stresses and commonly used chlorine-based disinfectants has facilitated their ability to spread and cause illness.
The enteric protozoa that are most often associated with waterborne disease in Canada are Giardia and Cryptosporidium. These protozoa are commonly found in surface waters: some strains are highly pathogenic, can survive for long periods of time in the environment and are highly resistant to chlorine-based disinfection. Thus, they are the focus of the following discussion. A brief description of other enteric protozoa of human health concern (i.e., Toxoplasma gondii, Cyclospora cayetanensis, Entamoeba histolytica, and Blastocystis hominis) is provided in Appendix A. It is important to note that throughout this document, the common names for enteric protozoa are used for clarity. Proper scientific nomenclature is used only when necessary to accurately present scientific findings.
4.1 Giardia
Giardia is a flagellated protozoan parasite (Phylum Metamonada, Subphylum Trichozoa, Superclass Eopharyngia, Class Trepomonadea, Subclass Diplozoa, Order Giardiida, Family Giardiidae) (Cavalier-Smith, 2003; Plutzer et al., 2010). It was first identified in human stool by Antonie van Leeuwenhoek in 1681 (Boreham et al., 1990). However, it was not recognized as a human pathogen until the 1960s, after community outbreaks and its identification in travellers (Craun, 1986; Farthing, 1992). Illness associated with this parasite is known as giardiasis.
4.1.1 Life cycle
Giardia inhabits the small intestines of humans and other animals. The trophozoite, or feeding stage, lives mainly in the duodenum but is often found in the jejunum and ileum of the small intestine. Trophozoites (9–21 µm long, 5–15 µm wide and 2–4 µm thick) have a pear-shaped body with a broadly rounded anterior end, two nuclei, two slender median rods, eight flagella in four pairs, a pair of darkly staining median bodies and a large ventral sucking disc (cytostome). Trophozoites are normally attached to the surface of the intestinal villi, where they are believed to feed primarily upon mucosal secretions. After detachment, the binucleate trophozoites form cysts (encyst) and divide within the original cyst, so that four nuclei become visible. Cysts are ovoid, 8–18 µm long by 5–15 µm wide (U.S. EPA, 2012), with two or four nuclei and visible remnants of organelles. Environmentally stable cysts are passed out in the faeces, often in large numbers. A complete life cycle description can be found elsewhere (Adam, 2001; Carranza and Lujan, 2010).
4.1.2 Species
The taxonomy of the genus Giardia continuously changes as data on the isolation and identification of new species and genotypes, strain phylogeny and host specificity become available. The current taxonomy of the genus Giardia is based on the species definition proposed by Filice (1952), who defined three species: G. duodenalis (syn. G. intestinalis, G. lamblia), G. muris and G. agilis, based on the shape of the median body, an organelle composed of microtubules that is most easily observed in the trophozoite. Other species have subsequently been described on the basis of cyst morphology and molecular analysis. Currently, six Giardia species are recognized (Table 1), although recent work suggests Giardia duodenalis (syn. G. intestinalis, G. lamblia) assemblages A and B may be distinct species and should be renamed (Prystajecky et al., 2015). Three synonyms (G. lamblia, G. intestinalis and G. duodenalis) have been and continue to be used interchangeably in the literature to describe the Giardia isolates from humans, although this species is capable of infecting a wide range of mammals. This species will be referred to as G. lamblia for this document. Molecular characterization of this species has demonstrated the existence of genetically distinct assemblages: assemblages A and B infect humans and other mammals, whereas the remaining assemblages (C, D, E, F and G) have not yet been isolated from humans and appear to have restricted host ranges (and likely represent different species or groupings) (Adam, 2001; Thompson, 2004; Thompson and Monis, 2004; Xiao et al., 2004; Smith et al., 2007; Plutzer et al., 2010). Due to the genetic diversity within assemblages A and B, these grouping have also been characterized into sub-assemblages (Cacciò and Ryan, 2008; Plutzer et al., 2010).
| Species (assemblage) | Major host(s) |
|---|---|
| G. agilis | Amphibians |
| G. ardeae | Birds |
| G. lamblia, syn. G. intestinalis, syn. G. duodenalis | |
(A) |
Humans, livestock, other mammals |
(B) |
Humans |
(C) |
Dogs |
(D) |
Dogs |
(E) |
Cattle, other hoofed livestock |
(F) |
Cats |
(G) |
Rats |
| G. microti | Muskrats, voles |
| G. muris | Rodents |
| G. psittaci | Birds |
In addition to genetic dissimilarities, the variants of G. lamblia also exhibit phenotypic differences, including differential growth rates and drug sensitivities (Homan and Mank, 2001; Read et al., 2002). The genetic differences have been exploited as a means of distinguishing human-infective Giardia from other strains or species (Amar et al., 2002; Cacciò et al., 2002, 2010; Read et al., 2004); however, the applicability of these methods to analysis of Giardia within water has been limited (see section 6.6). Thus, at present, it is necessary to consider that any Giardia cysts found in water are potentially infectious to humans.
4.2 Cryptosporidium
Cryptosporidium is a protozoan parasite (Phylum Apicomplexa, Class Gregarinomorphea, Subclass Cryptogregaria; Ryan et al., 2016). The genus Cryptosporidium is currently the sole member of the newly described Cryptogregaria subclass. The illness caused by this parasite is known as cryptosporidiosis. It was first recognized as a potential human pathogen in 1976 in a previously healthy three-year-old child (Nime et al., 1976). A second case of cryptosporidiosis occurred two months later in an individual who was immunosuppressed as a result of drug therapy (Meisel et al., 1976). The disease became best known in immunosuppressed individuals exhibiting the symptoms now referred to as acquired immunodeficiency syndrome, or AIDS (Hunter and Nichols, 2002).
4.2.1 Life cycle
The recognition of Cryptosporidium as a human pathogen led to increased research into the life cycle of the parasite and an investigation of the possible routes of transmission. Cryptosporidium has a multi-stage life cycle. The entire life cycle takes place in a single host and evolves in six major stages, including both sexual and asexual stages: 1) excystation, where sporozoites are released from an excysting oocyst; 2) schizogony (syn. merogony), where asexual reproduction takes place; 3) gametogony, the stage at which gametes are formed; 4) fertilization of the macrogametocyte by a microgamete to form a zygote; 5) oocyst wall formation; and 6) sporogony, where sporozoites form within the oocyst (Current, 1986). A complete life cycle description and diagram can be found elsewhere (Smith and Rose, 1990; Hijjawi et al., 2004; Fayer and Xiao, 2008). Syzygy, a sexual reproduction process that involves association of the pre-gametes end to end or laterally prior to the formation of gametes, was described in two species of Cryptosporidium, C. parvum and C. andersoni, providing new information regarding Cryptosporidium's biology (life cycle) and transmission (Hijjawi et al., 2002; Rosales et al., 2005).
As a waterborne pathogen, the most important stage in Cryptosporidium's life cycle is the round, thick-walled, environmentally stable oocyst, 4–6 µm in diameter. The nuclei of sporozoites can be stained with fluorogenic dyes such as 4′,6-diamidino-2-phenylindole (DAPI). Upon ingestion by humans, the parasite completes its life cycle in the digestive tract. Ingestion initiates excystation of the oocyst and releases four sporozoites, which adhere to and invade the enterocytes of the gastrointestinal tract (Spano et al., 1998; Pollok et al., 2003). The resulting intracellular parasitic vacuole contains a feeding organelle along with the parasite, which is protected by an outer membrane. The outer membrane is derived from the host cell. The sporozoite undergoes asexual reproduction (schizogony), releasing merozoites that spread the infection to neighbouring cells. Sexual multiplication (gametogony) then takes place, producing either microgametes ("male") or macrogametes ("female"). Microgametes are then released to fertilize macrogametes and form zygotes. A small proportion (20%) of zygotes fail to develop a cell wall and are termed "thin-walled" oocysts. These forms rupture after the development of the sporozoites, but prior to faecal passage, thus maintaining the infection within the host. The majority of the zygotes develop a thick, environmentally resistant cell wall and four sporozoites to become mature oocysts, which are then passed in the faeces.
4.2.2 Species
Our understanding of the taxonomy of the genus Cryptosporidium is continually being updated. Cryptosporidium was first described by Tyzzer (1907), when he isolated the organism, which he named Cryptosporidium muris, from the gastric glands of mice. Tyzzer (1912) found a second isolate, which he named C. parvum, in the intestine of the same species of mice. This species has since been renamed to C. tyzzeri (Ryan et al., 2014). At present, 29 valid species of Cryptosporidium have been recognized (Table 2) (Ryan et al., 2014; Zahedi et al., 2016). The main species of Cryptosporidium associated with illness in humans are C. hominis and C. parvum. They account for more than 90% of human cryptosporidiosis cases (Bouzid et al., 2013). The majority of remaining human cases are caused by C. meleagridis and C. cuniculus. A minority of cases have been attributed to C. ubiquitum, C. canis, C. felis, and C. viatorum. Other species have been found in rare instances. Although many species of Cryptosporidium have not yet been found to cause illness in humans, it should not be inferred that they are incapable of causing illness in humans, only that to date, they have not been implicated in sporadic cases or outbreaks of cryptosporidiosis. These findings have important implications for communities whose source water may be contaminated by faeces from animal sources (see Table 2). The epidemiological significance of these genotypes is still unclear, but findings suggest that certain genotypes are adapted to humans and transmitted (directly or indirectly) from person to person. Thus, at present, all Cryptosporidium oocysts found in water are usually considered potentially infectious to humans, although genotyping information may be used to further inform risk management decisions.
| Species (genotype) | Major host | Human health concernTable 2 footnote a |
|---|---|---|
| C. andersoni | Cattle | + |
| C. baileyi | Poultry | - |
| C. bovis | Cattle | + |
| C. canis | Dogs | ++ |
| C. cuniculus | Rabbits | ++ |
| C. erinacei | Hedgehogs and horses | + |
| C. fayeri | Marsupials | + |
| C. felis | Cats | ++ |
| C. fragile | Toads | - |
| C. galli | Finches, chickens | - |
| C. hominis (genotype H, I or 1) | Humans, monkeys | +++ |
| C. huwi | Fish | - |
| C. macropodum | Marsupials | - |
| C. meleagridis | Turkeys, humans | ++ |
| C. molnari | Fish | - |
| C. muris | Rodents | + |
| C. parvum (genotype C, II or 2) | Cattle, other ruminants, humans | +++ |
| C. rubeyi | Squirrel | - |
| C. ryanae | Cattle | - |
| C. scophthalmi | Turbot | - |
| C. scrofarum | Pigs | + |
| C. serpentis | Reptiles | - |
| C. suis | Pigs | + |
| C. tyzzeri | Rodents | + |
| C. ubiquitum | Ruminants, rodents, primates | ++ |
| C. varanii | Lizards | - |
| C. viatorum | Humans | ++ |
| C. wrairi | Guinea pigs | - |
| C. xiaoi | Sheep, goats | + |
Table 2 footnotes
- Table 2 footnote a
-
Human health concern is based solely on the frequency of detection of the species from human cryptosporidiosis cases, designation may change as new cases of cryptosporidiosis are identified
- +++ Most frequently associated with human illness
- ++ Has caused human illness, but infrequently
- + Has caused human illness, but only a few very rare cases (very low risk)
- - Has never been isolated from humans
In addition to the 29 species of Cryptosporidium that have been identified, over 40 genotypes of Cryptosporidium, for which a strain designation has not been made, have also been proposed among various animal groups, including rodents, marsupials, reptiles, fish, wild birds and primates (Fayer, 2004; Xiao et al., 2004; Feng et al., 2007; Smith et al., 2007; Fayer et al., 2008; Xiao and Fayer, 2008; Ryan et al., 2014). Research suggests that these genotypes vary with respect to their development, drug sensitivity and disease presentation (Chalmers et al., 2002; Xiao and Lal, 2002; Thompson and Monis, 2004; Xiao et al., 2004).
5.0 Sources and exposure
5.1 Guardia
5.1.1 Sources
Human and other animal faeces are major sources of Giardia. Giardiasis has been shown to be endemic in humans and in over 40 other species of animals, with prevalence rates ranging from 1% to 5% in humans, 10% to 100% in cattle, and 1% to 20% in pigs (Olson et al., 2004; Pond et al., 2004; Thompson, 2004; Thompson and Monis, 2004). Giardia cysts are excreted in large numbers in the faeces of infected humans and other animals (both symptomatic and asymptomatic). Infected cattle, for example, have been shown to excrete up to one million (106) cysts per gram of faeces (O'Handley et al., 1999; Ralston et al., 2003; O'Handley and Olson, 2006). Other mammals, such as beaver, dog, cat, muskrat and horses have also been shown to shed human-infective species of Giardia in their faeces (Davies and Hibler, 1979; Hewlett et al., 1982; Erlandsen and Bemrick, 1988; Erlandsen et al., 1988; Traub et al., 2004, 2005; Eligio-García et al., 2005). Giardia can also be found in bear, bird and other animal faeces, but it is unclear whether these strains are pathogenic to humans (refer to section 5.1.3). Cysts are easily disseminated in the environment and are transmissible via the faecal–oral route. This includes transmission through faecally contaminated water (directly, or indirectly through food products), as well as direct contact with infected humans or animals (Karanis et al., 2007; Plutzer et al., 2010).
Giardia cysts are commonly found in sewage and surface waters and occasionally in groundwater sources and treated water.
Surface water
Table 3 highlights a selection of studies that have investigated the occurrence of Giardia in surface waters in Canada. Typically, Giardia concentrations in surface waters range from 2 to 200 cysts/100 L (0.02 to 2 cysts/L). Concentrations as high as 8,700 cysts/100 L (87 cysts/L) have been reported and were associated with record spring runoff, highlighting the importance of event-based sampling (Gammie et al., 2000). Recent studies in Canada have also investigated the species of Giardia present in surface waters. G. lamblia assemblages A and B were the most common variants detected (Edge et al., 2013; Prystajecky et al., 2014). This has also been found internationally (Cacciò and Ryan, 2008; Alexander et al., 2014; Adamska, 2015).
| Province | Site/watershed | Frequency of positive samples | Unit of measure | Giardia concentration (cysts/100 L)Table 3 footnote b | Reference |
|---|---|---|---|---|---|
| National survey | Various | 245/1,173 | Maximum | 230 | Wallis et al., 1996 |
| Alberta | Not available | 1/1 | Single sample | 494 | LeChevallier et al., 1991a |
| Alberta | North Saskatchewan River, Edmonton | N/A | Annual geometric mean | 8–193 | Gammie et al., 2000 |
| Maximum | 2,500Table 3 footnote c | ||||
| Alberta | North Saskatchewan River, Edmonton | N/A | Annual geometric mean | 98 | EPCOR, 2005 |
| Maximum | 8,700 | ||||
| British Columbia | Black Mountain Irrigation District | 24/27 | Geometric mean | 60.4 | Ong et al., 1996 |
| Vernon Irrigation District | 68/70 | 26 | |||
| Black Mountain Irrigation District | 24/27 | Range | 4.6–1,880 | ||
| Vernon Irrigation District | 68/70 | 2–114 | |||
| British Columbia | Seymour | 12/49 | AverageTable 3 footnote d | 3.2 | Metro Vancouver, 2009 |
| Capilano | 24/49 | 6.3 | |||
| Coquitlam | 13/49 | 3.8 | |||
| Seymour | Maximum | 8.0 | |||
| Capilano | 20.0 | ||||
| Coquitlam | 12.0 | ||||
| British Columbia | Salmon River | 38/49 | Median | 32 | Prystajecky et al., 2014 |
| Coghlan Creek | 59/65 | 107 | |||
| Salmon River | Maximum | 730 | |||
| Coghlan Creek | 3,800 | ||||
| Nova Scotia | Collins Park | 1/26 | Maximum | 130 | Nova Scotia Environment, 2013 |
| East Hants | 2/12 | 10 | |||
| Stewiacke | 3/12 | 140 | |||
| Stellarton | 4/12 | 200 | |||
| Tatamagouche | 0/12 | <10 | |||
| Bridgewater | 0/12 | <10 | |||
| Middle Musquodoboit | 4/25 | 1,067 | |||
| Ontario | Grand River | 14/14 | Median | 71 | Van Dyke et al., 2006 |
| Maximum | 486 | ||||
| Ontario | Grand River watershed | 101/104 | Median | 80 | Van Dyke et al., 2012 |
| Maximum | 5,401 | ||||
| Ontario | Ottawa River | N/A | Average | 16.8 | Douglas, 2009 |
| Ontario | Lake Ontario | Maximum | Edge et al., 2013 | ||
| Water Treatment Plant Intakes | |||||
| WTP1 | 17/46 | 70 | |||
| WTP2 | 4/35 | 12 | |||
| WTP3 | 6/43 | 18 | |||
| Humber River | 32/41 | 540 | |||
| Credit River | 19/35 | 90 | |||
| Quebec | ROS Water Treatment Plant, Thousand Islands River, Montreal | 4/4 | Geometric mean | 1,376 | Payment and Franco, 1993 |
| STE Water Treatment Plant, Thousand Islands River, Montreal | 8/8 | 336 | |||
| REP Water Treatment Plant, Assomption River, Montreal | 4/5 | 7.23 | |||
| Quebec | Saint Lawrence River | N/A | Geometric mean | 200 | Payment et al., 2000 |
| Quebec | 15 surface water sites impacted by urban and agricultural runoff | 191/194 | Medians | 22–423 | MDDELCC, 2016 |
| Maximums | 70–2278 |
Table 3 footnotes
- Table 3 footnote a
-
The studies were selected to show range of concentrations, not as a comprehensive list of all studies in Canada. The sampling and analysis methods employed in these studies varied; as a result, it may not be appropriate to compare cyst concentrations. The viability and infectivity of cysts were rarely assessed; little information is therefore available regarding the potential risk to human health associated with the presence of Giardia in these samples.
- Table 3 footnote b
-
Units were standardized to cysts/100 L.
- Table 3 footnote c
-
Associated with heavy spring runoff.
- Table 3 footnote d
-
Average results are from positive filters only.
The typical range for Giardia concentrations in Canadian surface waters is at the lower end of the range described in an international review (Dechesne and Soyeux, 2007). Dechesne and Soyeux (2007) found that Giardia concentrations in surface waters across North America and Europe ranged from 0.02 to 100 cysts/L, with the highest levels reported in the Netherlands. Source water quality monitoring data (surface and GUDI sources) were also gathered for nine European water sources (in France, Germany, the Netherlands, Sweden and the United Kingdom) and for one Australian source. Overall, Giardia was frequently detected at relatively low concentrations, and levels ranged from 0.01 to 40 cysts/L. An earlier survey by Medema et al. (2003) revealed that concentrations of cysts in raw and treated domestic wastewater (i.e., secondary effluent) typically ranged from 5,000 to 50,000 cysts/L and from 50 to 500 cysts/L, respectively.
Groundwater
There is a limited amount of information on groundwater contamination with Giardia in Canada and elsewhere. The available studies discuss various types of sources that emanate from the subsurface. Most of these studies use the term "groundwater", although it is clear from the descriptions provided by the authors that the water sources would be classified as GUDI or surface water (e.g., infiltration wells, springs). However, for this document, the terminology used by the authors has been maintained.
A review and analysis of enteric pathogens in groundwaters in the United States and Canada (1990–2013), conducted by Hynds et al. (2014), identified 102 studies, of which only 10 investigated the presence of Giardia. Giardia was found in 3 of the 10 studies; none of the positive sites were in Canada. Three studies were conducted in Canada (out of the 10 studies identified). Two of the studies were conducted in Prince Edward Island and one was conducted in British Columbia. The PEI studies included a total of 40 well water samples on dairy and beef farms (Budu-Amoako et al., 2012a, 2012b). None of the samples tested positive for Giardia. The study conducted in BC also did not find any Giardia present in well water samples (Isaac-Renton et al., 1999).
Other published studies have reported the presence of cysts in groundwaters (Hancock et al., 1998; Gaut et al., 2008; Khaldi et al., 2011; Gallas-Lindemann et al., 2013; Sinreich, 2014; Pitkänen et al., 2015). As noted above, many of the sources described in these studies would be classified as GUDI or surface water. Hancock et al. (1998) found that 6% (12 /199) of the sites tested were positive for Giardia. Of the positive sites, 83% (10/12) were composed of springs, infiltration galleries and horizontal wells while the remaining positive sites (2/12) were vertical wells. The same study also reported that contamination was detected intermittently; many sites required multiple samples before Giardia was detected. However, sites that were negative for Giardia in the first sample were not always resampled. This may have led to an underestimation of contamination prevalence. Many of the other studies reported in the literature have focused on vulnerable areas, such as karst aquifers (Khaldi et al., 2011; Sinreich, 2014) or areas where human and animal faecal contamination are more likely to impact the groundwater (i.e., shallow groundwaters, or close proximity to surface water sources or agricultural or human sewage sources; Gaut et al., 2008; Pitkänen et. al., 2015). These studies have reported Giardia prevalence rates ranging from none detected in any of the wells (Gaut et al., 2008) to 20% of the wells testing positive for Giardia (Pitkänen et. al., 2015). Khaldi et al., (2011) also found that Giardia positive samples increased from 0%, under non-pumping conditions, to 11% under continuously pumping conditions. Hynds et al. (2014) reported that well design and integrity have a significant impact on the likelihood of detecting enteric protozoa.
The above studies highlight the importance of assessing the vulnerability of subsurface sources to contamination by enteric protozoa to ensure they are properly classified. Subsurface sources that have been assessed as not vulnerable to contamination by enteric protozoa, if properly classified, should not have protozoa present. However, all groundwater sources will have a degree of vulnerability and should be periodically reassessed.
Treated water
Treated water in Canada is rarely tested for the presence of Giardia. When testing has been conducted, cysts are typically not present or are present in very low numbers (Payment and Franco, 1993; Ong et al., 1996; Wallis et al., 1996, 1998; EPCOR, 2005; Douglas, 2009), with some exceptions. In 1997, a heavy spring runoff event in Edmonton, Alberta resulted in the presence of 34 cysts/1,000 L in treated water (Gammie et al., 2000). Cysts have also been detected in treated water derived from unfiltered surface water supplies (Payment and Franco, 1993; Wallis et al., 1996).
5.1.2 Survival
Giardia cysts can survive in the environment from weeks to months (or possibly longer), depending on a number of factors, including the characteristics specific to the strain and of the water, such as temperature. The effect of temperature on survival rates of Giardia has been well studied. In general, as the temperature increases, the survival time decreases. For example, Bingham et al. (1979) observed that Giardia cysts can survive up to 77 days in tap water at 8°C, compared with 4 days at 37°C. DeRegnier et al. (1989) reported a similar effect in river and lake water. This temperature effect is, in part, responsible for peak Giardia cyst prevalence reported in winter months (Isaac-Renton et al., 1996; Ong et al., 1996; Van Dyke et al., 2012). Other factors such as exposure to ultraviolet (UV) light (McGuigan et al., 2006; Heaselgrave and Kilvington, 2011) or predation (Revetta et al., 2005) can also shorten the survival time of Giardia.
The viability of Giardia cysts found in water does not seem to be high. Cysts found in surface waters often have permeable cell walls, as shown by propidium iodide (PI) staining (Wallis et al., 1995), indicating they are likely non-viable. Wallis et al. (1996) found that only approximately 25% of the drinking water samples that were positive for Giardia contained viable cysts using PI staining. Observations by LeChevallier et al. (1991b) also suggest that most of the cysts present in water are non-viable; 40 of 46 cysts isolated from drinking water exhibited "non-viable-type" morphologies (i.e., distorted or shrunken cytoplasm). More recent work in British Columbia also found that the vast majority of cysts detected from routine monitoring of two drinking water reservoirs displayed no internal structures using DAPI staining and differential interference contrast (DIC) microscopy, suggesting they are aged or damaged and, therefore, unlikely to be viable (Metro Vancouver, 2013). Studies have frequently revealed the presence of empty cysts ("ghosts"), particularly in sewage.
5.1.3 Exposure
Person-to-person transmission is by far the most common route of transmission of Giardia (Pond et al., 2004; Thompson, 2004). Persons become infected via the faecal–oral route, either directly (i.e., contact with faeces from a contaminated person, such as children in daycare facilities) or indirectly (i.e., ingestion of contaminated drinking water, recreational water and, to a lesser extent, food). Since the most important source of human infectious Giardia originates from infected people, source waters impacted by human sewage are an important potential route of exposure to Giardia.
Animals may also play an important role in the (zoonotic) transmission of Giardia, although it is not clear to what extent. Cattle have been found to harbour human-infective (assemblage A) Giardia, as have dogs and cats. Assemblage A Giardia genotypes have also been detected in wildlife, including beavers and deer (Plutzer et al., 2010). Although there is some evidence to support the zoonotic transmission of Giardia, most of this evidence is circumstantial or compromised by inadequate controls. Thus, it is not clear how frequently zoonotic transmission occurs or under what circumstances. Overall, these data suggest that, in most cases, animals are not the original source of human-infective Giardia. However, in some circumstances, it is possible that they could amplify zoonotic genotypes present in other sources (e.g., contaminated water). In cattle, for example, the livestock Giardia genotype (assemblage E) predominates (Lalancette et al., 2012); however, cattle are susceptible to infection with human-infective (zoonotic) genotypes of Giardia. Given that livestock, such as calves, infected with Giardia commonly shed between 105 and 106 cysts per gram of faeces, they could play an important role in the transmission of Giardia. Other livestock, such as sheep, are also susceptible to human-infective genotypes. It is possible that livestock could acquire zoonotic genotypes of Giardia from their handlers or from contaminated water sources, although there is also evidence to the contrary. In a study investigating the use of reclaimed wastewater for pasture irrigation, the human infective genotypes present in the wastewater could not be isolated from the faeces of the grazing animals (Di Giovanni et al., 2006).
The role that wildlife plays in the zoonotic transmission of Giardia is also unclear. Although wildlife, including beavers, can become infected with human-source G. lamblia (Davies and Hibler, 1979; Hewlett et al., 1982; Erlandsen and Bemrick, 1988; Erlandsen et al., 1988; Traub et al., 2004, 2005; Eligio-García et al., 2005) and have been associated with waterborne outbreaks of giardiasis (Kirner et al., 1978; Lopez et al., 1980; Lippy, 1981; Isaac Renton et al., 1993), the epidemiological and molecular data do not support zoonotic transmission via wildlife as a significant risk for human infections (Hoque et al., 2003; Stuart et al., 2003; Berrilli et al., 2004; Thompson, 2004; Hunter and Thompson, 2005; Ryan et al., 2005a). The data do, however, suggest that wildlife acquire human-infective genotypes of Giardia from sources contaminated by human sewage. As population pressures increase and as more human-related activity occurs in watersheds, the potential for faecal contamination of source waters becomes greater, and the possibility of contamination with human sewage must always be considered. Erlandsen and Bemrick (1988) concluded that Giardia cysts in water may be derived from multiple sources and that epidemiological studies that focus on beavers may be missing important sources of cyst contamination. Some waterborne outbreaks have been traced back to human sewage contamination (Wallis et al., 1998). Ongerth et al. (1995) showed that there is a statistically significant relationship between increased human use of water for domestic and recreational purposes and the prevalence of Giardia in animals and surface water. It is known that beaver and muskrat can be infected with human-source Giardia (Erlandsen et al., 1988), and these animals are frequently exposed to raw or partially treated sewage in Canada. The application of genotyping procedures has provided further proof of this linkage. Thus, it is likely that wildlife and other animals act as a reservoir of human-infective Giardia from sewage-contaminated water and, in turn, amplify concentrations of Giardia cysts in water. If infected animals live upstream from or in close proximity to drinking water treatment plant intakes, they could play an important role in the waterborne transmission of Giardia. Thus, watershed management to control both human and animal fecal inputs is important for disease prevention.
As is the case for livestock and wildlife animals, it is unclear what role domestic animals play in the zoonotic transmission of Giardia. Although dogs and cats are susceptible to infection with zoonotic genotypes of Giardia, few studies have provided direct evidence of transmission between them and humans (Eligio-García et al., 2005; Shukla et al., 2006; Thompson et al., 2008).
5.2 Cryptosporidium
5.2.1 Sources
Humans and other animals, especially cattle, are important reservoirs for Cryptosporidium. Human cryptosporidiosis has been reported in more than 90 countries over six continents (Fayer et al., 2000; Dillingham et al., 2002). Reported prevalence rates of human cryptosporidiosis range from 1 to 20%, with higher rates reported in developing countries (Caprioli et al., 1989; Zu et al., 1992; Mølbak et al., 1993; Nimri and Batchoun, 1994; Dillingham et al., 2002; Cacciò and Pozio, 2006). Livestock, especially cattle, are a significant source of C. parvum (Pond et al., 2004). In a survey of Canadian farm animals, Cryptosporidium was detected in faecal samples from cattle (20%), sheep (24%), hogs (11%) and horses (17%) (Olson et al., 1997). Overall, prevalence rates in cattle range from 1 to 100% and in pigs from 1 to 10% (Pond et al., 2004). Oocysts were more prevalent in calves than in adult animals; conversely, they were more prevalent in mature pigs and horses than in young animals. Infected calves can excrete up to 107 oocysts per gram of faeces (Smith and Rose, 1990) and represent an important source of Cryptosporidium in surface waters (refer to section 5.2.2). Wild ungulates (hoofed animals) and rodents are not a significant source of human-infectious Cryptosporidium (Roach et al., 1993; Ong et al., 1996).
Oocysts are easily disseminated in the environment and are transmissible via the faecal–oral route. Major pathways of transmission for Cryptosporidium include person-to-person, contaminated drinking water, recreational water, food and contact with animals, especially livestock. A more detailed discussion of zoonotic transmission is provided in section 5.2.3.
Cryptosporidium oocysts are commonly found in sewage and surface waters and occasionally in groundwater sources and treated water.
Surface water
Table 4 highlights a selection of studies that have investigated the occurrence of Cryptosporidium in surface waters in Canada.
| Province | Site/watershed | Frequency of positive samples | Unit of measure | Cryptosporidium concentration (oocysts/100 L)Table 4 footnote b | Reference |
|---|---|---|---|---|---|
| National survey | Various | 55/1,173 | Maximum (for most samples) | 0.5 | Wallis et al., 1996 |
| Alberta | Not available | 1/1 | Single sample | 34 | LeChevallier et al., 1991a |
| Alberta | North Saskatchewan River, Edmonton | N/A | Annual geometric mean | 6–83 | Gammie et al., 2000 |
| Maximum | 10,300Table 4 footnote c | ||||
| Alberta | North Saskatchewan River, Edmonton | N/A | Annual geometric mean | 9 | EPCOR, 2005 |
| Maximum | 69 | ||||
| British Columbia | Black Mountain Irrigation District | 14/27 | Geometric mean | 3.5 | Ong et al., 1996 |
| Vernon Irrigation District | 5/19 | 9.2 | |||
| Black Mountain Irrigation District | 14/27 | Range | 1.7–44.3 | ||
| Vernon Irrigation District | 5/19 | 4.8–51.4 | |||
| British Columbia | Seymour | 0/49 | AverageTable 4 footnote d | 0.0 | Metro Vancouver, 2009 |
| Capilano | 5/49 | 2.4 | |||
| Coquitlam | 1/49 | 2.0 | |||
| Seymour | Maximum | 0.0 | |||
| Capilano | 4.0 | ||||
| Coquitlam | 2.0 | ||||
| British Columbia | Salmon River | 36/49 | Median | 11 | Prystajecky et al., 2014 |
| Coghlan Creek | 36/65 | 333 | |||
| Salmon River | Maximum | 126 | |||
| Coghlan Creek | 20,600 | ||||
| Nova Scotia | Collins Park | 1/26 | Maximum | 130 | Nova Scotia Environment, 2013 |
| East Hants | 0/12 | <10 | |||
| Stewiacke | 0/12 | <10 | |||
| Stellarton | 0/12 | <10 | |||
| Tatamagouche | 0/12 | <10 | |||
| Bridgewater | 0/12 | <10 | |||
| Middle Musquodoboit | 0/25 | <10 | |||
| Ontario | Grand River | N/A | Maximum | 2,075 | Welker et al., 1994 |
| Ontario | Grand River | 33/98 | Average | 6.9 | LeChevallier et al., 2003 |
| Maximum | 100 | ||||
| Ontario | Grand River | 13/14 | Median | 15 | Van Dyke et al., 2006 |
| Maximum | 186 | ||||
| Ontario | Grand River watershed | 92/104 | Median | 12 | Van Dyke et al., 2012 |
| Maximum | 900 | ||||
| Ontario | Ottawa River | N/A /53 | Average | 6.2 | Douglas, 2009 |
| Ontario | Lake Ontario | Maximum | Edge et al., 2013 | ||
| Water Treatment Plant Intakes | |||||
| WTP1 | 5/46 | 40 | |||
| WTP2 | 5/35 | 3 | |||
| WTP3 | 3/43 | 1 | |||
| Humber River | 18/41 | 120 | |||
| Credit River | 21/35 | 56 | |||
| Ontario | South Nation (multiple sites) | 317/674 | Mean | 3.3–170 | Ruecker et al., 2012 |
| Quebec | ROS Water Treatment Plant, Thousand Islands River, Montreal | Geometric mean | 742 | Payment and Franco, 1993 | |
| STE Water Treatment Plant, Thousand Islands River, Montreal | <2 | ||||
| REP Water Treatment Plant, Assomption River, Montreal | <2 | ||||
| Quebec | Saint Lawrence River | Geometric mean | 14 | Payment et al., 2000 | |
| Quebec | 15 surface water sites impacted by urban and agricultural runoff | 99/194 | Medians | 2–31 | MDDELCC, 2016 |
| Maximums | 7–150 |
Table 4 footnotes
- Table 4 footnote a
-
The sampling and analysis methods employed in these studies varied; as a result, it may not be appropriate to compare oocyst concentrations. The viability and infectivity of oocysts were rarely assessed; little information is therefore available regarding the potential risk to human health associated with the presence of Cryptosporidium in these samples.
- Table 4 footnote b
-
Units were standardized to oocysts/100 L. However, the text cites concentrations/units as they were reported in the literature.
- Table 4 footnote c
-
Associated with heavy spring runoff.
- Table 4 footnote d
-
Average results are from positive filters only.
Typically, Cryptosporidium concentrations in Canadian surface waters range from 1 to 100 oocysts/100 L (0.001 to 1 oocyst/L), although high concentrations have been reported. Concentrations as high as 10,300 oocysts/100 L (103 oocysts/L) were associated with a record spring runoff (Gammie et al., 2000), and as high as 20,600 oocysts/100 L (206 oocysts/L) during a two-year bi weekly monitoring program (Prystajecky et al., 2014). These results highlight the importance of both event-based sampling and routine monitoring to characterize a source water. Analysis of data collected in the United States showed that median oocyst densities ranged from 0.005/L to 0.5/L (Ongerth, 2013a).
Recent studies have also investigated the species of Cryptosporidium present in source waters. Two studies in Ontario watersheds reported the frequency of detection of C. parvum and C. hominis, the species most commonly associated with human impacts, at less than 2% of positive samples (Ruecker et al., 2012; Edge et al., 2013). In contrast, a study in British Columbia in a mixed urban-rural watershed reported that around 30% of the species detected were potentially human infective types (Prystajecky et al., 2014). Other studies in Canada report human infective genotypes somewhere between these two levels (Pintar et al., 2012; Van Dyke et al., 2012). These findings are not unique. In a recent research project that genotyped 220 slides previously confirmed to be positive by the immunofluorescence assay (IFA), 10% of the slides contained human genotypes (Di Giovanni et al., 2014).
An international review of source water quality data (surface and GUDI sources) demonstrated that concentrations of Cryptosporidium in source waters across North America and Europe ranged from 0.006 to 250 oocysts/L (Dechesne and Soyeux, 2007). Although this range is large, a closer look at nine European sites and one Australian site showed that, overall, Cryptosporidium was frequently detected at relatively low concentrations, and levels ranged from 0.05 to 4.6 oocysts/L. In an earlier survey of wastewater effluent, Medema et al. (2003) reported concentrations of oocysts in raw and treated domestic wastewater (i.e., secondary effluent) ranging from 1,000 to 10,000 oocysts/L and from 10 to 1,000 oocysts/L, respectively.
Groundwater
There is a limited amount of information on groundwater contamination with Cryptosporidium in Canada and elsewhere. The available studies discuss various types of sources that emanate from the subsurface. Most of these studies use the term "groundwater", although it is clear from the descriptions provided by the authors that the water sources would be classified as GUDI or surface water (e.g., infiltration wells, springs). However, for this document, the terminology used by the authors has been maintained.
Hynds et al. (2014) reviewed groundwater studies in Canada and the United States between 1990 and 2013. Nine studies looked for Cryptosporidium; of these nine studies, only three occurred in Canada. Two of the studies were conducted in Prince Edward Island (Budu-Amoako et al., 2012a, 2012b) and one study was conducted in BC (Isaac-Renton et al., 1999). The study in BC did not find any Cryptosporidium in the community well during the study period. The PEI studies tested 40 well water samples on beef and dairy farms, and they found that 4 of 40 samples tested positive for Cryptosporidium with a concentration density range of 0.1 to 7.2/L in 100 L samples. To confirm their findings, the positive wells were retested and both Cryptosporidium and bacterial indicators were found.
Other published studies have reported the presence of oocysts in groundwaters (Welker et al., 1994; Hancock et al., 1998; Gaut et al., 2008; Khaldi et al., 2011; Füchslin et al., 2012; Gallas-Lindemann et al., 2013; Sinreich, 2014). As noted above, many of the sources described in these studies would be classified as GUDI or surface water. Welker et al. (1994) reported the presence of Cryptosporidium in low concentrations in induced infiltration wells located adjacent to the Grand River. Hancock et al. (1998) found that 11% (21 /199) of the sites tested were positive for Cryptosporidium. Of the positive sites, 67% (14 /21) were composed of springs, infiltration galleries and horizontal wells, and 33% (7 /21) were from vertical wells. The same study also reported that contamination was detected intermittently; many sites required multiple samples before Cryptosporidium was detected. However, sites that were negative for Cryptosporidium in the first sample were not always resampled. This may have led to an underestimation of contamination prevalence. Many of the other studies reported in the literature have focused on vulnerable areas, such as karst aquifers (Khaldi et al., 2011; Sinreich, 2014) or areas where human and animal faecal contamination are more likely to impact the groundwater (i.e., shallow groundwaters, or close proximity to surface water sources or agricultural or human sewage sources; Gaut et al., 2008; Füchslin et al., 2012; Gallas-Lindemann et al., 2013). These studies have reported Cryptosporidium prevalence rates ranging from 8 to 15 % of tested samples (Gaut et al., 2008; Gallas-Lindemann et al., 2013; Sinreich, 2014) to 100% of samples (from 3 wells) testing positive for Cryptosporidium in a small study in Switzerland (Füchslin et al., 2012). Khaldi et al. (2011) also found that Cryptosporidium positive samples increased from 44% under non-pumping conditions to 100% under pumping conditions. Hynds et al. (2014) reported that well design and integrity have been shown to have a significant impact on the likelihood of detecting enteric protozoa.
The above studies highlight the importance of assessing the vulnerability of subsurface sources to contamination by enteric protozoa to ensure they are properly classified. Subsurface sources that have been assessed as not vulnerable to contamination by enteric protozoa, if properly classified, should not have protozoa present. However, all groundwater sources will have a degree of vulnerability and should be periodically reassessed.
Treated water
The presence of Cryptosporidium in treated water in Canada is rarely assessed. When testing has been conducted, oocysts are typically not present or are present in very low numbers (Payment and Franco, 1993; Welker et al., 1994; Ong et al., 1996; Wallis et al., 1996; EPCOR, 2005; Douglas, 2009), with some exceptions (Gammie et al., 2000). Oocysts have been detected in treated water derived from unfiltered surface water supplies (Wallis et al., 1996) and after extreme contamination events. For example, in 1997, a heavy spring runoff event in Edmonton, Alberta resulted in the presence of 80 oocysts/1,000 L in treated water (Gammie et al., 2000). During the cryptosporidiosis outbreak in Kitchener-Waterloo, Welker et al. (1994) reported that two of 17 filtered water samples contained 0.16 and 0.43 oocysts/1000 L.
Treated waters have been extensively monitored in other countries. Daily monitoring of finished water in the United Kingdom (between 1999 and 2008) showed that the prevalence of positive samples was as high as 8% but, through improvements to the drinking water systems, this dropped to approximately 1% (Rochelle et al., 2012). The method used for daily monitoring did not provide information on the viability or infectivity of the oocysts. However, genotyping was conducted on a subset of positive samples and it was found that the species of Cryptosporidium most often detected were C. ubiquitum (12.5%), C. parvum (4.2%) and C. andersonni (4.0%) (Nichols et al., 2010).
5.2.2 Survival
Cryptosporidium oocysts have been shown to survive in cold waters (4°C) in the laboratory for up to 18 months (AWWA, 1988). In warmer waters (15°C), Cryptosporidium parvum has been shown to remain viable and infectious for up to seven months (Jenkins et al., 2003). In general, oocyst survival time decreases as temperature increases (Pokorny et al., 2002; King et al., 2005; Li et al., 2010). Robertson et al. (1992) reported that C. parvum oocysts could withstand a variety of environmental stresses, including freezing (viability greatly reduced) and exposure to seawater; however, Cryptosporidium oocysts are susceptible to desiccation. In a laboratory study of dessication, it was shown that within two hours, only 3% of oocysts were still viable, and by six hours, all oocysts were dead (Robertson et al., 1992).
Despite the common assumption that the majority of oocysts in water are viable, Smith et al. (1993) found that oocyst viability in surface waters is often very low. A study by LeChevallier et al. (2003) reported that 37% of oocysts detected in natural waters were infectious. Additionally, a study by Swaffer et al. (2014) reported that only 3% of the Cryptosporidium detected was infectious. In fact, research has shown that even in freshly shed oocysts, only 5–22% of the oocysts were infectious (Rochelle et al., 2001, 2012; Sifuentes and Di Giovanni, 2007). Although the level of infectivity reported to date is low and is dependent on the infectivity method employed, recent advancements in the cell-culture methodology used for determining Cryptosporidium infectivity have shown significant increases in the level of infectious oocysts (43–74% infectious) (King et al., 2011; Rochelle et al., 2015).
Low oocyst viability has also been reported in filtered water. A survey by LeChevallier et al. (1991b) found that, in filtered waters, 21 of 23 oocysts had "non-viable-type" morphology (i.e., absence of sporozoites and distorted or shrunken cytoplasm). In a more recent study of 14 drinking water treatment plants, no infectious oocysts were recovered in the approximately 350,000 L of treated drinking water that was filtered (Rochelle et al., 2012).
5.2.3 Exposure
Direct contact with livestock and indirect contact through faecally contaminated waters are major pathways for transmission of Cryptosporidium (Fayer et al., 2000; Robertson et al., 2002; Stantic-Pavlinic et al., 2003; Roy et al., 2004; Hunter and Thompson, 2005). Cattle are a significant source of C. parvum in surface waters. For example, a weekly examination of creek samples upstream and downstream of a cattle ranch in the BC interior during a 10-month period revealed that the downstream location had significantly higher levels of Cryptosporidium oocysts (geometric mean 13.3 oocysts/100 L, range 1.4–300 oocysts/100 L) compared with the upstream location (geometric mean 5.6/100 L, range 0.5–34.4 oocysts/100 L) (Ong et al., 1996). A pronounced spike was observed in downstream samples following calving in late February. During a confirmed waterborne outbreak of cryptosporidiosis in British Columbia, oocysts were detected in 70% of the cattle faecal specimens collected in the watershed close to the reservoir intake (Ong et al., 1997). Humans can also be a significant source of Cryptosporidium in surface waters. A study in Australia showed that surface waters that allowed recreational activities had significantly more Cryptosporidium than those with no recreational activities (Loganthan et al., 2012).
Waterfowl can also act as a source of Cryptosporidium. Graczyk et al. (1998) demonstrated that Cryptosporidium oocysts retain infectivity in mice following passage through ducks. However, histological examination of the avian respiratory and digestive systems at seven days post-inoculation revealed that the protozoa were unable to infect birds. In an earlier study (Graczyk et al., 1996), the authors found that faeces from migratory Canada geese collected from seven of nine sites on Chesapeake Bay contained Cryptosporidium oocysts. Oocysts from three of the sites were infectious to mice. Based on these and other studies (Graczyk et al., 2008; Quah et al., 2011), it appears that waterfowl carry infectious Cryptosporidium oocysts from their habitat to other locations, including drinking water supplies.
5.3 Waterborne illness
Giardia and Cryptosporidium are the most commonly reported intestinal protozoa in North America and the world (Farthing, 1989; Adam, 1991). Exposure to enteric protozoa through water can result in both an endemic rate of illness in the population and waterborne disease outbreaks. As noted in section 4.0, certain species and genotypes of Giardia and Cryptosporidium, respectively, are more commonly associated with human illness. Giardia lamblia assemblages A and B are responsible for all cases of human giardiasis. For cryptosporidiosis, Cryptosporidium parvum and C. hominis are the major species associated with illness, although C. hominis appears to be more prevalent in North and South America, Australia and Africa, whereas C. parvum is responsible for more infections in Europe (McLauchlin et al., 2000; Guyot et al., 2001; Lowery et al., 2001b; Yagita et al., 2001; Ryan et al., 2003; Learmonth et al., 2004).
5.3.1 Endemic illness
The estimated burden of endemic acute gastrointestinal illness (AGI) annually in Canada, from all sources (i.e., food, water, animals, person-to-person), is 20.5 million cases (0.63 cases/person-year; Thomas et al., 2013). Approximately 1.7% (334,966) of these cases, or 0.015 cases/person-year, are estimated to be associated with the consumption of tap water from municipal systems that serve >1000 people in Canada (Murphy et al., 2016a). Over 84% of the total Canadian population (approximately 29 million) rely on these systems; with 73% of the population (approximately 25 million) supplied by a surface water source; 1% (0.4 million) supplied by a groundwater source under the direct influence of surface water (GUDI); and the remaining 10% (3.3 million) supplied by a groundwater source (Statistics Canada, 2013a, 2013b). Murphy et al. (2016a) estimated that systems relying on surface water sources treated only with chlorine or chlorine dioxide, GUDI sources with no or minimal treatment, or groundwater sources with no treatment, accounted for the majority of the burden of AGI (0.047 cases/person-year). In contrast, an estimated 0.007 cases/person-year were associated with systems relying on lightly impacted source waters with multiple treatment barriers in place. The authors also estimated that over 35% of the 334,966 AGI cases were attributable to the distribution system.
In Canada, just over 3,800 confirmed cases of giardiasis were reported in 2012, which is a significant decline from the 9,543 cases that were reported in 1989. In fact, the total reported cases have decreased steadily since the early 1990s. The incidence rates have similarly declined over this period (from 34.98 to 11.12 cases per 100,000 persons; PHAC, 2015). On the other hand, since cryptosporidiosis became a reportable disease in 2000, the number of reported cases in Canada has been relatively constant, ranging from a low of 588 cases (in 2002) to a high of 875 cases (in 2007) (PHAC, 2015). The exception was in 2001, where the number of cases reported was more than double (1,763 cases) due to a waterborne outbreak in North Battleford, Saskatchewan. For the Canadian population, this corresponds to an incidence rate between 1.82 and 2.69 cases per 100,000 persons per year, with the exception of 2001, where the incidence rate was 7.46 cases per 100,000 persons (PHAC, 2015). The reported incidence rates are considered to be only a fraction of the illnesses that are occurring in the population due to under-reporting and under-diagnosis, especially with respect to mild illnesses such as gastrointestinal upset. It is estimated that the number of illnesses acquired domestically from Giardia and Cryptosporidium are approximately 40 and 48 times greater, respectively, than the values reported nationally (Thomas et al., 2013). However, even though Giardia and Cryptosporidium are commonly reported intestinal protozoa, they still only accounted for approximately 16% and 4%, respectively, of all foodborne and waterborne related illnesses in 2013 (PHAC, 2015).
Similar to illness rates in Canada, giardiasis rates in the United States have been declining, and in 2012, the average rate of giardiasis was 5.8 cases per 100,000 people (Painter et al., 2015a). Although the rate of giardiasis reported in the United States is lower than in Canada, this difference can at least partially be explained by differences in disease surveillance. In the United States, giardiasis is not a reportable illness in all states, whereas it is a nationally notifiable disease in Canada. The incidence rate of cryptosporidiosis in the United States in 2012-2013 was 2.6 to 3 cases per 100,000 people (from all sources, including drinking water) (Painter et al., 2015b). This is similar to the incidence rate in Canada.
5.3.2 Outbreaks
Giardia and Cryptosporidium are common causes of waterborne infectious disease outbreaks in Canada and elsewhere (Fayer, 2004; Hrudey and Hrudey, 2004; Joachim, 2004; Smith et al., 2006). Between 1974 and 2001, Giardia and Cryptosporidium were the most and the third most commonly reported causative agents, respectively, associated with infectious disease outbreaks related to drinking water in Canada (Schuster et al., 2005). Giardia was linked to 51 of the 138 outbreaks for which causative agents were identified and Cryptosporidium was linked to 12 of the 138 outbreaks. The majority of Giardia (38/51; 75%) and Cryptosporidium (11/12; 92%) outbreaks were associated with public drinking water systems; a selection of these outbreaks can be found in Appendix B. From 2002 to 2016, only one outbreak of giardiasis has been reported in Canada with an association to a drinking water source (PHAC, 2009; Efstratiou et al., 2017; Moreira and Bondelind, 2017). No outbreaks of cryptosporidiosis related to drinking water have been reported in the same time period.
In the United States, drinking water related outbreaks have been reported for both Giardia and Cryptosporidium (Craun, 1979; Lin, 1985; Moore et al., 1993; Jakubowski, 1994; CDC, 2004; U.S. EPA, 2006a; Craun et al., 2010). Giardia was the most frequently identified etiological agent associated with waterborne outbreaks in the United States between 1971 and 2006, accounting for 16% of outbreaks (126/780); Cryptosporidium accounted for 2% (15/780). These outbreaks were associated with 28,127 cases of giardiasis and 421,301 cases of cryptosporidiosis (Craun et al., 2010). Most of the cryptosporidiosis cases (403,000) were associated with the Milwaukee outbreak in 1993 (U.S. EPA, 2006a).
In a worldwide review of waterborne protozoan outbreaks, G. lamblia and Cryptosporidium accounted for 40.6% and 50.6%, respectively, of the 325 outbreaks reported between 1954 and 2003 from all water sources, including recreational water (Karanis et al., 2007). The largest reported Giardia drinking water related outbreak occurred in 2004, in Norway, with an estimated 2500 cases (Robertson et al., 2006; Baldursson and Karanis, 2011). Updates to this review were published in 2011 and 2017, capturing 199 protozoan outbreaks between 2004 and 2010 (Baldursson and Karanis, 2011) and a further 381 protozoan outbreaks between 2011 and 2016 (Efstratiou et al., 2017). Giardia still accounted for 35.2% and 37%, and Cryptosporidium still accounted for 60.3% and 63%, respectively, of the outbreaks from all water sources, including recreational water.
Several authors have investigated whether there are commonalities in the causes of the drinking water outbreaks related to enteric protozoa. For the outbreaks identified in Canada, contamination of source waters from human sewage and inadequate treatment (e.g., poor or no filtration, relying solely on chlorination) appear to have been major contributing factors (Schuster et al., 2005). An analysis by Risebro et al. (2007) of outbreaks occurring in the European Union (1990–2005) found that most outbreaks have more than one contributing factor. Similar to the findings of Schuster et al. (2005), contamination of the source waters with sewage or livestock faecal waste (usually following rainfall events) and treatment failures (related to problems with filtration) frequently occurred in enteric protozoa outbreaks. Risebro et al. (2007) also noted that long-term treatment deficiencies, resulting from a poor understanding of, or lack of action upon, previous test results resulted in drinking water outbreaks. Although less common, distribution system issues were also reported to have been responsible for outbreaks, mainly related to cross-connection control problems (Risebro et al., 2007; Moreira and Bondelind, 2017).
A recent review, focusing on outbreaks occurring between 2000 and 2014 in North America and Europe, reported very similar problems still occurring (Moreira and Bondelind, 2017). The outbreaks caused by enteric protozoa were the result of source water contamination by sewage and animal faeces, usually following heavy rains, and by ineffective treatment barriers for the source water quality. Some of the source waters were described as untreated groundwater supplies, however, it is unknown if some would be classified as GUDI. Wallender et al. (2014) reported that of 248 outbreaks in the United States between 1971 and 2008 involving untreated groundwater, 14 (5.6%) were due to G. intestinalis, two (0.8%) due to C. parvum and G. intestinalis and five (2.0%) due to multiple etiologies some of which involved G. intestinalis. The same study also noted that 70% of these 248 outbreaks were related to semi-public and private drinking water supplies using untreated well water. Further information on outbreaks of enteric protozoa from both Canada and worldwide can be found in Appendix B.
5.4 Impact of environmental conditions
The concentrations of Giardia and Cryptosporidium in a watershed are influenced by numerous environmental conditions and processes, many of which are not well characterized and vary between watersheds. However, there are some consistent findings that seem to be applicable to a variety of source waters. Lal et al. (2013) provides a good review of global environmental changes—including land-use patterns, climate, and social and demographic determinants—that may impact giardiasis and cryptosporidiosis transmission.
Numerous studies have found rainfall to have a large impact on the microbiological quality of water sources, although the precise rainfall conditions that lead to increased pathogen loads vary. Outbreaks tend to be classified as either occurring in a surface water or groundwater supply, however, it is unknown if the groundwater category includes all subsurface supplies or only properly classified groundwater systems. Curriero et al. (2001) evaluated the relationship between rainfall and waterborne disease in the U.S. and found that outbreaks were preceded by rainfall events above the 90th percentile of the monthly accumulated rainfall. Outbreaks due to surface water contamination were most significant for extreme precipitation during the month of the outbreak, whereas groundwater outbreaks showed the highest significance for extreme precipitation two months prior to the outbreak. In Canada, Thomas et al. (2006) reported that rainfall events above the 93rd percentile of the rolling 5 day average accumulated rainfall increased the risk of an outbreak by a factor of 2.3. A study in England of drinking water related outbreaks used historical information on outbreaks (bacterial, viral and protozoan pathogens) and rainfall patterns. They determined that the risk of an outbreak was associated with two situations: low rainfall levels over the preceding three weeks and excessive rainfall in the week prior to the outbreak (Nichols et al., 2009). Drayna et al. (2010) reported a significant association between rainfall and pediatric emergency department visits for gastrointestinal related illnesses for a community served by treated surface water; visits increased by 11% four days after rainfall. Uejio et al. (2014) found that extreme precipitation was associated with an increase in childhood AGI for untreated municipal groundwater. Wallender et al. (2014) reported that heavy rainfall or flooding was a contributing factor in 36 of 248 outbreaks involving untreated groundwater supplies.
In Belgium, a study showed that Giardia concentration peaks coincided with both rainfall and snow melt events (Burnet et al., 2014). The same study also noted that the concentration of cysts could fluctuate from below detection limit to peak concentrations within three days, making it important to understand site-specific triggers for increases in surface water concentrations. In the study by Burnet et al. (2014), successive rainfall events occurred in the three days between sample collections, increasing river flows and carrying contaminated run-off from upstream locations. Recently, a meta-analysis was published that investigated the effects of weather events on Giardia and Cryptosporidium in fresh surface waters globally. The researchers found an association between extreme weather events and the odds of detecting these organisms (Young et al., 2015). The same analysis attempted to find a suitable, easy-to-monitor surrogate that could be used for Giardia and Cryptosporidium, but was unable to find a correlation between other weather variables such as water temperature, turbidity or flow rates.
Changes in the Canadian climate may also play a role in Giardia and Cryptosporidium concentration variability. In addition to potentially impacting rainfall and flooding, both of which have been shown to impact Giardia and Cryptosporidium occurrence, researchers studying Lake Ontario have suggested that climate changes could impact the summer thermoclines in the lake. As a result, it is hypothesized that the river water discharges feeding the lake could be pushed deeper into the lake, closer to the drinking water treatment plant intakes (Edge et al., 2013). During the study, it was the river water discharges that contained the highest number of faecal pathogens and that, therefore, could result in a greater pathogen load at the drinking water treatment plant intakes.
Reckhow et al. (2007) surveyed 249 surface water utilities serving a population of 50,000 or more to determine if storm events were monitored for water quality, flow or system response. A "no" response was provided by 60.6%, 66.2% and 82.4% of the water utilities, respectively, for these criteria.
5.5 Relationship to indicator organisms
For the purposes of this document, the term indicator refers to a microorganism whose presence in water indicates the presence of contamination. A surrogate refers to an organism, particle or substance that is used to assess the fate of a pathogen in a natural environment (e.g., pathogen transport) or through treatment (e.g., drinking water disinfection).
The indicator organisms routinely monitored in Canada as part of a source-to-tap or water safety plan approach for verifying water quality are E. coli and total coliforms. The presence of E. coli in water indicates recent faecal contamination and, thus, the strong potential for a health risk, regardless of whether specific pathogens such as enteric protozoa are observed. However, its absence does not necessarily indicate that enteric protozoa are also absent. Total coliforms are not faecal specific and, therefore, cannot be used to indicate faecal contamination (or the potential presence of enteric pathogens). Instead, total coliforms are used to indicate general water quality issues. Further information on the role of E. coli and total coliforms in water quality management can be found in the guideline technical documents on E. coli and total coliforms (Health Canada, 2012b, 2012c).
5.5.1 Surface water sources
Several studies have investigated the relationship between indicator organisms and the presence or absence of enteric protozoa in surface water sources. In general, studies have reported little (Medema et al., 1997; Atherholt et al., 1998; Payment et al., 2000; Van Dyke et al., 2012) or no (Rose et al., 1988, 1991; Chauret et al., 1995; Stevens et al., 2001; Hörman et al., 2004; Dorner et al., 2007; Sunderland et al., 2007; Edge et al., 2013; NSE, 2013; Prystajecky et al., 2014) correlation between protozoa and faecal indicators, including E. coli. In the cases where a correlation has been reported, it is with Giardia and at very high indicator levels. Payment et al. (2000) also published data for the St. Lawrence River indicating that for this watershed, at higher levels of indicators, the probability of finding Giardia, Cryptosporidium or enteric viruses was very high. A review of 40 years of published data on indicator–pathogen correlations found that neither Cryptosporidium (odds ratio 0.41, 95% confidence interval 0.25–0.69) nor Giardia (odds ratio 0.65, 95% confidence interval 0.36–1.15) is likely to be correlated with faecal indicator organisms (Wu et al., 2011). This overall lack of correlation is likely due to a variety of factors, including differential survival rates in the environment, sampling location and methodological differences related to the analysis of water (Payment and Pintar, 2006). Watershed characteristics, including sources and levels of faecal contamination, and geochemical factors, may also influence the correlation between faecal indicators and protozoa, leading to site-specific differences (Chauret et al., 1995). Lalancette et al. (2014) examined E. coli and Cryptosporidium data from several studies to determine whether these water systems would be classified as needing additional treatment for Cryptosporidium, using the United States Environmental Protection Agency Long-Term 2 Enhanced Surface Water Treatment Rule (EPA LT 2) regulation for small systems (U.S. EPA, 2006a), which is based on E. coli concentrations. The authors found that E. coli was useful for predicting Cryptosporidium risk when the watershed was impacted by sewage outfalls in close proximity. However, if the sewage outfalls were farther away, or if the main source of faecal material in the waters was from agricultural or forested areas, the E. coli concentrations would underestimate the risk from Cryptosporidium (Lalancette et al., 2014). This work assumes that all Cryptosporidium detected have the potential to cause adverse human health effects. Although this may not be the case, this assumption is currently applied in most assessments of Cryptosporidium risks.
These observations have raised significant questions regarding the appropriateness of using E. coli as an indicator of protozoan contamination in surface waters, and have highlighted the need for protozoa monitoring of surface waters to gain a better understanding of public health risk. Indicator organism monitoring, such as monitoring for E. coli, can be included as part of a risk management approach, especially for systems where protozoa monitoring is not feasible.
5.5.2 Groundwater sources
A few studies have reported the presence of enteric protozoa in groundwater sources (see sections 5.1.1 and 5.2.1). In conjunction with protozoa monitoring, some studies also investigated the presence of various faecal indicator organisms. Based on the analysis of Hynds et al. (2014), the only faecal indicator that showed a positive correlation with the presence of enteric protozoa was intestinal enterococci. However, the authors still concluded that faecal indicator organisms were of limited efficacy for determining protozoa presence. As an alternative approach to monitoring directly for protozoa, a recent study in New Mexico investigated the link between the presence of bacterial indicators in individual homeowners' wells and the homeowner's immunoglobulin G (IgG) response for Cryptosporidium (Tollestrup et al., 2014). Similar to the studies analysed by Hynds et al. (2014), no link was found with the presence of indicators in the wells, although the study did link the IgG response to the presence of an on-site septic system. The study was limited in that the wells were only tested once, so it is possible that contamination was missed (Tollestrup et al., 2014).
Overall, based on the studies that have been conducted, the presence or absence of faecal indicator organisms in a groundwater source are not a good predictor of contamination with enteric protozoa. However, testing for indicator bacteria is useful in assessing the potential for faecal contamination, which may include enteric protozoa or other enteric pathogens of concern.
5.5.3 Treated drinking water
In general, monitoring for indicator organisms in treated drinking water is intended as a verification of treatment efficacy. The commonly used faecal indicator organisms (e.g., E.coli, total coliforms, enterococci) are not correlated with the presence of Giardia or Cryptosporidium in source waters and, therefore, cannot be used to indicate their presence in treated drinking waters. Nor can faecal indicator organisms be used to determine treatment efficacy with respect to enteric protozoa. Enteric protozoa have dissimilar removals rates through physical processes and are more resistant to many of the disinfectants commonly used in the drinking water industry. As evidence of this, Giardia and Cryptosporidium (oo)cysts have been detected in filtered, treated drinking water meeting existing regulatory standards and have been linked to waterborne disease outbreaks (LeChevallier et al., 1991b; Welker et al., 1994; Craun et al., 1997; Marshall et al., 1997; Rose et al., 1997; Nwachuku et al., 2002; Aboytes et al., 2004).
Despite these limitations, bacterial indicators can be used in conjunction with treatment performance (surrogate) data (see section 7.0) to provide information on the adequacy of drinking water treatment. In particular, the presence of E. coli in water leaving a treatment plant signifies that treatment has been inadequate, and there is an increased risk that pathogens, including enteric protozoa, may be present in treated drinking water.
6.0 Analytical methods
The most widely recognized and used method for the detection of Giardia and Cryptosporidium in water is the U.S. Environmental Protection Agency's (EPA) Method 1623/1623.1, as this method allows for the simultaneous detection of these protozoa and has been validated for use in water (U.S. EPA, 2005a, 2006a, 2012). Other standard methods have also been published (ISO, 2006; APHA et al., 2012). It is important to note that Method 1623/1623.1 does not provide information on the viability or infectivity of the organisms. Other methods for the detection of Giardia and Cryptosporidium in water exist. However, most have demonstrated lower recoveries and increased variance compared with EPA Method 1623 (Quintero-Betancourt et al., 2002). Most methods used for the detection of Giardia and Cryptosporidium in water, including EPA Method 1623/1623.1, consist of four steps: 1) sample collection, 2) sample filtration and elution, 3) sample concentration and separation (purification) and 4) (oo)cyst identification. These steps are described in the following sections. Some emerging detection methods are also discussed, as are methods for assessing (oo)cyst viability and infectivity and for determining if (oo)cysts are human-infectious species.
6.1 Sample collection
Proper sample collection is important for obtaining accurate estimates for enteric protozoa. Therefore, this step should involve clear communication with the laboratory conducting the analysis to ensure the proper sampling procedure is followed. Water samples can be collected as bulk samples or filtered in the field and then shipped on ice to a laboratory for processing within the timeframe prescribed by the analytical method. The volume of water collected depends on the expected level of (oo)cysts in the water (i.e., site specific); the lower the expected density of (oo)cysts, the greater the sample volume needed. In most cases, between 10 and 1,000 L of water are collected. In the case of raw water, samples are typically collected near and at the depth of the drinking water intake point, or from a raw water tap in the treatment plant, in an effort to obtain a representative sample of the source water.
6.2 Sample filtration and elution
In Canada, (oo)cysts are generally present in small numbers even in faecally contaminated water; therefore, bulk water samples must be filtered to concentrate the pathogens to a detectable level. Typically, water is pumped through a filter, and (oo)cysts, along with extraneous particulate materials, are retained on the filter. This can be achieved using a variety of filter types, including wound filters, membrane filters, hollow fibre filters and compressed foam filters. These filters vary in terms of the volume of water that they can process, their filtration rates, their practicality, their compatibility with subsequent processing steps, their cost and their retention ability. These differences account for the wide range of recovery efficiencies reported in the literature (Sartory et al., 1998; DiGiorgio et al., 2002; Quintero-Betancourt et al., 2003; Ferguson et al., 2004). A number of filters have been validated by EPA Method 1623/1623.1 (U.S. EPA, 2005a, 2012). Once filtration is complete, entrapped (oo)cysts on the filter are released through the addition of eluting solutions, producing a filter eluate.
6.3 Sample concentration and separation
The most common approach for sample concentration and separation is through centrifugation and immunomagnetic separation (IMS). First, to concentrate the sample, the filter eluate is centrifuged, resulting in the formation of a pellet. This pellet is resuspended in a small volume of buffer to produce a concentrate. To separate the (oo)cysts from the other contaminants in the sample, IMS is used. The concentrate is mixed with (oo)cyst-specific monoclonal antibodies attached to magnetized beads, also referred to as immunomagnetic beads. These beads will selectively bind to (oo)cysts. A magnetic field is then applied, which separates the (oo)cyst–bead complexes from extraneous materials. These materials are removed, the (oo)cyst–bead complex is dissociated and the beads are extracted, resulting in a concentrated suspension of (oo)cysts. Several studies have assessed the recovery potential of the IMS step alone. Fricker and Clancy (1998) reported that (oo)cysts added to low-turbidity waters can be recovered with efficiencies above 90%. In comparison, mean oocyst and cyst recoveries for turbid waters ranged from 55.9% to 83.1% and from 61.1% to 89.6%, respectively (McCuin et al., 2001). Others have reported similar recoveries (Moss and Arrowood, 2001; Rimhanen-Finne et al., 2001, 2002; Sturbaum et al., 2002; Ward et al., 2002; Chesnot and Schwartzbrod, 2004; Greinert et al., 2004; Hu et al., 2004; Ochiai et al., 2005; Ryan et al., 2005b). Changes in pH (from the optimum of 7) may inhibit IMS (Kuhn et al., 2002). Although IMS aids in reducing false positives by reducing the level of debris on slide preparations for microscopic analysis, it is a relatively expensive procedure. However, it is the only sample separation method included as part of EPA Method 1623/1623.1.
6.4 (Oo)cyst identification
Once samples have been concentrated and (oo)cysts have been separated from extraneous materials, a number of detection techniques can be applied. The most commonly used detection approach is the immunofluorescence assay (IFA). Alternative detection methods, such as flow cytometry and various molecular approaches, are increasingly being used within the research community; however, they have not been included as part of standard methods to date.
6.4.1 Immunofluorescence assay
Following sample concentration and separation, the (oo)cyst suspension is transferred to a well slide for staining and visualization. To stain the samples, fluorescently labelled antibodies directed at specific antigens on the (oo)cyst surface are applied to the slide and allowed to incubate. Direct immunofluorescence microscopy is then used to locate fluorescing bodies, which are potential (oo)cysts. This process, referred to as an IFA, requires specialized equipment and a high level of technical skill. It can be highly sensitive. However, because some autofluorescent algae are very close in size and staining characteristics to (oo)cysts, and the fluorescently labelled antibodies may cross-react with other organisms of similar shape and size, final identification of (oo)cysts requires additional staining and microscopy using a DAPI stain. Because DAPI binds to deoxyribonucleic acid (DNA), it will highlight (oo)cyst nuclei and facilitate their identification. DIC microscopy is also used to examine the internal and external morphological characteristics of the presumptive (oo)cysts for atypical structures. Both DAPI and DIC are included as part of standard methods for (oo)cyst identification (ISO, 2006; APHA et al., 2012; US EPA, 2012).
6.4.2 Flow cytometry
Flow cytometry can be used as an alternative technique for detecting (oo)cysts following concentration. Flow cytometry allows the sorting, enumeration and examination of microscopic particles suspended in fluid, based on light scattering. Fluorescently activated cell sorting (FACS) is the flow cytometric technique that is used to enumerate and separate Giardia and Cryptosporidium from background particles. Typically, immunofluorescent antibodies are introduced into the (oo)cyst suspension, and the suspension is passed through a beam of light (within the flow cytometer). As particles pass through the stream of light, their fluorescence is measured, and they are then sorted into two or more vials.
FACS has proven to be highly sensitive and specific (Vesey et al., 1997; Bennett et al., 1999; Reynolds et al., 1999; Delaunay et al., 2000; Lindquist et al., 2001; Kato and Bowman, 2002; Lepesteur et al., 2003; Hsu et al., 2005; Keserue et al., 2011). This approach has the advantage of being rapid, allowing for high throughput. However, flow cytometers are expensive, and their operation requires significant user training. In addition, like IFA, this procedure can be adversely influenced by the presence of autofluorescent algae and antibody cross-reactivity with other organisms and particles. Many FACS methods also require confirmation of (oo)cysts by microscopy; however, methods are being developed that may not require a confirmation step (Ferrari and Veal, 2003; Keserue et al., 2011).
6.4.3 Molecular methods
A number of molecular approaches have also been used in the detection of Giardia and Cryptosporidium (oo)cysts. A brief description of some of these methods is provided below. It is important to note that molecular methods have not yet been included in standard methods for the detection of Giardia and Cryptosporidium in water.
6.4.3.1 Polymerase chain reaction
Polymerase chain reaction (PCR) is the most commonly used molecular method for detection of (oo)cysts. This method involves lysing (oo)cysts to release DNA and then introducing primers that are targeted at specific Giardia or Cryptosporidium coding regions and amplification of these regions. The coding region targets can be genus specific (e.g., 18S ribosomal ribonucleic acid [rRNA]) or specific for one or a limited number of species (e.g., hsp70, gp60). A positive PCR signal is determined using agarose gel electrophoresis, ethidium bromide staining and by visually examining the gel under UV light. PCR can be highly sensitive (i.e., level of a single (oo)cyst per reaction tube) and specific (Deng et al., 1997, 2000; Bukhari et al., 1998; Di Giovanni et al., 1999; Kostrzynska et al., 1999; Rochelle et al., 1999; Hallier-Soulier and Guillot, 2000; Hsu and Huang, 2001; McCuin et al., 2001; Moss and Arrowood, 2001; Rimhanen-Finne et al., 2001, 2002; Sturbaum et al., 2002; Ward et al., 2002), and is also amenable to automation.
The traditional PCR method described above only provides information on whether the DNA target is present or absent in the sample being tested. However, it can be combined with other techniques, such as restriction fragment length polymorphism (RFLP) or DNA sequencing, to discriminate between species and genotypes of Giardia and Cryptosporidium (Morgan et al., 1997; Widmer, 1998; Lowery et al., 2000, 2001a,b; Xiao et al., 2001; Ruecker et al., 2012; Prystajecky et al., 2014), or techniques such as cell culture (Jenkins et al., 2003; Keegan et al., 2003; LeChevallier et al., 2003) to determine (oo)cyst viability and infectivity (see section 6.6).
Variations on the traditional PCR have been developed and used for pathogen detection, the most common being quantitative (q) PCR (also referred to as real-time). qPCR is a modified PCR that involves oligonucleotide probes with the use of dyes that fluoresce when bound to double-stranded DNA. As the target region within (oo)cysts is amplified, the emitted fluorescence is measured in real time, thereby allowing quantification of the PCR products. This method has several advantages over traditional PCR, including eliminating post-PCR analysis, increased throughput, decreased likelihood of contamination (i.e., closed vessel system), and the ability to quantify (oo)cysts using a standard curve (MacDonald et al., 2002; Fontaine and Guillot, 2003; Bertrand et al., 2004), although in practice, quantification of oocysts is not always possible. Research has shown that qPCR was unable to distinguish between the signals for 1, 2, 5, and 10 oocysts (Staggs et al., 2013). In general, a 10 fold increase in oocyst density is needed to detect differences in concentration (Di Giovanni and LeChevallier, 2005; Staggs et al., 2013). A qPCR approach has other unique advantages, including its ability to differentiate between species of Giardia and Cryptosporidium (using melting curve analysis) (Limor et al., 2002; Ramirez and Sreevatsan, 2006) and the simultaneous detection of different microorganisms (i.e., multiplexing) (Guy et al., 2003). This assay offers several advantages over traditional PCR and IFA, and has proven useful in identification and enumeration of (oo)cysts. This technique has also been used in combination with propidium monoazide (PMA) dye to determine (oo)cyst viability (Brescia et al., 2009; Alonso et al., 2014).
Digital PCR is a new technique that provides some of the same advantages of qPCR (e.g., real-time results, multiplexing) and overcomes some of the disadvantages, such as the requirement to generate a standard curve for quantitation (Gutiérrez-Aguirre et al., 2015; Cao et al., 2015). This technique has been used in clinical settings; however, it has only recently been applied to environmental samples. Similar to qPCR, it requires a relatively expensive analyser.
Reverse transcriptase (RT-PCR or RT-qPCR) targets RNA as opposed to DNA and can be used to discriminate between viable and non-viable (oo)cysts. Further information can be found in section 6.6.3.
Although there are numerous advantages to PCR assays, they also have several drawbacks. PCR inhibition by divalent cations and humic and fulvic acids is a significant problem (Sluter et al., 1997). In an effort to remove these inhibitors, samples must go through several purification steps. In addition to inhibition, inefficient (oo)cyst lysis is often an issue. Despite these problems, many PCR assays have been developed for detection of waterborne (oo)cysts (Stinear et al., 1996; Kaucner and Stinear, 1998; Griffin et al., 1999; Lowery et al., 2000; Gobet and Toze, 2001; Karasudani et al., 2001; Ong et al., 2002; Sturbaum et al., 2002; Ward et al., 2002).
6.4.3.2 Other molecular methods
Other molecular methods that have been used for the detection of (oo)cysts include fluorescence in situ hybridization (FISH), microarrays, and loop-mediated isothermal amplification. These methods are not used routinely but have been used with varying levels of success in research laboratories. Further work on validating and standardizing these methods would be needed for their use outside of a research laboratory.
6.5 Recovery efficiencies
An integral part of the Giardia and Cryptosporidium detection process involves determining recovery efficiencies. As mentioned previously, there can be significant losses of (oo)cysts during the concentration and separation processes. In addition, the characteristics of the water (e.g., presence of suspended solids, algae) can have a significant impact on recovery efficiency. To measure recovery efficiency, a known number of (oo)cysts are introduced into the water sample (i.e., seeding) before the sample is analysed. Ideally, the recovery efficiency should be determined for each sample; however, because this is expensive, recovery efficiency data are usually collected for a subset of samples. For example, EPA Method 1623.1 requires a recovery efficiency sample to be analysed for (oo)cysts each week, or every 20 samples if more than 20 samples are analysed weekly (U.S. EPA, 2012). With the introduction of commercial preparations containing a certified number of (oo)cysts, including recovery efficiency measurements has become more cost-effective and routine.
The recovery efficiency for the most commonly used method, EPA Method 1623, has been reported to have an average Cryptosporidium recovery of 40% and an average Giardia recovery of 69% (Jaidi et al., 2009), although the recovery does vary between studies (U.S. EPA, 2001; Quintero-Betancourt et al., 2003). Several studies have also evaluated the recovery efficiencies achieved using EPA Method 1623 with different types of filters (McCuin and Clancy, 2003; Ferguson et al., 2004; Hu et al., 2004; Wohlsen et al., 2004; Karim et al., 2010). Recoveries ranged significantly and correlated with variations in raw water quality. As recovery efficiencies are less than 100%, the estimated concentration of (oo)cysts in a water sample is almost always higher than the measured density. Ongerth (2013b) showed that by correcting the (oo)cysts' density measurements for recovery, the resulting concentration estimate changed by a factor of 2 to 10, depending on the recovery efficiency. It has also been shown that the method used to incorporate recovery data can bias the concentration estimate (Schmidt et al., 2013). Thus, recovery efficiencies should be reported, and they can be used to better approximate the concentration of (oo)cysts. If they are included in the (oo)cyst concentration estimate, the approach used for incorporating the recovery efficiency needs to be recorded.
6.6 Assessing viability and infectivity
A major drawback of existing methods routinely used for the detection of Giardia and Cryptosporidium is that they provide very limited information on the viability or human infectivity of (oo)cysts, which is essential in determining their public health significance.
The viability of (oo)cysts can be assessed using in vitro methods such as excystation, fluorogenic dye inclusion/exclusion (i.e., staining), RT-PCR and FISH. Although these methods may provide information on viability, they do not provide information on whether the (oo)cysts are species or types capable of causing infections in humans.
To assess infectivity, in vitro methods such as RFLP or DNA sequencing can be used to determine whether samples contain potentially human-infective genotypes. However, these methods do not provide any information on viability.
Cell culture, on the other hand, is an in vitro method that can assesses viability and infectivity concurrently. Animal infectivity assays are in vivo methods that also evaluate both viability and infectivity. Unfortunately, both cell culture and animal infectivity methods are costly because of the need for maintaining cell lines, animals, and qualified staff; as a result, they are not typically applied to the routine assessment of (oo)cysts.
A brief discussion of available methods for assessing viability or infectivity is provided in the following sections.
6.6.1 Excystation
Viability (but not infectivity) can be estimated by subjecting (oo)cysts to conditions similar to those in the gut, in an effort to stimulate excystation (i.e., release of trophozoites/sporozoites). Excystation "cocktails" and conditions vary considerably and may result in conflicting observations. If (oo)cysts are capable of excystation, they are considered viable. Giardia can be excysted using acid and enzymes, such as trypsin, and grown in TYI S 33 medium (Diamond et al., 1978; Rice and Schaefer, 1981), but the excystation rate for Giardia is often low. Cryptosporidium parvum oocysts can also be excysted (Black et al., 1996; Hijjawi, 2010); however, excystation methods have been shown to be relatively poor indicators of Cryptosporidium oocyst viability. Neumann et al. (2000b) observed that non-excysted oocysts recovered after commonly used excystation procedures are still infectious to neonatal mice.
6.6.2 Dyes
Various staining methods have been developed to assess (oo)cyst viability, based on the inclusion or exclusion of two fluorogenic dyes: DAPI and PI (Robertson et al., 1998; Freire-Santos et al., 2000; Neumann et al., 2000b; Gold et al., 2001; Iturriaga et al., 2001). These dyes are used to determine (oo)cyst wall permeability. Three classes of (oo)cysts can be identified: 1) viable (inclusion of DAPI, exclusion of PI), 2) non-viable (inclusion of both DAPI and PI) and 3) quiescent or dormant (exclusion of both DAPI and PI, but potentially viable). In general, DAPI and PI give good correlation with in vitro excystation (Campbell et al., 1992). Neumann et al. (2000a) demonstrated a strong correlation between DAPI/PI staining intensity and animal infectivity of freshly isolated C. parvum oocysts. These stains have also been successfully used in conjunction with fluorescently labelled antibodies (used in FACS) to determine the viability and infectivity of (oo)cysts in water samples, because their fluorescence spectra do not overlap with those of the antibodies (Belosevic et al., 1997; Bukhari et al., 2000; Neumann et al., 2000b). Although positive correlations have been reported, dye inclusion/exclusion, like excystation procedures, has also been shown to overestimate the viability and potential infectivity of (oo)cysts and therefore should be interpreted with caution (Black et al., 1996; Jenkins et al., 1997).
PMA is a vital dye that is used in conjunction with molecular methods, such as qPCR, to determine the viability of (oo)cysts. PMA enters (oo)cysts that are damaged where it then intercalates into the DNA, and can form a stable complex that prevents PCR amplification. This property enables differentiation of live and dead organisms (Brescia et al., 2009; Alonso et al., 2014). The use of PMA for determining (oo)cyst viability is a relatively new approach and further research on its advantages and limitations is needed.
6.6.3 Reverse transcriptase–polymerase chain reaction
RT-PCR can be applied to detect viable (oo)cysts in water concentrates (Kaucner and Stinear, 1998). RT-PCR amplifies a messenger ribonucleic acid (mRNA) target molecule. As only viable organisms can produce mRNA, this experimental method may prove useful in assessing (oo)cyst viability. For example, when compared with the IFA DAPI/PI method, the frequency of detection of viable Giardia increased from 24% with IFA to 69% with RT-PCR. An advantage of this approach is that it can be combined with IMS, allowing for simultaneous detection and viability testing (Hallier-Soulier and Guillot, 2000, 2003). It can also be quantitative, although quantitation can be difficult as the number of copies of the mRNA target can vary. RT-PCR, like other PCR-based methods, is highly susceptible to environmental inhibition and suffers from inefficient extraction of nucleic acids from (oo)cysts.
6.6.4 Fluorescence in situ hybridization
FISH has shown modest success in differentiating between living and dead (oo)cysts (Davies et al., 2005; Lemos et al., 2005; Taguchi et al., 2006); however, false positives are common (Smith et al., 2004). As 18S rRNA is present in high copy numbers in viable (oo)cysts but in low numbers in non-viable (oo)cysts, it is a useful target for assessing viability. Like DAPI/PI staining, FISH is unable to assess (oo)cyst infectivity.
6.6.5 Genotyping methods
Genotyping methods, such as RFLP analysis and DNA sequencing, have been used extensively in recent years to determine the species of Giardia and Cryptosporidium present in positive water samples, providing insight on whether they are human-infective genotypes. Genotyping methods can be applied directly to the slides from an IFA. The DNA from the positive wells is extracted and a (nested)(q) PCR is used to amplify a specific DNA target that allows for identifying the organism to the species (and sometimes strain) level. There are several DNA targets that have been used for amplification. Usually, the small subunit rRNA gene is used for genotyping methods since it is present in multiple copies and provides conserved and unique segments that can be used for identification tools. However, other targets have also been used. For Giardia, genotyping has been done using the 5.8S gene along with the two flanking internal transcribed spacer regions (Cacciò et al., 2010) and the β-Giardin gene (Cacciò et al., 2002). For Cryptosporidium, the 18S rRNA gene is often the target for species identification (Ryan et al., 2003; Loganthan et al., 2012), but other genes, such as hsp70, are used for determining strains. The PCR product is used for RFLP analysis or for DNA sequencing to determine the genotypes present (Ruecker et al., 2012; Xiao et al., 2013). Sometimes both methods are used, especially if there are multiple species in the same sample (Ruecker et al., 2012). If the DNA amplification is carried out using qPCR, then melt curve analysis can also been used to aid in the identification of species.
The feasibility of using genotyping methods during routine (oo)cyst analysis needs to be further explored. Recently, a large multi-laboratory study was conducted in the U.S. to determine whether genotyping could be applied successfully to previously collected regulatory samples by laboratories outside of a research setting. It was found that with training, but no previous experience in genotyping, labs were able to successfully genotype 65% of the slides, many of which contained a low number of oocysts per slide (Di Giovanni et al., 2014). This suggests that, with further investigation and validation, it may become possible to include genotyping as part of a standard method.
6.6.6 Animal infectivity assays
The most direct method for assessing (oo)cyst viability and infectivity is to inoculate a susceptible animal and monitor for (oo)cyst shedding and any histological evidence of disease development. Giardia and Cryptosporidium are used to infect experimental animals such as the gerbil (for Giardia) (Belosevic et al., 1983) and the neonatal CD-1 mouse (for Cryptosporidium) (Finch et al., 1993). This approach has shown moderate success (Delaunay et al., 2000; Korich et al., 2000; Matsue et al., 2001; Noordeen et al., 2002; Okhuysen et al., 2002; Rochelle et al., 2002), but it is not practical, as most analytical laboratories do not maintain animal colonies, and animal infectivity assays are expensive to perform. This approach is also not sensitive enough for environmental monitoring (i.e., high median infective dose [ID50]). These assays are typically reserved for research purposes, such as assessing disinfection effectiveness, rather than for routine assessment of (oo)cyst viability/infectivity.
6.6.7 Cell culture infectivity assays
Cell culture infectivity assays, as mentioned earlier, are in vitro methods that can assess viability and infectivity concurrently. These methods have been developed for Cryptosporidium, but are not used for determining Giardia infectivity. In vitro cell culture assays for Cryptosporidium involve exposing oocysts to excystation stimuli followed by their inoculation into a cultured mammalian cell line, such as human ileocaecal adenocarcinoma (HCT-8) cells, which support the parasite's growth and development. Oocysts are typically inoculated on HCT-8 cell monolayers. After a 24- to 72-hour incubation, the cell monolayer is examined for the presence of Cryptosporidium reproductive stages using either an indirect IFA (Slifko et al., 1997) or PCR (Rochelle et al., 1997; Di Giovanni et al., 1999). A standardized cell culture infectivity assay has recently been published (APHA et al., 2012).
This approach has been used to estimate the infectivity of oocysts in water (Di Giovanni et al., 1999; Hijjawi et al., 2001; Weir et al., 2001; Rochelle et al., 2002; Johnson et al., 2005; Schets et al., 2005; Coulliette et al., 2006) and has been shown to yield results comparable to those of the mouse infectivity model (Hijjawi et al., 2001; Rochelle et al., 2002; Slifko et al., 2002). In other comparison studies, average percent viabilities were comparable for cell culture, excystation and DAPI/PI assays (Slifko et al., 1997).
There are several advantages to the cell culture assay, including its high sensitivity (i.e., detection of a single viable oocyst), applicability to analysis of raw and treated water samples, ease of performance and rapid turnaround time for results. Another advantage of this approach is that C. parvum and C. hominis can be maintained in vitro for up to 25 days, facilitating viability and immunotherapy studies (Hijjawi, 2010). In addition, cell culture can be combined with other methods, including PCR and IFA, to more accurately assess viability/infectivity. Cell culture PCR (CC-PCR) has proven useful in assessing watershed contamination and in estimating risk (Joachim et al., 2003; LeChevallier et al., 2003; Masago et al., 2004). Combining cell culture with IFA (CC-IFA) may have an advantage over CC-PCR/CC-RT-PCR in that fewer false positives were found (Johnson et al., 2012). Although cell culture infectivity assays have several advantages, they also possess a number of disadvantages, including the need to maintain a cell line, and poor reproducibility among similar samples for quantitative assessments. Moreover, it is currently unknown whether all species of Cryptosporidium can be detected with existing cell culture methods; however, it has been proven to detect C. parvum, C. hominis, and C. meleagridis, and these are the main human infectious genotypes (Rochelle et al., 2012).
7.0 Treatment technology
The primary goal of treatment is to reduce the presence of disease-causing organisms and associated health risks to an acceptable or safe level. This can be achieved through one or more treatment barriers involving physical removal and/or inactivation. To optimize performance for removal and/or inactivation of microbial pathogens, the relative importance of each barrier should be understood. Some water systems have multiple redundant barriers, such that failure of one barrier still provides adequate treatment. In other cases, all barriers must be working well to provide the required level of treatment. For example, Cryptosporidium is extremely resistant to commonly used chlorine-based disinfectants (Korich et al., 1990; U.S. EPA, 1991, Finch et al., 1994, 1997). As a result, many treatment systems rely solely on physical removal processes (i.e., filtration) to remove oocysts. For these systems, failure of the filtration process, or required pre-treatment processes (i.e., coagulation/flocculation for chemically assisted filtration), could lead to a waterborne outbreak.
The source-to-tap approach, including source water protection, is a universally accepted approach to reduce protozoa and other waterborne pathogens in drinking water (O'Connor, 2002; CCME, 2004). Operator training is also required to ensure the effective operation of treatment barriers at all times (Smeets et al., 2009).
7.1 Municipal scale
The use of a combination of physical removal and inactivation technologies is the most effective way to reduce (oo)cysts in drinking water. It is essential that physical removal and/or inactivation targets be achieved before drinking water reaches the first consumer in the distribution system. Physical removal barriers, such as filtration technology, are assigned a “log removal” credit towards reducing (oo)cyst levels when they achieve specified individual filter effluent turbidity limits as discussed in section 7.1.2. Inactivation barriers include primary disinfection processes. “Log inactivation” credits are calculated using the disinfection concepts described in section 7.1.3. The “log removal” and “log inactivation” credits are summed to calculate the overall (oo)cyst “log reduction” for the treatment process being assessed. Secondary disinfection is used to maintain a residual in the distribution system to protect against microbial regrowth and serve as a sentinel for water quality changes. No log inactivation credits are awarded for secondary disinfection processes.
7.1.1 Level of treatment necessary
To determine the necessary level of treatment, the source water should be adequately characterized. Source water characterization generally includes a number of steps, including delineating the boundary of the source water area, identifying threats and risks to the source water and measuring its microbiological, physical, chemical and radiological quality (WHO, 2011, 2012). Monitoring of seasonal changes is also important to ensure that water utilities consistently produce high quality treated water for the full range of raw water conditions (Valade et al., 2009; Huck and Sozański, 2011).
For surface water sources, the required level of treatment should ideally be determined by measuring Giardia and Cryptosporidium concentrations during normal conditions and following spring runoff or storm events. Sampling results should take into account recovery efficiencies for the analytical method and pathogen viability in order to obtain the most accurate assessment of infectious pathogens present in the source water (Emelko et al., 2008, 2010a; Schmidt and Emelko, 2010; Schmidt et al., 2010, 2013). Where source water sampling and analysis for Giardia and Cryptosporidium are not feasible (e.g., small community water supplies), the source water characterization—including water quality parameters that can provide information on the risk and/or level of faecal contamination—can be used to establish the necessary level of treatment. Further guidance on characterizing risks in small systems can be found elsewhere (WHO, 2012). Safety factors or additional treatment reductions may be applied to ensure the production of microbiologically safe drinking water, particularly if source water quality is highly variable.
Subsurface sources should be evaluated to determine whether the supply is vulnerable to contamination by enteric protozoa (i.e., GUDI) and other enteric pathogens. These assessments should include, at a minimum, a hydrogeological assessment, an evaluation of well integrity and a survey of activities and physical features in the area. Chlorophyll-containing algae are considered unequivocal evidence of surface water. Jurisdictions that require MPA as part of their GUDI assessment should ensure algae are a principal component of any MPA tests (U.S. EPA, 2016). Subsurface sources determined to be GUDI should achieve a minimum 3 log removal and/or inactivation of enteric protozoa. Sources that have been assessed as not vulnerable to contamination by enteric protozoa should meet the recommendations set out in the guideline technical document on enteric viruses (Health Canada, 2011a). It is important that subsurface sources be properly classified as numerous outbreaks have been linked to the consumption of untreated groundwater contaminated with enteric protozoa and/or other enteric pathogens (see sections 5.3 and 5.4)(Wallender et al., 2014; U.S. EPA, 2016).
As most surface waters and GUDI supplies are subject to faecal contamination, treatment technologies should be in place to achieve a minimum 3 log (99.9%) removal and/or inactivation of Giardia and Cryptosporidium. With this level of treatment, a mean source water concentration of 21 cysts/100 L can be reduced to 2.1 × 10⁻² cysts/100 L, which meets the population health target of 10−6 disability-adjusted life year (DALY)/person per year, as outlined in section 9.0. Similarly, a mean source water concentration of 13 oocysts/100 L can be reduced to 1.3 × 10⁻² oocysts/100 L. As many surface waters in Canada have higher (oo)cyst concentrations (see sections 5.1.1 and 5.2.1), additional removal/inactivation may be needed to meet treatment goals.
The identification of the most appropriate treatment process requires site-specific evaluation and should be made after suitable analysis and/or pilot testing. More variable weather patterns associated with climate change will place increased importance on proper process selection (Huck and Coffey, 2004).
7.1.2 Physical removal
Physical removal of (oo)cysts can be achieved by a variety of technologies, including chemically assisted, slow sand, diatomaceous earth and membrane filtration or an alternative proven filtration technology. Riverbank filtration is a passive filtration approach to remove microorganisms that may also be recognized by the appropriate drinking water authority. For chemically assisted, slow sand and diatomaceous earth filtration, there are sufficient full-scale or pilot-scale studies using (oo)cysts to document log removals achieved by these processes. For membrane filtration, published studies report log removals using either the target organism or an appropriate surrogate (U.S. EPA, 2005b). For riverbank filtration, log removals can be calculated using Cryptosporidium or a surrogate for Cryptosporidium, along with related hydrogeological and water quality parameters required to approximate the groundwater dilution ratio and time lag from the surface water body (e.g., temperature, conductivity, dissolved organic carbon, chloride, bromide, total dissolved solids, hydrogen, oxygen, uranium and other isotopes; U.S. EPA, 2010). As (oo)cysts are seldom detected in supplies using riverbank filtration, published studies use surrogates to report log removals. However, there is no universally accepted surrogate or indicator organism, suite of organisms or physical parameter (e.g., turbidity) that can be used to assess the fate and transport of microbial contaminants in subsurface environments (Schijven et al., 2002; Pedley et al., 2006; Emelko et al., 2010b; Tufenkji and Emelko, 2011; Bradford et al., 2016; Headd and Bradford, 2016). The U.S. EPA (2010) recommends monitoring for at least three or four surrogate organisms using paired surface water and groundwater samples. The following are suggested as possible surrogates to calculate the log removal efficiency of riverbank filtration: aerobic spores (e.g., Bacillus subtilis), anaerobic spores (e.g., Clostridium perfringens), total coliforms, E. coli, enterococci bacteria, bacteriophages, coliphages or diatoms. Other surrogates noted in U.S. EPA (2010) include turbidity, particle counts and MPA although log removal efficiencies cannot be calculated using these results.
7.1.2.1 Chemically assisted filtration
The goal of coagulation is to destabilize (i.e., neutralize the charge of) colloidal particles (including pathogens) so that they effectively aggregate during flocculation and are subsequently removed by clarification (sedimentation or dissolved air flotation). Solids contact units including ballasted sand flocculation processes combine coagulation, flocculation and clarification in one process. Granular media filtration acts as a polishing step for further removal of small colloidal particles not removed during clarification. For effective removal during filtration, colloidal particles must be destabilized during coagulation; it is for this reason that granular media filtration is recognized as a physico-chemical treatment process and is commonly referred to as chemically assisted filtration. Direct filtration plants do not include a clarification step, and inline filtration plants do not include either flocculation or clarification (AWWA, 2011a; MWH, 2012).
Considerable research has been conducted to establish (oo)cyst log removals for chemically assisted filtration. Mean log removals reported in full-scale studies range from >1.54 to >5.2 (median of means = >3.02) for Giardia and from >1.2 to >4.6 (median of means = >2.34) for Cryptosporidium (LeChevallier et al., 1991c; LeChevallier and Norton, 1992; Payment and Franco, 1993; Nieminski and Ongerth, 1995; States et al., 1997; Gammie et al., 2000). Because (oo)cysts are rarely detected in treated water, the effectiveness of treatment depends largely on the source water (oo)cyst concentration. Analytical detection limits and recovery efficiencies also influence log removal calculations.
Numerous pilot-scale challenge studies have also been conducted where microorganisms are spiked into raw water at concentrations large enough to be detected in treated water. Table 5 summarizes published pilot-scale results for Giardia (range = 1.0 to 5.5; median of means = 3.4) and Cryptosporidium (range = 0.73 to >6.6; median of means = 3.4). While most pilot-scale studies have evaluated the removal of Cryptosporidium, Giardia removal should be achieved concurrently at full scale. However, because Giardia may be present at higher concentrations in the source water, it may drive the log removal treatment goal for protozoa (Tfaily et al., 2015).
Pilot-scale log removal calculations are also impacted by analytical issues related to detection limits and recovery efficiencies, as well as how non-detects are handled (Emelko et al., 2005; Zhou et al., 2015). Experimental factors that influence results include the (oo)cyst seeding location and concentration (Hendricks et al., 2005; Assavasilavasukul et al., 2008a, 2008b; Campbell et al., 2014). For example, the minimum log removals reported by Assavasilavasukul et al. (2008a, 2008b) were attributed to the low spiking concentration.
From an operational perspective, coagulation chemistry is reported to be the most important variable (Ongerth et al., 1989; Ongerth and Pecoraro, 1995; Patania et al., 1995; Edzwald and Kelley, 1998; Coffey et al, 1999; Emelko et al., 1999; Dugan et al., 2001; Harrington et al., 2001; Huck et al., 2001, 2002; Dai and Hozalski, 2002; Lytle et al., 2002; Emelko, 2003; Betancourt and Rose, 2004; Hendricks et al., 2005; O’Melia, 2006; Hijnen and Medema, 2007a; Brown and Emelko, 2009). Patania et al. (1995) and Hendricks et al. (2005) reported log removals without chemical pre-treatment in the range of 0.0 to 0.84 and 0.0 to 1.10 for Giardia and Cryptosporidium, respectively; Huck et al. (2001) reported oocyst log removals of 0 to 0.86 without pre-treatment. Several studies reported that oocyst removal by filtration can significantly deteriorate during sub-optimal coagulant conditions (e.g., treatment effectiveness decreased by 2.0 to 3.4 log compared to optimal conditions) (Ongerth and Pecoraro, 1995; Patania et al., 1995; Dugan et al., 2001; Huck et al., 2001).
| Study | Log Removal Giardia |
Log Removal Cryptosporidium |
||||
|---|---|---|---|---|---|---|
| Min | Max | Mean | Min | Max | Mean | |
| Nieminski and Ongerth, 1995 (Plant 1) | 2.20 | 3.90 | 3.40 | 1.94 | 3.98 | 2.98 |
| Nieminski and Ongerth, 1995 (Plant 2) | 2.90 | 4.00 | 3.30 | 1.31 | 3.78 | 2.97 |
| Ongerth and Pecoraro, 1995 | 2.82 | 3.70 | 3.33 | 2.52 | 3.40 | 2.90 |
| Patania et al, 1995 | 3.4 | 5.1 | 4.2 | 2.7 | 5.9 | 4.2 |
| Edzwald and Kelley, 1998 | Not tested | 4.2 | 5 | Table 5 footnote * | ||
| Swertfeger et al., 1999 | 2.5 | 4.7 | 3.7 | 1.6 | 4.2 | 3.1 |
| Edzwald et al., 2000 | 4.3Table 5 footnote 1 | 5.5Table 5 footnote 1 | Table 5 footnote * | 5.3Table 5 footnote 1 | 5.5Table 5 footnote 1 | Table 5 footnote * |
| Dugan et al., 2001 | Not tested | 4.5 | 5.4 | >5.0 | ||
| Huck et al., 2001, 2002 (Plant 1) | Not tested | 4.7 | 5.8 | 5.5 | ||
| Huck et al., 2001, 2002 (Plant 2) | 2.9 | 4.9 | 4.4 | 2.0 | 5.0 | 3.0 |
| States et al., 2002 | Not tested | 2.3 | >6.6 | >5.8 | ||
| Emelko et al., 2003a | Not tested | 4.7 | 5.8 | 5.6 | ||
| Emelko, 2003 | Not tested | 4.7 | 5.7 | 5.1 | ||
| Emelko and Huck, 2004 | Not tested | 4.2 | 5.7 | Table 5 footnote * | ||
| Hendricks et al., 2005 (Plant 1) | 3Table 5 footnote 1 | 3.5Table 5 footnote 1 | 3.2 | 3Table 5 footnote 1 | 3.6Table 5 footnote 1 | 3.4 |
| Hendricks et al., 2005 (Plant 2) | 2.9Table 5 footnote 1 | 3.9Table 5 footnote 1 | 3.24 | 2.5Table 5 footnote 1 | 4.2Table 5 footnote 1 | 3.38 |
| Assavasilavasukul et al., 2008a, 2008b | 1.0 | 5.4 | Table 5 footnote * | 0.73 | 5.2 | Table 5 footnote * |
| Brown and Emelko, 2009 | Not tested | 3.8Table 5 footnote 1 | 4.7Table 5 footnote 1 | Table 5 footnote * | ||
Table 5 footnotes
- Table 5 footnote *
-
Not given
- Table 5 footnote 1
-
Graphical interpretation
Media design (sand, anthracite/sand, GAC/sand) were found to be equally effective (Hall et al., 1995; Patania et al., 1995; Swertfeger et al., 1999; Dugan et al., 2001; Hendricks et al., 2005) although Hijnen et al. (2010) found that fresh GAC polishing filters removed 2.7 log of C. parvum versus 1.2 log for loaded GAC; the average removal rate for G. lamblia was 2.1 log for both fresh and loaded GAC. Filtration rate did not significantly influence results (Patania et al., 1995; Edzwald and Kelley, 1998; Harrington et al., 2001; Huck et al., 2001).
Patania et al. (1995) and Hendricks et al. (2005) reported that conventional filtration was more effective than direct/inline filtration. Several bench- and pilot-scale studies have demonstrated that for water sources containing algae, natural colour or natural organic matter (NOM), dissolved air flotation can achieve 2 to 3 log removals of Giardia and Cryptosporidium compared to 1 to 2 log removals by sedimentation. In these types of sources, low density flocs tend to be formed, and these are more amenable to flotation than to sedimentation (Plummer et al., 1995; Edzwald and Kelley, 1998; Edzwald et al., 1999; Edzwald et al., 2000; Harrington et al., 2001; Edzwald et al., 2003; Edzwald, 2010; Gregory and Edzwald, 2011).
Numerous studies reported that a filter effluent of 0.1 NTU or less is required to maximize (oo)cyst reduction (Logsdon et al., 1981; Logsdon et al., 1985; Nieminski and Ongerth, 1995; Patania et al., 1995; Harrington et al., 2001; Huck et al., 2001; Emelko et al., 2003a; Emelko et al., 2005; Hendricks et al., 2005; Campbell et al., 2014). However, filter effluent turbidity of <0.1 NTU is not an indication of the absence of (oo)cysts in treated water (Gammie et al., 2000; Aboytes et al., 2004).
The filter-ripening and end-of-filter-run periods are also identified as vulnerable periods (Logsdon et al., 1981; Logsdon et al., 1985; Ongerth et al., 1989; Patania et al., 1995; Huck et al., 2001; Amburgey et al., 2003; Emelko et al., 2003a; Emelko and Huck, 2004; Amburgey et al., 2005; Soucie and Sheen, 2007). Thus, filters must be carefully controlled, monitored and backwashed such that no periods of insufficient removal occur during the filter cycle. Filter-to-waste and the extended sub-fluidization wash technique are options to reduce risk during the filter-ripening period (Amburgey et al., 2003, 2005; Soucie and Sheen, 2007). It is recommended that filter backwash water not be recirculated through the treatment plant without additional treatment.
In summary, well-operated chemically assisted filtration plants optimized for particle and NOM removal should be capable of achieving 3 log removal for (oo)cysts (Hall et al., 1995; Patania et al., 1995; Huck et al., 2002; Betancourt and Rose, 2004; Emelko et al., 2005; Hijnen and Medema, 2007a). For this to occur, it is critical that the preceding coagulation and flocculation steps be optimized. Jar tests should be conducted to optimize the pre-treatment process (Hall et al., 1995; U.S. EPA, 2004; AWWA, 2011b). Monitoring the net surface charge of particles following coagulation may also be helpful where source water quality is highly variable (Conio et al., 2002; Newcombe and Dixon, 2006; AWWA, 2011b; Kundert, 2014; McVicar et al., 2015; Sharp, 2015).
In addition to filter effluent turbidity, other parameters such as dissolved coagulant metal-ion concentration in the filtered water and the stability of clarified water turbidity are indicators of treatment problems and increased (oo)cyst risk (Hall et al., 1995; Hiltz, 2015). Particle counts have also been reported to be a sensitive measure of treatment performance, particularly when filter effluent turbidity is approximately 0.1 NTU or less (Jacangelo et al., 1991; Coffey et al., 1999; Emelko et al., 1999; Huck et al., 2001; Huck et al., 2002).
7.1.2.2 Slow sand and diatomaceous earth filtration
Slow sand filtration generally consists of untreated water flowing by gravity at a slow rate through a bed of submerged porous sand. During operation, biological growth occurs within the sand bed and gravel support. In addition, bacteria and other materials in the source water accumulate on the surface to form a “schmutzdecke”. The biological growth within the filter and schmutzdecke both contribute to the effectiveness of slow sand filtration. Depending on the source water quality, it may take weeks or months for this biological growth to develop. Pilot testing is recommended to ensure slow sand filtration will successfully treat a source water (Bellamy et al., 1985a, 1985b; Logsdon et al., 2002).
Numerous pilot-scale challenge studies have been conducted to establish (oo)cyst log removals for slow sand filtration. Bellamy et al. (1985a) reported a log removal of 2.07 for Giardia with a new sand filter that did not have a mature microbiological population. As the microbiological population within the sand bed and gravel support matured, log removals increased to 3.72 to 4.22. Pyper (1985) reported 3.70 log removal for Giardia under warm temperature conditions; however, log removals decreased to between 2.19 and 3.05 when the temperature was below 7ºC. Log removals were further reduced to 1.20 at cold temperatures (0.5ºC) when sewage was added to simulate a sewer break or other Giardia contamination event. Schuler et al. (1991) reported 2.77 log removal of Giardia for a new filter during winter and >4 log in warm weather as the filter matured; a log removal of ≥4 log for Cryptosporidium was reported for the duration of the study (March 1988 to January 1989). Timms et al. (1995) reported 4.52 log removal of Cryptosporidium with a 50 cm bed depth and observed no adverse effects when the filtration rate was increased from 0.3 to 0.4 m/h. DeLoyde et al. (2006) reported average Cryptosporidium log removals of 2.0 to >5.2 and 1.5 to 3.7 when operated at 0.4 and 0.8 m/h, respectively. Average Giardia log removals ranged from >2.4 to >4.9 and >2.5 to >4.8 when operated at 0.4 m/h and 0.8 m/h, respectively. Cryptosporidium log removals for a mature filter operated at 0.3 m/h and a temperature ranging from 8.2 to 18.8ºC were reported by Dullemont et al. (2006) to be 5.3 on average, while Hijnen et al. (2007) adjusted this to 4.7 using a mass balance approach that considered the number of dosed organisms, organisms found in the filtrate and organisms found in the filter bed. The latter approach was reported to better represent non-detect results reported as zero in the earlier study. Hijnen and Medema (2007b) completed a literature review of the microbial elimination capacity of slow sand filtration and concluded that average log removals of 4.9 and 4.8 for Giardia and Cryptosporidium, respectively, are achievable. Fogel et al. (1993) reported much lower full-scale results at low temperature (0.5ºC) of 1.2 log for Giardia and 0.3 log for Cryptosporidium. The authors noted that the sand used had a uniformity coefficient of 3.5 instead of the original specification of between 1.8 and 2.2. The low temperature may also have affected performance, as Schijven et al. (2013) reported that the removal of microorganisms by slow sand filtration is most sensitive to changes in temperature and the age of the schmutzdecke.
In summary, when properly designed, constructed, operated and maintained, slow sand filtration can be effective in removing (oo)cysts from a contaminated water source over a wide range of operating conditions. Because of the essential biological action of slow sand filtration, it is important to allow a filter to mature for a period after scraping/cleaning is performed (Collins et al., 1991; Edzwald et al., 1998; Heller and Ladeira Alves de Brito, 2006). Other precautions may also be required to mitigate low temperature impacts (Schijven et al., 2013).
Diatomaceous earth filtration consists of a pressure filter using a medium made from diatoms. The filtration process involves precoating the septum with diatomaceous earth filter media (i.e., filter cake) and pumping raw water combined with a bodyfeed through the media. Factors that determine performance include diatomite grade, precoat rate and thickness, bodyfeed rate, filtration rate and particle characteristics, such as size, shape, concentration and surface charge, making this a complex process to operate (Logsdon et al., 1981; Langé et al., 1986; Ongerth and Hutton, 1997). Logsdon et al. (1981) reported that Giardia log removals ranged from 2.19 to 4.15. Pyper (1985) reported a log removal of 3.52 for Giardia. Langé et al. (1986) reported complete removal of Giardia in 30 of 31 pilot-scale tests and a log removal of 3.12 for the one result with detectable concentrations. Schuler and Ghosh (1990) and Schuler et al. (1991) reported complete removal of Giardia when diatomaceous earth filtration was operated correctly; removal of Cryptosporidium was also excellent (>3 log) but complete removal was seldom achieved (spiked dose = 1,200 to 3,000 oocysts/L) except when alum was used with finer grades of diatomaceous earth. Ongerth and Hutton (1997, 2001) reported >6 log removal for Cryptosporidium. Diatomaceous earth filtration is an accepted technology, but it is reported to be more labour-, energy- and materials-intensive compared to slow sand filtration and less feasible for sources that have highly variable source water quality (Pyper, 1985).
7.1.2.3 Membrane filtration
Four types of pressure-driven membranes are currently used in drinking water treatment: microfiltration (MF), ultrafiltration (UF), nanofiltration (NF) and reverse osmosis (RO). Membranes are generally classified by the type of substances they remove, operating pressure and pore size or molecular weight cut-off (MWCO). MF and UF are referred to as low-pressure membranes and are used for particle/pathogen removal. The predominant removal mechanism is straining or size exclusion. NF and RO are referred to as high-pressure membranes and are used for the removal of organics (e.g., dissolved NOM) and inorganics (e.g., sodium, chloride, calcium, magnesium). The predominant removal mechanism is differences in solubility or diffusivity. The general classes of membranes, their sizes and the substances that are removed are discussed in Kawamura (2000), AWWA (2005, 2011a) and MWH (2012).
Membranes are typically made of polymeric materials; however, there is limited application of ceramic membranes (AWWA, 2005; Kommineni et al., 2010; Huck and Sozański, 2011; MWH, 2012). Although NF and RO membranes are capable of removing (oo)cysts, they are not typically designed for verifiable removal (ANSI/AWWA, 2010). However, Kruithof et al. (2001) did report using conductivity and sulfate to monitor the integrity of RO membranes. MF and UF membranes, which are designed for verifiable removal, are most commonly used for microbial removal.
Jacangelo et al. (1991) reported log removals of 4.0 to 5.1 for G. muris at pilot-scale for four source waters of varying quality using UF membranes (MWCO = 100 kilodaltons). The authors noted that membrane integrity was critical to assuring process efficacy as G. muris was detected in the filtrate when the membranes were compromised (e.g., broken fibre). Jacangelo et al. (1997) evaluated the removal of G. muris and C. parvum at pilot-scale for three source waters of varying quality using MF membranes (pore size = 0.1 µm and 0.2 µm) and UF membranes (MWCO = 100, 300 and 500 kilodaltons). Both MF and UF membranes removed G. muris and C. parvum to detection limits, provided the membrane was intact. Consequently, the reported log removals—6 to 7 for both G. muris and C. parvum—were a function of the spiked (oo)cyst concentration. Trimboli et al. (2001) challenge tested a full-scale 36 ML/d MF plant using bacillus spores. The authors reported complete rejection of the bacillus spores and >5.9 log removal. Mi et al. (2005) challenged tested two full-scale membrane plants (one MF and one UF) with compromised integrity using bacillus spores. In the full-scale MF plant, five tests were conducted on 1 of 6 racks of MF membranes. Testing was conducted by cutting 0, 1, 3, 6 and 8 fibres, representing integrity breaches of 0 to 0.0025%. Log removals of >6.4, 6.0, 5.3, 4.8 and 4.6 were reported for 0, 1, 3, 6 and 8 cut fibres, respectively. In the full-scale UF plant, three tests were conducted on 1 of 11 racks of UF membranes. Testing was conducted by cutting 0, 1 and 3 fibres, representing integrity breaches of 0 to 0.0009%. Log removals of >5.1, 4.8 and 4.5 were reported for 0, 1, and 3 cut fibres, respectively. Additional summaries of pathogen removal studies are given in U.S. EPA (2001).
Low-pressure membranes are well established as a drinking water treatment process, and it is generally accepted that intact membranes can achieve greater than 3 log removal of Giardia and Cryptosporidium. Integrity breaches, however, can compromise membrane removal capability. It is therefore critical that regular monitoring of membrane integrity be conducted. Guo et al. (2010) provide a comprehensive review of integrity monitoring methods for low-pressure membranes. Although numerous methods exist, the pressure decay test and diffusive air flow test are most commonly used to assess membrane integrity. Both involve pressurizing one side of the membrane barrier and measuring air flow through defects under defined conditions (Johnson, 1998). If the pressure decay rate exceeds the site-specific control limit set for the system, diagnostic testing and repair should be conducted. The results of the integrity test should also be converted to an equivalent log removal value (LRV) using methods described in U.S. EPA (2005b) or ASTM (2010). Most commercially available MF/UF systems are equipped to conduct automated pressure decay tests and calculate the LRV.
It is noteworthy that all membranes become fouled over the course of operation and, consequently, the flux (flow per unit area) for a given pressure differential can substantially decrease (AWWA, 2005; MWH, 2012). Regular backwashing and periodic chemical cleaning, using proper foulant-based cleaning chemicals, is required to remove accumulated foulants. Health Canada strongly recommends that cleaning chemicals be certified by an accredited certification body as meeting NSF International (NSF) /American National Standards Institute (ANSI) Standard 60 Drinking Water Treatment Chemicals – Health Effects (NSF/ANSI, 2017).When the flux can no longer be restored to baseline conditions, the membranes must be replaced (Alspach et al., 2014). Chemical cleaning regimes can create harsh conditions for the membrane material (D’Souza and Mawson, 2005). Direct integrity testing following a chemical clean is suggested to ensure membranes remain intact; direct integrity testing should be conducted in accordance with the manufacturer’s recommendations.
7.1.2.4 Riverbank filtration
Riverbank filtration (RBF) involves locating vertical or horizontal water supply wells near a river to use the riverbank and adjacent aquifer as a natural filter to remove particles and pathogens, micro-pollutants and other organic and inorganic compounds, including biodegradable compounds such as NOM and ammonia (Piet and Zoeteman, 1980; Bize et al., 1981; Kuehn and Mueller, 2000; Ray et al., 2002a, 2002b; Gollnitz et al., 2004; Emelko et al., 2010b; U.S. EPA, 2010). As water proceeds to the groundwater table, contaminant concentrations are lowered because of physical filtration, geochemical reactions, biodegradation, predation and through dilution with groundwater (Kuehn and Mueller, 2000; Ray et al., 2002a; Gollnitz et al., 2003; Weiss et al., 2003; Partinoudi and Collins, 2007; Hubbs, 2010; Tufenkji and Emelko, 2011). Ray et al. (2002a) state that properly designed and operated RBF plants can provide 4-log Cryptosporidium removal.
The RBF process is complex and influenced by a number of factors that can vary between sites. Site-specific factors include the characteristics, composition and thickness of the aquifer materials (e.g., grain size distribution, grain surface characteristics, metal oxide content), river water quality (e.g., number and size of particles/microorganisms, NOM concentration, ammonia, nutrients, and other pollutants), riverbed sediments, filtration velocity and distance, temperature, pH, ionic strength, microbe/sediment surface charge, oxygen concentration and groundwater dilution effects (Sontheimer, 1980; McDowell-Boyer et al., 1986; Johnson and Logan, 1996; Gollnitz et al., 1997; Brush et al., 1998, 1999; Walker et al., 1998; Harter and Wagner, 2000; Kuehn and Mueller, 2000; Shaw et al., 2000; Tufenkji et al., 2002; Ray et al., 2002a; Wang et al., 2002; Tufenkji et al., 2004, 2006; Gollnitz et al., 2005; Hijnen et al., 2005; Tufenkji and Elimelech, 2005; Partinoudi and Collins, 2007; Abudalo et al., 2010; Faulkner et al., 2010; Harvey et al., 2010; Kim et al., 2010; Metge et al., 2010).
Schijven et al. (2002) reported log removals for various microorganisms at three RBF sites in the Netherlands and concluded that under relatively homogenous and steady-state conditions in a saturated sand aquifer, up to 8 log virus removal over a distance of 30 metres in about 25 days could be achieved, and greater log removals could be expected for bacteria, protozoa and algae under the same conditions. The authors cautioned that Cryptosporidium breakthrough to RBF wells has been known to occur (Welker et al., 1994; Hancock et al., 1998; Moulton-Hancock et al., 2000) and noted that public health protection could be compromised but data were insufficient to determine the health risk. Wang et al. (2002) conducted a two-year demonstration-scale study of a 20 mgd (80 ML/d) horizontal collector well drawing from a confined, glacial aquifer with medium, coarse and very coarse sand and gravel with little iron and manganese content. The overall filtration rate was estimated to range from 0.15 to 0.37 m/day. Due to the low number of Giardia and Cryptosporidium detections in the river water and collector well, log removals for these microorganisms could not be calculated. As a result, the removal efficiency of the RBF process was calculated using surrogates of pathogen transport. Average log removals of >7.1, >6.7 and >3.9 were reported for algae (MPA test), diatoms and aerobic spores, respectively. The authors reported that turbidity was reliably lowered to below 1.0 NTU. Gollnitz et al. (2003, 2004) conducted a 20-month full-scale study of an RBF facility drawing water from an alluvial sand and gravel aquifer. The rate of infiltration was estimated to be less than 0.07 m/h (1.7 m/day) the majority of the time except during seven high-river-stage events, when it increased to as high as 0.15 m/h (3.6 m/day). Because no Giardia or Cryptosporidium was detected in the production or flow path wells, log removals for these microorganisms could not be calculated. Log removals were calculated using surrogates for wells with short and long flowpaths from the river; log removals ranged from 4.8 (short flowpath) to 6.2 (long flowpath) for algae and 5.0 (short flowpath) to 4.9 (long flowpath) for aerobic spores. The authors reported that scour did not influence the RBF process during high-stage events and that turbidity was reliably lowered to below 1.0 NTU. Gupta et al. (2009) and Abbaszadegan et al. (2011) also reported that scour did not influence the removal of C. parvum in pilot-scale RBF experiments.
Weiss et al. (2003) conducted a two-year full-scale study of three RBF sites in the United States. As with other studies, data were insufficient to calculate log removals for Giardia and Cryptosporidium, and surrogates were used. Log removals for Clostridium and bacteriophage ranged from >3.2 to >3.4 and >1.9 to >3.3, respectively. Gollnitz et al. (2005) conducted a 24-month full-scale study of a sand and gravel aquifer with a hydraulic conductivity of 76.3 to 244 m/day and travel distances of approximately 6.1 m to in excess of 304.8 m. As with other RBF studies, the data were insufficient to calculate log removals for Giardia and Cryptosporidium, and surrogates were used. Log removals ranged from 3.70 to 5.50 for algae, 6.70 to 7.50 for diatoms and 1.50 to 2.10 for aerobic spores; log removals for total coliforms, E. coli and enterococci were in the order of 2 log. The authors reported that turbidity was reliably lowered to below 0.3 NTU. Partinoudi and Collins (2007) monitored four RBF sites at various frequencies for 8 to 20 months. Distances from the river ranged from 19.5 to 55 m for three sites using vertical RBF wells and 12.2 m for one site using horizontal collectors (caisson). Estimated travel times ranged from 0.75 to 5.5 days for the vertical wells and 1.0 day for the caisson. Log removals ranged from ≥2.01 to ≥4.54 for aerobic spores, from ≥2.72 to ≥3.61 for total coliforms and from ≥1.00 to ≥1.74 for E. coli. The authors cautioned that log removals were low due to low concentrations of microorganisms in the surface waters and non-detection in the riverbank filtered water.
In summary, a substantial amount of research has been conducted to explain the role of various physical, chemical and biological factors on microbial transport and removal in natural subsurface environments; however, predicting and quantifying those removals is difficult (Emelko et al., 2003b; Tufenkji, 2007). Given sufficient flow path length and time, RBF can improve microbial water quality to levels protective of public health (Schijven et al., 2002). Farkas et al. (2015) found that antibodies to Cryptosporidium were lower in communities practicing RBF compared to communities using surface water which supports the theory that RBF is contributing to improved microbial water quality.
Microbial reductions/removals should be assessed on a site-specific basis due to the number of factors that affect the RBF process. Sinclair et al. (2012) describes a process to select one or several representative surrogate(s) for natural (or engineered) systems.
Consolidated aquifers, fractured bedrock, karst limestone and gravel aquifers are typically not eligible to receive RBF credits (Berger, 2002; Wang et al., 2002; U.S. EPA, 2010; Nova Scotia Environment, 2012). Groundwater velocities can be high in these aquifers, and faecal contamination can travel long distances over a short period of time (Harvey et al., 2008; Khaldi et al., 2011). Management of groundwater resources in karst and fractured bedrock should not be conducted in the same way as in sand and gravel aquifers (Crowe et al., 2003). It is important that subsurface sources be classified, as numerous outbreaks have been linked to the consumption of untreated water from these sources (Wallender et al., 2014; U.S. EPA, 2016).
7.1.2.5 Physical log removal credits for treatment barriers
Drinking water treatment plants that meet the turbidity limits established in the Guideline Technical Document on turbidity (Health Canada, 2012d) can apply the average removal credits for Giardia and Cryptosporidium given in Table 6. Alternatively, log removal rates can be established on the basis of demonstrated performance or pilot studies. For RBF, the jurisdiction having authority should be consulted for site-specific requirements.
The physical log removal credits can be combined with the disinfection credits (see section 7.1.3) to meet overall treatment goals. For example, if an overall 5 log (99.999%) Cryptosporidium reduction is required for a given system, and conventional filtration provides 3 log removal, then the remaining 2 log reduction must be achieved through another barrier such as primary disinfection.
| Treatment barrier | Cryptosporidium removal credit | Giardia removal credit |
|---|---|---|
| Conventional filtrationTable 6 footnote a | 3 logTable 6 footnote b | 3 logTable 6 footnote b |
| Direct filtrationTable 6 footnote a | 2.5 logTable 6 footnote b | 2.5 logTable 6 footnote b |
| Slow sand filtrationTable 6 footnote a | 3 logTable 6 footnote b | 3 logTable 6 footnote b |
| Diatomaceous earth filtrationTable 6 footnote a | 3 logTable 6 footnote b | 3 logTable 6 footnote b |
| Microfiltration and ultrafiltrationTable 6 footnote a | Demonstration and challenge testingTable 6 footnote c | Demonstration and challenge testingTable 6 footnote c |
| Nanofiltration and reverse osmosisTable 6 footnote a | Demonstration and challenge testingTable 6 footnote c,Table 6 footnote d | Demonstration and challenge testingTable 6 footnote c,Table 6 footnote d |
| Riverbank filtration | Site-specific determinationTable 6 footnote e | Site-specific determinationTable 6 footnote e |
Table 6 footnotes
- Table 6 footnote a
-
Credits are awarded when in compliance with the individual filter effluent turbidity specified in the Guidelines for Canadian Drinking Water Quality (Health Canada, 2012d)
- Table 6 footnote b
-
Values from Health Canada, 2012d.
- Table 6 footnote c
-
Removal efficiency demonstrated through challenge testing and verified by direct integrity testing.
- Table 6 footnote d
-
NF/RO membranes do not currently come equipped with direct integrity testing capability – acceptable verification methods should be approved by the jurisdiction having authority.
- Table 6 footnote e
-
As required by the jurisdiction having authority.
7.1.3 Inactivation
Primary disinfection should provide any remaining log reduction credits necessary to meet treatment goals. Primary disinfection is required to protect public health by killing or inactivating harmful protozoa, bacteria and viruses whereas secondary disinfection is used to maintain a residual in the distribution system. It is important that operators understand and maintain required CT/IT values for primary disinfection (see sections 7.1.3.1 and 7.1.3.2), in addition to chlorine residual requirements for secondary disinfection.
Primary disinfection is typically applied after treatment processes that remove particles and NOM. This strategy helps to ensure efficient inactivation of pathogens and minimizes the formation of disinfection by-products (DBPs). It is important to note that when describing microbial disinfection of drinking water, the term “inactivation” is used to indicate that the pathogen is non-infectious and unable to replicate in a suitable host, although it may still be present.
Five disinfectants are commonly used in drinking water treatment: free chlorine, monochloramine, ozone, chlorine dioxide and UV light. All are chemical oxidants except UV light, which uses electromagnetic radiation. Chemical disinfectants inactivate microorganisms by destroying or damaging cellular structures, metabolism, biosynthesis and growth, whereas UV light damages pathogens’ nucleic acid, which prevents their replication such that they are unable to complete cycles of infection.
Free chlorine is the most common chemical used for primary disinfection because it is widely available, is relatively inexpensive and provides a residual that can also be used for secondary disinfection to maintain water quality in the distribution system. Free chlorine, however, requires relatively high concentrations and/or contact times to inactivate Giardia, and it cannot inactivate Cryptosporidium at the doses and contact times commonly used in water treatment (Korich et al., 1990). As a result, treatment systems that use free chlorine for primary disinfection must remove or inactivate Cryptosporidium using an additional treatment barrier (e.g., filtration or alternate disinfectant such as ozone or UV light). The use of monochloramine tends to be restricted to secondary disinfection (i.e., residual maintenance) due to low oxidation potential. Ozone and chlorine dioxide are effective disinfectants against Giardia and Cryptosporidium, although they are typically more expensive and complicated to implement, particularly for small systems. As ozone decays rapidly after being applied, it does not provide a residual and cannot be used for secondary disinfection. Chlorine dioxide is also not recommended for secondary disinfection because of its relatively rapid decay (Health Canada, 2008a). Clancy et al. (1998, 2002) demonstrated that UV disinfection is highly effective for inactivating Giardia and multiple strains of Cryptosporidium parvum. Johnson et al. (2005) confirmed that Cryptosporidium hominis is also susceptible to UV disinfection.
7.1.3.1 Chemical disinfection
The efficacy of chemical disinfectants can be predicted based on knowledge of the residual concentration of a specific disinfectant and factors that influence its performance, mainly temperature, pH, contact time and the level of disinfection required (AWWA, 1991). This relationship is commonly referred to as the CT concept, where CT is the product of “C” (the residual concentration of disinfectant, measured in mg/L) and “T” (the disinfectant contact time, measured in minutes) for a specific microorganism under defined conditions (e.g., temperature and pH). To account for disinfectant decay, the residual concentration is usually determined at the exit of the contact chamber rather than using the applied dose or initial concentration. Also, the contact time T is often calculated using a T10 value, which is defined as the detention time at which 90% of the water meets or exceeds the required contact time. The T10 value can be estimated by multiplying the theoretical hydraulic detention time (i.e., tank volume divided by flow rate) by the baffling factor of the contact chamber. The U.S. EPA (1991) provides baffling factors for sample contact chambers. Alternatively, a hydraulic tracer test can be conducted to determine the actual contact time under plant flow conditions. The T value is dependent on the hydraulics related to the construction of the treatment installation. Improving the hydraulics (i.e., increasing the baffling factor) is more effective to achieve CT requirements than increasing the disinfection dose and can be achieved through physical modifications such as the addition of baffles to the contact chamber or basin.
CT tables for the inactivation of Giardia can be found in U.S. EPA (1991) while CT tables for the inactivation of Cryptosporidium can be found in U.S. EPA (2006a). Selected CT values are presented in Table 7 for 2 log (99%) inactivation of Giardia and Cryptosporidium using chlorine, monochloramine, chlorine dioxide and ozone. The CT values confirm that monochloramine has limited oxidation potential, as much higher concentrations and/or contact times are required to achieve the same degree of Giardia inactivation. Consequently, it is not recommended as a primary disinfectant for protozoa. The CT values also demonstrate that Cryptosporidium is many times more resistant than Giardia to chemical disinfectants, particularly at cold temperatures (Oppenheimer et al., 2000). In general, CT requirements for both Giardia and Cryptosporidium increase two- to three-fold for every 10°C drop in temperature (Hoff, 1986; U.S. EPA, 1991). When water temperatures are close to 0°C, as is often the case in winter in Canada, the efficacy of disinfection is reduced, and an increased disinfectant concentration and/or contact time is required to achieve the same level of inactivation. Thus, it is important to confirm that inactivation requirements can be achieved for minimum temperature conditions.
The effectiveness of some disinfectants is also dependent on pH. When using free chlorine, increasing the pH from 6 to 9 reduces the level of Giardia inactivation by a factor of 3 (U.S. EPA, 1991). On the other hand, pH has been shown to have little effect when using chlorine dioxide or ozone (U.S. EPA, 2006a).
| Temp. (°C) |
CT values | |||||||
|---|---|---|---|---|---|---|---|---|
| Free chlorine [pH 7.5, residual 1 mg/L] |
Monochloramine [pH 6–9] |
Chlorine dioxide | Ozone | |||||
| GiardiaTable 7 footnote a | Crypto-sporidium | GiardiaTable 7 footnote a | Crypto-sporidium | GiardiaTable 7 footnote a | Crypto-sporidiumTable 7 footnote b | GiardiaTable 7 footnote a | Crypto-sporidiumTable 7 footnote b | |
| 0.5 | 169 | -- | -- | -- | -- | -- | -- | -- |
| 1 | -- | -- | 2,535 | -- | 42 | 1,200 | 1.9 | 46 |
| 5 | 99 | -- | 1,470 | -- | 17 | 858 | 1.3 | 32 |
| 25 | 25 | 7,200Table 7 footnote c | 500 | 7,200Table 7 footnote c | 7.3 | 150 | 0.32 | 4.9 |
Table 7 footnotes
- Table 7 footnote a
-
U.S. EPA (1991)
- Table 7 footnote b
-
U.S. EPA (2006a)
- Table 7 footnote c
-
Korich et al. (1990)
Reducing turbidity is an important prerequisite in the inactivation of Giardia, Cryptosporidium and other microorganisms, as chemical disinfection may be inhibited by particles. Additionally, turbidity will consume disinfectant and reduce the effectiveness of chemical disinfection. LeChevallier et al. (1981) reported an eight-fold decrease in free chlorine disinfection efficiency when turbidity increased from 1 to 10 NTU. The effect of turbidity on treatment efficacy is further discussed in the guideline technical document on turbidity (Health Canada, 2012d).
It is important for operational conditions such as temperature, pH and turbidity to be considered when selecting a chemical disinfectant, as these can have a major impact on the inactivation of pathogens; temperature and pH can also influence chemical DBP formation.
Chemical disinfection can result in the formation of DBPs, some of which pose a health risk. The most commonly used disinfectant, chlorine, reacts with NOM to form trihalomethanes (THMs) and haloacetic acids (HAAs), along with other halogenated organic compounds (Rook, 1976; Krasner et al., 2006). N-nitrosodimethylamine (NDMA) may also be formed for systems that use monochloramine and, to a lesser extent, free chlorine. For systems that use commercially available or on-site generated hypochlorite solutions, bromate may be formed (Health Canada, 2016). The use of chlorine dioxide and ozone can also result in the formation of inorganic DBPs, such as chlorite/chlorate and bromate, respectively. When selecting a chemical disinfectant, the potential impact of DBPs should be considered, but it is essential that efforts made to minimize DBP formation not compromise the effectiveness of disinfection. More information can be obtained from the appropriate guideline technical documents (Health Canada, 2006, 2008a, 2008b, 2011b, 2016).
7.1.3.2 Ultraviolet disinfection
For UV disinfection, the product of light intensity “I” (measured in mW/cm2 or W/m2) and time “T” (measured in seconds) results in a computed dose (fluence) in mJ/cm2 for a specific microorganism. This relationship is referred to as the IT concept. UV disinfection can be achieved using low pressure (LP) lamps, which emit UV light at essentially a single (monochromatic) wavelength (~254 nm), or medium pressure (MP) lamps, which emit radiation across a broader (polychromatic) spectrum. Ultraviolet light-emitting diodes (UV-LEDs) are an emerging technology for UV water treatment (Wright et al., 2012). However, in a review of published studies on the application of UV-LEDs, Song et al. (2016) concluded that a standard method for the UV-dose determination of UV-LEDs is needed to reduce the inconsistent and incomparable dose-response data currently available in the literature.
Studies have shown that relatively low UV doses can achieve substantial inactivation of protozoa (Clancy et al., 1998; Bukhari et al., 1999; Craik et al., 2000, 2001; Belosevic et al., 2001; Drescher et al., 2001; Linden et al., 2001, 2002; Shin et al., 2001; Campbell and Wallis, 2002; Mofidi et al., 2002; Rochelle et al., 2002). Based on these and other studies, the U.S. EPA developed UV dose requirements for Giardia lamblia and Cryptosporidium, as outlined in Table 8 (U.S. EPA, 2006a). However, when selecting an appropriate dose, the repair of UV-induced damage by Giardia lamblia should be considered as discussed below. Minimum temperature conditions should also be considered as low temperature can reduce light intensity “I” and affect alarm setpoints. The system should be appropriately designed for these conditions otherwise an increase in “T” may be necessary during minimum temperature conditions (Oosterveld, 2017). In addition, the accumulation of materials on the quartz sleeves (i.e., fouling) can interfere with the disinfection process by absorbing radiation that would otherwise be used to inactivate pathogens (Wait et al., 2005, 2007;Wait and Blatchley, 2010). Iron and calcium tend to comprise the bulk of the foulant material, although aluminum, manganese and zinc may also contribute (Wait and Blatchley, 2010). Wait et al. (2005) found that fouling potential cannot be predicted on the basis of mineral content alone, as the redox potential significantly influences the fouling process. In particular, minimal fouling was reported for untreated groundwaters with elevated iron and moderate to high calcium concentrations (iron = 0.9 to 6.1 mg/L; calcium = 91 to 236 mg/L) whereas following chlorination, foulant accumulation increased ten-fold and irradiance was reduced to 0% within three days (Wait et al., 2005, 2007). Talbot et al. (2011) reported significant fouling of a raw surface water supply using unwiped MP UV lamp sleeves when iron and manganese concentrations were approximately 200 µg/L and 40 µg/L, respectively, whereas unwiped LP lamp sleeves experienced no significant fouling. Wait et al. (2005, 2007) recommend that UV reactors be placed prior to oxidation steps to minimize fouling or after precipitated particulates have been removed. Pilot testing may be required to assess fouling potential. Foulant material must be removed to maintain high UV reactor performance (Bolton and Cotton, 2008).
Several researchers have confirmed that repair of UV-induced damage is not a concern for Cryptosporidium parvum oocysts when irradiated by LP or MP lamps even at very low doses (1–3 mJ/cm2; Shin et al., 2001; Oguma et al., 2001; Zimmer et al., 2003; Rochelle et al., 2004). For Giardia lamblia cysts, researchers report no restoration of infectivity following exposure to LP UV doses of 16 and 40 mJ/cm2, but significant repair activity when exposed to a LP UV dose of 1 mJ/cm2 (Shin and Linden, 2015). However, no data exist for UV doses between 1 and 16 mJ/cm2 for Giardia cysts. In contrast, no repair was detected when Giardia lamblia cysts were exposed to a dose of 1 mJ/cm2 of MP UV irradiation (Shin et al., 2010). In addition, Li et al. (2008) reported that Giardia lamblia trophozoites may survive and potentially reactivate following exposure to LP UV doses up to 10 mJ/cm2; at LP UV doses of 20 and 40 mJ/cm2 the evidence of survival or reactivation was ambiguous and statistically inconclusive. Although this study was conducted with trophozoites instead of cysts, the implication of the study is that a minimum dose is needed to avoid repair of UV-induced damage to Giardia lamblia cysts. The U.S. EPA UV dose requirements were not based on the possibility of Giardia repair. However, dark repair likely occurred during the studies and therefore would have been inherently considered. More research is needed to confirm the exact dose at which Giardia can repair LP UV-induced damage (Linden, 2017). Until further research is conducted, the repair of UV-induced damage by Giardia lamblia should be considered and a dose >10 mJ/cm2, as reported by Li et al. (2008), is recommended for LP UV reactors. Several jurisdictions require a minimum UV dose of 40 mJ/cm2 on the basis that 4 log inactivation can be achieved for many harmful pathogens, including bacteria, viruses and (oo)cysts (ÖNORM, 2001, 2003; DVGW, 2006a, 2006b, 2006c; Ontario Ministry of Environment, 2006; Nova Scotia Environment, 2012). The jurisdiction having authority should be contacted to confirm dose requirements.
In practice, the UV dose delivered in full-scale treatment plants depends on a number of factors, including the hydraulic profile within the reactor, flow rate, the UV transmittance (UVT) of the water, UV intensity, lamp output, lamp placement, lamp aging, fouling and microbe inactivation kinetics (U.S. EPA, 2006c; Bolton and Cotton, 2008). Validation testing should be conducted to determine the operating conditions under which the reactor will deliver the UV dose. Several approaches to UV validation testing are available and are discussed in ÖNORM (2001, 2003), DVGW (2006a, 2006b 2006,c) and U.S. EPA (2006c). These approaches are based on biodosimetric testing to determine the log inactivation of specific challenge microorganisms for a specific reactor in combination with known fluence-response relationships. Continuous monitoring with regularly calibrated sensors should be conducted to verify that the unit remains within validated conditions and is delivering the required dose. Operational issues should also be considered to ensure performance is not compromised (e.g., start-up, failure shutdown, lamp fouling and cleaning, UV sensor maintenance) (U.S. EPA, 2006c).
| Log inactivation | UV dose (mJ/cm2) requirements for inactivation | |
|---|---|---|
| Cryptosporidium | Giardia lamblia | |
| 0.5 | 1.6 | 1.5 |
| 1 | 2.5 | 2.1 |
| 1.5 | 3.9 | 3.0 |
| 2 | 5.8 | 5.2 |
| 2.5 | 8.5 | 7.7 |
| 3 | 12 | 11 |
| 3.5 | 15 | 15 |
| 4 | 22 | 22 |
UV disinfection is usually applied after particle removal barriers, such as filtration, to minimize shielding of pathogens by suspended particles. Several studies have examined the effect of particles on UV disinfection efficacy, and most have concluded that the UV dose–response of microorganisms is not affected by variations in turbidity up to 10 NTU (Christensen and Linden, 2002; Oppenheimer et al., 2002; Batch et al., 2004; Mamane-Gravetz and Linden, 2004; Passantino et al., 2004; Amoah et al., 2005). In contrast, Mahmud et al. (2006) reported lower inactivation levels during sub-optimal coagulation (turbidity between 1 and 2 NTU), which was attributed to particle aggregation or clumping that allowed shielding of (oo)cysts. In addition, Templeton et al. (2007) found lower inactivation of bacteriophages during the filter-ripening and end-of-filter-run periods when turbidity was >0.3 NTU. Templeton et al. (2005) found that UV-absorbing organic particles (i.e., humic substances) shielded particle-associated bacteriophages from UV light, whereas inorganic kaolin clay particles did not; Templeton et al. (2005) therefore concluded that particle characteristics were more relevant than turbidity level. For groundwater supplies with elevated iron content, Templeton et al. (2006) found that iron oxide precipitate in air oxidized groundwater samples could interfere with UV disinfection. The extent of protection of (oo)cysts from UV light is more likely to depend on the particle type (e.g., size, structure, chemical composition), the number of large particles (e.g., 25 µm), the level of aggregation of the (oo)cysts with the particulate matter and the desired inactivation level (Caron et al, 2007; Hargy and Landry, 2007; Templeton et al., 2008; Kollu and Örmeci, 2012). As a result, utilities should strive to maintain optimum filtration conditions upstream of UV disinfection (Templeton et al., 2007).
Minimal disinfection by-product formation is expected from UV light (Hijnen et al., 2006; Bolton and Cotton, 2008). However, Wang et al. (2015) reported chlorate and bromate formation for advanced oxidation processes (AOPs) using UV/chlorine (UV >1000 mJ/cm2; free chlorine = 5 to 10 mg/L) and UV/hydrogen peroxide (data not shown). The literature also suggests nitrite formation from nitrate; however, Sharpless and Linden (2001) reported less than 0.1 mg/L nitrite-nitrogen formed with a nitrate-nitrogen concentration of 10 mg/L when dosed up to 400 mJ/cm2. The authors concluded that nitrite formation is unlikely to pose a health concern during UV disinfection using MP lamps. As with chemical disinfectants, the potential impact of DBPs should be considered when using UV. It is essential, however, that efforts made to minimize DBP formation not compromise the effectiveness of disinfection. More information can be obtained from the guideline technical documents on chlorite and chlorate and on bromate (Health Canada, 2008a, 2016).
7.1.3.3 Multi-disinfectant strategy
A multiple disinfectant strategy involving two or more primary disinfection steps (i.e., sequential combination of disinfectants) is effective for inactivating protozoa, along with other microorganisms, in drinking water. For example, the use of UV light and free chlorine are complementary disinfection processes that can inactivate protozoa, viruses and bacteria. As UV light is highly effective for inactivating protozoa (but less effective for viruses), and chlorine is highly effective for inactivating bacteria and viruses (but less effective for protozoa), the multi-disinfectant strategy allows for the use of lower doses of chlorine. Consequently, there is decreased formation of DBPs. In some treatment plants, ozone is applied for the removal of taste and odour compounds, followed by chlorine disinfection. During this period, both ozone and chlorine disinfection may potentially be credited towards meeting the overall treatment goals, provided CT requirements are achieved (see section 7.1.3.1).
7.1.4 Distribution system
A well-maintained distribution system is a critical component of the multiple barrier approach to provide safe drinking water (Fisher et al., 2000). Howe et al. (2002) reported that oocysts remained detectable at low concentrations for up to 19 days after a cryptosporidiosis outbreak triggered the replacement of a contaminated source with an uncontaminated source. It was hypothesized that the slow decline in oocyst concentrations after the change in water source was due to oocysts being released from the biofilm on the surface of distribution system pipes. No additional cases of infection, however, were reported from this exposure. Warnecke (2006) confirmed that distribution system pipes are capable of accumulating and releasing oocysts over an extended period of time. Cross connections and backflow issues have also been linked to outbreaks (see section 5.3.2 and Appendix B).
As the potential exists for oocysts to become attached to pipe biofilms, accumulate in the distribution system and subsequently detach, source water protection measures, treatment optimization, maintaining the physical/hydraulic integrity of the distribution system and minimizing negative- or low-pressure events are key to limiting the entry of (oo)cysts into the distribution system (Karim et al., 2003; Friedman et al., 2004; Fleming et al., 2006; Angles et al., 2007).
Distribution system water quality should be regularly monitored (e.g., microbial indicators, chlorine residual, turbidity, pH), operations/maintenance programs should be in place (e.g., watermain cleaning, cross-connection control, asset management) and strict hygiene should be practiced during watermain repairs to ensure drinking water is transported to the consumer with minimum loss of quality (Kirmeyer et al., 2001, 2014). AWWA (2015) encourages the use of online chlorine residual monitoring in the distribution system.
7.2 Residential scale
Municipal treatment of drinking water is designed to reduce the presence of disease-causing organisms and associated health risks to an acceptable or safe level. As a result, the use of residential-scale treatment devices on municipally treated water is generally not necessary, but is based primarily on individual choice. In cases where an individual household or semi-public system obtains its drinking water from a private supply, the microbiological quality of the source should be determined and the vulnerability of the source to contamination should be assessed. Surface water is not recommended as a private or semi-public water supply unless it is properly filtered and disinfected and monitored for water quality. Well water supplies can also be contaminated and may require treatment. Numerous outbreaks have been linked to the consumption of untreated well water contaminated with enteric protozoa (Wallender et al., 2014).
When drinking water is obtained from a private well, the vulnerability of the source to faecal contamination should be assessed. Although it is difficult for well owners to conduct a detailed assessment of the vulnerability of the well to faecal contamination, steps can be taken to minimize the likelihood of a well becoming contaminated. General guidance on well construction, maintenance, protection and testing is typically available from provincial/territorial jurisdictions. Well owners should have an understanding of the well construction, type of aquifer material surrounding the well and location of the well in relation to sources of faecal contamination (i.e., septic systems, sanitary sewers, animal waste, etc.). This information can be obtained from records provided to the well owner during well and septic system construction, as well as well log databases, aquifer vulnerability maps, and regional groundwater assessments that are generally available from provincial/ territorial jurisdictions. If insufficient information is available to determine if a well is vulnerable to faecal contamination, treatment of the well is a way to reduce risk.
Health Canada does not recommend specific brands of drinking water treatment devices, but it strongly recommends that consumers use devices that have been certified by an accredited certification body as meeting the appropriate NSF/ANSI drinking water treatment unit standards. These standards have been designed to safeguard drinking water by helping to ensure the material safety and performance of products that come into contact with drinking water. Certification organizations provide assurance that a product or service conforms to applicable standards. In Canada, the following organizations have been accredited by the Standards Council of Canada (SCC) to certify drinking water devices and materials as meeting the appropriate NSF/ANSI standards (SCC, 2016):
- Canadian Standards Association International (www.csa-international.org);
- NSF International (www.nsf.org);
- Water Quality Association (www.wqa.org);
- Underwriters Laboratories Inc. (www.ul.com);
- Bureau de Normalisation du Québec (www.bnq.qc.ca); and
- International Association of Plumbing & Mechanical Officials (www.iapmo.org).
An up-to-date list of accredited certification organizations can be obtained directly from the SCC (2016).
Private and semi-public supplies that use filtration can refer to several NSF/ANSI standards for the removal of enteric protozoa. These include NSF/ANSI: Standard 53 (Drinking Water Treatment Units – Health Effects) (NSF/ANSI, 2016a), Standard 58 (Reverse Osmosis Drinking Water Treatment Systems) (NSF/ANSI, 2016b) and Standard 62 (Drinking Water Distillation Systems) (NSF/ANSI, 2016c). These standards require 3 log removal or better in order to be certified to a cyst reduction claim. Reverse osmosis (RO) and distillation systems certified to these standards are intended for point-of-use (POU) installation only. This is because water treated by an RO or distillation system may be corrosive to internal plumbing components. These systems also require larger quantities of influent water to obtain the required volume of drinking water and are generally not practical for point-of-entry (POE) installation.
Currently, units certified to NSF/ANSI Standard 53 are generally not capable of achieving the larger capacity required for some semi-public systems (15–800 gpm). Thus, drinking water systems requiring larger capacity may consider two treatment options: ultrafiltration or cartridge filters.
Ultrafiltration units that are certified to NSF/ANSI Standard 419 (Public Drinking Water Equipment Performance – Filtration) (NSF/ANSI, 2015) can achieve greater than 3 log removal of Cryptosporidium. These ultrafiltration units may include direct integrity testing to confirm membranes remain intact for Cryptosporidium log reductions. As membrane integrity breaches can compromise protozoa removal capability, it is important that regular monitoring of membrane integrity be conducted. Previous certification under the U.S. EPA ETV program may be acceptable pending transition to NSF/ANSI Standard 419 certification provided the manufacturer can demonstrate that the product that was tested under this program has not changed.Water system owners should request the product-specific certification results when considering these systems, as well as establish performance criteria (e.g., protozoa log reduction) and treated water quality objectives to minimize fouling (e.g., organic carbon, colour, iron, manganese, alkalinity and hardness) and to ensure turbidity criteria are met. Pre-treatment may be necessary depending on the source’s water quality.
Cartridge filters that are certified to Standard NSF/ANSI 419 for Cryptosporidium removal (NSF/ANSI, 2015) can also be used for systems that require a larger capacity. Individual jurisdictions may also choose to approve cartridge filters that have been third-party challenge tested for Cryptosporidium removal (GLUMRB, 2012); however, they should also ensure that these filters are certified to NSF/ANSI Standard 61(NSF/ANSI, 2016d) for contact with potable water. Cartridge filters are accepted as an alternative technology for compliance with the filtration requirement of the U.S. Surface Water Treatment Rule (U.S. EPA, 1991, 2006a). Cartridge filters are disposable filters that are operated up to the maximum rated pressure differential (typically 30 psi) and then replaced. As a result, there is no direct integrity testing capability.
Private and semi-public supplies that use disinfection typically rely on chlorine or UV light because of their availability and relative ease of operation. It is important to note that inactivation of Giardia using free chlorine requires relatively high concentrations and/or contact times, and chlorination is not effective for the inactivation of Cryptosporidium. Treatment units meeting NSF/ANSI Standard 55 for Ultraviolet Disinfection Systems (Class A) are designed to inactivate microorganisms, including bacteria, viruses and (oo)cysts, from contaminated water (NSF/ANSI, 2016e); they are not designed to treat wastewater or water contaminated with raw sewage, and they should be installed in visually clear water. Class B systems are not intended for the disinfection of microbiologically unsafe water. Class B systems are only certified for supplemental bactericidal treatment of disinfected public drinking water or other drinking water that has been tested and deemed acceptable for human consumption by the jurisdiction having authority. Class B systems are designed to reduce normally occurring non-pathogenic nuisance microorganisms only. When applying UV light in systems with moderate or high levels of hardness or mineral content, such as groundwater, scaling or fouling of the UV lamp surface is a common problem and may require pre-treatment.
Private and semi-public supplies that use chlorine as part of a multi-disinfectant strategy (see section 7.1.3.3) should use products that are certified as meeting NSF/ANSI Standard 60 (Drinking Water Treatment Chemicals – Health Effects) (NSF/ANSI, 2017) and, for hypochlorite solutions, follow the handling and storage recommendations outlined in the guideline technical document on bromate (Health Canada, 2016).
Periodic testing for E. coli and total coliforms by an accredited laboratory should be conducted on both the water entering the treatment device and the treated water to verify that the treatment device is effective. Treatment devices lose their removal capacity through usage and time and need to be maintained and/or replaced. Consumers should verify the expected longevity of the components in their treatment device according to the manufacturer’s recommendations and establish a clearly defined maintenance schedule. Treatment devices should be inspected and serviced in accordance with the maintenance schedule and manufacturer’s recommendations.
8.0 Health effects
The health effects associated with exposure to Giardia and Cryptosporidium, like those associated with other pathogens, depend upon features of the host, pathogen and environment. The host's immune status, the (oo)cyst's infectivity and the degree of exposure (i.e., number of (oo)cysts consumed) are all key determinants of infection and illness. Infection with Giardia or Cryptosporidium can result in both acute and chronic health effects, which are discussed in the following sections.
8.1 Giardia
8.1.1 Infection
Theoretically, a single cyst is sufficient, at least under some circumstances, to cause infection. However, studies have shown that the ID50 (the dose required for infection to be observed in 50% of test subjects) is more than a single cyst and is dependent on the virulence of the particular strain. Human adult volunteer feeding trials suggest that the ID50 of Giardia is around 50 cysts (Hibler et al., 1987), although some individuals can become infected at a much lower dose (Rendtorff, 1978; Stachan and Kunstýr, 1983). The ID50 of Giardia in humans can also be extrapolated from dose–response curves. Based on this approach, the ID50 for Giardia in humans is around 35 cysts (Rose and Gerba, 1991), which is comparable to the ID50 reported above. Giardia strains that are well adapted to their hosts (e.g., by serial passage) can frequently infect with lower numbers of cysts (Hibler et al., 1987). For example, Rendtorff (1978) reported an ID50 of 19 cysts when using human-source cysts in volunteers.
The prepatent period (time between ingestion of cysts and excretion of new cysts) for giardiasis is 6–16 days (Rendtorff, 1978; Stachan and Kunstýr, 1983; Nash et al., 1987), although this can vary depending on the strain. Research with animal models has shown that smaller inocula result in longer prepatent periods but do not influence the resulting parasite burden (Belosevic and Faubert, 1983).
8.1.2 Pathogenesis and immune response
The specific mechanisms by which Giardia causes illness are not well understood, and no specific virulence factors have been identified. Some suggest that Giardia causes mechanical irritation or mucosal injury by attaching to the brush border of the intestinal tract. Others have proposed that Giardia attachment results in repopulation of the intestinal epithelium by relatively immature enterocytes with reduced absorptive capacities (leading to diarrhea).
The host–parasite relationship is complex, and Giardia has been shown to be versatile in the expression of antigens (Nash, 1994), so universal, lasting immunity is improbable. Humoral immune response is revealed by increased levels of circulating antibodies (immunoglobulin G [IgG] and immunoglobulin M [IgM]) and secretion of antibodies (immunoglobulin A [IgA]) in milk, saliva and possibly intestinal mucus. These antibodies may play a role in eliminating disease (Heyworth, 1988), but lasting immunity has not been demonstrated. Very little is known about cellular immunity, but spontaneous killing of trophozoites by human peripheral blood monocytes has been described (denHollander et al., 1988).
8.1.3 Symptoms and treatment
Typically, Giardia is non-invasive and results in asymptomatic infections. Based on U.S. data, 40% of individuals will develop symptomatic illness after infection with Giardia (Nash et al., 1987). Symptomatic giardiasis can result in nausea, anorexia, an uneasiness in the upper intestine, malaise and occasionally low-grade fever or chills. The onset of diarrhea is usually sudden and explosive, with pale, watery, greasy and foul-smelling stools (Wolfe, 1984; MSSS, 2015). The acute phase of the infection commonly resolves spontaneously, and organisms generally disappear from the faeces. Assemblage A has been associated with mild, intermittent diarrhea, whereas assemblage B has been linked to severe, acute or persistent diarrhea (Homan and Mank, 2001; Read et al., 2002). Giardia infection can also lead to lactase deficiency (i.e., lactose intolerance), general malabsorptive syndrome, and some recent research suggests that it could also lead to irritable bowel syndrome or chronic fatigue syndrome in some individuals (Cotton et al., 2011; Wensaas et al., 2012; Hanvik et al., 2014). Some patients become asymptomatic cyst passers for a period of time and have no further clinical manifestations. Other patients, particularly children, suffer recurring bouts of the disease, which may persist for months or years (Lengerich et al., 1994). In the United States, an estimated 4,600 persons per year are hospitalized for severe giardiasis, a rate similar to that of shigellosis (Lengerich et al., 1994). The median length of hospital stay is four days.
Giardiasis can be treated using a number of drugs, including metronidazole, quinacrine, furazolidone, tinidazole, ornidazole, nitazoxanide and nimorazole. Olson et al. (1994) showed that the potential for a vaccine exists, but infections and symptoms are only attenuated, and prevention of infection is not feasible at this time.
8.2 Cryptosporidium
8.2.1 Infection
Dose–response information for Cryptosporidium, using human volunteer feeding trials involving immunocompetent individuals, is available. As is the case for Giardia and other pathogens, a single organism can potentially cause infection, but studies have only demonstrated infection being caused by more than one organism (DuPont et al., 1995; Okhuysen et al., 1998, 2002; Chappell et al., 1999, 2006). Studies suggest that the ID50 of Cryptosporidium is somewhere between 9 and 2,066 oocysts (DuPont et al., 1995; Okhuysen et al., 1998, 1999, 2002; Chappell et al., 1999, 2006; Messner et al., 2001), indicating that Cryptosporidium isolates can differ significantly in their infectivity and ability to cause symptomatic illness. The TAMU isolate of C. parvum (originally isolated from a foal), for example, was shown to have an ID50 of 9 oocysts and an illness attack rate of 86%, compared with the UCP isolates of C. parvum (isolated from a calf), which had an ID50 of 1,042 oocysts and an illness attack rate of 59% (Okhuysen et al., 1999). In contrast, the Iowa and Moredun isolates of C. parvum had an ID50 of 132 and approximately 300 oocysts, respectively, whereas illness attack rates were similar (i.e., 55–65%) (DuPont et al., 1995; Okhuysen et al., 2002). Based on a meta-analysis of these feeding studies, the ID50s of the TAMU, UCP and Iowa isolates were estimated to be 12.1, 2,066 and 132 oocysts, respectively (Messner et al., 2001). The genetic basis for these differences is not known, although a number of virulence factors have been identified (Okhuysen and Chappell, 2002). In a separate meta-analysis using the TAMU, UCP and Iowa human study data, the probability of infection from ingesting a single infectious oocyst was estimated to range from 4% to 16% (U.S. EPA, 2006a). This estimate is supported by outbreak data, including observations made during the 1993 Milwaukee outbreak (Gupta and Haas, 2004). A recent re-analysis of available dose-response data suggests that Cryptosporidium may be more infectious than previously determined (Messner and Berger, 2016), however further investigation is needed.
The prepatent period for cryptosporidiosis is four to nine days (Ma et al., 1985; DuPont et al., 1995; Okhuysen et al., 1999, 2002), although this can vary depending on the isolate.
8.2.2 Pathogenesis and immune response
Infections of Cryptosporidium spp. in the human intestine are known to cause at least transient damage to the mucosa, including villous atrophy and lengthening of the crypt (Tzipori, 1983); however, the molecular mechanisms by which Cryptosporidium causes this damage are unknown. Several molecules are thought to mediate its mobility, attachment and invasion of host cells, including glycoproteins, lectins and other protein complexes, antigens and ligands (Okhuysen and Chappell, 2002; Tzipori and Ward, 2002). Most of the pathological data available have come from AIDS patients, and the presence of other opportunistic pathogens has made assessment of damage attributable to Cryptosporidium spp. difficult.
The primary mechanism of host defence appears to be cellular immunity (McDonald et al., 2000; Lean et al., 2002; Riggs, 2002), although humoral immunity is also known to be involved (Riggs, 2002; Okhuysen et al., 2004; Priest et al., 2006). Studies using animal models have demonstrated the importance of helper (CD4+) T cells, interferon gamma (IFN-γ) and interleukin 12 (IL-12) in recovery from cryptosporidiosis (Riggs, 2002). Antibody responses against certain glycoproteins involved in Cryptosporidium adhesion have been demonstrated (Riggs, 2002).
It is not clear whether prior exposure to Cryptosporidium provides protection against future infections or disease. Okhuysen et al. (1998) reported that initial exposure to Cryptosporidium was inadequate to protect against future bouts of cryptosporidiosis. Although the rates of diarrhea were similar after each of the exposures, the severity of diarrhea was lower after re-exposure. Chappell et al. (1999) reported that volunteers with pre-existing C. parvum antibodies (suggesting previous infection) exhibited a greater resistance to infection, as demonstrated by a significant increase in the ID50, compared with those who were antibody negative. However, in contrast to the earlier findings (Okhuysen et al., 1998), the severity of diarrhea (defined by the number of episodes and duration of the illness) was greater among the subjects presumed previously infected.
8.2.3 Symptoms and treatment
Individuals infected with Cryptosporidium are more likely to develop symptomatic illness than those infected with Giardia (Macler and Regli, 1993; Okhuysen et al., 1998, 1999). The most common symptom associated with cryptosporidiosis is diarrhea, characterized by very watery, non-bloody stools. The volume of diarrhea can be extreme, with 3 L/day being common in immunocompetent hosts and with reports of up to 17 L/day in immunocompromised patients (Navin and Juranek, 1984). This symptom can be accompanied by cramping, nausea, vomiting (particularly in children), low-grade fever (below 39°C), anorexia and dehydration. Extraintestinal cryptosporidiosis (i.e., in the lungs, middle ear, pancreas, etc.) and death have been reported, primarily among persons with AIDS (Farthing, 2000; Mercado et al., 2007), but are considered rare.
The duration of infection is dependent on the condition of the immune system (Juranek, 1995) and can be broken down into three categories: 1) immunocompetent individuals who clear the infection in 7–14 days, 2) AIDS patients or others with severely weakened immune systems (i.e., individuals with CD4 cell counts <180 cells/mm3) who in most reported cases never completely clear the infection (it may develop into an infection with long bouts of remission followed by mild symptoms) and 3) individuals who are immunosuppressed following chemotherapy, short-term depression or illness (e.g., chickenpox) or malnutrition. In cases where the immunosuppression is not AIDS related, the infection usually clears (no oocyst excretion, and symptoms disappear) within 10–15 days of the onset of symptoms. However, there have been reported cases involving children in which the infection has persisted for up to 30 days. The sensitivity of diagnosis of cryptosporidiosis by stool examination is low—so low that oocyst excreters may be counted as negative prematurely. The application of more sensitive and rapid diagnostic tools, such as immunochromatographical lateral-flow assays, will help to reduce the number of false negatives (Cacciò and Pozio, 2006). Immunocompetent individuals usually carry the infection for a maximum of 30 days. With the exception of AIDS cases, individuals may continue to pass oocysts for up to 24 days. In an outbreak in a daycare facility, children shed oocysts for up to 5 weeks (Stehr-Green et al., 1987). The reported rate of asymptomatic infection is believed to be low, but a report on an outbreak at a daycare facility in Philadelphia, Pennsylvania, concluded that up to 11% of the children were asymptomatic (Alpert et al., 1986), and Ungar (1994) discussed three separate studies in daycare centres where the asymptomatic infection rate ranged from 67% to 100%. It has been suggested that many of these asymptomatic cases were mild cases that were incorrectly diagnosed (Navin and Juranek, 1984).
Nitazoxanide is the only drug approved for treatment of cryptosporidiosis in children and adults (Fox and Saravolatz, 2005), although more than 200 drugs have been tested both in vitro and in vivo (Tzipori, 1983; O’Donoghue, 1995; Armson et al., 2003; Cacciò and Pozio, 2006). This can be explained, in part, by the fact that most inhibitors target biochemical pathways resident in the apicoplast (plastid-derived organelle) (Wiesner and Seeber, 2005), a structure that C. parvum (Abrahamsen et al., 2004) and C. hominis (Xu et al., 2004) lack. This has led to the requirement to find novel targets for drug development, including compounds that target energy metabolism and lipid synthesis. Finding new drug targets is very expensive, and so there is also ongoing work investigating whether currently approved drugs on the market have anti-Cryptosporidial properties (Ryan and Hijjawi, 2015).
The complete genome sequence of several species of Cryptosporidium are available (Ryan and Hijjawi, 2015), and it is being used to help identify virulence determinants and mechanisms of pathogenesis, thereby facilitating the development of antimicrobials (Umejiego et al., 2004), vaccines (Wyatt et al., 2005; Boulter-Bitzer et al., 2007) and immunotherapies (Crabb, 1998; Enriquez and Riggs, 1998; Schaefer et al., 2000; Takashima et al., 2003) against Cryptosporidium.
9.0 Risk assessment
Quantitative microbial risk assessment (QMRA) is a process that uses mathematical modelling, source water quality data, treatment barrier information and pathogen-specific characteristics, to estimate the burden of disease associated with exposure to selected pathogenic organisms in a drinking water source. QMRA can be used in two ways. It can be used as part of a source-to-tap approach for management of a drinking water system, or, as is the case for this document, QMRA can be used to support the development of drinking water quality guidelines.
Further information and direction on how to use QMRA as part of a source-to-tap approach on a site-specific basis is published elsewhere (WHO, 2016; Health Canada, 2018). This guideline technical document will focus solely on using QMRA for the development of a drinking water quality guideline for enteric protozoa.
9.1 Health-based targets
Health-based targets are the "goalposts" or "benchmarks" that have to be met to ensure the safety of drinking water. In Canada, microbiological hazards are commonly addressed by two forms of targets: water quality targets and health-based treatment goals. An example of a water quality target is the bacteriological guideline for E. coli, which sets a maximum acceptable concentration of this organism in drinking water (Health Canada, 2012b). Health-based treatment goals specify a pathogen reduction that needs to be achieved by measures such as treatment processes (see section 7.0). Treatment goals assist in the selection of treatment barriers and should be defined in relation to source water quality (see section 9.3.2). The wide array of microbiological pathogens makes it impractical to measure all of the potential hazards; thus, treatment goals are generally framed in terms of categories of organisms (e.g., bacteria, viruses and protozoa) rather than individual pathogens. The health-based treatment goal for Giardia and Cryptosporidium is a minimum 3 log removal and/or inactivation of (oo)cysts. Surface waters may require a greater log removal and/or inactivation to maintain an acceptable level of risk.
9.2 Reference level or risk
The reference level of risk is the disease burden that is deemed tolerable or acceptable from exposure to drinking water. This value is used to set health-based treatment goals.
Risk levels have been expressed in several ways. The WHO Guidelines for Drinking-water Quality (WHO, 2011) use disability-adjusted life years (DALYs) as a unit of measure for risk. The basic principle of the DALY is to calculate a value that considers both the probability of experiencing an illness or injury and the impact of the associated health effects (Murray and Lopez, 1996a; Havelaar and Melse, 2003). The WHO (2011) guidelines adopt 10−6 DALY/person per year as a reference level of risk. The Australian National Guidelines for Water Recycling (NRMMC-EPHC, 2006) also cite this target. In contrast, other agencies set acceptable microbial risk levels based on the risk of infection and do not consider the probability or severity of associated health outcomes. For example, both the U.S. EPA and the Netherlands have used a health-based target of an annual risk of infection of less than 1/10,000 (10−4) persons (Regli et al., 1991; VROM, 2005).
The risk assessment in this guideline technical document estimates the disease burden in DALYs. There are several advantages to using this metric. DALYs take into account both the number of years lost due to mortality and the number of years lived with a disability (compared with the average healthy individual for the region) to determine the health impact associated with a single type of pathogenic organism. The use of DALYs also allows for comparison of health impacts between different pathogens and potentially between microbiological and some chemical hazards. Although no common health metric has been accepted internationally, DALYs have been used by numerous groups, and published, peer-reviewed information is available. The WHO (2011) reference level of 10−6 DALYs/person per year is used in this risk assessment as a tolerable level of risk.
9.3 Quantitative microbial risk assessment approach
The purpose of this document is to support the development of a health-based treatment goal for enteric protozoa in drinking water. QMRA is an important tool in developing such goals. It follows a common approach in risk assessment, which includes four components: hazard identification, exposure assessment, dose–response assessment and risk characterization. In this case, the risk is already characterized as a reference level of 1 × 10⁻⁶ DALYs/person per year. Thus, this risk assessment examines the treatment performance required to reduce enteric protozoa concentrations in source water to a level that will meet that health outcome, assuming a given source water quality, under set exposure conditions and specific dose-response information.
9.3.1 Hazard identification
The enteric protozoa of most concern as human health hazards in Canadian drinking water sources are Giardia and Cryptosporidium. Other enteric protozoa, such as Toxoplasma gondii, Cyclospora cayetanensis, Entamoeba histolytica, and Blastocystis hominis, may also be found; however, they are not the main enteric protozoa of concern (see Appendix A). Although all enteric protozoa that may impact human health are identified, risk assessments do not usually consider each individual enteric protozoan. Instead, the risk assessment includes only specific enteric protozoa whose characteristics make them a good representative of all similar pathogenic protozoa. It is assumed that if the reference protozoa are controlled, this would ensure control of all other similar protozoa of concern. Ideally, reference protozoa will represent a worst-case combination of high occurrence, high concentration and long survival time in source water, low removal and/or inactivation during treatment and a high pathogenicity for all age groups. Giardia and Cryptosporidium have been selected as the reference protozoa for this risk assessment. These organisms can cause serious illness in immunocompetent and immunocompromised individuals. Illness caused by Cryptosporidium is more serious because it is capable of causing death, particularly in immunocompromised individuals, and extraintestinal (e.g., lung, pancreas) damage can occur. However, both organisms have high prevalence rates, potential to cause widespread disease, resistance to chlorine disinfection and published dose–response models. It is assumed that if the disease burden from Giardia and Cryptosporidium is reduced to a tolerable level, the risk from other enteric protozoa will also be at a tolerable level.
9.3.2 Exposure assessment
Exposure is determined as the dose of pathogens ingested by a consumer per day. The principal route of exposure considered in this risk assessment is consumption of drinking water. To assess exposure, both the concentration of Giardia or Cryptosporidium in the drinking water and the volume of water ingested need to be known or estimated.
9.3.2.1 Source water concentration estimates
To inform the development of health-based treatment goals, the QMRA process was conducted in reverse. The QMRA process was used to answer the following question: Given a reference level of risk 1 × 10⁻⁶ DALYs/person per year, together with an average volume of water ingested (section 9.3.2.3) and the treatment reductions for the drinking water system (section 9.3.2.2), what are the associated concentrations of Giardia and Cryptosporidium in source water? This is then considered to represent average concentrations of these enteric protozoa in source water. It is also assumed that the concentrations are corrected for method recovery and all enteric protozoa detected are infectious to humans.
Average concentrations have been shown to be suitable for quantifying treatment targets for drinking water exposure (Petterson et al., 2015). When determining average source water concentrations, it is necessary to consider whether the presence of protozoa is continuous or intermittent, has seasonal patterns, and how rare events, such as droughts or floods, can impact levels. Short-term peaks in Giardia or Cryptosporidium concentrations may increase disease risks considerably and even trigger outbreaks of waterborne disease. Monitoring programs should be designed with these factors in mind in order to capture the variability that occurs in the water source (Dechesne and Soyeux, 2007). The MicroRisk project suggested that monthly sampling for one year should be conducted to establish baseline levels, and then at least two full events should be characterized to understand peak conditions (Medema et al., 2006). It should also be noted that for river sources with a high volume of wastewater treatment plant effluents, peak contamination events may occur during low flow conditions ((Deschesne and Soyeux, 2007). The U.S. EPA monitoring requirements for Cryptosporidium also require monthly sampling but for a period of two years (or more frequent sampling for one year), in order to establish a drinking water system's treatment requirements (U.S. EPA, 2006a). In addition to monitoring, uncertainty analysis should also be used as a means to help evaluate the estimated source water concentrations (Petterson et al., 2015). Further information on how to monitor or estimate pathogen concentrations in source water is provided in Health Canada (2018). Other factors that should be taken into consideration when determining source water concentrations, if available, are the recovery efficiencies of the Giardia and Cryptosporidium detection methods, which are much less than 100%, and whether the (oo)cysts found are of human health concern. As mentioned previously, recovery efficiencies should be determined routinely with (oo)cyst monitoring. However, most utilities will not have any indication of whether the (oo)cysts present are potentially a human health concern unless further analysis has been conducted (e.g., genotyping studies). In the absence of further analysis, all (oo)cysts should be considered potentially infectious to humans.
9.3.2.2 Treatment reductions
Different combinations of log reductions achieved through treatment processes and source water concentrations of Giardia and Cryptosporidium were examined in this risk assessment and compared to a defined risk endpoint. It is important to note that treatment can be impacted by numerous factors (see section 7.0). Any Giardia or Cryptosporidium (oo)cysts that were not removed or inactivated during treatment are assumed to still be capable of causing infection and illness.
9.3.2.3 Volume of water ingested
For the volume of water ingested, only the unboiled amount of tap water consumed is considered, as boiling the water inactivates pathogens and will overestimate exposure (Gale, 1996; Payment et al., 1997; WHO, 2011). In Canada, an average of approximately 1 L of unboiled tap water is consumed per person per day (Statistics Canada, 2004; Statistics Canada, 2008). Therefore, for estimating risk from pathogenic organisms, the risk assessment uses an average consumption of 1 L of water per person per day for determining exposure. This estimate is similar to consumption patterns in other developed nations (Westrell et al., 2006; Mons et al., 2007). WHO, in its Guidelines for Drinking-water Quality, also suggests using an estimate of 1 L for consumption of unboiled tap water (WHO, 2011). The treated drinking water concentration and the volume of water ingested can then be used to determine exposure, i.e. the dose of (oo)cysts being consumed per person per day.
9.3.3 Dose–response assessment
The dose–response assessment uses dose–response models to estimate the probability of infection (Pinfection) and the risk of illness after exposure to (oo)cysts. This dose-response relationship can also be used, as is done in this assessment, to estimate the concentration of Giardia or Cryptosporidium associated with a specified level of risk under defined conditions. The dose–response data for Giardia and Cryptosporidium are best explained by the exponential model (Haas et al., 1999):
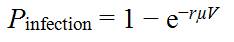
Text equivalent: Equation 1
The probability of infection at a certain estimated dose per day is calculated by subtracting from 1 the result of the following: the base of natural logarithm (e), raised to the exponent of the negative product of the fraction of ingested organisms that survive to initiate infection (r), number of organisms per litre in the ingested volume (µ) and the single volume of liquid ingested (V).
The exponential model mathematically describes the distribution of the individual probabilities of any one organism to survive and start infection, where V is the single volume of liquid ingested, µ is the number of organisms per litre in the ingested volume and r is the fraction of ingested organisms that survive to initiate infection. In this assessment, for Giardia, r = 0.0199 (Rose and Gerba, 1991), whereas for Cryptosporidium, r = 0.018 (Messner et al., 2001). The r parameter is derived from dose–response studies of healthy volunteers and may not adequately represent effects on sensitive subgroups, such as immunocompromised persons, young children or the elderly. Although the exponential model was chosen for this risk assessment, the Beta-Poisson dose–response model has also been used (Petterson et al., 2006; Schijven et al., 2011).
An individual’s daily dose of organisms is estimated using the information from the exposure assessment (see section 9.3.2). An individual’s yearly probability of infection is estimated using equation (2), below. For this risk assessment, it is assumed that there is no secondary spread of infection.
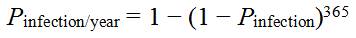
Text equivalent: Equation 2
The probability of infection per year is calculated by subtracting from 1 the result of the following: 1 minus the probability of infection (from equation 1), raised to the exponent of 365.
Not all infected individuals will develop a clinical illness. The risk of illness per year for an individual is estimated using equation (3):

Text equivalent: Equation 3
The risk of illness is calculated by multiplying the probability of infection per year (from equation 2) by the proportion of the population susceptible to infection (S) (0.70 for Cryptosporidium and 0.4 for Giardia) and by the proportion of individuals that develop symptomatic illness after infection (I) (1 for both Cryptosporidium and Giardia).
where:
- Pinfection/year
- = the probability of infection obtained from the exponential model
- S
- = the proportion of the population susceptible to infection
- I
- = the proportion of individuals who develop symptomatic illness after infection
The risk assessment is based on I values of 0.4 and 0.7 for Giardia (Nash et al., 1987) and Cryptosporidium (Okhuysen et al., 1998), respectively. S is assumed to be 1.
To translate the risk of illness per year for an individual to a disease burden per person, this assessment uses the DALY as a common unit of risk. The key advantage of the DALY as a measure of public health is cited as its aggregate nature, combining life years lost (LYL) with years lived with disability (YLD) to calculate the disease burden. DALYs can be calculated as follows:
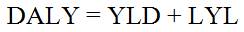
Text equivalent: Equation 4
The health burden of gastroenteritis resulting from infection with Cryptosporidium and Giardia in drinking water is calculated by multiplying the years lived with a disability by the years of life lost. The years lived with a disability is the sum of the outcome fraction multiplied by the duration and the severity weight for each health outcome contributing to morbidity. The years of life lost is calculated by subtracting the age at death from the life expectancy and then multiplying this result by the severity weight.
where:
- YLD
- = the sum of the [(outcome fraction) × (duration) × (severity weight)] for each health outcome contributing to morbidity
- LYL
- = [(life expectancy) − (age at death)] × severity weight
For Giardia and Cryptosporidium, the health effects vary in severity from mild diarrhea to more severe diarrhea and potentially death. It is important to note that, as no published mortality information is available for Giardia, this risk assessment assumes that the risk of death is the same as that for Cryptosporidium. The disease burden of gastroenteritis resulting from infection with Giardia and Cryptosporidium in drinking water is 1.67 DALYs/1,000 cases (1.67 × 10⁻³ DALY/case) (Table 9).
| DALY | Health outcome | Outcome fractionTable 9 footnote a | Duration of illnessTable 9 footnote b | Severity weightTable 9 footnote c | DALYs/case |
|---|---|---|---|---|---|
| Morbidity (YLD) | Mild diarrhea | 0.99999 | 0.01918 year (7 days) | 0.067 | 1.29 × 10⁻³ |
| Mortality (LYL) | Death | 0.00001 | Life expectancyTable 9 footnote d; age at deathTable 9 footnote e | 1 | 3.90 × 10⁻⁴ |
| Disease burden | 1.67 × 10⁻³ | ||||
Table 9 footnotes
- Table 9 footnote a
-
Macler and Regli (1993).
- Table 9 footnote b
-
Havelaar and Melse (2003).
- Table 9 footnote c
-
Murray and Lopez (1996b).
- Table 9 footnote d
-
Life expectancy for Canadian population = 80.88 years (Statistics Canada, 2012).
- Table 9 footnote e
-
Age at death is the mean weighted age of the population (assuming no difference in fatality rates between ages) = 38.98.
Using this disease burden (DALYs/case) and the risk of illness per year in an individual, the disease burden in DALYs/person per year can be estimated as follows:

Text equivalent: Equation 5
The burden of disease in disability adjusted life years per person per year is calculated by multiplying the risk of illness (from equation 3) by the health burden of gastroenteritis resulting from infection with Cryptosporidium and Giardia in drinking water in disability adjusted life years per case (1.67 × 10⁻³).
where:
- Risk of illness = the value calculated from equation (3)
- Disease burden (DALYs/case) = 1.67 × 10⁻³
As mentioned previously, since the disease burden was set to equal the reference level of risk, the DALY calculations are used to translate the reference level of risk into values for the dose-response models for Giardia and Cryptosporidium.
9.3.4 Risk characterization
In this risk assessment, the risk characterization step is used to determine a minimum health-based treatment goal to meet the reference level of risk.
As illustrated in figures 1 and 2, as the source water concentration of (oo)cysts increases, a greater log reduction is needed to continue to meet the reference level of risk. For example, when source waters have a Giardia concentration of 21 cysts/100 L and the treatment plant consistently achieves at least a 3 log reduction in cyst concentration, the burden of disease in the population would meet the reference level of 10−6 DALYs/person per year (less than 1 case/1,000 people per year). Similarly, for Cryptosporidium, a concentration of 13 oocysts/100 L of water would require the treatment plant to consistently achieve at least a 3 log reduction in oocyst concentration in order to meet the reference level of risk. These source water (oo)cyst concentrations fall within the range of average (oo)cyst concentrations that would typically be found in Canadian source waters (see section 5.0). For comparison, a concentration of 2,500 cysts/100 L or 900 oocysts/100 L would require approximately a 5 log reduction to meet the acceptable health burden. Although most surface water sources in Canada do not have average concentrations that would require a 5 log reduction, some do have maximum concentrations at this level (see section 5.0). Although in most cases, the peak levels will not be sustained for a long period of time, it is still important for drinking water providers to consider these peak events in their site-specific assessments to fully understand the potential risks to their drinking water (Health Canada, 2018).
Based on the enteric protozoa data available for Canadian surface water sources, a health-based treatment goal of 3 log reduction of Giardia and Cryptosporidium is a minimum requirement. However, additional removal/inactivation may be needed to meet treatment goals. A site-specific assessment should be done to determine the level of (oo)cyst reduction needed for a given source water. Monitoring source waters for Giardia and Cryptosporidium will result in the highest-quality site-specific assessment. However, if measurements are not possible, information obtained from routine system assessments and information on other water quality parameters can be used to help estimate the risk and/or level of faecal contamination in the source water. This information can then be used to help determine if more than the minimum level of treatment is required for enteric protozoa.
It is also important to understand the log reductions that can be achieved by the treatment plant when it is running under optimal conditions, and the impact of short- and long-term treatment upsets on log reductions. Understanding and planning for the variations that occur in both source water quality and in the treatment plant creates a more robust system that can include safety margins. It is also important to take into consideration the level of uncertainty that is inherent in carrying out a QMRA, to ensure that the treatment in place is producing water of an acceptable quality. A sensitivity analysis using a QMRA model can also help identify critical control points and their limits. Further information on site-specific assessments and the use of QMRA as a tool in a source-to-tap approach can be found elsewhere (Health Canada, 2018).
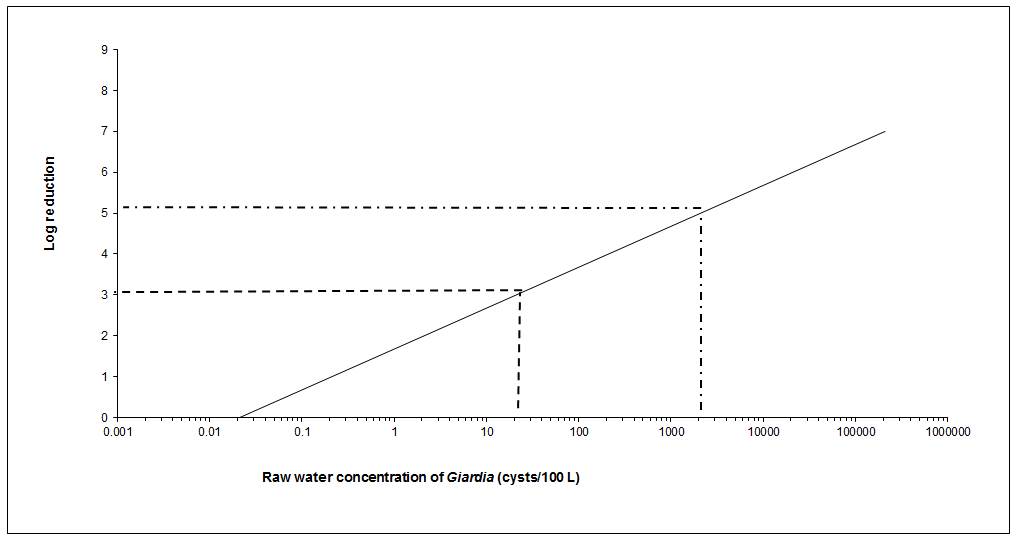
Text equivalent: Figure 1
The level of treatment required to meet an acceptable level of risk based on 1 L consumption for Giardia concentrations ranging from 21 cysts per 100 litres to 2100 cysts per 100 litres in raw water is presented graphically. The x-axis of the graph is the raw water concentrations of cysts per 100 litres using a log scale. The y-axis of the graph is the log removal using a linear scale. The relationship between the values on the x-axis and the values on the y-axis for the risk level of 10-6 DALY per person per year creates a diagonal line. Two examples of treatment requirements are illustrated on the graph using dotted lines. The first example draws a horizontal dotted line from the y-axis at 3 log removal. This dotted line intersects the diagonal line at 21 cysts per 100 litres of raw water. The second example draws a horizontal dotted line from the y-axis at 5 log removal. This dotted line intersects the diagonal line at 2100 cysts per 100 litres of raw water.
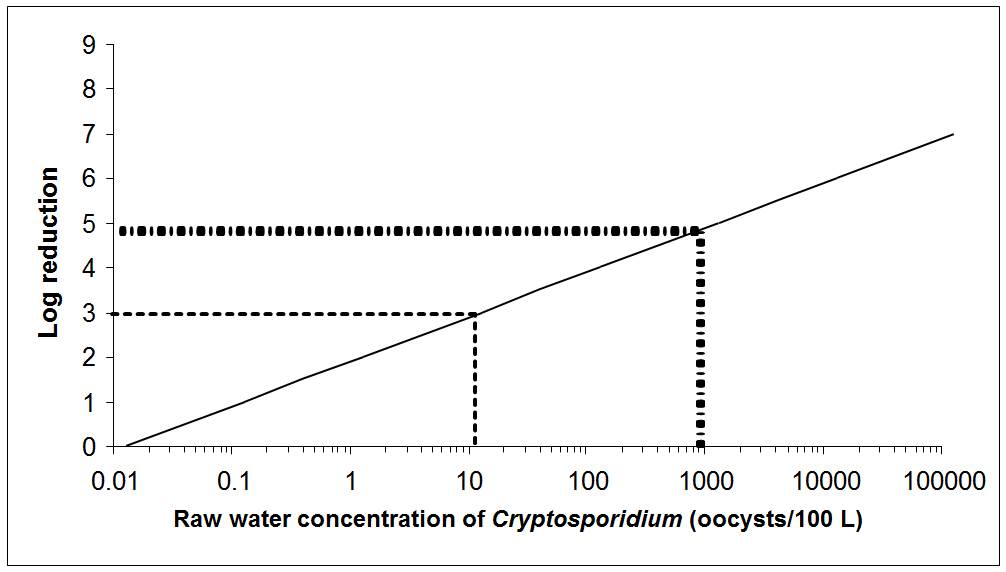
Text equivalent: Figure 2
The level of treatment required to meet an acceptable level of risk based on 1 L consumption for Cryptosporidium concentrations ranging from 13 oocysts per 100 litres to 900 oocysts per 100 litres in raw water is presented graphically. The x-axis of the graph is the raw water concentrations of oocysts per 100 litres using a log scale. The y-axis of the graph is the log removal using a linear scale. The relationship between the values on the x-axis and the values on the y-axis for the risk level of 10-6 DALY per person per year creates a diagonal line. Two examples of treatment requirements are illustrated on the graph using dotted lines. The first example draws a horizontal dotted line from the y-axis at 3 log removal. This dotted line intersects the diagonal line at 13 oocysts per 100 litres of raw water. The second example draws a horizontal dotted line from the y-axis at 5 log removal. This dotted line intersects the diagonal line at 900 oocysts per 100 litres of raw water.
9.4 International considerations
QMRA is increasingly being applied by international agencies and governments at all levels as the foundation for informed decision-making surrounding the health risks from pathogens in drinking water. WHO, the European Commission, the Netherlands, Australia and the United States have all made important advances in QMRA validation and methodology (Staatscourant, 2001; Medema et al., 2006; NRMMC-EPHC, 2006; U.S. EPA, 2006a,b; WHO, 2011). These agencies and governments have adopted approaches that use QMRA to inform the development of health targets (i.e., reference levels of risk or disease) and risk management (e.g., water safety plans, as described in WHO, 2011). Guidance documents on QMRA of drinking water have been published by the European Commission’s MicroRisk project (Medema et al., 2006), the U.S. EPA (2014), and the WHO (2016).
The Netherlands and the U.S. EPA provide two examples of QMRA-based regulatory approaches. In the Netherlands, consistent with the WHO approach, water suppliers must conduct a site-specific QMRA on all surface water supplies to determine whether the system can meet a specified level of risk. Dutch authorities can also require a QMRA of vulnerable groundwater supplies. In contrast, recent regulatory activity in the United States has seen the U.S. EPA assess the health risks from waterborne pathogens through QMRA and apply this information to set nationwide obligatory treatment performance requirements (U.S. EPA, 2006a,b). In general, drinking water systems must achieve a 3 log removal or inactivation of Giardia (U.S. EPA, 1989). To address risk from Cryptosporidium, drinking water systems must monitor their source water, calculate an average Cryptosporidium concentration and use those results to determine whether their source is vulnerable to contamination and requires additional treatment beyond a 2 log minimum. Water systems are classified into categories (“bins”) based on whether they are filtered or unfiltered systems; these bins specify additional removal or inactivation requirements for Cryptosporidium spp. (U.S. EPA, 2006a).
Health Canada and the Federal-Provincial-Territorial Committee on Drinking Water have chosen the same approach as WHO (2011), providing QMRA-based performance targets as minimum requirements. Site-specific QMRA is also recommended as a tool that can be used as part of a source-to-tap approach. A site-specific QMRA approach offers a number of advantages, including 1) the ability to compare the risk from representative groups of pathogens (e.g., viruses, protozoa, bacteria) in an overall assessment; 2) the transparency of assumptions; 3) the potential to account for variability and uncertainty in estimates; 4) the removal of hidden safety factors (these can be applied as a conscious choice by regulatory authorities at the end of the process, if desired); 5) the site-specific identification of critical control points and limits through sensitivity analysis; and 6) the clear implications of system management on a public health outcome. Further information on using QMRA for site-specific assessments is provided in Health Canada (2018).
10.0 Rationale
Giardia lamblia and numerous species and genotypes of Cryptosporidium are known to infect humans. These pathogens are excreted in the faeces of infected persons and animals and can be found in source water. Their occurrence in source water varies over time and can be significantly affected by extreme weather or spill/upset events (i.e., increases in (oo)cyst levels associated with these events). The best way to safeguard against the presence of hazardous levels of Giardia and Cryptosporidium in drinking water is based on the application of the source-to-tap approach, including source water protection and adequate treatment, as demonstrated using appropriate process monitoring, followed by the verification of the absence of indicator organisms in the treated water. The protection of public health is accomplished by setting health-based treatment goals. To set health-based treatment goals, a reference level of risk deemed tolerable or acceptable needs to be determined. The Federal-Provincial-Territorial Committee on Drinking Water has chosen a reference level of risk of 10−6 DALYs/person per year, which is consistent with the reference level adopted by WHO. This is a risk management decision that balances the estimated disease burden from Giardia and Cryptosporidium with the lack of information on the prevalence of these pathogens in source waters, limitations in disease surveillance and the variations in performance within different types of water treatment technologies.
In Canada, many surface water sources will have Giardia and Cryptosporidium concentrations in the range of 1 to 200 (oo)cysts/100 L of water. The QMRA approach used in this guideline technical document demonstrates that if a source water has a concentration of (oo)cysts at the lower end of this range—for example, 21 Giardia cysts/100 L and/or 13 Cryptosporidium oocysts/100 L—a water treatment plant would need to consistently achieve at least a 3 log reduction in (oo)cyst concentration in order to meet the reference level of 10−6 DALYs/person per year. Thus, where treatment is required for enteric protozoa, a minimum 3 log removal and/or inactivation of Giardia and Cryptosporidium has been established as a health-based treatment goal. Some surface waters in Canada may require more than the minimum treatment goal to meet the reference level of risk. Subsurface sources should be evaluated to determine whether the supply is vulnerable to contamination by enteric protozoa (i.e., GUDI). Subsurface sources determined to be GUDI should achieve a minimum 3 log removal and/or inactivation of Giardia and Cryptosporidium. Watersheds or aquifers that are used as sources of drinking water should be protected to the greatest extent possible by minimizing contamination from faecal waste.
11.0 References
- Abbaszadegan, M., Rauch-Williams, T., Johnson, W.P. and Hubbs, S.A. (2011). Methods to assess GWUDI and bank filtration performance. Water Research Foundation, Denver, Colorado.
- Aboytes, A., Di Giovanni, G.D., Abrams, F.A., Rheinecker, C., McElroy, W., Shaw, N. and LeChevallier, M.W. (2004). Detection of infectious Cryptosporidium in filtered drinking water. J. Am. Water Works Assoc., 96:88–98.
- Abrahamsen, M.S., Templeton, T.J., Enomoto, S., Abrahante, J.E., Zhu, G., Lancto, C.A., Deng, M., Liu, C., Widmer, G., Tzipori, S., Buck, G.A., Xu, P., Bankier, A.T., Dear, P.H., Konfortov, B.A., Spriggs, H.F., Iyer, L., Anantharaman, V., Aravind, L. and Kapur, V. (2004). Complete genome sequence of the apicomplexan, Cryptosporidium parvum. Science, 304(5669):441–445.
- Abudalo, R.A., Ryan, J.N., Harvey, R.W., Metge, D.W. and Landkamer, L. (2010). Influence of organic matter on the transport of Cryptosporidium parvum oocysts in a ferric oxyhydroxide-coated quartz sand saturated porous medium. Water Res., 44(4): 1104–1113.
- Adam, R.D. (1991). The biology of Giardia spp. Microbiol. Rev., 55:706–732.
- Adam, R.D. (2001). Biology of Giardia lamblia. Clin. Microbiol. Rev. 14(3):447–475.
- Adamska, M. (2015). Molecular characterization of Cryptosporidium and Giardia occurring in natural water bodies in Poland. Parasitol. Res. 114:687–692.
- Alexander, C., Jones, B., Inverarity, D. and Pollock, K.G.J. (2014). Genotyping of Giardia isolates in Scotland: a descriptive epidemiological study. Epidemiol. Infect., 142:1636–1639.
- Alonso, J.L., Amorós, I. and Guy, R.A. (2014). Quantification of viable Giardia cysts and Cryptosporidium oocysts in wastewater using propidium monoazide quantitative real-time PCR. Parasitol. Res., 113(7):2671–2678.
- Alpert, G.L., Bell, M., Kirkpatrick, C.E., Budinick, L.D., Campos, J.M., Friedman, H.M. and Plotkin, S.A. (1986). Outbreak of cryptosporidiosis in a day care center. Pediatrics, 77:152–157.
- Alspach, B., Delphos, P., Pressman, J., Beaty, J., Cooke, T., Voutchkov, N., Schaefer, J., Noack, R., Marascia, F. and Konstanski, D. (2014). Metrics and methods for MF/UF system optimization. In: Proceedings of the Membrane Technology Conference. American Water Works Association, Denver, CO.
- Amar, C.F., Dear, P.H., Pedraza-Díaz, S., Looker, N., Linnane, E. and McLauchlin, J. (2002). Sensitive PCR-restriction fragment length polymorphism assay for detection and genotyping of Giardia duodenalis in human feces. J. Clin. Microbiol., 40(2):446–452.
- Amburgey, J.E., Amirtharajah, A., Brouckaert, B.M. and Spivey, N.C. (2003). An enhanced backwashing technique for improved filter ripening. J. Am. Water Works Assoc., 95(12):81–94.
- Amburgey, J.E., Amirtharajah, A., York, M.T., Brouckaert, B.M., Spivey, N.C. and Arrowood, M.J. (2005). Comparison of conventional and biological filter performance for Cryptosporidium and microsphere removal. J. Am. Water Works Assoc., 97(12):77–91.
- Amoah, K., Craik, S., Smith, D.W. and Belosevic, M. (2005). Inactivation of Cryptosporidium oocysts and Giardia cysts by ultraviolet light in the presence of natural particulate matter. J. Water Supply Res. Technol. AQUA., 54(3):165–178.
- Andersson, T., Bjelkmar, P., Hulth, A., Lindh, J., Stenmark, S. and Widerström, M. (2014). Syndromic surveillance for local outbreak detection and awareness: evaluating outbreak signals of acute gastroenteritis in telephone triage, web-based queries and over-the-counter pharmacy sales. Epidemiol. Infect. 142 (2): 303–313.
- Angles, M.L., Chandy, J.P., Cox, P.T., Fisher, I.H. and Warnecke, M.R. (2007). Implications of biofilm-associated Cryptosporidium oocysts for the water industry. Trends Parasitol., 23(8):352–356.
- ANSI/AWWA. (2010). ANSI/AWWA B110-09 – Membrane systems. American Water Works Association, Denver, Colorado.
- APHA/AWWA/WEF (2012). Infectivity of Cryptosporidium in cell culture. In: Standard Methods for the Examination of Water and Wastewater 22nd Edition. American Public Health Association, American Water Works Association, Water Environment Federation, Washington, DC. 9711D.
- Aramini, J.J., Stephen, C., Dubey, J.P., Engelstoft, C., Schwantje, H. and Ribble, C.S. (1999). Potential contamination of drinking water with Toxoplasma gondii oocysts. Epidemiol. Infect., 122(2):305–315.
- Armson, A., Thompson, R.C. and Reynoldson, J.A. (2003). A review of chemotherapeutic approaches to the treatment of cryptosporidiosis. Expert Rev. Anti Infect. Ther., 1(2):297–305.
- Assavasilavasukul, P., Harrington, G.W., Lau., B.L.T., Hoffman, R.M. and Borchardt, M.A. (2008a). Effect of pathogen load on pathogen removal by conventional treatment. American Water Works Association Research Foundation and American Water Works Association. Denver, Colorado.
- Assavasilavasukul, P., Lau, B. L. T., Harrington, G.W., Hoffman, R.M. and Borchardt, M.A. (2008b). Effect of pathogen concentrations on removal of Cryptosporidium and Giardia by conventional drinking water treatment. Water Res., 42(10–11):2678–2690.
- ASTM (2010). Standard practice for integrity testing of water filtration membrane systems. Designation: D6908-06 (Reapproved 2010). ASTM International, West Conshohocken, PA.
- Atherholt, T.B., LeChevallier, M.W., Norton, W.D. and Rosen, J.S. (1998). Effect of rainfall on Giardia and Cryptosporidium. J. Am. Water Works Assoc., 90:66–80.
- AWWA (1988). Roundtable: Cryptosporidium. American Water Works Association. J. Am. Water Works Assoc., 80:14–28.
- AWWA (1991). Guidance manual for compliance with the filtration and disinfection requirements for public water systems using surface water sources. American Water Works Association, Denver, Colorado.
- AWWA (2005). Microfiltration and ultrafiltration membranes for drinking water: Manual of water supply practices – M53. 1st edition. American Water Works Association, Denver, Colorado.
- AWWA (2006). Waterborne pathogens: Manual of water supply practices – M48. 2nd edition. American Water Works Association, Denver, Colorado.
- AWWA (2011a). Water quality and treatment: a handbook of community water supplies. 6th edition. J.K. Edzwald (ed.). McGraw-Hill, New York, New York.
- AWWA (2011b). Operational control of coagulation and filtration processes: Manual of water supply practices – M37. 3rd edition. American Water Works Association, Denver, Colorado.
- AWWA (2015). Disinfection residual strategy panel memorandum: Panel findings. July 31, 2015. American Water Works Association, Denver, Colorado.
- Baldursson, S. and Karanis, P. (2011). Waterborne transmission of protozoan parasites: review of worldwide outbreaks – An update 2004–2010. Water Res. 45:6603–6614.
- Barbour, A.G., Nichols, C.R. and Fukushima, T. (1976). An outbreak of giardiasis in a group of campers. Am. J. Trop. Med. Hyg. 25(3):384–389.
- Barwick, R.S., Levy, D.A., Craun, G.F., Beach, M.J. and Calderon, R.L. (2000). Surveillance for waterborne-disease outbreaks: United States, 1997 – 1998. MMWR Morb. Wkly. Rep. 49: 1–21.
- Batch, L.F., Schulz, C.R. and Linden, K.G. (2004). Evaluating water quality effect on UV disinfection of MS2 coliphage. J. Am. Water Works Assoc., 96(7):75–87.
- BCCDC. (1996). Outbreak of cryptosporidiosis associated with municipal drinking water: Cranbrook, British Columbia, June. British Columbia Centre for Disease Control. B.C. Health Dis. Surveill., 5(10):93–103.
- Bell, T., Sibbald, C. and Booth, N.E. (1991). Giardiasis outbreak in Edinburgh. Environ. Health Scotland, 3: 6–7.
- Bellamy, W.D., Silverman, G.P., Hendricks, D.W. and Logsdon, G.S. (1985a). Removing Giardia cysts with slow sand filtration. J. Am. Water Works Assoc., 77(2):52–60.
- Bellamy, W.D., Hendricks, D.W. and Logsdon, G.S. (1985b). Slow Sand Filtration: Influences of selected process variables. J. Am. Water Works Assoc., 77(12):62–66.
- Belosevic, M. and Faubert, G.M. (1983). Giardia muris: correlation between oral dosage, course of infection, and trophozoite distribution in the mouse small intestine. Exp. Parasitol., 56:352–365.
- Belosevic, M., Faubert, G.M., Guy, R., MacLean, J.D., Law, C. and Croll, N.A. (1983). Giardia lamblia infections in Mongolian gerbils: an animal model. J. Infect. Dis., 147:222–226.
- Belosevic, M., Guy, R.A., Taghi-Kilani, R., Neumann, N.F., Gyurek, L.L., Liyanage, L.R., Millard, P.J. and Finch, G.R. (1997). Nucleic acid stains as indicators of Cryptosporidium parvum oocyst viability. Int. J. Parasitol., 27(7):787–798.
- Belosevic, M., Craik, S.A., Stafford, J.L., Neumann, N.F., Kruithof, J. and Smith, D.W. (2001). Studies on the resistance/reactivation of Giardia muris cysts and Cryptosporidium parvum oocysts exposed to medium-pressure ultraviolet radiation. FEMS Microbiol. Lett., 204(1):197–203.
- Bennett, J.W., Gauci, M.R., Le Moenic, S., Schaefer, F.W. III, and Lindquist, H.D. (1999). A comparison of enumeration techniques for Cryptosporidium parvum oocysts. J. Parasitol., 85(6):1165–1168.
- Berger, P. (2002). Removal of Cryptosporidium using bank filtration. In: Riverbank filtration: Understanding contaminant biogeochemistry and pathogen removal. C. Ray (ed.). Kluwer Academic Publishers, Dordrecht, The Netherlands. pp. 85–121.
- Berrilli, F., Di Cave, D., De Liberato, C., Franco, A., Scaramozzino, P. and Orecchia, P. (2004). Genotype characterisation of Giardia duodenalis isolates from domestic and farm animals by SSU-rRNA gene sequencing. Vet. Parasitol., 122(3):193–199.
- Bertrand, I., Gantzer, C., Chesnot, T. and Schwartzbrod, J. (2004). Improved specificity for Giardia lamblia cyst quantification in wastewater by development of a real-time PCR method. J. Microbiol. Meth., 57(1):41–53.
- Betancourt, W.Q. and Rose, J.B. (2004). Drinking water treatment processes for removal of Cryptosporidium and Giardia. Vet. Parasitol., 126(1–2):219–234.
- Bingham, A.K., Jarroll, E.L., Jr. and Meyer, E.A. (1979). Giardia sp.: physical factors of excystation in vitro, and excystation vs. eosin exclusion as determinants of viability. Exp. Parasitol., 47:284–291.
- Birkhead, G., Janoff, E.N., Vogt, R.L. and Smith, P.D. (1989). Elevated levels of immunoglobulin A to Giardia lamblia during a waterborne outbreak of gastroenteritis. J. Clin. Microbiol., 27(8):1707–1710.
- Bize, J., Grenet, B. and Maneglier, H. (1981). Le pouvoir épurateur du complexe alluvial en bordure de rivière. Techniq. Sci. Municip. L’eau, July:393–401.
- Black, E.K., Finch, G.R., Taghi-Kilani, R. and Belosevic, M. (1996). Comparison of assays for Cryptosporidium parvum oocysts viability after chemical disinfection. FEMS Microbiol. Lett., 135:187–189.
- Bolton, J.R. and Cotton, C.A. (2008). The ultraviolet disinfection handbook. American Water Works Association, Denver, Colorado.
- Boreham, P.F., Upcroft, J.A. and Upcroft, P. (1990). Changing approaches to the study of Giardia epidemiology: 1681–2000. Int. J. Parasitol., 20(4):479–487.
- Boulter-Bitzer, J.I., Lee, H. and Trevors, J.T. (2007). Molecular targets for detection and immunotherapy in Cryptosporidium parvum. Biotechnol. Adv., 25(1):13–44.
- Bouzid, M., Hunter, P.R., Chalmers, R.M. and Tyler, K.M. (2013). Cryptosporidium pathogenicity and virulence. Clin. Microbiol. Rev., 26(1):115–134.
- Bowie, W.R., King, A.S., Werker, D.H., Isaac-Renton, J.L., Bell, A., Eng, S.B. and Marion, S.A. (1997). Outbreak of toxoplasmosis associated with municipal drinking water. The B.C. Toxoplasma Investigation Team. Lancet, 350(9072):173–177.
- Bradford, S.A., Kim, H., Headd, B. and Torkzaban, S. (2016). Evaluating the transport of Bacillus subtilis spores as a potential surrogate for Cryptosporidium parvum oocysts. Environ. Sci. Technol., 50(3): 1295-1303.
- Brady, P. G., and Wolfe, J. C. (1974). Waterborne giardiasis. Ann. Intern. Med., 81: 498–499.
- Braeye, T., De Schrijver, K., Wollants, E., van Ranst, M. and Verhaegen, J. (2015). A large community outbreak of gastroenteritis associated with consumption of drinking water contaminated by river water, Belgium, 2010. Epi. Infect., 143(4):711–719.
- Brescia, C.C., Griffin, S.M., Ware, M.W., Varughese, E.A., Egorov, A.I. and Villegas, E.N. (2009). Cryptosporidium propidium monoazide-PCR, a molecular biology-based technique for genotyping of viable Cryptosporidium oocysts. Appl. Environ. Microbiol., 75(21):6856–6863.
- Brown, T.J. and Emelko, M.B. (2009). Chitosan and metal salt coagulant impacts on Cryptosporidium and microsphere removal by filtration. Water Res., 43(2):331–338.
- Brush, C.F., Walker, M.F. Anguish, L.J. and Ghiorse, W.C. (1998). Influence of pretreatment and experimental conditions on electrophoretic mobility and hydrophobicity of Cryptosporidium parvum oocysts. Appl. Environ. Microbiol., 64(11):4439–4445.
- Brush, C.F., Ghiorse, W.C., Anguish, L.J. Parlange, J-Y. and Grimes, H.G. (1999). Transport of Cryptosporidium parvum oocysts through saturated columns. J. Environ. Qual., 28(3):809–815.
- Bryck, J.M.G., Walker, B.L. and Hendricks, D.W. (1988). Removal of Giardia through slow sand filtration: 100 Mile House, British Columbia. In: Advances in Giardia Research, Ed. P.M. Wallis and B.R. Hammond, University of Calgary Press, Calgary, pp 87–93.
- Budu-Amoako, E., Greenwood, S.J., Dixon, B.R., Barkema, H.W. and McClure, J.T. (2012a). Giardia and Cryptosporidium on dairy farms and the role these farms may play in contaminating water sources in Prince Edward Island, Canada. J. Vet. Intern. Med., 26:668–673.
- Budu-Amoako, E., Greenwood, S.J., Dixon, B.R., Barkema, H.W. and McClure, J.T. (2012b). Occurrence of Cryptosporidium and Giardia on beef farms and water sources within the vicinity of the farms on Prince Edward Island, Canada. Vet. Parasitol. 184:1–9.
- Bukhari, Z., McCuin, R.M., Fricker, C.R. and Clancy, J.L. (1998). Immunomagnetic separation of Cryptosporidium parvum from source water samples of various turbidities. Appl. Environ. Microbiol., 64(11):4495–4499.
- Bukhari, Z., Hargy, T.M., Bolton, J.R., Dussert, B. and Clancy, J.L. (1999). Medium-pressure UV for oocyst inactivation. J. Am. Water Works Assoc., 91(3):86–94.
- Bukhari, Z., Marshall, M.M., Korich, D.G., Fricker, C.R., Smith, H.V., Rosen, J. and Clancy, J.L. (2000). Comparison of Cryptosporidium parvum viability and infectivity assays following ozone treatment of oocysts. Appl. Environ. Microbiol., 66(7):2972–2980.
- Burnet, J.B, Penny, C., Ogorzaly, L. and Cauchie, H.M. (2014). Spatial and temporal distribution of Cryptosporidium and Giardia in a drinking water resource: implications for monitoring and risk assessment. Sci. Total Environ., 472:1023–1036.
- Cacciò, S.M. and Pozio, E. (2006). Advances in the epidemiology, diagnosis and treatment of cryptosporidiosis. Expert Rev. Anti Infect. Ther., 4(3):429–443.
- Cacciò, S.M. and Ryan, U. (2008). Molecular epidemiology of giardiasis. Mol. Biochem. Parasitol., 160:75–80.
- Cacciò, S.M., De Giacomo, M. and Pozio, E. (2002). Sequence analysis of the beta-giardin gene and development of a polymerase chain reaction–restriction fragment length polymorphism assay to genotype Giardia duodenalis cysts from human faecal samples. Int. J. Parasitol., 32(8):1023–1030.
- Cacciò, S.M., Beck, R., Almeida, A., Bajer, A. and Pozio, E. (2010). Identification of Giardia species and Giardia duodenalis assemblages by sequence analysis or the 5.8S rDNA gene and internal transcribed spacers. Parasitology, 137:919–925.
- Campbell, A.T. and Wallis, P. (2002). The effect of UV irradiation on human-derived Giardia lamblia cysts. Water Res., 36(4):963–969.
- Campbell, A.T., Robertson, L.J. and Smith, H.V. (1992). Viability of Cryptosporidium parvum oocysts: correlation of in vitro excystation with inclusion or exclusion of fluorogenic vital dyes. Appl. Environ. Microbiol., 58:3488–3493.
- Campbell, A., Douglas, I., Emelko, M.B., McLellan, N. and Banihashemi, A. (2014). Evaluating pathogen log performance through pilot-plant challenge studies. Canadian National Conference on Drinking Water, Ottawa, Ontario.
- Cao, Y., Raith, M.R. and Griffith, J.F. (2015). Droplet digital PCR for simultaneous quantification of general and human-associated fecal indicators for water quality assessment. Water Res., 70:337–349.
- Caprioli, A., Gentile, G., Baldassari, L., Bisicchia, R., Romoli, E. and Donelli, G. (1989). Cryptosporidium as a common cause of childhood diarrhea in Italy. Epidemiol. Infect., 102:537–540.
- Caron, E., Chevrefils Jr., G., Barbeau, B., Payment, P and Prévost, M. (2007). Impact of microparticles on UV disinfection of indigenous aerobic spores. Water Res. 41(19):4546–4556.
- Carranza, P.G. and Lujan, H.D. (2010). New insights regarding the biology of Giardia lamblia. Microbes Infect., 12:71–80.
- Cavalier-Smith, T. (2003). Protist phylogeny and the high-level classification of protozoa. Europ. J. Protistol. 39: 338–348.
- CCME. (2004). From source to tap: guidance on the multi-barrier approach to safe drinking water. Canadian Council of Ministers of the Environment Winnipeg, Manitoba. Available at: www.ccme.ca/files/Resources/water/source_tap/mba_guidance_doc_e.pdf
- CDC (1975). Giardiasis in residents of Rome, New York, and in travelers to the Soviet Union. Morb. Mortal Wkly Rep., 24: 371.
- CDC (1977a). Giardiasis – California, Colorado. Morb. Mortal. Wkly. Rep., 26(7):60.
- CDC (1977b). Waterborne giardiasis outbreaks: Washington, New Hampshire. Morb. Mortal. Wkly. Rep., 26(21):169–175.
- CDC (1978). Giardiasis: Vail, Colorado. Morb. Mortal. Wkly. Rep., 27(19):155.
- CDC (1980). Waterborne giardiasis: California, Colorado, Oregon, Pennsylvania. Morb. Mortal. Wkly. Rep., 29(11):121–123.
- CDC (2004). Surveillance for waterborne-disease outbreaks associated with drinking water — United States, 2001–2002. United States Centers for Disease Control and Prevention MMWR Morb. Mortal. Wkly. Rep., 53(SS08):23–45. Available at: www.cdc.gov/mmwr/preview/mmwrhtml/ss5308a4.htm
- CDR (1996). Surveillance of waterborne disease and water quality: January to June 1996. CDR Wkly., 6(34):301-302.
- CDR (2001). Surveillance of waterborne disease and water quality: January to June 2001, and summary of 2000. CDR Wkly., 11(45).
- Chalmers, R.M. (2012) Waterborne outbreaks of cryptosporidiosis. Ann. 1st. Super Sanità, 48(4): 429-446.
- Chalmers, R.M., Elwin, K., Reilly, W.J., Irvine, H., Thomas, A.L. and Hunter, P.R. (2002). Cryptosporidium in farmed animals: the detection of a novel isolate in sheep. Int. J. Parasitol., 32:21–26.
- Chalmers, R.M., Robinson, G., Elwin, K., Hadfield, S., Thomas, E., Watkins, J., Casemore, D. and Kay, D. (2010). Detection of Cryptosporidium species and sources of contamination with Cryptosporidium hominis during a waterborne outbreak in northwest Wales. J. Water Health, 8(2): 311-325.
- Chappell, C.L., Okhuysen, P.C., Sterling, C.R., Wang, C., Jakubowski, W. and DuPont, H.L. (1999). Infectivity of Cryptosporidium parvum in healthy adults with pre-existing anti-C. parvum serum immunoglobulin G. Am. J. Trop. Med. Hyg., 60(1):157–164.
- Chappell, C.L., Okhuysen, P.C., Langer-Curry, R., Widmer, G., Akiyoshi, D.E., Tanriverdi, S. and Tzipori, S. (2006). Cryptosporidium hominis: experimental challenge of healthy adults. Am. J. Trop. Med. Hyg., 75(5):851–857.
- Chauret, C., Armstrong, N., Fisher, J., Sharma, R., Springthorpe, S. and Sattar, S. (1995). Correlating Cryptosporidium and Giardia with microbial indicators. J. Am. Water Works Assoc., 87(11):76–84.
- Chesnot, T. and Schwartzbrod, J. (2004). Quantitative and qualitative comparison of density-based purification methods for detection of Cryptosporidium oocysts in turbid environmental matrices. J. Microbiol. Methods, 58(3):375–386.
- Christensen, J. and Linden, K. (2002). New findings regarding the impacts of suspended particles on UV disinfection of drinking water. In: Proceedings of the Annual Conference of the American Water Works Association, New Orleans, LA, June 16–20. American Water Works Association, Denver, Colorado.
- Clancy, J.L., Hargy, T.M., Marshall, M.M. and Dyksen, J.E. (1998). UV light inactivation of Cryptosporidium oocysts. J. Am. Water Works Assoc., 90(9):92–102.
- Clancy, J. L., Hargy, T. M., Battigelli, D. A., Marshall, M. M., Korich, D. G. and Nicholson, W. L. (2002). Susceptibility of Multiple Strains of C. Parvum to UV Light. AWWA Research Foundation and American Water Works Association, Denver, Colorado.
- Coffey, B. M., Huck, P. M., Maurizio, D. D., Emelko, M. B., Douglas, I. P. and Van Den Oever, J. (1999). The effect of optimizing coagulation on the removal of Cryptosporidium parvum and Bacillus subtilis. In: Proceedings of the AWWA Water Quality Technology Conference. American Water Works Association, Denver, Colorado.
- Collins, M.R., Eighmy, T.T. and Malley, Jr., J.P. (1991). Evaluating Modifications to slow sand filters. J. Am. Water Works Assoc., 83(9):62–70.
- Conio, O., Chioetto, M. and Hargesheimer, E. (2002). Organic monitors. In: Online Monitoring for Drinking Water Utilities. E. Hargesheimer, O. Conio and J. Papovicova (eds.). Awwa Research Foundation, Denver, Colorado. pp. 163–202.
- Cotton, J.A., Beatty, J.K. and Buret, A.G. (2011). Host parasite interactions and pathophysiology in Giardia infections. Int. J. Parasitol., 41(9):925–933.
- Coulliette, A.D., Huffman, D.E., Slifko, T.R. and Rose, J.B. (2006). Cryptosporidium parvum: treatment effects and the rate of decline in oocyst infectivity. J. Parasitol., 92(1):58–62.
- Crabb, J.H. (1998). Antibody-based immunotherapy of cryptosporidiosis. Adv. Parasitol., 40:121–149.
- Craik, S.A., Finch, G.R., Bolton, J.R. and Belosevic, M. (2000). Inactivation of Giardia muris cysts using medium-pressure radiation in filtered drinking water. Water Res., 34(18):4325–4332.
- Craik, S.A., Weldon, D., Finch, G.R., Bolton, J.R. and Belosevic, M. (2001). Inactivation of Cryptosporidium parvum oocysts using medium- and low-pressure ultraviolet radiation. Water Res., 35(6):1387–1398.
- Craun, G.F. (1979). Waterborne outbreaks of giardiasis. In: Waterborne transmission of giardiasis. W. Jakubowski and J.C. Hoff (eds.). U.S. Environmental Protection Agency, Cincinnati, Ohio. pp. 127–149 (EPA 600/9-79-001).
- Craun, G.F. (1986). Waterborne giardiasis in the United States 1965–1984. Lancet, 328 (8505):513–514.
- Craun, G.F., Berger, P.S. and Calderon, R.L. (1997). Coliform bacteria and waterborne disease outbreaks. J. Am. Water Works Assoc., 89(3):96–104.
- Craun, G.F., Hubbs, S.A., Frost, F., Calderon, R.L. and Via, S.H. (1998). Waterborne outbreaks of cryptosporidiosis. J. Am. Water Works Assoc., 90:81–91.
- Craun, G.F., Brunkard, J.M., Yoder, J.S., Roberts, V.A., Carpenter, J., Wade, T., Calderon, R.L., Roberts, J.M., Beach, M.J. and Roy, S.L. (2010). Causes of outbreaks associated with drinking water in the United States from 1971 to 2006. Clin. Microbiol. Rev., 23(3):507–528.
- Crowe, A.S., Schaefer, K.A., Kohut, A., Shikaze, S.G. and Ptacek, C.J. (2003). Linking water science to policy: groundwater quality. Canadian Council of Ministers of the Environment, Winnipeg, Manitoba.
- Current, W. (1986). Cryptosporidiosis. J. Am. Vet. Med. Assoc., 187:1334–1338.
- Curriero, F.C., Patz, J.A., Rose, J.B. and Lele, S. (2001). The association between extreme precipitation and waterborne disease outbreaks in the United States, 1948-1994. Am. J. Public Health, 91(8): 1194-1199.
- Dai, X. and Hozalski, R.M. (2002). Effect of NOM and biofilm on the removal of Cryptosporidium parvum oocysts in rapid filters. Water Res., 36(14):3523–3532.
- Dalle, F., Roz, P., Dautin, G., Di-Palma, M., Kohli, E., Sire-Bidault, C., Fleischmann, M.G., Gallay,A., Carbonel, S., Bon, F., Tillier, C., Beaudeau, P. and Bonnin, A. (2003). Molecular characterization of isolates of waterborne Cryptosporidium spp. collected during an outbreak of gastroenteritis in South Burgundy, France. J. Clin. Microbiol., 41(6): 2690-2693.
- Davies, R.B. and Hibler, C.P. (1979). Animal reservoirs and cross-species transmission of Giardia. In: Waterborne transmission of giardiasis. W. Jakubowski and J.C. Hoff (eds.). U.S. Environmental Protection Agency, Cincinnati, Ohio. pp. 104–126 (EPA 600/9-79-001).
- Davies, C.M., Altavilla, N., Krogh, M., Ferguson, C.M., Deere, D.A. and Ashbolt, N.J. (2005). Environmental inactivation of Cryptosporidium oocysts in catchment soils. J. Appl. Microbiol., 98(2):308–317.
- Dechesne, M. and Soyeux, E. (2007). Assessment of source water pathogen contamination. J. Water Health, 5(Suppl. 1):39–50.
- Delaunay, A., Gargala, G., Li, X., Favennec, L. and Ballet, J.J. (2000). Quantitative flow cytometric evaluation of maximal Cryptosporidium parvum oocyst infectivity in a neonate mouse model. Appl. Environ. Microbiol., 66(10):4315–4317.
- DeLoyde, J.L., Anderson, W.B., Cleary, S.A., Ndiongue, S., LeCraw, R.A., Galan, M. and Huck, P.M. (2006). Removal of Cryptosporidium oocysts and Giardia cysts by pilot-scale multi-stage slow sand filtration. In: Recent progress in slow sand and alternative biofiltration processes. Gimbel, R., Graham, N.J.D. and Collins, M.R. (eds.). IWA Publishing, Cornwall, United Kingdom.
- Deng, M.Q., Cliver, D.O. and Mariam, T.W. (1997). Immunomagnetic capture PCR to detect viable Cryptosporidium parvum oocysts from environmental samples. Appl. Environ. Microbiol., 63(8):3134–3138.
- Deng, M.Q., Lam, K.M. and Cliver, D.O. (2000). Immunomagnetic separation of Cryptosporidium parvum oocysts using MACS MicroBeads and high gradient separation columns. J. Microbiol. Methods, 40(1):11–17.
- denHollander, N., Riley, D. and Befus, D. (1988). Immunology of giardiasis. Parasitol. Today, 4:124–131.
- deRegnier, D.P., Cole, L., Schupp, D.G. and Erlandsen, S.L. (1989). Viability of Giardia cysts suspended in lake, river, and tap water. Appl. Environ. Microbiol., 55:1223–1229.
- DeSilva, M.B., Schafer, S., Kendall Scott, M., Robinson, B., Hills, A., Buser, G.L., Salis, K., Gargano, J., Yoder, J., Hill, V., Xiao, L., Roellig, D. and Hedberg, K. (2016). Communitywide cryptosporidiosis outbreak associated with a surface water-supplied municipal water system – Baker City, Oregon, 2013. Epi. Infect., 144(2):274–284.
- Diamond, L.P., Harlow, D.R. and Cunnick, C.C. (1978). A new medium for the axenic cultivation of Entamoeba histolytica and other Entamoeba. Trans. R. Soc. Trop. Med. Hyg., 72:431–432.
- DiGiorgio, C.L., Gonzalez, D.A. and Huitt, C.C. (2002). Cryptosporidium and Giardia recoveries in natural waters by using Environmental Protection Agency Method 1623. Appl. Environ. Microbiol., 68(12):5952–5955.
- Di Giovanni, G.D., Hashemi, F.H., Shaw, N.J., Abrams, F.A., LeChevallier, M.W. and Abbaszadegan, M. (1999). Detection of infectious Cryptosporidium parvum oocysts in surface and filter backwash water samples by immunomagnetic separation and integrated cell culture–PCR. Appl. Environ. Microbiol., 65(8):3427–3432.
- Di Giovanni, G.D. and LeChevallier, M.W. (2005) Quantitative-PCR assessment of Cryptosporidium parvum cell culture infection. Appl. Environ. Microbiol., 71(3):1495-1500.
- Di Giovanni, G.D., Betancourt, W.Q., Hernandez, J., Assadian, N.W., Margez, J.P.F. and Lopez, E.J. (2006). Investigation of potential zooantroponotic transmission of cryptosporidiosis and giardiasis through agricultural use of reclaimed wastewater. Int. J. Environ. Health. Res. 16(6):405–418.
- Di Giovanni, G.D. Hoffman, R.M. and Sturbaum, G.D. (2014) Cryptosporidium genotyping workshop and round robin. Water Research Foundation, Denver, Colorado.
- Dillingham, R.A., Lima, A.A. and Guerrant, R.L. (2002). Cryptosporidiosis: epidemiology and impact. Microbes Infect., 4(10):1059–1066.
- Dorner, S.M., Anderson, W.B., Gaulin, T., Candon, H.L., Slawson, R.M., Payment, P. and Huck, P.M. (2007). Pathogen and indicator variability in a heavily impacted watershed. J. Water Health, 5(2):241–257.
- Douglas, I. (2009). Using quantitative microbial risk assessment (QMRA) to optimize drinking water treatment. In: Proceedings of the AWWA water quality technology conference & exposition, Seattle, WA, November 16–18, 2009. American Water Works Association, Denver, Colorado.
- Drayna, P., McLellan, S.L., Simpson, P., Li, S.H. and Gorelick, M.H. (2010). Association between rainfall and pediatric emergency department visits for acute gastrointestinal illness. Environ. Health Perspect., 118(10): 1439-1443.
- Drescher, A.C., Greene, D.M. and Gadgil, A.J. (2001). Cryptosporidium inactivation by low-pressure UV in a water disinfection device. J. Environ. Health, 64(3):31–35.
- D'Souza, N.M. and Mawson, A.J. (2005). Membrane cleaning in the dairy industry: A review. Crit. Rev. Food Sci. Nutr., 45(2): 125-134.
- Dubey, J.P. (1998). Toxoplasma gondii oocyst survival under defined temperatures. J. Parasitol., 84(4):862–865.
- Dugan, N.R., Fox, K.R., Owens, J.H. and Miltner, R.J. (2001). Controlling Cryptosporidium Oocysts using Conventional Treatment. J. Am. Water Works Assoc., 93(12):64–76.
- Dullemont, Y.J., Schijven, J.F., Hijnen, W.A.M., Colin, M., Magic-Knezev, A. and Oorthuizen, W.A. (2006). Removal of microorganisms by slow sand filtration. In: Recent progress in slow sand and alternative biofiltration processes. R. Gimbel, N.J.D. Graham and M.R. Collins (eds.). IWA Publishing, London, United Kingdom. pp. 12–20.
- DuPont, H.L., Chappell, C.L., Sterling, C.R., Okhuysen, P.C., Rose, J.B. and Jakubowski, W. (1995). The infectivity of Cryptosporidium parvum in healthy volunteers. N. Engl. J. Med., 332:855–859.
- DVGW (2006a). German national standard: DVWG W 294-1:2006: UV disinfection equipment for water supply systems – Part 1: Design and construction, function and operation. Deutscher Verein des Gas und Wasserfachs e.V., Bonn, Germany.
- DVGW (2006b). German national standard: DVWG W 294-2:2006: UV disinfection equipment for water supply systems – Part 2: Testing (construction, function and efficiency). Deutscher Verein des Gas und Wasserfachs e.V., Bonn, Germany.
- DVGW (2006c). German national standard: DVWG W 294-3:2006: UV disinfection equipment for water supply systems – Part 3: Measuring windows and sensors for monitoring UV disinfection equipment – Requirements, testing and calibration. Deutscher Verein des Gas und Wasserfachs e.V., Bonn, Germany.
- Eberhard, M.L., Ortega, Y.R., Hanes, D.E., Nace, E.K., Do, R.Q., Robl, M.G., Won, K.Y., Gavidia, C., Sass, N.L., Mansfield, K., Gozalo, A., Griffiths, J., Gilman, R., Sterling, C.R. and Arrowood, M.J. (2000). Attempts to establish experimental Cyclospora cayetanensis infection in laboratory animals. J. Parasitol., 86(3):577–582.
- Edge, T.A., Khan, I.U.H., Bouchard, R., Guo, J., Hill, S., Locas, A., Moore, L., Neumann, N., Nowak, E., Payment, P., Yang, R., Yerubandi, R. and Watson, S. (2013). Occurrence of waterborne pathogens and Escherichia coli at offshore drinking water intakes in Lake Ontario. Appl. Environ. Microbiol., 79(19):5799–5813.
- Edzwald, J.K. (2010). Dissolved air flotation and me. Water Res., 44(7):2077–2106.
- Edzwald, J.K. and Kelley, M.B. (1998). Control of Cryptosporidium: From reservoirs to clarifiers to filters. Water Sci. Technol., 37(2):1–8.
- Edzwald, J.K., Bottero, J.Y., Ives, K.J. and Klute, R. (1998). Particle alteration and particle production processes. In: Treatment process selection for particle removal. J.B. McEwen (ed.). AWWA Research Foundation and International Water Supply Association, Denver, Colorado. pp. 73–122.
- Edzwald, J.K., Tobiason, J.E., Parento, L.M., Kelley, M.B., Kaminski, G.S., Dunn, H.J. and Gallant, P.B. (1999). Clarification and filtration performance for removal of Giardia and Cryptosporidium. In: Proceedings of the AWWA water quality technology conference. American Water Works Association, Denver, Colorado.
- Edzwald, J.K., Tobiason, J.E., Parento, L.M., Kelley, M.B., Kaminski, G.S., Dunn, H.J. and Gallant, P.B. (2000). Giardia and Cryptosporidium removals by clarification and filtration under challenge conditions. J. Am. Water Works Assoc., 92(12):70–84.
- Edzwald, J.K., Tobiason, J.E., Udden, C.T., Kaminski, G.S., Dunn, H.J., Gallant, P.B. and Kelley, M.B. (2003). Evaluation of the effect of recycle of waste filter backwash water on plant removals of Cryptosporidium. J. Water Supply Res. Technol. AQUA, 52(4):243–258.
- Efstratiou, A., Ongerth, J.E. and Karanis, P. (2017). Waterborne transmission of protozoan parasites: review of worldwide outbreaks – an update 2011-2016. Water Res., 114: 14–22.
- Eligio-García, L., Cortes-Campos, A. and Jiménez-Cardoso, E. (2005). Genotype of Giardia intestinalis isolates from children and dogs and its relationship to host origin. Parasitol. Res., 97(1):1–6.
- Emelko, M.B. (2003). Removal of viable and inactivated Cryptosporidium by dual- and tri-media filtration. Water Res., 37(12):2998–3008.
- Emelko, M.B. and Huck, P.M. (2004). Microspheres as surrogates for Cryptosporidium filtration. J. Am. Water Works Assoc., 96(3): 94–105.
- Emelko, M.B., Huck, P.M. and Slawson, R.M. (1999). Design and operational strategies for optimizing Cryptosporidium removal by filters. In: Proceedings of the AWWA water quality technology conference. American Water Works Association, Denver, Colorado.
- Emelko, M.B., Huck, P.M. and Douglas, I.P. (2003a). Cryptosporidium and microsphere removal during late-in-cycle filtration. J. Am. Water Works Assoc., 95(5):173–182.
- Emelko, M.B., Watling, M.T. and Coté, M.M. (2003b). Laboratory and field strategies for assessing pathogen removal by riverbank filtration. In: Second international riverbank filtration conference program and abstracts. National Water Research Institute, Fountain Valley, CA.
- Emelko, M.B., Huck, P.M. and Coffey, B.M. (2005). A review of Cryptosporidium removal by granular media filtration. J. Am. Water Works Assoc., 95(12):101–115.
- Emelko, M.B., Schmidt,. P.J. and Roberson, J.A. (2008). Quantification of uncertainty in microbial data: reporting and regulatory implications. J. Am. Water Works Assoc., 100(3):94–104.
- Emelko, M.B., Schmidt, P.J. and Reilly P.M. (2010a). Particle and microorganism enumeration data: Enabling quantitative rigor and judicious interpretation. Environ. Sci. Technol., 44(5):1720–1727.
- Emelko, M.B., Tufenkji, N., Stone, M., Rudolph, D. and Marsalek, J. (2010b). Mitigation of urban stormwater and polluted river water impacts on water quality with riverbank filtration. In: Effects of urbanization on groundwater: An engineering case-based approach for sustainable development. N-B. Chang (ed.). ASCE Publications, Reston, VA. pp. 165–198.
- Enriquez, F.J. and Riggs, M.W. (1998). Role of immunoglobulin A monoclonal antibodies against P23 in controlling murine Cryptosporidium parvum infection. Infect. Immunol., 66(9):4469–4473.
- EPCOR. (2005). Edmonton water performance report. EPCOR Water Services Inc., Edmonton, Alberta. Available at: www.epcor.ca
- Erlandsen, S.L. and Bemrick, W.J. (1988). Waterborne giardiasis: sources of Giardia cysts and evidence pertaining to their implication in human infection. In: Advances in Giardia research. P.M. Wallis and B.R. Hammond (eds.). University of Calgary Press, Calgary, Alberta. pp. 227–236.
- Erlandsen, S.L., Sherlock, L.A., Januschka, M., Schupp, D.G., Schaefer, F.W., III, Jakubowski, W. and Bemrick, W.J. (1988). Cross-species transmission of Giardia spp.: inoculation of beavers and muskrats with cysts of human, beaver, mouse and muskrat origin. Appl. Environ. Microbiol., 54:2777–2785.
- Eroglu, F. and Koltas, I.S. (2010). Evaluation of the transmission mode of B. hominis by using PCR method. Parasitol. Res., 107:841–845.
- Farkas, K., Plutzer, J., Moltchanova, E., Török, A., Varró, M.J., Domokos, K., Frost, F. and Hunter, P.R. (2015). Serological responses to Cryptosporidium antigens in inhabitants of Hungary using conventionally filtered surface water and riverbank filtered drinking water. Epidemiol. Infect., 143(13): 2743-2747.
- Farthing, M.J.G. (1989). Giardiasis as a disease. In: Giardia from molecules to disease. R.C.A. Thompson, J.A. Reynoldson and A.J. Lymbery (eds.). CAB International, Cambridge, United Kingdom. pp. 15–37.
- Farthing, M.J.G. (1992). Giardia comes of age: progress in epidemiology, immunology and chemotherapy. J. Antimicrob. Chemother., 30(5):563–566.
- Farthing, M.J. (2000). Clinical aspects of human cryptosporidiosis. Contrib. Microbiol., 6:50–74.
- Faulkner, B.R., Olivas, Y., Ware, M.W., Roberts, M.G., Groves, J.F., Bates, K.S. and McCarty, S.L. (2010). Removal efficiencies and attachment coefficients for Cryptosporidium in sandy alluvial riverbank sediment. Water Res., 44(9): 2725–2734.
- Fayer, R. (2004). Cryptosporidium: a water-borne zoonotic parasite. Vet. Parasitol., 126(1–2):37.
- Fayer, R. and Xiao, L. (2008). Cryptosporidium and cryptosporidiosis. 2nd edition. CRC Press, Boca Raton, Florida.
- Fayer, R., Morgan, U. and Upton, S.J. (2000). Epidemiology of Cryptosporidium: transmission, detection and identification. Int. J. Parasitol., 30(12–13):1305–1322.
- Fayer, R., Santín, M. and Trout, J.M. (2008). Cryptosporidium ryanae n. sp. (Apicomplexa: Cryptosporidiidae) in cattle (Bos taurus). Vet. Parasitol., 156(3–4):191–198.
- Feng, Y., Alderisio, K.A., Yang, W., Blancero, L.A., Kuhne, W.G., Nadareski, C.A., Reid, M. and Xiao, L. (2007). Cryptosporidium genotypes in wildlife from a New York watershed. Appl. Environ. Microbiol., 73(20):6475–6483.
- Ferguson, C., Kaucner, C., Krogh, M., Deere, D. and Warnecke, M. (2004). Comparison of methods for the concentration of Cryptosporidium oocysts and Giardia cysts from raw waters. Can. J. Microbiol., 50(9):675–682.
- Ferrari, B.C. and Veal, D. (2003) Analysis-only detection of Giardia by combining immunomagnetic separation and two-color flow cytometry. Cytometry, 51(2):133–5.
- Filice, F.P. (1952). Studies on the cytology and life history of a Giardia from a laboratory rat. Univ. Calif. Publ. Zool., 57:53–146.
- Finch, G.R., Daniels, C.W., Black, E.K., Schaefer, F.W., and Belosevic, M. (1993). Dose response of Cryptosporidium parvum in outbred neonatal CD-1 mice. Appl. Environ. Microbiol., 59:3661–3665.
- Finch, G.R., Black, E.K., Gyürék, L.L. and Belosevic, M. (1994). Ozone disinfection of Giardia and Cryptosporidium. American Water Works Association Research Foundation and American Water Works Association, Denver, Colorado.
- Finch, G.R., Gyürék, L., Liyanage, L.R.J. and Belosevic, M. (1997). Effect of various disinfection methods on the inactivation of Cryptosporidium. American Water Works Association Research Foundation, Denver, Colorado. 66 pp.
- Fisher, I., Angles, M., Chandy, J., Cox, P., Warnecke, M., Kasti, G. and Jegatheesan, V. (2000). Biofilms – A sticky situation for drinking water? Water, 27(2):33–37.
- Fleming, K.K., Dugandzic, J.P., LeChevallier, M.W. and Gullick, R.W. (2006). Susceptibility of distribution systems to negative pressure transients. Awwa Research Foundation and American Water Works Association, Denver, CO and IWA Publishing.
- Fogel, D., Isaac-Renton, J., Guasparini, R., Moorehead, W. and Ongerth, J. (1993). Removing Giardia and Cryptosporidium by slow sand filtration. J. Am. Water Works Assoc., 85(11):77–84.
- Fontaine, M. and Guillot, E. (2003). An immunomagnetic separation–real-time PCR method for quantification of Cryptosporidium parvum in water samples. J. Microbiol. Methods, 54(1):29–36.
- Fox, L.M. and Saravolatz, L.D. (2005). Nitazoxanide: a new thiazolide antiparasitic agent. Clin. Infect. Dis., 40(8):1173–1180.
- Freire-Santos, F., Oteiza-Lopez, A.M., Vergara-Castiblanco, C.A. and Ares-Mazas, E. (2000). Study of the combined influence of environmental factors on viability of Cryptosporidium parvum oocysts in water evaluated by fluorogenic vital dyes and excystation techniques. Vet. Parasitol., 89(4):253–259.
- Fricker, C. and Clancy, J. (1998). Crypto’s protocol prospects. Water Qual. Int., May/June:11–15.
- Friedman, M., Radder, L, Harrison, S., Howie, D., Britton, M., Boyd, G., Wang, H., Gullick, R., LeChevallier, M., Wood, D. and Funk, J. (2004). Verification and Control of pressure transients and intrusion in distribution systems. Awwa Research Foundation, Denver, Colorado.
- Füchslin, H.P., Kötzsch, S. and Egli, T. (2012) Cryptosporidium spp. in drinking water: samples from rural sites in Switzerland. Swiss Med. Wkly., 142:w13683.
- Furtado, C., Adak, G.K., Stuart, J.M., Wall, P.G., Evans, H.S. and Casemore, D.P. (1998). Outbreaks of waterborne infectious intestinal disease in England and Wales, 1992–95. Epidemiol. Infect., 121(1):109–119.
- Gale, P. (1996). Developments in microbiological risk assessment models for drinking water—a short review. J. Appl. Bacteriol., 81:403–410.
- Gallas-Lindemann, C., Sotiriadou, I., Plutzer, J. and Karanis, P. (2013). Prevalence and distribution of Cryptosporidium and Giardia in wastewater and the surface, drinking and groundwaters in the Lower Rhine, Germany. Epidemiol. Infect., 141:9–21.
- Gammie, L., Goatcher, L. and Fok, N. (2000). A Giardia/Cryptosporidium near miss? In: Proceedings of the 8th National Conference on Drinking Water, Quebec City, Quebec, October 28–30, 1998. Canadian Water and Wastewater Association, Ottawa, Ontario.
- Gaut, S., Robertson, L., Gjerde, B., Dagestad, A. and Brattli, B. (2008). Occurrence of Cryptosporidium oocysts and Giardia cysts in Norwegian groundwater wells in bedrock. J. Water Health, 6(3):383–388.
- Gillin, F.D. and Diamond, L.S. (1980). Entamoeba histolytica and Entamoeba invadens: effects of temperature and oxygen tension on growth and survival. Exp. Parasitol., 49(3):328–338.
- Glaberman, S., Moore, J., Lowery, C., Chalmers, R., Sulaiman, I., Elwin, K., Rooney, P.J., Millar, B.C., Dooley, J.S., Lal, A.A. and Xiao, L. (2002). Three drinking water associated Cryptosporidiosis outbreaks, Northern Ireland. Emerg. Infect. Dis., 8(6): 631-633.
- GLUMRB (2012). Recommended standards for water works. Health Education Services, Great Lakes – Upper Mississippi River Board of State and Provincial Public Health and Environmental Managers, Albany, New York.
- Gobet, P. and Toze, S. (2001). Relevance of Cryptosporidium parvum hsp70 mRNA amplification as a tool to discriminate between viable and dead oocysts. J. Parasitol., 87(1):226–229.
- Gold, D., Stein, B. and Tzipori, S. (2001). The utilization of sodium taurocholate in excystation of Cryptosporidium parvum and infection of tissue culture. J. Parasitol., 87(5):997–1000.
- Gollnitz, W.D., Clancy, J.L. and Garner, S.C. (1997). Reduction of microscopic particulates by aquifers. J. Am. Water Works Assoc., 89(11):84–93.
- Gollnitz, W.D., Clancy, J.L., Whitteberry, B.L. and Vogt, J.A. (2003). RBF as a Microbial Treatment Process. J. Am. Water Works Assoc., 95(12):56–66.
- Gollnitz, W.D., Whitteberry, B.L. and Vogt, J.A. (2004). Riverbank filtration: Induced Infiltration and Groundwater Quality. J. Am. Water Works Assoc., 96(12):98–110.
- Gollnitz, W.D., Clancy, J.L., McEven, J.B. and Garner, S.C. (2005). Riverbank filtration for IESWTR compliance. J. Am. Water Works Assoc., 97(12):64–76.
- Graczyk, T.K., Cranfield, M.R., Fayer, R. and Anderson, M.S. (1996). Viability and infectivity of Cryptosporidium parvum oocysts are retained upon intestinal passage through a refractory avian host. Appl. Environ. Microbiol., 62:3234–3237.
- Graczyk, T.K., Fayer, R., Trout, J.M., Lewis, E.J., Farley, C.A., Sulaiman, I. and Lal, A.A. (1998). Giardia sp. cysts and infectious Cryptosporidium parvum oocysts in the feces of migratory Canada geese (Branta canadensis). Appl. Environ. Microbiol., 64:2736–2738.
- Graczyk, T.K., Majewska, A.C. and Schwab, K.J. (2008). The role of birds in dissemination of human waterborne enteropathogens. Trends Parasitol., 24(2):55–59.
- Gregory, R. and Edzwald, J.K. (2011). Sedimentation and flotation. In: Water Quality and Treatment. J.K. Edzwald (ed.). McGraw Hill, New York. pp. 9.1–9.98 (Chapter 9).
- Greinert, J., Furtado, D., Smith, J., Monte Barardi, C. and Simões, C. (2004). Detection of Cryptosporidium oocysts and Giardia cysts in swimming pool filter backwash water concentrates by flocculation and immunomagnetic separation. Int. J. Environ. Health Res.,14(6):395–404.
- Griffin, D.W., Gibson, C.J. III, Lipp, E.K., Riley, K., Paul, J.H. III and Rose, J.B. (1999). Detection of viral pathogens by reverse transcriptase PCR and of microbial indicators by standard methods in the canals of the Florida Keys. Appl. Environ. Microbiol., 65(9):4118–4125.
- Guo, H., Wyart, Y., Perot, J., Nauleau, F. and Moulin, P. (2010). Low-pressure membrane integrity tests for drinking water treatment: A review. Water Res., 44(1):41–57.
- Gupta, M. and Haas, C.N. (2004). The Milwaukee Cryptosporidium outbreak: assessment of incubation time and daily attack rate. J. Water Health, 2(2):59–69.
- Gupta, V., Johnson, W.P., Shafieian, P., Ryu, H., Alum, A., Abbaszadegan, M., Hubbs, S.A. and Rauch-Williams, T. (2009). Riverbank filtration: Comparison of pilot scale transport with theory. Environ. Sci. Technol., 43(3):669–676.
- Gutiérrez-Aguirre, I., Rački, N., Dreo, T., Ravnikar, M. (2015). Droplet digital PCR for absolute quantification of pathogens. Christophe Lacomme (ed.) Plant Pathology: Techniques and Protocols, Methods in Molecular Biology. Vol 1302. Springer Science Business Media, New York.
- Guy, R.A., Payment, P., Krull, U.J. and Horgen, P.A. (2003). Real-time PCR for quantification of Giardia and Cryptosporidium in environmental water samples and sewage. Appl. Environ. Microbiol., 69(9):5178–5185.
- Guyot, K., Follet-Dumoulin, A., Lelievre, E., Sarfati, C., Rabodonirina, M., Nevez, G., Cailliez, J.C., Camus, D. and Dei-Cas, E. (2001). Molecular characterization of Cryptosporidium isolates obtained from humans in France. J. Clin. Microbiol., 39:3472–3480.
- Guzman-Herrador, B., Carlander, A., Ethelberg, S., Freiesleben de Blasio, B., Kuusi, M., Lund, V., Löfdahl, M., MacDonald, E., Nichols, G., Schönning, C., Sudre, B., Trönnberg, L., Vold, L., Semenza, J.C. and Nygård, K. (2015). Waterborne outbreaks in the Nordic countries, 1998 to 2012. Euro Surveill., 20(24):1–10.
- Haas, C.N., Rose, J.B. and Gerba, C.P. (1999). Quantitative microbial risk assessment. John Wiley, New York, New York.
- Hall, T., Pressdee, J., Gregory, R. and Murray, K. (1995). Cryptosporidium removal during water treatment using dissolved air flotation. Water Sci. Technol., 31(3–4):125–135.
- Hallier-Soulier, S. and Guillot, E. (2000). Detection of cryptosporidia and Cryptosporidium parvum oocysts in environmental water samples by immunomagnetic separation–polymerase chain reaction. J. Appl. Microbiol., 89(1):5–10.
- Hallier-Soulier, S. and Guillot, E. (2003). An immunomagnetic separation–reverse transcription polymerase chain reaction (IMS-RT-PCR) test for sensitive and rapid detection of viable waterborne Cryptosporidium parvum. Environ. Microbiol., 5(7):592–598.
- Hancock, C.M., Rose, J.B. and Callahan, M. (1998). Prevalence of Cryptosporidium and Giardia in US groundwaters. J. Am. Water Works Assoc., 90(3):58–61.
- Hargy, T. and Landry, L. (2007). An Evaluation of the effects of Coquitlam source water turbidity on ozone and UV disinfection. In: Proceedings of the AWWA Water Quality Technology Conference. American Water Works Association, Denver, Colorado.
- Harrington, G.W., Chen, H-W., Harris, A.J., Xagoraraki, I., Battigelli, D.A. and Standridge, J.H. (2001). Removal of emerging waterborne pathogens. AWWA Research Foundation and American Water Works Association, Denver, Colorado.
- Harter, T. and Wagner, S. (2000). Colloid transport and filtration of Cryptosporidium parvum in sandy soils and aquifer sediments. Environ. Sci. Technol., 34(1):62–70.
- Harvey, R.W., Metge, D.W., Shapiro, A.M., Renken, R.A., Osborn, C.L., Ryan, J.N., Cunningham, K.J. and Landkamer, L. (2008). Pathogen and chemical transport in the karst limestone of the Biscayne aquifer: 3. Use of microspheres to estimate the transport potential of Cryptosporidium parvum oocysts. Water Resour. Res., 44(8).
- Harvey, R.W., Metge, D.W., Barber, L.B. and Aiken, G.R. (2010). Effects of altered groundwater chemistry upon the pH-dependency and magnitude of bacterial attachment during transport within an organically contaminated sandy aquifer. Water Res., 44(4):1062–1071.
- Havelaar, A. and Melse, J.M. (2003). Quantifying public health risk in the WHO Guidelines for drinking-water quality: a burden of disease approach. Rijkinstituut voor Volskgezondheid en Milieu, Bilthoven, Netherlands (RIVM Report 734301022).
- Headd, B. and Bradford, S.A. (2016). Use of aerobic spores as a surrogate for Cryptosporidium oocysts in drinking water supplies. Water Res., 90: 185-202.
- Health Canada. (2006). Guidelines for Canadian drinking water quality: Guideline technical document — Trihalomethanes. Water Quality and Health Bureau, Healthy Environments and Consumer Safety Branch, Health Canada, Ottawa, Ontario. Available at: http://healthycanadians.gc.ca/publications/healthy-living-vie-saine/water-trihalomethanes-eau/index-eng.php
- Health Canada (2008a). Guidelines for Canadian drinking water quality: Guideline technical document — Chlorite and chlorate. Water Quality and Health Bureau, Healthy Environments and Consumer Safety Branch, Health Canada, Ottawa, Ontario. Available at: http://healthycanadians.gc.ca/publications/healthy-living-vie-saine/water-chlorite-chlorate-eau/index-eng.php
- Health Canada (2008b). Guidelines for Canadian drinking water quality: Guideline technical document — Haloacetic Acids. Water Quality and Health Bureau, Healthy Environments and Consumer Safety Branch, Health Canada, Ottawa, Ontario. Available at: http://healthycanadians.gc.ca/publications/healthy-living-vie-saine/water-haloacetic-haloacetique-eau/index-eng.php
- Health Canada (2011a). Guidelines for Canadian drinking water quality: Guideline technical document — Enteric Viruses. Water, Air and Climate Change Bureau, Healthy Environments and Consumer Safety Branch, Health Canada, Ottawa, Ontario. Available at: http://healthycanadians.gc.ca/publications/healthy-living-vie-saine/water-enteric-virus-enterique-eau/index-eng.php
- Health Canada (2011b). Guidelines for Canadian drinking water quality: Guideline technical document — N-Nitrosodimethylamine (NDMA). Water, Air and Climate Change Bureau, Healthy Environments and Consumer Safety Branch, Health Canada, Ottawa, Ontario. Available at: http://healthycanadians.gc.ca/publications/healthy-living-vie-saine/water-nitrosodimethylamine-eau/index-eng.php
- Health Canada (2012a). Guidelines for Canadian recreational water quality, Third edition. Water, Air and Climate Change Bureau, Healthy Environments and Consumer Safety Branch, Health Canada, Ottawa, Ontario. Available at: http://healthycanadians.gc.ca/publications/healthy-living-vie-saine/water-recreational-recreative-eau/index-eng.php
- Health Canada (2012b). Guidelines for Canadian drinking water quality: Guideline technical document —Escherichia coli. Water, Air and Climate Change Bureau, Healthy Environments and Consumer Safety Branch, Health Canada, Ottawa, Ontario. Available at: http://healthycanadians.gc.ca/publications/healthy-living-vie-saine/water-ecoli-eau/index-eng.php
- Health Canada (2012c). Guidelines for Canadian drinking water quality: Guideline technical document—Total coliforms. Water, Air and Climate Change Bureau, Healthy Environments and Consumer Safety Branch, Health Canada, Ottawa, Ontario. Available at: http://healthycanadians.gc.ca/publications/healthy-living-vie-saine/water-coliforms-coliformes-eau/index-eng.php
- Health Canada (2012d). Guidelines for Canadian drinking water quality: Guideline technical document — Turbidity. Water, Air and Climate Change Bureau, Healthy Environments and Consumer Safety Branch, Health Canada, Ottawa, Ontario. Available at: http://healthycanadians.gc.ca/publications/healthy-living-vie-saine/water-turbidity-turbidite-eau/index-eng.php
- Health Canada (2016). Guidelines for Canadian drinking water quality: Guideline technical document — Bromate. Water and Air Quality Bureau, Healthy Environments and Consumer Safety Branch, Health Canada, Ottawa, Ontario. Available at: www.canada.ca/en/health-canada/services/environmental-workplace-health/reports-publications/water-quality.html
- Health Canada (2018). Guidance on the use of quantitative microbial risk assessment in drinking water. Water and Air Quality Bureau, Healthy Environments and Consumer Safety Branch, Health Canada, Ottawa, Ontario. Available at: https://www.canada.ca/en/health-canada/programs/consultations-guidance-quantitative-microbial-risk-assessment-drinking-water/document.html
- Heaselgrave, W. and Kilvington, S. (2011). The efficacy of simulated solar disinfection (SODIS) against Ascaris, Giardia, Acanthamoeba, Naeglaria, Entamoeba, and Cryptosporidium. Acta Trop., 119(2–3):138–143.
- Heller, L. and Ladeira Alves de Brito, L. (2006). The retention of Cryptosporidium sp. oocysts at varying depths in slow sand filters: A pilot study. J. Water Supply Res. Technol. AQUA, 55(3):193–206.
- Hendricks, D.W., Clunie, W.F., Sturbaum, G.D., Klein, D.A., Champlin, T.L., Kugrens, P., Hirsh, J., McCourt, B., Nordby, G.R., Sobsey, M.D., Hunt, J. and Allen, M.J. (2005). Filtration removals of microorganisms and particles. J. Environ. Eng., 131(12):1621–1632.
- Herwaldt, B.L., Craun, G.F., Stokes, S.L. and Juranek, D.D (1992). Outbreaks of waterborne disease in the United States, 1989 – 1990. J. Am. Wat. Wks. Assoc., 84: 129–135.
- Hewlett, E.L., Andrews, J.S., Ruffier, J. and Schaefer, F.W., III. (1982). Experimental infection of mongrel dogs with Giardia lamblia cysts and cultured trophozoites. J. Infect. Dis., 145:89–93.
- Heyworth, M.F. (1988). Immunology of Giardia infections. In: Advances in Giardia research. P.M. Wallis and B.R. Hammond (eds.). University of Calgary Press, Calgary, Alberta. pp. 45–48.
- Hibler, C.P., Hancock, C.M., Perger, L.M., Wegrzyn, J.G. and Swabby, K.D. (1987). Inactivation of Giardia cysts with chlorine at 0.5 to 5.0°C. American Water Works Association, Denver, Colorado. 39 pp. (Technical Research Series).
- Hijjawi, N. (2010). Cryptosporidium: New developments in cell culture. Exp. Parasitol., 124:54–60.
- Hijjawi, N.S., Meloni, B.P., Morgan, U.M. and Thompson, R.C. (2001). Complete development and long-term maintenance of Cryptosporidium parvum human and cattle genotypes in cell culture. Int. J. Parasitol., 31(10):1048–1055.
- Hijjawi, N.S., Meloni, B.P., Ryan, U.M., Olson, M.E. and Thompson, R.C. (2002). Successful in vitro cultivation of Cryptosporidium andersoni: evidence for the existence of novel extracellular stages in the life cycle and implications for the classification of Cryptosporidium. Int. J. Parasitol., 32(14):1719–1726.
- Hijjawi, N.S., Meloni, B.P., Ng’anzo, M., Ryan, U.M., Olson, M.E., Cox, P.T., Monis, P.T. and Thompson, R.C. (2004). Complete development of Cryptosporidium parvum in host cell–free culture. Int. J. Parasitol., 34(7):769–777.
- Hijnen, W.A.M. and Medema, G. (2007a). Microbial elimination capacity of conventional water treatment for viruses, bacteria and protozoan (oo)cysts. In: Proceedings of the AWWA Water Quality Technology Conference. American Water Works Association, Denver, CO.
- Hijnen, W.A.M. and Medema, G. (2007b). Elimination of micro-organisms by drinking water treatment process: A review. Kiwa Water Research, Nieuwegein, The Netherlands.
- Hijnen, W.A.M., Brouwer-Hanzens, A., Charles, K.J. and Medema, G.J. (2005). Transport of MS2 Phage, Escherichia coli, Clostridium perfringens, Cryptosporidium parvum, and Giardia intestinalis in a gravel and sandy soil. Environ. Sci. Technol., 39(20):7860–7868.
- Hijnen, W.A.M., Beerendonk, E.F. and Medema, G.J. (2006). Inactivation credit of UV radiation for viruses, bacteria and protozoan (oo)cysts in water: A review. Water Res. 40(1):3–22.
- Hijnen, W.A.M., Dullemont, Y.J., Schijven, J.F., Brouwer-Hanzens, A.J., Rosielle, M. and Medema, G. (2007). Removal and fate of Cryptosporidium parvum, Clostridium perfringens and small-sized centric diatoms (Stephanodiscus hantzschii) in slow sand filters. Water Res., 41(10):2151–2162.
- Hijnen, W.A.M., Suylen, G.M.H., Bahlman, J.A., Brouwer-Hanzens, A. and Medema, G.J. (2010). GAC adsorption filters as barriers for viruses, bacteria and protozoan (oo)cysts in water treatment. Water Res., 44(4): 1224–1234.
- Hilborn, E.D., Wade, T., Hicks, L., Garrison, L. and Gargano, J. (2013). Surveillance for waternorne disease outbreaks associated with drinking water and other nonrecreational water – United States, 2009 – 2010. Centre for Disease Control and Prevention, Atlanta.
- Hiltz, T. (2015). Personal communication. Town of Bridgewater, Nova Scotia.
- Hoff, J.C. (1986). Inactivation of microbial agents by chemical disinfectants. U.S. Environmental Protection Agency, Cincinnati, OH (Report No. EPA/600/S286/067).
- Homan, W.L. and Mank, T.G. (2001). Human giardiasis: genotype linked differences in clinical symptomatology. Int. J. Parasitol., 31(8):822–826.
- Hopkins, R.S., Shillam, P., Gaspard, B., Eisnach, L. and Karlin, R.J. (1985). Waterborne disease in Colorado: three years’ surveillance and 18 outbreaks. Am. J. Public Health, 75(3): 254–257.
- Hoque, M.E., Hope, V.T., Scragg, R. and Kjellstrom, T. (2003). Children at risk of giardiasis in Auckland: a case–control analysis. Epidemiol. Infect., 131(1):655–662.
- Hörman, A., Rimhanen-Finne, R., Maunula, L., von Bonsdorff, C., Torvela, N., Heikinheimo, A. and Hänninen, M. (2004). Campylobacter spp., Giardia spp., Cryptosporidium spp., noroviruses, and indicator organisms in surface water in southwestern Finland, 2000–2001. Appl. Environ. Microbiol., 70(1):87–95.
- Howe, A.D., Forster, S., Morton, S., Marshall, R., Osborn, K.S., Wright, P. and Hunter, P.R. (2002). Cryptosporidium oocysts in a water supply associated with a cryptosporidiosis outbreak. Emerg. Infect. Dis., 8(6): 619–624.
- HPSC. (2007). Annual report 2006. Health Protection Surveillance Centre, Dublin.
- Hrudey, S.E. and Hrudey, E.L. (2004). Safe drinking water: lessons from recent outbreaks in affluent nations. IWA Publishing, London, United Kingdom. 486 pp.
- Hsu, B.M. and Huang, C. (2001). Performances of the immunomagnetic separation method for Cryptosporidium in water under various operation conditions. Biotechnol. Prog., 17(6):1114–1118.
- Hsu, B.M., Wu, N.M., Jang, H.D., Shih, F.C., Wan, M.T. and Kung, C.M. (2005). Using the flow cytometry to quantify the Giardia cysts and Cryptosporidium oocysts in water samples. Environ. Monit. Assess., 104(1–3):155–162.
- Hu, J., Feng, Y., Ong, S.L., Ng, W.J., Song, L., Tan, X. and Chu, X. (2004). Improvement of recoveries for the determination of protozoa Cryptosporidium and Giardia in water using Method 1623. J. Microbiol. Methods, 58(3):321–325.
- Hubbs, S.A. (2010). Laboratory-simulated RBF particle removal processes. J. Am. Water Works Assoc., 102(12): 57–66.
- Huck, P.M., Emelko, M.B., Coffey, B.M., Maurizio, D. and O’Melia, C. (2001). Filter operation effects on pathogen passage. American Water Works Association Research Foundation, Denver, Colorado (Report No. 90874).
- Huck, P.M., Coffey, B.M., Emelko, M.B., Maurizio, D.D., Slawson, R.M., Anderson, W.B., Van Den Oever, J., Douglas, I.P. and O’Melia, C.R. (2002). Effects of filter operation on Cryptosporidium removal. J. Am. Water Works Assoc., 94(6):97–111.
- Huck, P.M. and Coffey, B.M. (2004). The importance of robustness in drinking-water systems. J. Toxicol. Environ. Health A, 67(20–22):1581–1590.
- Huck, P. and Sozański, M. (2011). 3.16 – Chemical basis for water technology. In: Treatise on water science. P. Wilderer (ed.). Oxford: Elsevier. pp. 429–469.
- Hunter, P. (1999). Outbreak of cryptosporidiosis in north west England. Eurosurveill. Wkly, 3(20), May 13, 1999. Available from: http://www.eurosurveillance.org/ViewArticle.aspx?ArticleId=1403.
- Hunter, P.R. and Nichols, G. (2002). Epidemiology and clinical features of Cryptosporidium infection in immunocompromised patients. Clin. Microbiol. Rev., 15(1):145–154.
- Hunter, P.R. and Thompson, R.C. (2005). The zoonotic transmission of Giardia and Cryptosporidium. Int. J. Parasitol., 35(11–12):1181–1190.
- Hynds, P.D., Thomas, M.K. and Pintar, K.D.M. (2014). Contamination of groundwater systems in the US and Canada by enteric pathogens, 1990–2013: a review and pooled-analysis. PLOSOne, 9(5): e93301.
- Isaac-Renton, J.L., Cordeiro, C., Sarafis, K. and Shahriari, H. (1993). Characterization of Giardia duodenalis isolates from a waterborne outbreak. J. Infect. Dis., 167:431–440.
- Isaac-Renton, J.L., Lewis, L.F., Ong, C.S. and Nulsen, M.F. (1994). A second community outbreak of waterborne giardiasis in Canada and serological investigation of patients. Trans. R. Soc. Trop. Med. Hyg., 88(4):395–399.
- Isaac-Renton, J., Moorehead, W. and Ross, A. (1996). Longitudinal studies of Giardia contamination in two community drinking water supplies: cyst levels, parasite viability and health impact. Appl. Environ. Microbiol., 62:47–54.
- Isaac-Renton, J., Bowie, W.R., King, A., Irwin, G.S., Ong, C.S., Fung, C.P., Shokeir, M.O. and Dubey, J.P. (1998). Detection of Toxoplasma gondii oocysts in drinking water. Appl. Environ. Microbiol., 64(6):2278–2280.
- Isaac-Renton, J., Blatherwick, J., Bowie, W.R., Fyfe, M., Khan, M., Li, A., King, A., McLean, M., Medd, L., Moorehead, W., Ong, C.S., Robertson, W. (1999). Epidemic and endemic seroprevalence of antibodies to Cryptosporidium and Giardia in residents of three communities with different drinking water supplies. Am. J. Trop. Med. Hyg., 60(4):578–583.
- ISO. (2006). ISO 15553:2006 Water Quality – Isolation and identification of Cryptosporidium oocysts and Giardia cysts from water.
- Iturriaga, R., Zhang, S., Sonek, G.J. and Stibbs, H. (2001). Detection of respiratory enzyme activity in Giardia cysts and Cryptosporidium oocysts using redox dyes and immunofluorescence techniques. J. Microbiol. Methods, 46(1):19–28.
- Jacangelo, J.G., Laîné, J-M., Carns, K.E., Cummings, E.W. and Mallevialle, J. (1991). Low-pressure membrane filtration for removing Giardia and microbial indicators. J. Am. Water Works Assoc., 83(9):97–106.
- Jacangelo, J.G., Adham, S. and Laîné, J-M. (1997). Membrane filtration for microbial removal. AWWA Research Foundation and American Water Works Association, Denver, CO.
- Jaidi, K., Barbeau, B., Carrière, A., Desjardins, R. and Prévost, M. (2009). Including operational data in QMRA model: development and impact of model inputs. J. Water Health, 7(1):77–95.
- Jakubowski, W. (1994). Personal communication. U.S. Environmental Protection Agency, Cincinnati, Ohio.
- Jenkins, M.B., Anguish, L.J., Bowman, D.D., Walker, M.J. and Ghiorse, W.C. (1997). Assessment of a dye permeability assay for determination of inactivation rates of Cryptosporidium parvum oocysts. Appl. Environ. Microbiol., 63:3844–3850.
- Jenkins, M., Trout, J.M., Higgins, J., Dorsch, M., Veal, D. and Fayer, R. (2003). Comparison of tests for viable and infectious Cryptosporidium parvum oocysts. Parasitol. Res., 89:1–5.
- Jennings, P. and Rhatigan, A., (2002). Cryptosporidiosis outbreak in Ireland linked to public wate supply. Eurosurveillance, 6(22). Available from: www.eurosurveillance.org/ViewArticle.aspx?ArticleId=2089.
- Jephcott, A. E., Begg, N. T. and Baker, I. A. (1986). Outbreak of giardiasis associated with mains water in the United Kingdom. Lancet, 1(8483): 730–732.
- Joachim, A. (2004). Human cryptosporidiosis: an update with special emphasis on the situation in Europe. J. Vet. Med. B Infect. Dis. Vet. Public Health, 51(6):251–259.
- Joachim, A., Eckert, E., Petry, F., Bialek, R. and Daugschies, A. (2003). Comparison of viability assays for Cryptosporidium parvum oocysts after disinfection. Vet. Parasitol., 111(1):47–57.
- Johnson, A.M., Linden, K., Ciociola, K.M., De Leon, R., Widmer, G. and Rochelle, P.A. (2005). UV inactivation of Cryptosporidium hominis as measured in cell culture. Appl. Environ. Microbiol., 71(5):2800–2802.
- Johnson, A.M., Di Giovanni, G.D. and Rochelle, P.A. (2012). Comparison of assays for sensitive and reproducible detection of cell culture-infectious Cryptosporidium parvum and Cryptosporidium hominis in drinking water. Appl. Environ. Microbiol., 78(1):156–162.
- Johnson, W.T. (1998). Predicting Log removal performance of membrane systems using in-situ integrity testing. Filtr. Sep., 35(1):26–29.
- Johnson, W.P. and Logan, B.E. (1996). Enhanced Transport of bacteria in porous media by sediment-phase and aqueous-phase natural organic matter. Water Res., 30(4):923–931.
- Juranek, D.D. (1995). Cryptosporidiosis: sources of infection and guidelines for prevention. Clin. Infect. Dis., 21(Suppl.):S57–S61.
- Karanis, P., Kourenti, C. and Smith, H. (2007). Waterborne transmission of protozoan parasites: a worldwide review of outbreaks and lessons learnt. J. Water Health, 5(1):1–38.
- Karasudani, T., Aoki, S., Takeuchi, J., Okuyama, M., Oseto, M., Matsuura, S., Asai, T. and Inouye, H. (2001). Sensitive detection of Cryptosporidium oocysts in environmental water samples by reverse transcription–PCR. Jpn. J. Infect. Dis., 54(3):122–124.
- Karim, M.R., Abbaszadegan, M. and LeChevallier, M. (2003). Potential for pathogen intrusion during pressure transients. J. Am. Water Works Assoc., 95(5):134–146.
- Karim, H., Sylvain, S., Laurence, L., Lucien, H. and Henry-Michel, C. (2010). Comparison of three methods to concentration Giardia cysts and Cryptosporidium oocysts from surface and drinking waters. Water Sci. Technol., 62(1):196–201.
- Kato, S. and Bowman, D.D. (2002). Using flow cytometry to determine the viability of Cryptosporidium parvum oocysts extracted from spiked environmental samples in chambers. Parasitol. Res., 88(4):326–331.
- Kaucner, C. and Stinear, T. (1998). Sensitive and rapid detection of viable Giardia cysts and Cryptosporidium parvum oocysts in large-volume water samples with wound fiberglass cartridge filters and reverse transcription–PCR. Appl. Environ. Microbiol., 64(5):1743–1749.
- Kawamura, S. (2000). Integrated design and operation of water treatment facilities. 2nd edition. John Wiley & Sons, New York, New York.
- Keegan, A.R., Fanok, S., Monis, P.T. and Saint, C.P. (2003). Cell culture-Taqman PCR assay for evaluation of Cryptosporidium parvum disinfection. Appl. Environ. Microbiol., 69(5):2505–2511.
- Kent, G.P., Greenspan, J.R., Herndon, J.L., Mofenson, L.M., Harris, J.A., Eng, T.R. and Waskin, H.A. (1988). Epidemic giardiasis caused by a contaminated public water supply. Am. J. Public Health, 78(2): 139-143.
- Keserue, H.A., Füchslin, H.P. and Egli, T. (2011). Rapid detection and enumeration of Giardia lamblia cysts in water samples by immunomagnetic separation and flow cytometric analysis. Appl. Environ. Microbiol. 77(15): 5420–5427.
- Khaldi, S., Ratajczak, M., Gargala, G., Fournier, M., Berthe, T., Favennec, L. and Dupont, J.P. (2011). Intensive exploitation of a karst aquifer leads to Cryptosporidium water supply contamination. Water Res., 45:2906–2914.
- Kim, H.N., Walker, S.L. and Bradford, S.A. (2010). Coupled factors influencing the transport and retention of Cryptosporidium parvum oocysts in saturated porous media. Water Res., 44(4):1213–1223.
- Kirner, J.C., Littler, J.D. and Angelo, L.A. (1978). A waterborne outbreak of giardiasis in Camas, Washington. J. Am. Water Works Assoc., 70:35–40.
- King, B.J., Keegan, A.R., Monis, P.T. and Saint, C.P. (2005). Environmental temperature controls Cryptosporidium oocyst metabolic rate and associated retention of infectivity. Appl. Environ. Microbiol., 71(7):3848–3857.
- King, B.J., Keegan, A.R., Robinson, B.S. and Monis, P.T. (2011). Cryptosporidium cell culture infectivity assay design. Parasitology, 138(6):671–681.
- Kirmeyer, G.J., Friedman, M., Martel, K., Howie, D., LeChevallier, M., Abbaszadegan, M., Karim, M., Funk J. and Harbour, J. (2001). Pathogen intrusion into the distribution system. AWWA Research Foundation and American Water Works Association, Denver, CO.
- Kirmeyer, G.J., Thomure, T.M., Rahman, R., Marie, J.L, LeChevallier, M.W., Yang, J., Hughes, D.M. and Schneider, O. (2014). Effective microbial control strategies for main breaks and depressurization. Water Research Foundation, Denver, CO.
- Kollu, K. and Örmeci, B. (2012). Effect of particles and bioflocculation on ultraviolet disinfection of Escherichia coli. Water Res., 46(3):750–760.
- Kommineni, S.N., Bryck, J., Stringer, C., Stevens, C, Meyers, N., Karnik, B., Hoffman, R. and Sullivan, L. (2010). Evaluation of an emerging water treatment technology: ceramic membranes. Water Sci. Technol. Water Supply, 10(5):765–770.
- Korich, D.G., Mead, J.R., Madore, M.S., Sinclair, N.A. and Sterling, C.R. (1990). Effects of ozone, chlorine dioxide, chlorine, and monochloramine on Cryptosporidium parvum oocyst viability. Appl. Environ. Microbiol., 56(5):1423–1428.
- Korich, D.G., Marshall, M.M., Smith, H.V., O’Grady, J., Bukhari, Z., Fricker, C.R., Rosen, J.P. and Clancy, J.L. (2000). Inter-laboratory comparison of the CD-1 neonatal mouse logistic dose–response model for Cryptosporidium parvum oocysts. J. Eukaryot. Microbiol., 47(3):294–298.
- Kostrzynska, M., Sankey, M., Haack, E., Power, C., Aldom, J.E., Chagla, A.H., Unger, S., Palmateer, G., Lee, H., Trevors, J.T. and De Grandis, S.A. (1999). Three sample preparation protocols for polymerase chain reaction based detection of Cryptosporidium parvum in environmental samples. J. Microbiol. Methods, 35(1):65–71.
- Kramer, M.H., Herwaldt, B., Craun, G., Calderon, R. and Juranek, D. (1996). Waterborne disease: 1993 and 1994. J. Am. Wat. Wks Assoc., 88: 66-80.
- Krasner, S.W., Weinberg, H.S., Richardson, S.D., Salvador, J.P., Chinne, R., Sclimenti, M.J., Onstad, G.D. and Thruston, A.D. (2006). Occurrence of a new generation of disinfection byproducts. Environ. Sci. Technol., 40:7175–7185.
- Kruithof, J.C., Kamp, P.C., Folmer, H.C., Nederlof, M.M. and van Hoof, S.C.J.M. (2001). Development of a membrane integrity monitoring strategy for the UF/RO Heemskerk drinking water treatment plant. Water Sci. Technol. Water Supply, 1(5–6):261–271.
- Kucik, C.J., Martin, G.L. and Sortor, B.V. (2004). Common intestinal parasites. Am. Fam. Physician, 69(5):1161–1168.
- Kuehn, W. and Mueller, U. (2000). Riverbank filtration: An overview. J. Am. Water Works Assoc., 92(12):60–69.
- Kuhn, R.C., Rock, C.M. and Oshima, K.H. (2002). Effects of pH and magnetic material on immunomagnetic separation of Cryptosporidium oocysts from concentrated water samples. Appl. Environ. Microbiol., 68(4):2066–2070.
- Kundert, K. (2014). Alberta Flood 2013 – City of Calgary water treatment system resiliency. Canadian National Conference on Drinking Water, Ottawa, Ontario.
- Kuroki, T., Watanabe, Y., Asai, Y., Yamai, S., Endo, T., Uni, S., Kimata, I. and Iseki, M. (1996). An outbreak of waterborne cryptosporidiosis in Kanagawa, Japan. Kansenshugaku Zasshi, 70(2): 132-140.
- Lal, A., Baker, M.G., Hales, S. and French, N.P. (2013). Potential effects of global environmental changes on cryptosporidiosis and giardiasis transmission. Trends Parasitol., 29(2):83–90.
- Lalancette, C., Généreux, M., Mailly, J., Servais, P., Côté, C., Michaud, A., Di Giovanni, G.D. and Prévost, M. (2012). Total and infectious Cryptosporidium oocyst and total Giardia cyst concentrations from distinct agricultural and urban contamination sources in eastern Canada. J. Water Health, 10(1):147–160.
- Lalancette, C., Papineau, I., Payment, P., Dorner, S., Servais, P., Barbeau, B., Di Giovanni, G.D. and Prévost, M. (2014). Changes in Escherichia coli to Cryptosporidium ratios for various fecal pollution sources and drinking water intakes. Water Res., 55:150–161.
- Langé, K.P., Bellamy, W.D., Hendricks, D.W. and Logsdon, G.S. (1986). Diatomaceous earth filtration of Giardia cysts and other substances. J. Am. Water Works Assoc., 78(1):76–84.
- Lean, I.S., McDonald, V. and Pollok, R.C. (2002). The role of cytokines in the pathogenesis of Cryptosporidium infection. Curr. Opin. Infect. Dis., 15(3):229–234.
- Learmonth, J.J., Ionas, G., Ebbett, K.A. and Kwan, E.S. (2004). Genetic characterization and transmission cycles of Cryptosporidium species isolated from humans in New Zealand. Appl. Environ. Microbiol., 70:3973–3978.
- LeChevallier, M.W. and Norton, W.D. (1992). Examining relationships between particle counts and Giardia, Cryptosporidium, and turbidity. J. Am. Water Works Assoc., 84(12):54–60.
- LeChevallier, M.W., Evans, T.M. and Seidler, R.J. (1981). Effect of turbidity on chlorination efficiency and bacterial persistence in drinking water. Appl. Environ. Microbiol., 42:159–167.
- LeChevallier, M.W., Norton, W.D. and Lee, R.G. (1991a). Occurrence of Giardia and Cryptosporidium spp. in surface water supplies. Appl. Environ. Microbiol., 57:2610–2616.
- LeChevallier, M.W., Norton, W.D. and Lee, R.G. (1991b). Occurrence of Giardia and Cryptosporidium spp. in filtered drinking water supplies. Appl. Environ. Microbiol., 57:2617–2621.
- LeChevallier, M.W., Norton, W.D., Lee, R.G. and Rose, J.B. (1991c). Giardia and Cryptosporidium in water supplies. AWWA Research Foundation and American Water Works Association, Denver, Colorado.
- LeChevallier, M.W., Di Giovanni, G.D., Clancy, J.L., Bukhari, Z., Bukhari, S., Rosen, J.S., Sobrinho, J. and Frey, M.M. (2003). Comparison of Method 1623 and cell culture–PCR for detection of Cryptosporidium spp. in source waters. Appl. Environ. Microbiol., 69(2):971–979.
- Lee, S.H., Levy, D., Craun, G., Beach, M. and Calderon, R. (2002). Surveillance for waterborne-disease outbreaks – United States, 1999 – 2000. Morb. Mortal Wkly Rep., 51: 1-47.
- Leelayoova, S., Rangsin, R., Taamasri, P., Naaglor, T., Thathaisong, U. and Mungthin, M. (2004). Evidence of waterborne transmission of Blastocystis hominis. Am. J. Trop. Med. Hyg., 70(6):658–662.
- Lemos, V., Graczyk, T.K., Alves, M., Lobo, M.L., Sousa, M.C., Antunes, F. and Matos, O. (2005). Identification and determination of the viability of Giardia lamblia cysts and Cryptosporidium parvum and Cryptosporidium hominis oocysts in human fecal and water supply samples by fluorescent in situ hybridization (FISH) and monoclonal antibodies. Parasitol. Res., 98(1):48–53.
- Lengerich, E.J., Addiss, D.G. and Juranek, D.D. (1994). Severe giardiasis in the United States. Clin. Infect. Dis., 18:760–763.
- Lepesteur, M., Blasdall, S. and Ashbolt, N.J. (2003). Particle dispersion for further Cryptosporidium and Giardia detection by flow cytometry. Lett. Appl. Microbiol., 37(3):218–229.
- Levy, D. A., Bens, M. S., Craun, G. F., Calderon, R. L. and Herwaldt, B. L. (1998). Surveillance for waterborne disease outbreaks: United States, 1995–1996. Morb. Mortal Wkly Rep., 47: 1–34.
- Li, D., Craik, S.A., Smith, D.W. and Belosevic, M. (2008). Survival of Giardia lamblia trophozoites after exposure to UV light. FEMS Microbiol Lett., 278(1):56–61.
- Li, X., Atwill, E.R., Dunbar, L.A. and Tate, K.W. (2010). Effect of daily temperature fluctuation during the cool season on the infectivity of Cryptosporidium parvum. Appl. Environ. Microbiol., 76(4):989–993.
- Liang, J., Dziuban, E., Craun, G., Hill, V., Moore, M., Gelting, R., Calderon, R., Beach, M. and Roy, S. (2006). Surveillance for waterborne disease and outbreaks associated with drinking water and water not intended for drinking – United States, 2003 – 2004. Morbidity and Mortality Weekly, Report 55, 31-58.
- Limor, J.R., Lal, A.A. and Xiao, L. (2002). Detection and differentiation of Cryptosporidium parasites that are pathogenic for humans by real-time PCR. J. Clin. Microbiol., 40(7):2335–2338.
- Lin, S.D. (1985). Giardia lamblia and water supply. J. Am. Water Works Assoc., 77:40–47.
- Linden, K.G. (2017). Personal communication. University of Colorado, Boulder, Colorado.
- Linden, K.G., Shin, G. and Sobsey, M.D. (2001). Comparative effectiveness of UV wavelengths for the inactivation of Cryptosporidium parvum oocysts in water. Water Sci. Technol., 43(12):171–174.
- Linden, K.G., Shin, G.A., Faubert, G., Cairns, W. and Sobsey, M.D. (2002). UV disinfection of Giardia lamblia cysts in water. Environ. Sci. Technol., 36(11):2519–2522.
- Lindquist, H.D., Ware, M., Stetler, R.E., Wymer, L. and Schaefer, F.W., III. (2001). A comparison of four fluorescent antibody-based methods for purifying, detecting, and confirming Cryptosporidium parvum in surface waters. J. Parasitol., 87(5):1124–1131.
- Lippy, E.C. (1981). Waterborne disease: occurrence is on the upswing. J. Am. Water Works Assoc., 73:57–62.
- Loganthan, S., Yang, R., Bath, A., Gordon, C. and Ryan, U. (2012). Prevalence of Cryptosporidium species in recreational versus non-recreational water sources. Exp. Parasitol., 131:399–403.
- Logsdon, G.S., Symons, J.M., Hoye Jr., R.L. and Arozarena, M.M. (1981). Alternative filtration methods for removal of Giardia cysts and cyst models. J. Am. Water Works Assoc., 73(2):111–118.
- Logsdon, G.S., Thurman, V.C., Frindt, E.S. and Stoecker, J.G. (1985). Evaluating sedimentation and various filter media for removal of Giardia cysts. J. Am. Water Works Assoc., 77(2):61–66.
- Logsdon, G.S., Kohne, R., Abel, S. and LaBonde, S. (2002). Slow sand filtration for small water systems. J. Environ. Eng. Sci., 1(5):339–348.
- Lopez, C.E., Dykes, A.C., Juranek, D.D., Sinclair, S.P., Conn, J.M., Christie, R.W., Lippy, E.C., Schultz, M.G. and Mires, M.H. (1980). Waterborne giardiasis: a community-wide outbreak of disease and a high rate of asymptomatic infection. Am. J. Epidemiol., 112:495–507.
- Lowery, C.J., Moore, J.E., Millar, B.C., Burke, D.P., McCorry, K.A., Crothers, E. and Dooley, J.S. (2000). Detection and speciation of Cryptosporidium spp. in environmental water samples by immunomagnetic separation, PCR and endonuclease restriction. J. Med. Microbiol., 49(9):779–785.
- Lowery, C.J., Nugent, P., Moore, J.E., Millar, B.C., Xiru, X. and Dooley, J.S. (2001a). PCR-IMS detection and molecular typing of Cryptosporidium parvum recovered from a recreational river source and an associated mussel (Mytilus edulis) bed in Northern Ireland. Epidemiol. Infect., 127(3):545–553.
- Lowery, C.J., Moore, J.E., Millar, B.C., McCorry, K.A., Xu, J., Rooney, P.J. and Dooley, J.S. (2001b). Occurrence and molecular genotyping of Cryptosporidium spp. in surface waters in Northern Ireland. J. Appl. Microbiol., 91(5):774–779.
- Lytle, D.A., Johnson, C.H. and Rice, E.W. (2002). A systematic comparison of the electrokinetic properties of environmentally important microorganisms in water. Colloids Surf. B. Biointerfaces, 24(2):91–101.
- Ma, P., Kaufman, D.L., Helmick, C.G., D’Souza, A.J. and Navin, T.R. (1985). Cryptosporidiosis in tourists returning from the Caribbean. N. Engl. J. Med., 312:647–648.
- MacDonald, L.M., Sargent, K., Armson, A., Thompson, R.C. and Reynoldson, J.A. (2002). The development of a real-time quantitative-PCR method for characterisation of a Cryptosporidium parvum in vitro culturing system and assessment of drug efficacy. Mol. Biochem. Parasitol., 121(2):279–282.
- MacKenzie, W. R., Hoxie, N. J., Proctor, M. E., Gradus, M. S., Blair, K. A., Peterson, D. E., Kazmierczak, J. J., Addiss, D. G., Fox, K. R., Rose, J. B. and Davis, J. P. (1994). A massive outbreak in Milwaukee of Cryptosporidium infection transmitted through the public water supply. N. Engl. J. Med., 331: 161–167.
- Macler, B.A. and Regli, S. (1993). Use of microbial risk assessment in setting US drinking water standards. Int. J. Food Microbiol., 18(4):245–256.
- Mahmud, F., Craik, S.A. and Belosevic, M. (2006). The effect of upstream treatment processes on the UV inactivation of Cryptosporidium parvum. In: Proceedings of the AWWA Water Quality Technology Conference. American Water Works Association, Denver, Colorado.
- Mamane-Gravetz, H. and Linden, K.G. (2004). Impact of particle aggregated microbes on UV disinfection. Presented at the AWWA Water Quality Technology Conference, San Antonio, Texas, November 14–18. American Water Works Association, Denver, Colorado.
- Marshall, M.M., Naumovitz, D., Ortega, Y. and Sterling, C.R. (1997). Waterborne protozoan pathogens. Clin. Microbiol. Rev., 10(1):67–85.
- Masago, Y., Oguma, K., Katayama, H., Hirata, T. and Ohgaki, S. (2004). Cryptosporidium monitoring system at a water treatment plant, based on waterborne risk assessment. Water Sci. Technol., 50(1):293–299.
- Mason, B.W., Chalmers, R.M., Carnicer_Pont, D. and Casemore, D.P. (2010). A Cryptosporidium hominis outbreak in north-west Wales associated with low oocyst counts in treated drinking water. J. Water Health, 8(2): 299-310.
- Matsue, T., Fujino, T., Kajima, J. and Tsuji, M. (2001). Infectivity and oocyst excretion patterns of Cryptosporidium muris in slightly infected mice. J. Vet. Med. Sci., 63(3):319–320.
- McClure, S. and McKenzie, I. B. (1988). A regulatory agency’s experience with Giardia. In: Advances in Giardia Research (ed. P. M. Wallis and B. R. Hammond), University of Calgary
- Press, Calgary, pp. 129–131.
- McCuin, R.M. and Clancy, J.L. (2003). Modifications to United States Environmental Protection Agency methods 1622 and 1623 for detection of Cryptosporidium oocysts and Giardia cysts in water. Appl. Environ. Microbiol., 69(1):267–274.
- McCuin, R.M., Bukhari, Z., Sobrinho, J. and Clancy, J.L. (2001). Recovery of Cryptosporidium oocysts and Giardia cysts from source water concentrates using immunomagnetic separation. J. Microbiol. Methods, 45(2):69–76.
- McDonald, V., Smith, R., Robinson, H. and Bancroft, G. (2000). Host immune responses against Cryptosporidium. Contrib. Microbiol., 6:75–91.
- McDowell-Boyer, L.M., Hunt, J.R. and Sitar, N. (1986). Particle transport through porous media. Water Resour. Res., 22(13):1901–1921 .
- McGuigan, K.G., Méndez-Hermida, F., Castro-Hermida, J.A., Ares-Mazás, E., Kehoe, S.C., Boyle, M., Sichel, C., Fernández-Ibáñez, P., Meyer, B.P., Ramalingham, S. and Meyer, E.A. (2006). Batch solar disinfection inactivates oocysts or Cryptosporidium parvum and cysts of Giardia muris in drinking water. J. Appl. Microbiol., 101(2):453–463.
- McLauchlin, J., Amar, C., Pedraza-Diaz, S. and Nichols, G.L. (2000). Molecular epidemiological analysis of Cryptosporidium spp. in the United Kingdom: results of genotyping Cryptosporidium spp. in 1,705 fecal samples from humans and 105 fecal samples from livestock animals. J. Clin. Microbiol., 38(11):3984–3990.
- McVicar, M., Bickerton, B., Chaulk, M. and Walsh, M. (2015). UV254 and streaming current monitors can improve coagulation control in challenging conditions. Opflow, 41(7):26–28.
- MDDELCC (2016). Bilan de la qualité de l’eau potable au Québec 2010-2014. Ministère du Développement durable, de l’Environnement et de la Lutte contre les changements climatiques. Gouvernement du Québec.
- Medema, G.J., Bahar, M. and Schets, F.M. (1997). Survival of Cryptosporidium parvum, Escherichia coli, faecal enterococci and Clostridium perfringens in river water: influence of temperature and autochthonous microorganisms. Water Sci. Technol., 35(11–12):249–252.
- Medema, G.J., Shaw, S., Waite, M., Snozzi, M., Morreau, A. and Grabow, W. (2003). Catchment characterisation and source water quality. In: Assessing microbial safety of drinking water: improving approaches and methods. A. Dufour, M. Snozzi, W. Koster, J. Bartram, E. Ronchi and L. Fewtrell (eds.). World Health Organization, Geneva, Switzerland. pp. 111–158.
- Medema, G., Loret, J.-F., Stenström, T.-A. and Ashbolt, N. (eds.). (2006). Quantitative microbial risk assessment in the water safety plan. April 2006. European Union MicroRisk Project. Report for the European Commission under the Fifth Framework Programme, Theme 4: Energy, environment and sustainable development.
- Meisel, J.L., Perera, D.R., Meligro, C. and Robin, C.E. (1976). Overwhelming watery diarrhea associated with a Cryptosporidium in an immunosuppressed patient. Gastroenterology, 70:1156–1160.
- Mercado, R., Buck, G.A., Manque, P.A. and Ozaki, L.S. (2007). Cryptosporidium hominis infection of the human respiratory tract. Emerg. Infect. Dis., 13(3):462–464.
- Messner, M.J., Chappell, C.L. and Okhuysen, P.C. (2001). Risk assessment for Cryptosporidium: a hierarchical Bayesian analysis of human dose response data. Water Res., 35:3934–3940.
- Messner, M.J. and Berger, P. (2016). Cryptosporidium infection risk: results of new dose-response modelling. Risk Analysis, 36(10):1969–1982.
- Metge, D.W., Harvey, R.W., Aiken, G.R., Anders, R., Lincoln, G. and Jasperse, J. (2010). Influence of organic carbon loading, sediment associated metal oxide content and sediment grain size distributions upon Cryptosporidium parvum removal during riverbank filtration operations, Sonoma County, CA. Water Res., 44(4): 1126-1137.
- Metro Vancouver (2009). The Greater Vancouver Water District quality control annual report 2009, Volume 1.
- Metro Vancouver (2013). Greater Vancouver water district 2013 quality control annual report, Volume 1. Available at: www.metrovancouver.org/services/water/WaterPublications/2013_Water_Quality_Annual_Report_Volume1.pdf
- Meyer, W. T. (1973). Epidemic giardiasis. A continued elusive entity. Rocky Mt. Med. J., 70: 48–49.
- Mi, B., Mariñas, B.J., Curl, J., Sethi, S., Crozes, G. and Hugaboom, D. (2005). Microbial passage in low pressure membrane elements with compromised integrity. Environ. Sci. Technol., 39(11):4270–4279.
- Mofidi, A.A., Meyer, E.A., Wallis, P.M., Chou, C.I., Meyer, B.P., Ramalingam, S. and Coffey, B.M. (2002). The effect of UV light on the inactivation of Giardia lamblia and Giardia muris cysts as determined by animal infectivity assay (P-2951-01). Water Res., 36(8):2098–2108.
- Mølbak, K., Højlyng, N., Gottschau, A., Sá, J.C.C., Ingholt, L., da Silva, A.P.J. and Aaby, P. (1993). Cryptosporidiosis in infancy and childhood mortality in Guinea Bissau, West Africa. Br. Med. J., 307:417–420.
- Mons, M.N., van der Wielen, J.M.L., Blokker, E.J.M., Sinclair, M.I., Hulshof, K.F.A.M., Dangendorf, F., Hunter, P.R. and Medema, G.J. (2007). Estimation of the consumption of cold tap water for microbiological risk assessment: an overview of studies and statistical analysis of data. J. Water Health, 5(Suppl. 1):151–170.
- Moon, S., Kwak, W., Lee, S., Kim, W., Oh, J. and Youn, S. (2013). Epidemiological characteristics of the first water-borne outbreak of cryptosproridiosis in Seoul, Korea. J. Korean Med. Sci., 28: 983-989.
- Moore, A.C., Herwaldt, B.L., Craun, G.F., Calderon, R.L., Highsmith, A.K. and Juranek, D.D. (1993). Surveillance for waterborne disease outbreaks — United States, 1991–1992. MMWR Morb. Mortal. Wkly. Rep., 42:1–35.
- Moorehead, W., Guasparini, R., Donovan, C., Mathias, R., Cottle, R. and Baytalan, G. (1990). Giardiasis outbreak from a chlorinated community water supply. Can. J. Public Health, 81:358–362.
- Moreira, N.A., and Bondelind, M. (2017). Safe drinking water and waterborne outbreaks. J. Water Health, 15(1): 83-96.
- Morgan, U.M., Constantine, C.C., Forbes, D.A. and Thompson, R.C. (1997). Differentiation between human and animal isolates of Cryptosporidium parvum using rDNA sequencing and direct PCR analysis. J. Parasitol., 83(5):825–830.
- Moss, D.M. and Arrowood, M.J. (2001). Quantification of Cryptosporidium parvum oocysts in mouse fecal specimens using immunomagnetic particles and two-color flow cytometry. J. Parasitol., 87(2):406–412.
- Moulton-Hancock, C., Rose, J.B., Vasconcelos, G.J., Harris, S.I. and Sturbaum, G.D. (2000). Giardia and Cryptosporidium occurrence in groundwater. J. Am. Water Works Assoc., 92(9):117–123.
- MSSS (2015). Prévention et contrôle des infections dans les services de garde à l’enfance. Ministère de la Santé et des Services sociaux du Québec. Available at : http://publications.msss.gouv.qc.ca/msss/document-000374/
- Murphy, H.M., Thomas, M.K., Medeiros, D.T., McFadyen, S. and Pintar, K.D. (2016a). Estimating the number of cases of acute gastrointestinal illness (AGI) associated with Canadian municipal drinking water systems. Epidemiol. Infect., 144(7): 1371–1385.
- Murray, C.J.L. and Lopez, A.D. (eds.) (1996a). The global burden of disease: a comprehensive assessment of mortality and disability from disease, injury and risk factors in 1990 and projected to 2020. Harvard University Press, Cambridge, MA (Global Burden of Disease and Injury Series, Vol. 1).
- Murray, C. and Lopez, A. (1996b). Global health statistics. Harvard School of Public Health, Cambridge, MA (Global Burden of Disease and Injury Series, Vol. 2).
- MWH. (2012). Water treatment principles and design. 3rd edition. John Wiley & Sons, New York, New York.
- National Research Council (1980). Drinking water and health, Volume 2. National Academy Press. Washington, D.C.
- Nash, T.E. (1994). Immunology: the role of the parasite. In: Giardia from molecules to disease. R.C.A. Thompson, J.A. Reynoldson and A.J. Lymbery (eds.). CAB International, Cambridge, UK. pp. 139–154.
- Nash, T.E., Herrington, D.A., Losonsky, G.A. and Levine, M.M. (1987). Experimental human infections with Giardia lamblia. J. Infect. Dis., 156:974–984.
- Navin, T.R. and Juranek, D.D. (1984). Cryptosporidiosis: clinical, epidemiologic and parasitological review. Rev. Infect. Dis., 6:313–327.
- Navin, T. R., Juranek, D. D., Ford, M., Minedew, D. J., Lippy, E. C. and Pollard, R. A. (1985). Case-control study of waterborne giardiasis in Reno, Nevada. Am. J. Epidemiol., 122: 269–275.
- Neringer, R., Andersson, Y. and Eitrem, R. (1987). A waterborne outbreak of giardiasis in Sweden. Scand. J. Infect. Dis., 19: 85–90.
- Neumann, N.F., Gyurek, L.L., Finch, G.R. and Belosevic, M. (2000a). Intact Cryptosporidium parvum oocysts isolated after in vitro excystation are infectious to neonatal mice. FEMS Microbiol. Lett., 183:331–336.
- Neumann, N.F., Gyurek, L.L., Gammie, L., Finch, G.R. and Belosevic, M. (2000b). Comparison of animal infectivity and nucleic acid staining for assessment of Cryptosporidium parvum viability in water. Appl. Environ. Microbiol., 66(1):406–412.
- Newcombe, G. and Dixon, D. (2006). Introduction. In: Interface science in drinking water treatment – theory and applications. G. Newcombe and D. Dixon (eds.). Academic Press, London, UK. pp. 1–4.
- Nichols, G., Chalmers, R., Lake, I., Sopwith, W., Regan, M., Hunter, P., Grenfell, P., Harrison, F. and Lane, C. (2006). Cryptosporidiosis: a report on the surveillance and epidemiology of cryptosporidium infection in England and Wales. Drinking Water Directorate Contract Number DWI 70/2/201, 129.
- Nichols, G., Lane, C., Asgari, N., Verlander, N.Q. and Charlett, A. (2009). Rainfall and outbreaks of drinking water related disease in England and Wales. J. Water Health, 7(1):1–8.
- Nichols, R.A.B., Connelly, L., Sullivan, C.B. and Smith, H.V. (2010). Identification of Cryptosporidium species and genotypes in Scottish raw and drinking waters during a one-year monitoring period. Appl. Environ. Microbiol., 76(17):5977–5986.
- Nieminski, E.C. and Ongerth, J.E. (1995). Removing Giardia and Cryptosporidium by conventional treatment and direct filtration. J. Am. Water Works Assoc., 87(9):96–106.
- Nime, F.A., Burek, J.D., Page, D.L., Holscher, M.A. and Yardley, J.H. (1976). Acute enterocolitis in a human being infected with the protozoan Cryptosporidium. Gastroenterology, 70(4):592–598.
- Nimri, L.F. and Batchoun, R. (1994). Prevalence of Cryptosporidium species in elementary school children. J. Clin. Microbiol., 32:1040–1042.
- Noordeen, F., Horadagoda, N.U., Faizal, A.C., Rajapakse, R.P., Razak, M.A. and Arulkanthan, A. (2002). Infectivity of Cryptosporidium parvum isolated from asymptomatic adult goats to mice and goat kids. Vet. Parasitol., 103(3):217–225.
- Nova Scotia Environment (2012). Nova Scotia treatment standards for municipal drinking water systems. Available at: www.novascotia.ca/nse/water/docs/Treatment_Standards_for_Municipal_Drinking_Water_Systems.pdf.
- Nova Scotia Environment (2013). Assessing protozoan risks for surface drinking water supplies in Nova Scotia. Prepared by: Centre for Water Resources Studies, Dalhousie University, Nova Scotia.
- NRMMC-EPHC (2006). Australian guidelines for water recycling: managing health and environmental risks (Phase 1). Natural Resource Management Ministerial Council, Environment Protection and Heritage Council, Australian Health Ministers Conference, Adelaide, Australia.
- NSF/ANSI (2015). Standard 419—Public drinking water equipment performance - filtration. NSF International, Ann Arbor, Michigan.
- NSF/ANSI (2016a). Standard 53—Drinking water treatment units – health effects. NSF International, Ann Arbor, Michigan.
- NSF/ANSI (2016b). Standard 58—Reverse osmosis drinking water treatment systems. NSF International, Ann Arbor, Michigan.
- NSF/ANSI (2016c). Standard 62—Drinking water distillation systems. NSF International, Ann Arbor, Michigan.
- NSF/ANSI (2016d). Standard 61—Drinking water system components – health effects. NSF International, Ann Arbor, Michigan.
- NSF/ANSI (2016e). Standard 55—Ultraviolet microbiological water treatment systems. NSF International, Ann Arbor, Michigan.
- NSF/ANSI (2017). Standard 60— Drinking water treatment chemicals health effects. NSF International, Ann Arbor, Michigan.
- Nwachuku, N., Craun, G.F. and Calderon, R.L. (2002). How effective is the TCR in assessing outbreak vulnerability? J. Am. Water Works Assoc., 94(9):88–96.
- Nygård, K., Schimmer, B., Søbstad, Ø., Walde, A., Tveit, I., Langeland, N., Hausken, T. and Aavitsland, P. (2006). A large community outbreak of waterborne giardiasis-delayed detection in a non-endemic urban area. BMC Pulbic Health, 6:141.
- Ochiai, Y., Takada, C. and Hosaka, M. (2005). Detection and discrimination of Cryptosporidium parvum and C. hominis in water samples by immunomagnetic separation–PCR. Appl. Environ. Microbiol., 71(2):898–903.
- O’Connor, D.R. (2002). Part two report on the Walkerton inquiry: A strategy for safe drinking water. Ontario Ministry of the Attorney General (ISBN 0-7794-25600X).
- O’Donoghue, P.J. (1995). Cryptosporidium and cryptosporidiosis in man and animals. Int. J. Parasitol., 25:139–195.
- Oguma, K., Katayama, H., Mitani, H., Morita, S., Hirata, T. and Ohgaki, S. (2001). Determination of pyrimidine dimers in Escherichia coli and Cryptosporidium parvum during UV light inactivation, photoreactivation and dark repair. Appl. Environ. Microbiol., 67(10):4630–7.
- O’Handley, R.M. and Olson, M.E. (2006). Giardiasis and cryptosporidiosis in ruminants. Vet. Clin. North Am. Food Anim. Pract., 22(3):623–643.
- O’Handley, R.M., Cockwill, C., McAllister, T.A., Jelinski, M., Morck, D.W. and Olson, M.E. (1999). Duration of naturally acquired giardiasis and cryptosporidiosis in dairy calves and their association with diarrhea. J. Am. Vet. Med. Assoc., 214(3):391–396.
- Okhuysen, P.C. and Chappell, C.L. (2002). Cryptosporidium virulence determinants—are we there yet? Int. J. Parasitol., 32:517–525.
- Okhuysen, P.C., Chappell, C.L., Serling, C.R., Jakubowski, W. and DuPont, H.L. (1998). Susceptibility and serologic response of healthy adults to reinfection with Cryptosporidium parvum. Infect. Immunol., 66:441–443.
- Okhuysen, P.C., Chappell, C.L., Crabb, J.H., Sterling, C.R. and DuPont, H.L. (1999). Virulence of three distinct Cryptosporidium parvum isolates for healthy adults. J. Infect. Dis., 180:1275–1281.
- Okhuysen, P.C., Rich, S.M., Chappell, C.L., Grimes, K.A., Widmer, G., Feng, X. and Tzipori, S. (2002). Infectivity of a Cryptosporidium parvum isolate of cervine origin for healthy adults and interferon-gamma knockout mice. J. Infect. Dis., 185(9):1320–1325.
- Okhuysen, P.C., Rogers, G.A., Crisanti, A., Spano, F., Huang, D.B., Chappell, C.L. and Tzipori, S. (2004). Antibody response of healthy adults to recombinant thrombospondin-related adhesive protein of Cryptosporidium 1 after experimental exposure to Cryptosporidium oocysts. Clin. Diagn. Lab. Immunol., 11(2):235–238.
- Olson, M.E., Morck, D.W. and Ceri, H. (1994). Vaccination against Giardia in domestic kittens. In: Giardia from molecules to disease. R.C.A. Thompson, J.A. Reynoldson and A.J. Lymbery (eds.). CAB International, Cambridge, UK. pp. 366–367.
- Olson, M.E., Thorlakson, C.L., Deselliers, L., Worck, D.W. and McAllister, T.A. (1997). Giardia and Cryptosporidium in Canadian farm animals. Vet. Parasitol., 68:375–381.
- Olson, M.E., O’Handley, R.M., Ralston, B.J., McAllister, T.A. and Thompson, R.C. (2004). Update on Cryptosporidium and Giardia infections in cattle. Trends Parasitol., 20(4):185–191.
- O’Melia, C.R. (2006). Fundamentals of particle stability. In: Interface science in drinking water treatment – theory and applications. G. Newcombe and D. Dixon (eds.). Academic Press, London, United Kingdom. pp. 317–362.
- Ong, C., Moorehead, W., Ross, A. and Isaac-Renton, J. (1996). Studies of Giardia spp. and Cryptosporidium spp. in two adjacent watersheds. Appl. Environ. Microbiol., 62:2798–2805.
- Ong, C.S.L., Pearce, M., Eisler, D., Goh, S.H., King, A.S., Bowie, W.R., Isaac-Renton, J.L. and Beard, C.B. (1997). An outbreak of cryptosporidiosis in southeastern British Columbia, Canada. In: Proceedings of the 1997 international symposium on waterborne Cryptosporidium, March 2–5, 1997, Newport Beach, CA. C.R. Fricker and J.L. Clancy (eds.). American Water Works Association, Denver, Colorado.
- Ong, C.S., Eisler, D.L., Goh, S.H., Tomblin, J., Awad-El-Kariem, F.M., Beard, C.B., Xiao, L., Sulaiman, I., Lal, A., Fyfe, M., King, A., Bowie, W.R. and Isaac-Renton, J.L. (1999). Molecular epidemiology of cryptosporidiosis outbreaks and transmission in British Columbia, Canada. Am. J. Trop. Med. Hyg., 61(1):63–69.
- Ong, C.S., Eisler, D.L., Alikhani, A., Fung, V.W., Tomblin, J., Bowie, W.R. and Isaac-Renton, J.L. (2002). Novel Cryptosporidium genotypes in sporadic cryptosporidiosis cases: first report of human infections with a cervine genotype. Emerg. Infect. Dis., 8(3):263–268.
- Ongerth, J.E., Riggs, J. and Crook, J. (1989). A study of water treatment practices for the removal of Giardia lamblia cysts. American Water Works Association Research Foundation and American Water Works Association, Denver, Colorado.
- Ongerth, J.E. (2013a). LT2 Cryptosporidium data: what do they tell us about Cryptosporidium in surface water in the United States? Environmental Science and Technology, 47:4029–4038.
- Ongerth, J.E. (2013b). The concentration of Cryptosporidium and Giardia in water – the role and importance of recovery efficiency. Water Res., 47:2479–2488.
- Ongerth, J.E. and Hutton, P.E. (1997). DE filtration to remove Cryptosporidium. J. Am. Water Works Assoc., 89(12):39–46.
- Ongerth, J.E. and Hutton, P.E. (2001). Testing of diatomaceous earth filtration for removal of Cryptosporidium oocysts. J. Am. Water Works Assoc., 93(12):54–63.
- Ongerth, J.E. and Pecoraro, J.P. (1995). Removing Cryptosporidium using multimedia filters. J. Am. Water Works Assoc., 87(12):83–89.
- Ongerth, J.E., Hunter, G.D. and DeWalle, F.B. (1995). Watershed use and Giardia cyst presence. Water Res., 29:1295–1299.
- ÖNORM (2001). Austrian national standard: ÖNORM M 5873-1E, plants for disinfection of water using ultraviolet radiation: requirements and testing, part 1: low pressure mercury lamp plants . Austrian Standards Institute, Vienna, Austria.
- ÖNORM (2003). Austrian national standard: ÖNORM 5873-2 E, plants for disinfection of water using ultraviolet radiation: requirements and testing, part 2: medium pressure mercury lamp plants. Austrian Standards Institute, Vienna, Austria.
- Ontario Ministry of Environment (2006). Procedure for disinfection of drinking water in Ontario. PIBS 4448e01. Available at: https://dr6j45jk9xcmk.cloudfront.net/documents/1182/99-disinfection-of-drinking-water-en.pdf
- Oosterveld, A. (2017). Personal communication. Viqua, Guelph, Ontario.
- Oppenheimer, J.A., Aleta, E.M., Trussell, R.R., Jacangelo, J.G. and Najm, I. (2000). Evaluation of Cryptosporidium inactivation in natural waters. AWWA Research Foundation and American Water Works Association, Denver, CO.
- Oppenheimer, J., Gillogly, T., Stolarik, G. and Ward, R. (2002). Comparing the efficiency of low and medium pressure UV light for inactivating Giardia muris and Cryptosporidium parvum in waters with low and high levels of turbidity. In: Proceedings of the Annual Conference and Exhibition of the American Water Works Association, New Orleans, LA, June 16–20. American Water Works Association, Denver, Colorado.
- O’Toole, C.E., Jennings, P., Meagher, G. and Kelly, I. (2004) Cryptosporidium outbreak in a continuously tested public water supply. Epi-Insight (National Disease Surveillance Centre, Ireland), 5(10):1.
- Painter, J.E., Gargano, J.W., Collier, S.A. and Yoder, J.S. (2015a). Giardiasis surveillance – United States, 2011–2012. MMWR Surveill. Summ., 64(3):15–25.
- Painter, J.E., Hlavsa, M.C., Collier, S.A., Xiao, L. and Yoder, J.S. (2015b). Cryptosporidiosis surveillance – United States, 2011–2012. MMWR Surveill. Summ., 64(3):1–13.
- Partinoudi, V. and Collins, M.R. (2007). Assessing RBF reduction/removal mechanisms for microbial and organic DBP precursors. J. Am. Water Works Assoc., 99(12):61–71.
- Passantino, L., Malley, J., Knudson, M., Ward, R. and Kim, J. (2004). Effect of low turbidity and algae on UV disinfection performance. J. Am. Water Works Assoc., 96:128–137.
- Patania, N.L, Jacangelo, J.G., Cummings, L., Wilczak, A., Riley, K. and Oppenheimer, J. (1995). Optimization of filtration for cyst removal. American Water Works Association Research Foundation and American Water Works Association. Denver, Colorado.
- Payment, P. and Franco, E. (1993). Clostridium perfringens and somatic coliphages as indicators of the efficiency of drinking water treatment for viruses and protozoan cysts. Appl. Environ. Microbiol., 59:2418–2424.
- Payment, P. and Pintar, K. (2006). Waterborne pathogens: a critical assessment of methods, results and data analysis. Rev. Sci. Eau, 19(3):233–245.
- Payment, P., Siemiatycki, J., Richardson, L., Renaud, G., Franco, E. and Prévost, M. (1997). A prospective epidemiological study of gastrointestinal health effects due to the consumption of drinking water. Int. J. Environ. Health Res., 7:5–31.
- Payment, P., Berte, A., Prévost, M., Ménard, B. and Barbeau, B. (2000). Occurrence of pathogenic microorganisms in the Saint Lawrence River (Canada) and comparison of health risks for populations using it as their source of drinking water. Can. J. Microbiol., 46(6):565–576.
- Pedley, S., Yates, M., Schijven, J F., West, J., Howard, G. and Barrett, M. (2006). Pathogens: Health relevance, transport and attenuation. In: Protecting Groundwater for Health: Managing the Quality of Drinking-water Sources. O. Schmoll, G. Howard, J. Chilton. and I. Chorus (eds.). IWA Publishing, London, UK. pp. 49–80.
- Peldszus, S., Hallé, C., Peiris, R.H., Hamouda, M., Jin, X., Legge, R.L., Budman, H., Moresoli, C. and Huck, P.M. (2011). Reversible and irreversible low-pressure membrane foulants in drinking water treatment: Identification by principal component analysis of fluorescence EEM and mitigation by biofiltration pretreatment. Water Res., 45(16): 5161–5170.
- Pelly, H., Cormican, M., O’Donovan, D., Chalmers, R.M., Hanahoe, B., Cloughley, R., McKeown, P. and Borbett-Feeney, G. (2007). A large outbreak of cryptosporidiosis in western Ireland linked to a public water supply: a preliminary report. Eurosurveillance 12(18). Available from: http://www.eurosurveillance.org/ViewArticle.aspx?ArticleId=3187.
- Perez, E., Pena, A., Tango, M., Perez, M., Maldonado, M. and Rodriguez, M. (2000). Outbreak of cryptosporidiosis in Guadarrama (autonomous community of Madrid). Rev. Esp. Salud. Publica, 74: 527–536.
- Pett, B., Smith, F. and Stendahl, D. (1993). Cryptosporidiosis outbreak from an operations point of view. Kitchener-Waterloo, Ontario, Spring 1993. In: Proceedings of the AWWA Water Quality Technology Conference, Miami, FL. American Water Works Association, Denver, Colorado. pp. 1739–1766.
- Petterson, S., Signor, R., Ashbolt, N. and Roser, D. (2006). QMRA methodology. In: MicroRisk – Microbiological risk assessment: a scientific basis for managing drinking water safety from source to tap. April 2006.
- Petterson, S., Roser, D. and Deere, D. (2015). Characterizing the concentration of Cryptosporidium in Australian surface waters for setting health-based targets for drinking water treatment. J. Water Health, 13(3):879–896.
- PHAC (2009). C-Enternet 2007 annual report, National integrated enteric pathogen surveillance program. Canada.
- PHAC (2015). Notifiable diseases online. Available at: http://diseases.canada.ca/notifiable/?c=pl
- Piet, G.J. and Zoeteman, B.C.J. (1980). Organic water quality changes during sand bank and dune filtration of surface waters in the Netherlands. J. Am. Water Works Assoc., 72(7):400–404.
- Pintar, K.D.M., Fazil, A., Pollari, F., Waltner-Toews, D., Charron, D.F., McEwen, S.A. and Walton, T. (2012). Considering the risk of infection by Cryptosporidium via consumption of municipally treated drinking water from a surface water source in a southwestern Ontario community. Risk Anal., 32(7):1122–1138.
- Pitkänen, T., Juselius, T., Isomäki, E., Miettinen, I.T., Valve, M., Kivimäki, A-L., Lahti, K. and Hänninen, M-L. (2015). Drinking water quality and occurrence of Giardia in Finnish small groundwater supplies. Resources, 4(3): 637-654.
- Plummer, J.D., Edzwald, J.K. and Kelley, M.B. (1995). Removing Cryptosporidium by dissolved air flotation. J. Am. Water Works Assoc., 87(9):85–95.
- Plutzer, J., Törökné, A. and Karanis, P. (2010). Combination of ARAD microfiber filtration and LAMP methodology for simple, rapid and cost-effective detection of human pathogenic Giardi duodenalis and Cryptosporidium spp. in drinking water. Lett. Appl. Microbiol.. 50:82–88.
- Pokorny, N.J., Weir, S.C., Carreno, R.A., Trevors, J.T. and Lee, H. (2002). Influence of temperature on Cryptosporidium parvum oocyst infectivity in river water samples as detected by tissue culture assay. J. Parasitol., 88(3):641–643.
- Pollok, R.C., McDonald, V., Kelly, P. and Farthing, M.J. (2003). The role of Cryptosporidium parvum-derived phospholipase in intestinal epithelial cell invasion. Parasitol. Res., 90(3):181–186.
- Pond, K., Rueedi, J. and Pedley, S. (2004). MicroRisk literature review—Pathogens in drinking water sources. Centre for Public and Environmental Health, University of Surrey, Guildford, Surrey, UK.
- Pozio, E., Rezza, G., Boschini, A., Pezzotti, P., Tamburrini, A., Rossi, P., Di Fine, M., Smacchia, C., Schiesari, A., Gattei, E. Zucconi, R. and Ballarini, P. (1997). Clinical cryptosporidiosis and
- Human Immunodeficiency Virus (HIV)-induced immunosuppression: Findings from a longitudinal study of HIV-positive and HIV-negative former injection drug users. J. Infect. Dis., 176: 969–975.
- Priest, J.W., Bern, C., Xiao, L., Roberts, J.M., Kwon, J.P., Lescano, A.G., Checkley, W., Cabrera, L., Moss, D.M., Arrowood, M.J., Sterling, C.R., Gilman, R.H. and Lammie, P.J. (2006). Longitudinal analysis of Cryptosporidium species-specific immunoglobulin G antibody responses in Peruvian children. Clin. Vaccine Immunol., 13(1):123–131.
- Prystajecky, N., Huck, P.M., Schreier, H. and Isaac-Renton, J.L. (2014). Assessment of Giardia and Cryptosporidium spp. as a microbial source tracking tool for surface water: application in a mixed-use watershed. Appl. Environ. Microbiol. 80(8):2328–2336.
- Prystajecky, N., Tsui, C.K.M., Haiao, W.W.L., Uyaguari-Diaz, M.L., Ho, J., Tang, P. and Isaac-Renton, J. (2015). Giardia spp. are commonly found in mixed assemblages in surface water, as revealed by molecular and whole-genome characterization. Appl. Environ. Microbiol.. 81(14):4827–4834.
- Pyper, G.R. (1985). Slow sand filter and package treatment plant evaluation: Operating costs and removal of bacteria, Giardia, and trihalomethanes. U.S. Environmental Protection Agency, Cincinnati, Ohio. (EPA/600/S2-85/052).
- Quah, J.X., Ambu, S., Lim, Y.A., Mahdy, M.A. and Mak, J.W. (2011). Molecular identification of Cryptosporidium parvum from avian hosts. Parasitology, 138(5):573–577.
- Quintero-Betancourt, W., Peele, E.R. and Rose, J.B. (2002). Cryptosporidium parvum and Cyclospora cayetanensis: a review of laboratory methods for detection of these waterborne parasites. J. Microbiol. Methods, 49(3):209–224.
- Quintero-Betancourt, W., Gennaccaro, A.L., Scott, T.M. and Rose, J.B. (2003). Assessment of methods for detection of infectious Cryptosporidium oocysts and Giardia cysts in reclaimed effluents. Appl. Environ. Microbiol., 69(9):5380–5388.
- Rajah, S.H., Suresh, K.G., Vellayan, S., Mak, J.W., Khairul, A.A., Init, I., Vennila, G.D., Saminathan, R. and Ramakrishnan, K. (1999). Blastocystis in animal handlers. Parasitol. Res., 85:1032–1033.
- Ralston, B.J., McAllister, T.A. and Olson, M.E. (2003). Prevalence and infection pattern of naturally acquired giardiasis and cryptosporidiosis in range beef calves and their dams. Vet. Parasitol., 14(2):113–122.
- Ramirez, N.E. and Sreevatsan, S. (2006). Development of a sensitive detection system for Cryptosporidium in environmental samples. Vet. Parasitol., 136(3–4):201–213.
- Ray, C., Schubert, J., Linsky, R.B. and Melin, G. (2002a). Introduction. In: riverbank filtration: Improving source-water quality. C. Ray, G. Melin and R.B. Linsky (eds.). Kluwer Academic Publishers, Dordrecht, The Netherlands. pp. 1–15.
- Ray, C., Grischek, T., Schubert, J., Wang, J.Z. and Speth, T.F. (2002b). A perspective of riverbank filtration. J. Am. Water Works Assoc., 94(4):149–160.
- Read, C., Walters, J., Robertson, I.D. and Thompson, R.C. (2002). Correlation between genotype of Giardia duodenalis and diarrhea. Int. J. Parasitol., 32(2):229–231.
- Read, C.M., Monis, P.T. and Thompson, R.C. (2004). Discrimination of all genotypes of Giardia duodenalis at the glutamate dehydrogenase locus using PCR-RFLP. Infect. Genet. Evol., 4(2):125–130.
- Reckhow, D.A., Rees, P.L., Nüsslein, K., Makdissy, G., Devine, G., Conneely, T., Boutin, A. and Bryan, D. (2007). Long-term variability of BDOM and NOM as precursors in watershed sources. Awwa Research Foundation, Denver, Colorado.
- Regli, S., Rose, J.B., Haas, C.N. and Gerba, C.P. (1991). Modeling the risk from Giardia and viruses in drinking water. J. Am. Water Works Assoc., 83(11):76–84.
- Rendtorff, R.C. (1978). The experimental transmission of Giardia lamblia among volunteer subjects. In: Waterborne transmission of giardiasis. W. Jakubowski and J.C. Hoff (eds.). U.S. Environmental Protection Agency, Cincinnati, OH. pp. 64–81 (EPA 600/9-79-001).
- Revetta, R.P., Rodgers, M.R. and Kinkle, B.K. (2005). Isolation and identification of freshwater bacteria antagonistic to Giardia intestinalis cysts. J. Water Health, 3(1):83–88.
- Reynolds, D.T., Slade, R.B., Sykes, N.J., Jonas, A. and Fricker, C.R. (1999). Detection of Cryptosporidium oocysts in water: techniques for generating precise recovery data. J. Appl. Microbiol., 87(6):804–813.
- Rice, E.W. and Schaefer, F.W., III. (1981). Improved in vitro excystation procedure for Giardia lamblia cysts. J. Clin. Microbiol., 14:709–710.
- Riggs, M.W. (2002). Recent advances in cryptosporidiosis: the immune response. Microbes Infect., 4(10):1067–1080.
- Richardson, A. J., Frankenberg, R. A., Buck, A. C., Selkon, J. B., Colbourne, J. S., Parsons, J. W. and Mayon-White, R. T. (1991). An outbreak of waterborne cryptosporidiosis in Swindon and Oxfordshire. Epidemiol. Infect., 107: 485–495.
- Rimhanen-Finne, R., Ronkainen, P. and Hanninen, M.L. (2001). Simultaneous detection of Cryptosporidium parvum and Giardia in sewage sludge by IC-PCR. J. Appl. Microbiol., 91(6):1030–1035.
- Rimhanen-Finne, R., Horman, A., Ronkainen, P. and Hanninen, M.L. (2002). An IC-PCR method for detection of Cryptosporidium and Giardia in natural surface waters in Finland. J. Microbiol. Methods, 50(3):299–303.
- Risebro, H.L., Doria, M.F., Andersson, Y., Medema, G., Osborn, K., Schlosser, O., and Hunter, P.R. (2007). Fault tree analysis of the causes of waterborne outbreaks. J. Water Health., 05 (Suppl. 1): 1-18.
- Roach, P.D., Olson, M.E., Whitley, G. and Wallis, P.M. (1993). Waterborne Giardia cysts and Cryptosporidium oocysts in the Yukon, Canada. Appl. Environ. Microbiol., 59:67–73.
- Robertson, B., Sinclair, M.I., Forbes, A.B., Veitch, M., Kirk, M., Cunliffe, D., Willis, J. and Fairley, C.K. (2002). Case–control studies of sporadic cryptosporidiosis in Melbourne and Adelaide, Australia. Epidemiol. Infect., 128(3):419–431.
- Robertson, L.J., Campbell, A.T. and Smith, H.V. (1992). Survival of Cryptosporidium parvum oocysts under various environmental pressures. Appl. Environ. Microbiol., 58:3494–3500.
- Robertson, L.J., Campbell, A.T. and Smith, H.V. (1998). Viability of Cryptosporidium parvum oocysts: assessment by the dye permeability assay. Appl. Environ. Microbiol., 64(9):3544–3545.
- Robertson, L.J., Hermansen, L., Gjerde, B.K., Strand, E., Alvsvåg, J.O. and Langeland, N. (2006). Application of genotyping during an extensive outbreak of waterborne giardiasis in Bergen, Norway, during autumn and winter 2004. Appl. Environ. Microbiol., 72(3):2212–2217.
- Rochelle, P.A., Ferguson, D.M., Handojo, T.J., De Leon, R., Stewart, M.H. and Wolfe, R.L. (1997). An assay combining cell culture with reverse transcriptase PCR to detect and determine the infectivity of waterborne Cryptosporidium parvum. Appl. Environ. Microbiol., 63:2029–2037.
- Rochelle, P.A., De Leon, R., Johnson, A., Stewart, M.H. and Wolfe, R.L. (1999). Evaluation of immunomagnetic separation for recovery of infectious Cryptosporidium parvum oocysts from environmental samples. Appl. Environ. Microbiol., 65(2):841–845.
- Rochelle, P.A., Ferguson, D.M., Johnson, A.M. and De Leon, R. (2001). Quantitation of Cryptosporidium parvum infection in cell culture using a colorimetric in situ hybridization assay. J. Eukaryot. Microbiol., 48(5):565–574.
- Rochelle, P.A., Marshall, M.M., Mead, J.R., Johnson, A.M., Korich, D.G., Rosen, J.S. and De Leon, R. (2002). Comparison of in vitro cell culture and a mouse assay for measuring infectivity of Cryptosporidium parvum. Appl. Environ. Microbiol., 68(8):3809–3817.
- Rochelle, P.A., Modifi, A.A., Marshall, M.M., Upton, S.J., Montelone, B., Woods, K. and Di Giovanni, G. (2004). An investigation of UV disinfection and repair in Cryptosporidium parvum. AWWA Research Foundation, Denver, Colorado.
- Rochelle, P.A., Johnson, A.M., De Leon, R. and Di Giovanni, G.D. (2012). Assessing the risk of infectious Cryptosporidium in drinking water. J. Am. Water Works Assoc., 104:E325–E336.
- Rochelle, P.S., Johnson, A.M. and Di Giovanni, G.D., (2015). Still optimizing a cell culture infectivity assay for Cryptosporidium. In: American Water Works Association International Symposium on Waterborne Pathogens Conference Proceedings, Savannah, Georgia.
- Rook, J.J. (1976). Haloforms in drinking water. J. Am. Water Works Assoc., 68(3):168–172.
- Rosales, M.J., Cordón, G.P., Moreno, M.S. and Sánchez, C.M. (2005). Extracellular like-gregarine stages of Cryptosporidium parvum. Acta Trop., 95(1):74–78.
- Rose, J.B. and Gerba, C.P. (1991). Use of risk assessment for development of microbial standards. Water Sci. Technol., 24:29–34.
- Rose, J.B., Darbin, H. and Gerba, C.P. (1988). Correlations of the protozoa, Cryptosporidium and Giardia, with water quality variables in a watershed. Water Sci. Technol., 20(11/12):271–276.
- Rose, J.B, Gerba, C.P. and Jakubowski, W. (1991). Survey of potable water supplies for Cryptosporidium and Giardia. Environ. Sci. Technol., 25(8):1393–1400.
- Rose, J.B., Lisle, J.T. and LeChevallier, M. (1997). Waterborne cryptosporidiosis: incidence, outbreaks and treatment strategies. In: Cryptosporidium and cryptosporidiosis. R. Fayer (ed.). CRC Press, Boca Raton, Florida. pp. 93–109.
- Roy, S.L., DeLong, S.M., Stenzel, S.A., Shiferaw, B., Roberts, J.M., Khalakdina, A., Marcus, R., Segler, S.D., Shah, D.D., Thomas, S., Vugia, D.J., Zansky, S.M., Dietz, V. and Bea, M.J. (2004). Risk factors for sporadic cryptosporidiosis among immunocompetent persons in the United States from 1999 to 2001. J. Clin. Microbiol., 42(7):2944–2951.
- Ruecker, N.J., Matsune, J.C., Wilkes, G., Lapen, D.R., Topp, E., Edge, T.A., Sensen, C.W., Xiao, L. and Neumann, N.F. (2012). Molecular and phylogenetic approaches for assessing sources of Cryptosporidium contamination in water. Water Res., 46:5135–5150.
- Ryan, U., Xiao, L., Read, C., Zhou, L., Lal, A.A. and Pavlasek, I. (2003). Identification of novel Cryptosporidium genotypes from the Czech Republic. Appl. Environ. Microbiol., 69:4302–4307.
- Ryan, U.M., Bath, C., Robertson, I., Read, C., Elliot, A., McInnes, L., Traub, R. and Besier, B. (2005a). Sheep may not be an important zoonotic reservoir for Cryptosporidium and Giardia parasites. Appl. Environ. Microbiol., 71(9):4992–4997.
- Ryan, U., Read, C., Hawkins, P., Warnecke, M., Swanson, P., Griffith, M., Deere, D., Cunningham, M. and Cox, P. (2005b). Genotypes of Cryptosporidium from Sydney water catchment areas. J. Appl. Microbiol., 98(5):1221–1229.
- Ryan, U., Fayer, R. and Xiao, L. (2014). Cryptosporidium species in humans and animals: current understanding and research needs. Parasitology. 141:1667–1685.
- Ryan, U. and Hijjawi, N. (2015). New developments in Cryptosporidium research. Int. J. Parasitol., 45:367–373.
- Ryan U., Paparini, A., Monis, P. and Hijjawi, N. (2016). It’s official ˗ Cryptosporidium is a gregarine: what are the implications for the water industry? Water Res., 105: 305-313.
- Sartory, D.P., Parton, A., Parton, A.C., Roberts, J. and Bergmann, K. (1998). Recovery of Cryptosporidium oocysts from small and large volume water samples using a compressed foam filter system. Lett. Appl. Microbiol., 27(6):318–322.
- SCC (2016). Directory of accredited product, process and service certification bodies. Standards Council of Canada, Ottawa, Ontario. Available at: www.scc.ca/en/accreditation/product-process-and-service-certification/directory-of-accredited-clients
- Schaefer, D.A., Auerbach-Dixon, B.A. and Riggs, M.W. (2000). Characterization and formulation of multiple epitope-specific neutralizing monoclonal antibodies for passive immunization against cryptosporidiosis. Infect. Immunol., 68(5):2608–2616.
- Schets, F.M., Engels, G.B., During, M. and de Roda Husman, A.M. (2005). Detection of infectious Cryptosporidium oocysts by cell culture immunofluorescence assay: applicability to environmental samples. Appl. Environ. Microbiol., 71(11):6793–6798.
- Schijven, J., Berger, P. and Miettinen, I. (2002). Removal of pathogens, surrogates, indicators, and toxins using riverbank filtration. In: Riverbank filtration: improving source-water quality. C. Ray, G. Melin and R.B. Linsky (eds.). Kluwer Academic Publishers, Dordrecht, The Netherlands. pp. 73–116.
- Schijven, J.F., Teunis, P.F.M., Rutjes, S.A., Bouwknegt, M. and de Roda Husman, A.M. (2011). QMRAspot: a tool for quantitative microbial risk assessment from surface water to potable water. Water Res., 45:5564–5576.
- Schijven, J.F., van den Berg, H.H.J.L., Colin, M., Dullemont, Y., Hijnen, W.A.M., Magic-Knezev, A., Oorthuizen, W.A. and Wubbels, G. (2013). A mathematical model for removal of human pathogenic viruses and bacteria by slow sand filtration under variable operational conditions. Water Res., 47(7):2592–2602.
- Schmidt, P.J. and Emelko, M.B. (2010). QMRA and decision-making: Are we handling measurement errors associated with pathogen concentration data correctly? Water Res., 45(2):461–472.
- Schmidt, P.J., Reilly, P.M. and Emelko, M.B. (2010) Quantification of analytical recovery in particle and microorganism enumeration methods. Environ. Sci. Technol., 44(5):1705–1712.
- Schmidt, P.J., Emelko, M.B. and Thompson, M.E. (2013). Analytical recovery of protozoan enumeration methods: Have drinking water QMRA models corrected or created bias. Water Res., 47:2399–2408.
- Schuler, P.F. and Ghosh, M.M. (1990). Diatomaceous earth filtration of cysts and other particulates using chemical additives. J. Am. Water Works Assoc., 82(12):67–75.
- Schuler, P.F., Ghosh, M.M. and Gopalan, P. (1991). Slow sand and diatomaceous earth filtration of cysts and other particulates. Water Res., 25(8):995–1005.
- Schuster, C.J., Ellis, A.G., Robertson, W.J., Charron, D.F., Aramini, J.J., Marshall, B.J. and Medeiros, D.T. (2005). Infectious disease outbreaks related to drinking water in Canada, 1974–2001. Can. J. Public Health, 96(4):254–258.
- Sharp, E. (2015). Using online zeta potential measurements for coagulation control: A first for the UK Water Industry. International water association specialist conference on natural organic matter in drinking water, Malmo, Sweden.
- Sharpless, C.M. and Linden, K.G. (2001). UV photolysis of nitrate: Effects of natural organic matter and dissolved inorganic carbon and implication for UV water disinfection. Environ. Sci. Technol., 35(14): 2949–2955.
- Shaw, K, Walker, S. and Koopman, B. (2000). Improving filtration of Cryptosporidium. J. Am. Water Works Assoc., 92(11):103–111.
- Shin, G. and Linden, K.G. (2015). Reactivation of Giardia lamblia cysts after exposure to low-pressure UV irradiation. Can. J. Microbiol., 61(7):513–516.
- Shin, G., Linden, K.G., Arrowood, M.J. and Sobsey, M.D. (2001). Low-pressure UV inactivation and DNA repair potential of Cryptosporidium parvum oocysts. Appl. Environ. Microbiol., 67(7):3029–3032.
- Shin, G., Linden, K.G. and Faubert, G. (2010). Reactivation of Giardia lamblia cysts after exposure to polychromatic UV light. Lett. Appl. Microbiol., 51(4):395–9.
- Shukla, R., Giraldo, P., Kraliz, A., Finnigan, M. and Sanchez, A.L. (2006). Cryptosporidium spp. and other zoonotic enteric parasites in a sample of domestic dogs and cats in the Niagara region of Ontario. Can. Vet. J., 47(12):1179–1184.
- Siembida-Lösch, B., Anderson, W.B., Bonsteel, J. and Huck, P.M. (2014). Pretreatment impacts on biopolymers in adjacent ultrafiltration plants. J. Am. Water Works Assoc., 106(9): E372–E382.
- Sifuentes, L.Y. and Di Giovanni, G.D. (2007). Aged HCT-8 cell monolayers support Cryptosporidium parvum infection. Appl. Environ. Microbiol., 73(23):7548–7551.
- Sinclair, R.G., Rose, J.B., Hashsham, S.A., Gerba, C.P. and Haase, C.N. (2012). Criteria for selection of surrogates used to study the fate and control of pathogens in the environment. Appl. Environ. Microbiol., 78(6): 1969–1977.
- Sinreich, M., Pronk, M. and Kozel, R. (2014). Microbiological monitoring and classification of karst sprints. Environ. Earth Sci., 71:563–572.
- Slifko, T.R., Friedman, D., Rose, J.B. and Jakubowski, W. (1997). An in vitro method for detecting infectious Cryptosporidium oocysts with cell culture. Appl. Environ. Microbiol., 63:3669–3675.
- Slifko, T.R., Huffman, D.E., Dussert, B., Owens, J.H., Jakubowski, W., Haas, C.N. and Rose, J.B. (2002). Comparison of tissue culture and animal models for assessment of Cryptosporidium parvum infection. Exp. Parasitol., 101(2–3):97–106.
- Sluter, S.D., Tzipori, S. and Widmer, G. (1997). Parameters affecting polymerase chain reaction detection of waterborne Cryptosporidium parvum oocysts. Appl. Microbiol. Biotechnol., 48(3):325–330.
- Smeets, P.W.M.H., Medema, G.J. and Van Dijk, J.C. (2009). The Dutch secret: how to provide safe drinking water without chlorine in the Netherlands. Drink. Water Eng. Sci., 2(1):1–14.
- Smith, A., Reacher, M., Smerdon, W., Adak, G.K., Nichols, G. and Chalmers, R.M. (2006). Outbreaks of waterborne infectious intestinal disease in England and Wales, 1992–2003. Epidemiol. Infect., 134(6):1141–1149.
- Smith, H. V., Patterson, W. J. and Hardie, R. (1989). An outbreak of waterborne cryptosporidiosis caused by post-treatment contamination. Epidemiol. Infect., 103: 703–715.
- Smith, H.V. and Rose, J.B. (1990). Waterborne cryptosporidiosis. Parasitol. Today, 6:8–12.
- Smith, H.V., Parker, J.F.W., Bukhari, Z., Campbell, D.M., Benton, C., Booth, N. and McCreadie, A. (1993). Significance of small numbers of Cryptosporidium sp. oocysts in water. Lancet, 342(8866):312–313.
- Smith, H.V., Cacciò, S.M., Cook, N., Nichols, R.A. and Tait, A. (2007). Cryptosporidium and Giardia as foodborne zoonoses. Vet. Parasitol., 149(1–2):29–40.
- Smith, J.J., Gunasekera, T.S., Barardi, C.R., Veal, D. and Vesey, G. (2004). Determination of Cryptosporidium parvum oocyst viability by fluorescence in situ hybridization using a ribosomal RNA-directed probe. J. Appl. Microbiol., 96(2):409–417.
- Soave, R. (1996). Cyclospora: an overview. Clin. Infect. Dis., 23(3):429–435.
- Solo-Gabriele, H. and Neumeister, S. (1996). US outbreaks of cryptosporidiosis. J. Am. Wat. Wks Assoc., 88: 76–86.
- Song, K., Mohseni, M. and Taghipour, F. (2016). Application of ultraviolet light-emitting diodes (UV-LEDs) for water disinfection: A review. Water Res., 94: 341-349.
- Sontheimer, H. (1980). Experience with Riverbank Filtration Along the Rhine River. J. Am. Water Works Assoc., 72(7):366–390.
- Soucie, W.J. and Sheen, B.J. (2007). Filter-to-waste optimization. J. Am. Water Works Assoc., 99(5):148–157.
- Spano, F., Putignani, L., Naitza, S., Puri, C., Wright, S. and Crisanti, A. (1998). Molecular cloning and expression analysis of a Cryptosporidium parvum gene encoding a new member of the thrombospondin family. Mol. Biochem. Parasitol., 92(1):147–162.
- Staatscourant. (2001). Dutch Drinking Water Decree. Dutch Government Gazette, January 9, 2001.
- Stachan, R. and Kunstýr, I. (1983). Minimal infectious doses and prepatent periods in Giardia muris, Spironucleus muris and Trichomonas muris. Zentralbl. Bakteriol. Hyg. A, 256:249–256.
- Staggs, S.E., Beckman, E.M., Keely, S.P., Mackwan, R., Ware, M.W., Moyer, A.P., Ferretti, J.A., Sayed, A., Xiao, L. and Villegas, E.N. (2013). The applicability of TaqMan-based quantitative real-time PCR assays for detecting and enumerating Cryptosporidium spp. oocysts in the environment. PLOSOne, 8(6):e66562.
- Stantic-Pavlinic, M., Xiao, L., Glaberman, S., Lal, A.A., Orazen, T., Rataj-Verglez, A., Logar, J. and Berce, I. (2003). Cryptosporidiosis associated with animal contacts. Wien. Klin. Wochenschr., 115(34):125–127.
- Starko, K. M., Lippy, E. C., Dominquez, L. B., Haley, C. E. and Fisher, H. J. (1980). Diarrhea in Arizona Campers. CDC, Atlanta, Georgia, Unpublished manuscript.
- States, S., Stadterman, K., Ammon, L., Vogel, P. Baldizar, J., Wright, D., Conley, L. and Sykor, J. (1997). Protozoa in river water: sources, occurrence and treatment. J. Am. Water Works Assoc., 89(9):74–83.
- States, S., Tomko, R., Scheuring, M. and Casson, L. (2002). Enhanced coagulation and removal of Cryptosporidium. J. Am. Water Works Assoc., 94(11):67–77.
- Statistics Canada (2004). Data source: Canadian community health survey, Cycle 2.2 – nutrition (Wave 3): General health and 24-hour dietary recall.
- Statistics Canada (2008). User guide: Canadian community health survey (CCHS), Cycle 2.2 (2004), nutrition – general health (including vitamin & mineral supplements) & 24-hour dietary recall components. Ottawa.
- Statistics Canada (2012). Life tables, Canada, provinces and territories 2007–2009. Ministry of Industry (ISBN 978-1-100-21498-6). Availble at: www.statcan.gc.ca/pub/84-537-x/84-537-x2013003-eng.pdf
- Statistics Canada (2013a). Households and the environment survey 2011.
- Statistics Canada (2013b). Survey of drinking water plants 2011.
- Stehr-Green, J.K., McCaig, L., Remsen, H.M., Rains, C.S., Fox, M. and Juranek, D.D. (1987). Shedding of oocysts in immunocompetent individuals infected with Cryptosporidium. Am. J. Trop. Med. Hyg., 36:338–342.
- Stenzel, D.J. and Boreham, P.F.L. (1996). Blastocystis hominis revisited. Clin. Microbiol. Rev.. 9(4):563–584.
- Stevens, M.N., Ashbolt, N.J. and Cunliffe, D. (2001). Microbial indicators of drinking water quality—A NHMRC discussion paper. National Health and Medical Research Council, Canberra, Australia.
- Stinear, T., Matusan, A., Hines, K. and Sandery, M. (1996). Detection of a single viable Cryptosporidium parvum oocyst in environmental water concentrates by reverse transcription–PCR. Appl. Environ. Microbiol., 62(9):3385–3390.
- Stirling, R., Aramini, J., Ellis, A., Lim, G., Meyers, R., Fleury, M., Werker, D. (2001). Waterborne cryptosporidiosis outbreak, North Battleford, Saskatchewan, spring 2001. Can. Commun. Dis. Rep., 27(22):185–192.
- Stuart, J.M., Orr, H.J., Warburton, F.G., Jeyakanth, S., Pugh, C., Morris, I., Sarangi, J. and Nichols, G. (2003). Risk factors for sporadic giardiasis: a case–control study in southwestern England. Emerg. Infect. Dis., 9(2):229–233.
- Sturbaum, G.D., Klonicki, P.T., Marshall, M.M., Jost, B.H., Clay, B.L. and Sterling, C.R. (2002). Immunomagnetic separation (IMS)–fluorescent antibody detection and IMS-PCR detection of seeded Cryptosporidium parvum oocysts in natural waters and their limitations. Appl. Environ. Microbiol., 68(6):2991–2996.
- Sunderland, D., Graczyk, T.K., Tamang, L. and Breysse, P.N. (2007). Impact of bathers on levels of Cryptosporidium parvum oocysts and Giardia lamblia cysts in recreational beach waters. Water Res., 41:3483– 3489.
- Swaffer, B.A., Vial, H.M., King, B.J., Daly, R., Frizenschaf, J. and Monis, P.T. (2014). Investigating source water Cryptosporidium concentration, species and infectivity rates during rainfall-runoff in a multi-use catchment. Water Res., 67:310–320.
- Swertfeger, J., Metz, D.H., DeMarco, J., Braghetta, A. and Jacangelo, J.G. (1999). Effect of filter media on cyst and oocyst removal. J. Am. Water Works Assoc., 91(9):90–100.
- Taguchi, T., Shinozaki, Y., Takeyama, H., Haraguchi, S., Yoshino, M., Kaneko, M., Ishimori, Y. and Matsunaga, T. (2006). Direct counting of Cryptosporidium parvum oocysts using fluorescence in situ hybridization on a membrane filter. J. Microbiol. Methods, 67(2):373–380.
- Takashima, Y., Xuan, X., Kimata, I., Iseki, M., Kodama, Y., Nagane, N., Nagasawa, H., Matsumoto, Y., Mikami, T. and Otsuka, H. (2003). Recombinant bovine herpesvirus-1 expressing p23 protein of Cryptosporidium parvum induces neutralizing antibodies in rabbits. J. Parasitol., 89(2):276–282.
- Talbot, C., Heath, M., Wright, H. and Peters, D. (2011). 12-month UV fouling study on unfiltered source water. In: Proceedings of the AWWA Water Quality Technology Conference. American Water Works Association, Denver, Colorado.
- Templeton, M.R., Andrews, R.C. and Hofmann, R. (2005). Inactivation of particle-associated viral surrogates by ultraviolet light. Water Res., 39(15):3487–3500.
- Templeton, M.R., Andrews, R.C. and Hofmann, R. (2006). Impact of iron particles in groundwater on the UV inactivation of bacteriophages MS2 and T4. J. Appl. Microbiol., 101(3):732–741.
- Templeton, M.R., Andrews, R.C. and Hofmann, R. (2007). Removal of particle-associated bacteriophages by dual-media filtration at different filter cycle stages and impacts on subsequent UV disinfection. Water Res., 41(11):2393–2406.
- Templeton, M.R., Andrews, R.C. and Hofmann, R. (2008). Particle-associated viruses in water: impacts on disinfection processes. Critical Reviews in Environmental Science and Technology, 38(3):137–164.
- Tfaily, R., Papineau, I., Andrews, R.C. and Barbeau, B. (2015). Application of quantitative microbial risk assessment at 17 Canadian water treatment facilities. J. Am. Water Works Assoc., 107(10):E497–E508.
- Thomas, M.K., Charron, D.F., Waltner-Toews, D., Schuster, C., Maarouf, A.R. and Holt, J.D. (2006). A role of high impact weather events in waterborne disease outbreaks in Canada, 1975-2001. Int. J. Environ. Health Res., 16(3): 167-180.
- Thomas, M.K., Murray, R., Flockhart, L., Pintar, K., Pollari, F., Fazil, A., Nesbitt, A. and Marshall, B. (2013). Estimates of the burden of foodborne illness in Canada for 30 specified pathogens and unspecified agents, circa 2006. Foodborne Pathog. Dis., 10(7):639–648.
- Thompson, R.C. (2004). The zoonotic significance and molecular epidemiology of Giardia and giardiasis. Vet. Parasitol., 126(1–2):15–35.
- Thompson, R.C. and Monis, P.T. (2004). Variation in Giardia: implications for taxonomy and epidemiology. Adv. Parasitol., 58:69–137.
- Thompson, R.C., Palmer, C.S. and O’Handley, R. (2008). The public health and clinical significance of Giardia and Cryptosporidium in domestic animals. Vet. J., 177(1):18–25.
- Timms, S., Slade, J.S. and Fricker, C.R. (1995). Removal of Cryptosporidium by slow sand filtration. Water Sci. Technol., 31(5-6):81–84.
- Tollestrup, K., Frost, F.J., Kunde, T.R., Yates, M.V. and Jackson, S. (2014) Cryptosporidium infection, onsite wastewater systems and private wells in the arid southwest. J. Water Health, 12(1):161–172.
- Traub, R.J., Monis, P.T., Robertson, I., Irwin, P., Mencke, N. and Thompson, R.C. (2004). Epidemiological and molecular evidence supports the zoonotic transmission of Giardia among humans and dogs living in the same community. Parasitology, 128(Pt. 3):253–262.
- Traub, R.J., Robertson, I.D., Irwin, P.J., Mencke, N. and Thompson, R.C. (2005). Canine gastrointestinal parasitic zoonoses in India. Trends Parasitol., 21(1):42–48.
- Trimboli, P., Lozier, J. and Johnson, W. (2001). Demonstrating the integrity of a large scale microfiltration plant using a Bacillus spore challenge test. Water Sci. Technol. Water Supply, 1(5-6):1–12.
- Tufenkji, N. (2007). Modeling microbial transport in porous media: Traditional approaches and recent developments. Adv. Water Resour., 30(6–7):31455–31469.
- Tufenkji, N. and Elimelech, M. (2005). Spatial distribution of Cryptosporidium oocysts in porous media: Evidence for dual mode deposition. Environ. Sci. Technol., 39(10):3620–3629.
- Tufenkji, N. and Emelko, M.B. (2011). Fate and transport of microbial contaminants. In: Encyclopedia of Environmental Health. J.O. Nriagu (ed.). Elsevier B.V. pp. 715–726.
- Tufenkji, N., Ryan, J.N. and Elimelech, M. (2002). The promise of bank filtration. Environ. Sci. Technol., 36(21):422A–428A.
- Tufenkji, N., Miller, G.F., Ryan, J.N., Harvey, R.W. and Elimelech, M. (2004). Transport of Cryptosporidium oocysts in porous media: role of straining and physiochemical filtration. Environ. Sci. Technol., 38(22): 5932–5938.
- Tufenkji, N., Dixon, D.R., Considine, R. and Drummond, C.J. (2006). Multi-scale Cryptosporidium/sand interactions in water treatment. Water Res., 40(18):3315–3331.
- Tyzzer, E.E. (1907). A sporozoan found in the peptic glands of the common mouse. Proc. Soc. Exp. Biol. Med., 5:12–13.
- Tyzzer, E.E. (1912). Cryptosporidium parvum (sp. nov.): a coccidian found in the small intestine of the common mouse. Arch. Protistenk., 26:394–418.
- Tzipori, S. (1983). Cryptosporidiosis in animals and humans. Microbiol. Rev., 47:84–96.
- Tzipori, S. and Ward, H. (2002). Cryptosporidiosis: biology, pathogenesis and disease. Microbes Infect., 4(10):1047–1058.
- Uejio, C.K., Yale, S.H., Malecki, K., Borchardt, M.A., Anderson, H.A. and Patz, J.A. (2014). Drinking water systems, hydrology, and childhood gastrointestinal illness in Central and Northern Wisconsin. Am. J. Public Health, 104(4): 639-646.
- Umejiego, N.N., Li, C., Riera, T., Hedstrom, L. and Striepen, B. (2004). Cryptosporidium parvum IMP dehydrogenase: identification of functional, structural, and dynamic properties that can be exploited for drug design. J. Biol. Chem., 279(39):40320–40327.
- Ungar, B.L.P. (1994). Cryptosporidium and cryptosporidiosis. In: Textbook of AIDS medicine. S. Broder, D. Bolognesi and T.C. Merigan, Jr. (eds.). Williams and Wilkins, Baltimore, Maryland. Chapter 21.
- U.S. EPA (1989). Part V, Environmental Protection Agency, 40 CFR Parts 141 and 142. National Primary Drinking Water Regulations: Filtration; disinfection; turbidity; Giardia lamblia; viruses; Legionella, and heterotrophic bacteria; Final rule. Fed. Regist., 54:27485–27541.
- U.S. EPA (1991). Guidance manual for compliance with filtration and disinfection requirements for public water systems using surface water sources. U.S. Environmental Protection Agency, Washington, DC.
- U.S. EPA (2001). Low-pressure membrane filtration for pathogen removal: Application, implementation and regulatory issues. U.S. Environmental Protection Agency, Cincinnati, Ohio. (EPA 815-C-01-001).
- U.S. EPA (2004). Long Term 1 Enhanced Surface Water Treatment Rule – Turbidity provisions technical guidance manual. Office of Water, U.S. Environmental Protection Agency, Washington, DC. (EPA 816-R-04-007).
- U.S. EPA (2005a). Method 1623: Cryptosporidium and Giardia in water by filtration/IMS/FA. Office of Water, Office of Science and Technology, Engineering and Analysis Division, U.S. Environmental Protection Agency, Washington, DC (EPA 821-R-01-025).
- U.S. EPA (2005b). Membrane filtration guidance manual. U.S. Environmental Protection Agency, Cincinnati, OH.
- U.S. EPA (2006a). National Primary Drinking Water Regulations: Long Term 2 Enhanced Surface Water Treatment; final rule. Fed. Regist., 71(3):678–671; 782–783.
- U.S. EPA (2006b). 40 CFR Parts 9, 141 and 142. National Primary Drinking Water Regulations: Ground Water Rule. Final rule. Fed. Regist., 71.
- U.S. EPA (2006c). Ultraviolet disinfection guidance manual. Office of Water, U.S. Environmental Protection Agency, Washington, DC (EPA 815-R-06-007).
- U.S. EPA (2010). Long Term 2 Enhanced Surface Water Treatment Rule Toolbox Guidance Manual. Office of Water, U.S. Environmental Protection Agency, Washington, DC. (EPA 815-R-09-016).
- U.S. EPA (2012). Method 1623.1: Cryptosporidium and Giardia in water by filtration/IMS/FA. Office of Water, Office of Science and Technology, Engineering and Analysis Division, U.S. Environmental Protection Agency, Washington, DC (EPA 821-R-01-025).
- U.S. EPA (2014). Microbiological risk assessment (MRA) tools, methods, and approaches for water media. Office of Water, Office of Science and Technology. U.S. Environmental Protection Agency, Washington, DC. (EPA-820-R-14-009).
- U.S. EPA (2016). Six-year review 3 technical support document for microbial contaminant regulations. Office of Water. U.S. Environmental Protection Agency, Washington, DC. (EPA-810-R-16-010).
- Valade, M.T., Becker, W.C. and Edzwald, J.K. (2009). Treatment selection guidelines for particle and NOM removal. J. Water Supply Res. Technol. AQUA, 58(6):424–432.
- Van Dyke, M.I., Morton, V., Anderson, W.B., Isaac-Renton, J.L. and Huck, P. (2006). The occurrence of selected bacterial and protozoan pathogens in the Grand River watershed. In: Proceedings of the 12th National Conference on Drinking Water, Saint John, New Brunswick, April 1–4, 2006. Canadian Water and Wastewater Association, Ottawa, Ontario.
- Van Dyke, M.I., Ong, C.S.L., Prystajecky, N.A., Isaac-Renton, J.L. and Huck, P.M. (2012). Identifying host sources, human health risk and indicators of Cryptosporidium and Giardia in a Canadian watershed influenced by urban and rural activities. J. Water. Health., 10(2):311–323.
- Vernon, T. M. (1973). Giardiasis probe inconclusive. Colorado Health. Colorado Department of Health, Denver.
- Vesey, G., Griffiths, K.R., Gauci, M.R., Deere, D., Williams, K.L. and Veal, D.A. (1997). Simple and rapid measurement of Cryptosporidium excystation using flow cytometry. Int. J. Parasitol., 27(11):1353–1359.
- VROM. (2005). Inspectorate guideline. Assessment of the microbial safety of drinking water. VROM Inspectorate, the Netherlands,
- Wait, I.W., Johnston, C.T., Schwab, A.P. and Blatchley III, E.R. (2005). The influence of oxidation reduction potential on inorganic fouling of quartz surfaces in UV disinfection systems. In: Proceedings of the AWWA Water Quality Technology Conference. American Water Works Association, Denver, Colorado.
- Wait, I.W., Johnston, C.T. and Blatchley III, E.R. (2007). The influence of oxidation reduction potential and water treatment processes on quartz lamp sleeve fouling in ultraviolet disinfection reactors. Water Res., 41(11): 2427-2436.
- Wait, I.W. and Blatchley III, E.R. (2010). Model of radiation transmittance by inorganic fouling on UV reactor lamp sleeves. Water Environ. Res., 82(11): 2272-2278
- Walker, M.J., Montemagno, C.D. and Jenkins, M.B. (1998). Source water assessment and nonpoint sources of acutely toxic contaminants: A review of research related to survival and transport of Cryptosporidium parvum. Water Resour. Res., 34(12):3383–3392.
- Wallender, E.K., Ailes, E.C., Yoder, J.S., Roberts, V.A. and Brunkard, J.M. (2014). Contributing factors to disease outbreaks associated with untreated groundwater. Groundwater, 52(6): 886–897.
- Wallis, P. M. (1987). Development of criteria for Giardia in drinking water. Unpublished report to Health and Welfare Canada.
- Wallis, P.M., Isaac-Renton, J.L., Erlandsen, S.L. and Olson, M.E. (1995). Risk assessment for waterborne giardiasis and cryptosporidiosis in Canada. Unpublished report to Health Canada.
- Wallis, P.M., Erlandsen, S.L., Isaac-Renton, J.L., Olson, M.E., Robertson, W.J. and van Keulen, H. (1996). Prevalence of Giardia cysts and Cryptosporidium oocysts and characterization of Giardia spp. isolated from drinking water in Canada. Appl. Environ. Microbiol., 62(8):2789–2797.
- Wallis, P.M., Primrose, B. and Robertson, W.J. (1998). Outbreak of waterborne giardiasis caused by sewage contamination of drinking water. Environ. Health Rev., 42(2):44–51.
- Wallis, P. M., Matson, D., Jones, M. and Jamieson, J. (2001). Application of monitoring data for Giardia and Cryptosporidium to boil water advisories. Risk Anal., 21: 1077–1085.
- Wang, D., Bolton, J.R., Andrews, S.A. and Hofmann, R. (2015). Formation of disinfection by-products in the ultraviolet/chlorine advanced oxidation process. Sci. Total Environ., 518-519:49–57.
- Wang, J.Z., Hubbs, S.A. and Song, R. (2002). Evaluation of Riverbank Filtration as a Drinking Water Treatment Process. AWWA Research Foundation and American Water Works Association, Denver, CO.
- Ward, P.I., Deplazes, P., Regli, W., Rinder, H. and Mathis, A. (2002). Detection of eight Cryptosporidium genotypes in surface and waste waters in Europe. Parasitology, 124(Pt. 4):359–368.
- Ware, M.W., Augustine, W.A.J., Erisman, D.O., See, M.J., Wymer, L., Hayes, S.L., Dubey, J.P., and Villegas, E.N. (2010). Determining UV inactivation of Toxoplasma gondii oocysts by using cell culture and a mouse bioassay. Appl. Environ. Microbiol., 76(15): 5140-5147.
- Warnecke, M. (2006). Cryptosporidium oocyst interactions with drinking water pipe biofilms. Cooperative Research Centre for Water Quality and Treatment, Salisbury, AU.
- Webber, C. (2002). Outbreak of giardiasis in Bay of Plenty and Manawatu. In: Annual Summary of Outbreaks in New Zealand 2001, Report for the Ministry of Health, April 2002, pp. 38–39.
- Weir, S.C., Pokorny, N.J., Carreno, R.A., Trevors, J.T. and Lee, H. (2001). Improving the rate of infectivity of Cryptosporidium parvum oocysts in cell culture using centrifugation. J. Parasitol., 87(6):1502–1504.
- Weiss, W.J., Bouwer, E.J., Ball, W.P., O’Melia, C.R., LeChevallier, M.W., Arora, H. and Speth, T.F. (2003). Riverbank Filtration – Fate of DBP Precursors and Selected Microorganisms. J. Am. Water Works Assoc., 95(10):68–81.
- Welker, R., Porter, R., Pett, W.B., Provart, M.R. and Schwartz, K.T. (1994). Cryptosporidiosis outbreak in Kitchener-Waterloo: identification, assessment and future prevention. In: Proceedings of the Sixth National Conference on Drinking Water, Victoria, BC, October 16–18, 1994. W. Robertson, T. Kauri and S. Irwin (eds.). American Water Works Association, Denver, Colorado.
- Weniger, B. G., Blaser, M. J., Gedrose, J., Lippy, E. C.and Juranek, D. D. (1983). An outbreak of waterborne giardiasis associated with heavy water runoff due to warm weather and volcanic ashfall. Am.J. Public Health, 73: 868–872.
- Wensaas, K.A., Langeland, N., Hanevik, K., Mørch, K., Eide, G.E., Rortveit, G. (2012). Irritable bowel syndrome and chronic fatigue 3 years after acute giardiasis: historic cohort study. Gut., 61:214–219.
- Westrell, T., Andersson, Y. and Stenström, T.A. (2006). Drinking water consumption patterns in Sweden. J. Water Health, 4(4):511–522.
- WHO (2012). Water safety planning for small community water supplies. World Health Organization, Geneva, Switzerland. Available at: www.who.int/water_sanitation_health/publications/small-comm-water_supplies/en/
- WHO (2016). Quantitative microbial risk assessment. Application for water safety management. World Health Organization, Geneva, Switzerland. Available at: www.who.int/water_sanitation_health/publications/qmra/en/
- WHO (2017). Guidelines for Drinking Water Quality. 4th Edition.World Health Organization, Geneva, Switzerland. Available at: https://www.who.int/water_sanitation_health/publications/drinking-water-quality-guidelines-4-including-1st-addendum/en/
- Widerström, M., Schönning, C., Lilja, M., Lebbad, M., Ljung, T., Allestam, G., Ferm, M., Björkholm, B., Hansen, A., Hiltula, J., Långmark, J., Löfdahl, M., Omberg, M., Reuterwall, C., Samuelsson, E., Widgren, K., Wallensten, A. and Lindh, J. (2014). Large outbreak of Cryptosporidium hominis infection transmitted through the public water supply, Sweden. Emerg. Infect. Dis. 20(4): 581-589.
- Widmer, G. (1998). Genetic heterogeneity and PCR detection of Cryptosporidium parvum. Adv. Parasitol., 40:223–239.
- Wiesner, J. and Seeber, F. (2005). The plastid-derived organelle of protozoan human parasites as a target of established and emerging drugs. Expert Opin. Ther. Targets, 9:23–44.
- Wohlsen, T., Bates, J., Gray, B. and Katouli, M. (2004). Evaluation of five membrane filtration methods for recovery of Cryptosporidium and Giardia isolates from water samples. Appl. Environ. Microbiol., 70(4):2318–2322.
- Wolfe, M.S. (1984). Symptomatology, diagnosis and treatment. In: Giardia and giardiasis: biology, pathogenesis and epidemiology. S.L. Erlandsen and E.A. Meyer (eds.). Plenum Press, New York, New York. pp. 147–161.
- Wright, H., Gaithuma, D., Heath, M., Schulz, C. Bogan, T., Cabaj, A. and Schmalweiser, A. (2012). UV Disinfection Knowledge Base. Water Research Foundation, Denver, CO.
- Wu, J., Long, S.C., Das, D. and Dorner, S.M. (2011). Are microbial indicators and pathogens correlated? A statistical analysis of 40 years of research. J. Water Health, 9(2):265–278.
- Wyatt, C.R., Lindahl, S., Austin, K., Kapil, S. and Branch, J. (2005). Response of T lymphocytes from previously infected calves to recombinant Cryptosporidium parvum P23 vaccine antigen. J. Parasitol., 91(5):1239–1242.
- Xiao, G., Qiu, Z., Qi, J., Chen, J., Liu, F., Liu, W., Lou, J. and Shu, W. (2013). Occurrence and potential health risk of Cryptosporidium and Giardia in the Three Gorges reservoir, China. Water Res., 47:2431–2445.
- Xiao, L. and Fayer, R. (2008). Molecular characterisation of species and genotypes of Cryptosporidium and Giardia and assessment of zoonotic transmission. Int. J. Parasitol., 38(11):1239–1255.
- Xiao, L. and Lal, A. (2002). Molecular detection and differentiation of Cryptosporidium oocysts in water: the challenge and promise. In: Proceedings of the AWWA Water Quality Technology Conference, Seattle, Washington. American Water Works Association, Denver, Colorado.
- Xiao, L., Bern, C., Limor, J., Sulaiman, I., Roberts, J., Checkley, W., Cabrera, L., Gilman, R.H. and Lal, A.A. (2001). Identification of 5 types of Cryptosporidium parasites in children in Lima, Peru. J. Infect. Dis., 183(3):492–497.
- Xiao, L., Fayer, R., Ryan, U. and Upton, S.J. (2004). Cryptosporidium taxonomy: recent advances and implications for public health. Clin. Microbiol. Rev., 17(1):72–97.
- Xu, P., Widmer, G., Wang, Y., Ozaki, L.S., Alves, J.M., Serrano, M.G., Puiu, D., Manque, P., Akiyoshi, D., Mackey, A.J., Pearson, W.R., Dear, P.H., Bankier, A.T., Peterson, D.L., Abrahamsen, M.S., Kapur, V., Tzipori, S. and Buck, G.A. (2004). The genome of Cryptosporidium hominis. Nature, 431(7012):1107–1112.
- Yagita, K., Izumiyama, S., Tachibana, H., Masuda, G., Iseki, M., Furuya, K., Kameoka, Y., Kuroki, T., Itagaki, T. and Endo, T. (2001). Molecular characterization of Cryptosporidium isolates obtained from human and bovine infections in Japan. Parasitol. Res., 87:950–955.
- Young, I., Smith, B.A. and Fazil, A. (2015). A systematic review and meta-analysis of the effects of extreme weather events and other weather-related variables on Cryptosporidium and Giardia in fresh surface waters. J. Water Health, 13(1):1–17.
- Zahedi, A., Paparini, A., Jian, F., Robertson, I. and Ryan, U. (2016). Public health significance of zoonotic Cryptosporidium species in wildlife: critical insights into better drinking water management. International Journal for Parasitology: Parasites and Wildlife. 5: 88-109.
- Zhou, Y., Hamouda, M.A., Douglas, I.P., Anderson, W.B. and Huck, P.M. (2015). Accounting for reported variability in Cryptosporidium removal. Ontario Water Works Association, Annual Conference, Toronto, ON.
- Zimmer, J.L, Slawson, R.M. and Huck, P.M. (2003). Inactivation and potential repair of Cryptosporidium parvum following low- and medium-pressure ultraviolet irradiation. Water Res. 37(14):3517–3523.
- Zu, S.-X., Zhu, S.-Y. and Li, J.-F. (1992). Human cryptosporidiosis in China. Trans. R. Soc. Trop. Med. Hyg., 86:639–640.
Appendix A: Other enteric waterborne protozoa of interest: Toxoplasma gondii, Cyclospora cayetanensis, Entamoeba histolytica, and Blastocystis hominis
Toxoplasma gondii is an obligate, intracellular parasite that affects almost all warm-blooded animals, including humans. It is usually transmitted by ingestion of tissue cysts through consumption of raw or undercooked infected meat, by ingestion of sporulated oocysts through consumption of contaminated food or water or after handling contaminated soil or infected cat faeces. Oocysts are extremely resistant to environmental conditions, including drying, and appear to retain their infectivity for several months (at temperatures of −5°C) (Dubey, 1998). Although this organism tends to cause mild flu-like symptoms, it can be life-threatening for immunocompromised individuals and pregnant women. Infection can result in mental retardation, loss of vision, hearing impairment and mortality in congenitally infected children. Little is known about the distribution of this organism in water sources; however, oocysts have been reported to survive for up to 17 months in tap water. There have been six reported human outbreaks of toxoplasmosis linked to ingestion of contaminated soil and water, including an outbreak in British Columbia in 1995 (Karanis et al., 2007). This outbreak involved 110 acute cases, including 42 pregnant women and 11 neonates (Bowie et al., 1997), and was thought to be due to contamination of a water reservoir by domestic and wild cat faeces (Isaac-Renton et al., 1998; Aramini et al., 1999). Limited information is available on the efficacy of water treatment processes in removing or inactivating T. gondii. Because of its size (10-12 μm), it should be readily removed by physical removal processes (i.e., filtration). It is resistant to chlorine (AWWA, 2006) but has been shown to be susceptible to UV disinfection (Ware et al., 2010). Ware et al. (2010) reported 3 log inactivation of T. gondii oocysts at 10 mJ/cm2 using LP lamps. The authors cautioned that the study was conducted using laboratory-infected cats under ideal conditions. Environmental samples were not evaluated and additional research was recommended to confirm the susceptibility of T. gondii to UV disinfection.
Cyclospora cayetanensis is an obligate, intracellular coccidian parasite whose only natural host is humans (Eberhard et al., 2000). Cyclosporiasis has been reported worldwide but appears to be endemic throughout the tropics (Soave, 1996). Exact routes of transmission have yet to be elucidated; however, person-to-person transmission is unlikely (i.e., unsporulated oocysts are shed in faeces and require a period of maturation). Transmission is likely through food and water that have been contaminated with human faeces. Cyclospora cayetanensis has been detected in environmental samples, including water and wastewater, but detection still represents a challenge; few prevalence studies exist owing to the lack of sensitive methods, including methods to assess viability and infectivity. Cyclospora cayetanensis infection causes symptoms that mimic those caused by Cryptosporidium (e.g., nausea, anorexia, diarrhea). Illness is usually self-limiting, but long-term health effects have been reported, including Reiter syndrome. Epidemiological evidence strongly suggests that water can transmit C. cayetanensis. The first outbreak of cyclosporiasis to be associated with drinking water occurred in 1990 among hospital staff in Chicago, Illinois (Karanis et al., 2007) and was linked to a chlorinated water supply, suggesting the C. cayetanensis is resistant to levels of chlorine used in drinking water treatment. The efficacy of drinking water treatment processes for the removal and/or inactivation of C. cayetanensis has not been evaluated but illnesses have been linked to a chlorinated water supply (AWWA, 2006). It is expected that physical removal of C. cayetanensis by filtration processes should be at least as effective as for Cryptosporidium, given that C. cayetanensis oocysts are larger (8-10 μm).
Entamoeba histolytica is an obligate parasite that affects humans and other primates. Humans are the only reservoirs of significance, shedding trophozoites, cysts or both in their faeces. Entamoeba histolytica can be transmitted through ingestion of faecally contaminated water and food, but person-to-person contact is thought to be the primary route of transmission. Most infections are asymptomatic, but some can cause serious illness (i.e., amoebiasis). In the case of symptomatic infections, diarrhea, fever and abdominal pain are common. More serious health effects, including chronic colitis, lower abscesses and death, have been reported (Kucik et al., 2004). Entamoeba histolytica cysts are resistant to environmental degradation; however, their survival is primarily a function of temperature. Cysts are rapidly killed by modest heat and freezing (Gillin and Diamond, 1980). Although no waterborne outbreaks of amoebiasis have been reported in Canada, outbreaks have been reported in the United States and elsewhere (Karanis etal., 2007). Outbreaks have occurred when chlorinated water became contaminated with sewage (AWWA, 2006), suggesting that the cysts are resistant to chlorination. A CT value of 1.5 is reported for 1 log reduction at 19°C using ozone (National Research Council, 1980). This means that E. histolytica is more resistant to ozonation than Giardia but not as resistant as Cryptosporidium. Because of its size (10-20 μm), it should be readily removed by physical removal processes (i.e., filtration). No published information was found regarding UV disinfection.
Blastocystis hominis is a unicellular protozoan that has been associated with diarrhea, nausea, abdominal pain, vomiting and bloating. Although B. hominis was first identified in the early 1900s, there is still a lot of controversy surrounding the epidemiology of this organism. It is one of the most common intestinal parasites in humans with a prevalence of 1.5% to 10% in developed countries and 50 to 60% in developing countries (Stenzel and Boreham, 1996). However, a large percentage of infections result in asymptomatic carriage of the organism, leading to controversy surrounding its pathogenicity. Animals appear to be a significant reservoir of Blastocystis. Studies have shown that people in close contact with animals have a higher risk of infection (Rajah et al., 1999; Eroglu and Koltas, 2010). As with other waterborne enteric pathogens, the life cycle of Blastocystis contains a cyst form, which is responsible for its transmission via the faecal-oral route. The cysts of Blastocystis are 3 to 5 μm in size and have been reported to be resistant to levels of chlorine used during drinking water treatment (Leelayoova et al., 2004). There is little information available on the removal and/or inactivation of Blastocystis by drinking water treatment processes. As the cyst size of Blastocystis is very similar to the size of Cryptosporidium oocysts, it is expected that drinking water filtration should remove these cysts in a similar manner. No published information was found regarding UV disinfection.
Appendix B: Selected outbreaks related to Giardia and Cryptosporidium
| Date | Location | Causative agent | Scope of outbreak | Attributable causes | References |
|---|---|---|---|---|---|
| Mar 20 – Apr 26, 2001 | North Battleford, SK | Cryptosporidium | 25 laboratory confirmed; 5,800 – 7,100 people estimated to have been affected |
|
Stirling et al., 2001 |
| Jun 2 – Jul 12, 1996 | Cranbrook, BC | Cryptosporidium | 29 laboratory-confirmed; 107 clinical; estimated 2,000 cases |
|
BCCDC, 1996; Ong et al., 1997, 1999 |
| Feb – May 1994 | Temagami, ON | Giardia | 26 laboratory-confirmed; between 160 and 330 clinical |
|
Wallis et al., 1998 |
| Feb – May 1993 | Kitchener-Waterloo, ON | Cryptosporidium | 143 laboratory-confirmed |
|
Pett et al., 1993; Welker et al., 1994 |
| Jan – Apr 1990 | Creston & Erikson, BC | Giardia | 124 laboratory-confirmed |
|
Isaac-Renton et al., 1993, 1994 |
| Jun – Aug, Nov 1986 | Penticton, BC | Giardia | 362 laboratory-confirmed 3,100 estimated cases |
|
Moorehead et al., 1990 |
| Nov – Dec 1985 | Creston, BC | Giardia | 83 laboratory-confirmed |
|
Isaac-Renton et al., 1993 |
Table B.1 footnotes
- Table B.1 footnote a
-
These represent well-documented outbreaks.
| Cause of outbreak | Contributing factors | References |
|---|---|---|
| Groundwater contamination |
|
Brady & Wolfe (1974); CDC (1977a); Craun (1979); Herwaldt et al., 1992; Moore et al., 1993; Kramer et al., 1996; Solo-Gabriele & Neumeister, 1996; Craun et al., 1998; Furtado et al., 1998; Levy et al., 1998; Simth & Rose, 1990; Barwick et al., 2000; CDR, 2001; Howe et al., 2002; Lee et al., 2002; Liang et al., 2006; HPSC, 2007 |
| Surface water contamination |
|
Meyer (1973); CDC 1975; Barbour et al., 1976; CDC (1977a,b); CDC (1978); Craun (1979); Hopkins et al., 1985; Wallis, 1987; Bryck et al., 1988; Erlandsen & Bemrick, 1988; Kent et al., 1988; McClure & McKenzie, 1988; Birkhead et al., 1989; Moorehead et al., 1990; Richardson et al., 1991; Herwaldt et al., 1992; Isaac-Renton et al., 1994; CDR, 1996; Solo-Gabriele & Neumeister, 1996; Wallis et al., 1996; Craun et al., 1998; Furtado et al., 1998; Levy et al., 1998; Hunter, 1999; Barwick et al., 2000; Wallis et al., 2001; Jennings & Rhatigan (2002); Nygård et al., 2006; Nichols et al., 2006; Pelly et al., 2007; Mason et al., 2010; Chalmers et al., 2010; Widerström et al., 2014; Andersson et al., 2014; Guzman-Herrador et al., 2015; DeSilva et al., 2016 |
| Inadequate TreatmentTable B.2 footnote b |
|
Vernon, 1973; CDC, 1977b; CDC, 1978; Kirner et al., 1978; Craun, 1979; CDC, 1980; Hopkins et al., 1985; Navin et al., 1985; Erlandsen & Bemrick, 1988; Birkhead et al., 1989; Herwaldt et al., 1992; Moore et al., 1993; MacKenzie et al., 1994; Kramer et al., 1996; Solo-Gabriele & Neumeister, 1996; Pozio et al., 1997; Craun et al., 1998; Furtado et al., 1998; Levy et al., 1998; Perez et al., 2000; CDR, 2001; Stirling et al., 2001; Lee et al., 2002; Webber et al., 2002; O'Toole et al., 2004; |
| Distribution system issues |
|
Starko et al., 1980; Weniger et al., 1983; Jephcott et al., 1986; Neringer et al., 1987; Smith et al., 1989; Bell et al., 1991; Moore et al., 1993; Kramer et al., 1996; Craun et al., 1998; Kuroki et al., 1996; Barwick et al., 2000; Glaberman et al., 2002; Lee et al., 2002; Dalle et al., 2003; Chalmers (2012); Hilborn et al., 2013; Moon et al., 2013; Braeye et al., 2015 |
Table B.2 footnotes
- Table B.2 footnote - a
-
Based on reviews by Schuster et al., 2005, Karanis et al., 2007, Moreira and Bondelind, 2017, Efstratiou et al., 2017
- Note de bas de tableau B.2 - b
-
Includes only outbreaks where a problem was reported with the current treatment system. Systems where no treatments were applied (e.g. non-filtered systems) were included elsewhere.
Appendix C: List of acronyms
- AIDS
- acquired immunodeficiency syndrome
- ANSI
- American National Standards Institute
- CT
- concentration × time
- DALY
- disability-adjusted life year
- DAPI
- 4′,6-diamidino-2-phenylindole
- DBP
- disinfection by-product
- DIC
- differential interference contrast
- DNA
- deoxyribonucleic acid
- EPA
- Environmental Protection Agency (U.S.)
- FACS
- fluorescently activated cell sorting
- FISH
- fluorescence in situ hybridization
- GUDI
- groundwater under the direct influence of surface water
- HCT-8
- human ileocaecal adenocarcinoma (cell line)
- HIV
- human immunodeficiency virus
- ID50
- median infective dose
- IFA
- immunofluorescence assay
- IFN
- interferon (e.g., IFN-γ)
- Ig
- immunoglobulin (e.g., IgA, IgG, IgM)
- IL
- interleukin (e.g., IL-12)
- IMS
- immunomagnetic separation
- LT1ESWTR
- Long Term 1 Enhanced Surface Water Treatment Rule (U.S.)
- LT2ESWTR
- Long Term 2 Enhanced Surface Water Treatment Rule (U.S.)
- LYL
- life years lost
- MPA
- microscopic particulate analysis
- mRNA
- messenger ribonucleic acid
- NOM
- natural organic matter
- NSF
- NSF International
- NTU
- nephelometric turbidity unit
- PCR
- polymerase chain reaction
- PI
- propidium iodide
- QMRA
- quantitative microbial risk assessment
- qPCR
- quantitative polymerase chain reaction
- RBF
- riverbank filtration
- RFLP
- restriction fragment length polymorphism
- rRNA
- ribosomal ribonucleic acid
- RO
- reverse osmosis
- RT-PCR
- reverse transcriptase polymerase chain reaction
- SCC
- Standards Council of Canada
- T10
- the detention time at which 90% of the water passing through the unit is retained within the basin
- UF
- ultrafiltration
- UV
- ultraviolet
- WHO
- World Health Organization
- YLD
- years lived with disability