
Household food insecurity in Canada statistics and graphics
(2011 to 2012)
Find the main statistics and graphics on household food insecurity in Canada, from 2011 to 2012.
On this page
- Canadian Community Health Survey
- Number of people living in food insecure households
- Household food insecurity numbers
- Breakdown of demographic numbers
- Prevalence in the provinces and territories
- Copyright guidelines
- For more information
Canadian Community Health Survey
The listed statistics are not directly comparable to those from the Canadian Community Health Survey Cycle 2.2., Nutrition (2004). This is because of differences in survey methodology, such as the:
- subject matter of the survey
- proportion of in-person versus telephone interviews
Some reports from other sources in Canada include the experience of marginal food insecurity within the food insecurity classification. Our prevalence estimates of food insecurity don't include marginal food insecurity. So, the statistics gathered using the Household Food Security Survey Module are not directly comparable to the estimates from these other sources.
Number of people living in food insecure households
We ensured that estimates are representative of the Canadian population aged 12 years and older. So, survey weights were used to determine the number of people living in food insecure households.
From 2011 to 2012, 2.19 million people in Canada aged 12 and older lived in food-insecure households. Of these people:
- 1,415,000 adults and 180,900 children aged 12 to 17 lived in households with moderate food insecurity
- 545,300 adults and 49,900 children aged 12 to 17 lived in households with severe food insecurity
Food insecurity among children
Food insecurity status of children is determined based on responses to the 8-item child scale. In 2011 to 2012, 119,800 children aged 12 to 17 lived in households with food insecurity and were food insecure. Of that amount, 11,700 were severely food insecure.
Household food insecurity numbers
Canadian households are either food secure or insecure.
Food secure
Between 2011 and 2012, 91.6% of Canadian households were food secure. At all times throughout the year, these households had access to enough food for members to have an active, healthy life.
Food insecure
Between 2011 and 2012, 8.4% (1,098,900) of Canadian households were food insecure. Depending on the extent of the experience, food insecure households were either moderately food insecure or severely food insecure.
These households were sometimes uncertain of having, or unable to acquire, enough food to meet the needs of all members. This is because they had insufficient money for food. In these households, at times, food insecurity was experienced by:
- both adults and children
- adults or children (if present)
Moderately food insecure
Of Canadian households, 5.8% (760,100) were moderately food insecure. These households had indication of compromise in quality and/or quantity of food consumed.
Severely food insecure
Of Canadian households, 2.6% (338,700) were severely food insecure. These households had indication of reduced food intake and disrupted eating patterns.
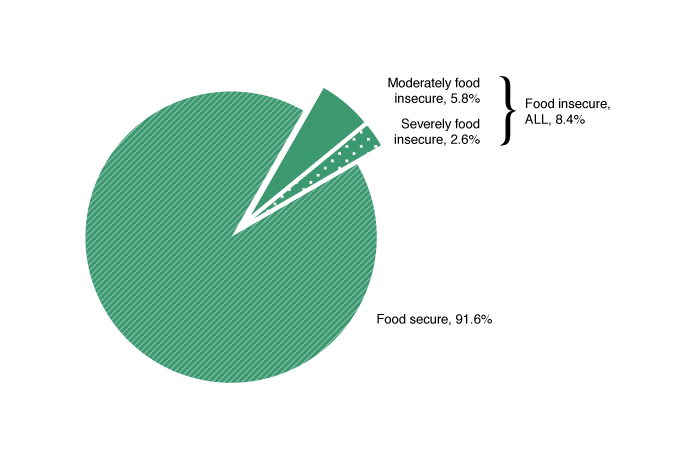
Figure 1. Household food insecurity in Canada, 2011-2012.
Source: Health Canada
Data Source: Statistics Canada, Canadian Community Health Survey (CCHS), 2011-2012 - Share File, Household Weights
Figure 1 - Text description
This pie chart shows the prevalence of household food insecurity in Canada, from 2011 to 2012, where:
- 91.6% of households were food secure
- 8.4% of households were food insecure
- 5.8% of households were moderately food insecure
- 2.6% of households were severely food insecure
Breakdown of demographic numbers
The characteristics chosen to reflect the household demographic breakdown include:
Composition
In Canada, the overall prevalence of food insecurity was higher in households with children (10.2%) than in households without children (7.6%). Households with children had at least 1 household member aged 17 years or younger.
In households with children, the prevalence of household food insecurity was higher in households:
- with 3 or more children (13.4%) compared with 1 or 2 children (9.6%)
- led by female lone parents (25%) compared to:
- households led by male lone parents (11.8%)
- this is data with a coefficient of variation from 16.6% to 33.3%, so interpret with caution
- households led by couples (6.9%)
- households led by male lone parents (11.8%)
In households with children, the prevalence of severe food insecurity was 6 times greater in households led by female lone parents (7.9%) than households led by couples (1.2%).
Among households without children, the prevalence of food insecurity was higher for unattached individuals (11.6%) than for couples (3.6%). Households without children didn't have any household members aged 17 years or younger.
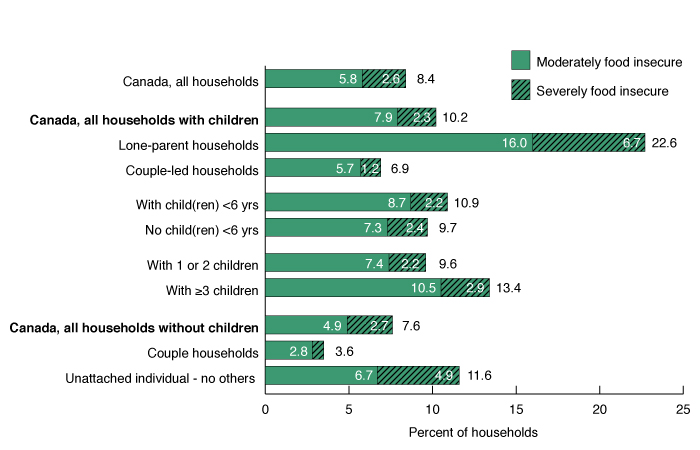
Figure 2. Household food insecurity in Canada by household composition, 2011 to 2012.
Source: Health Canada
Data Source: Statistics Canada, Canadian Community Health Survey (CCHS), 2011-2012 - Share File, Household Weights
Figure 2 - Text description
This bar graph shows the prevalence of household food insecurity in Canada between 2011 and 2012. The statistics are based on household composition (all households with children and without children). Of all the households:
- 8.4% were food insecure
- 5.8% were moderately food insecure
- 2.6% were severely food insecure
- with children, 10.2% were food insecure
- 7.9% were moderately food insecure
- 2.3% were severely food insecure
Among households with children:
- 22.6% of lone-parent households were food insecure
- 16% were moderately food insecure
- 6.7% were severely food insecure
- 6.9% of couple-led households were food insecure
- 5.7% were moderately food insecure
- 1.2% were severely food insecure
- 10.9% of households with at least 1 child younger than 6 years old were food insecure
- 8.7% were moderately food insecure
- 2.2% were severely food insecure
- 9.7% of households with no children younger than 6 years old were food insecure
- 7.3% were moderately food insecure
- 2.4% were severely food insecure
- 9.6% of households with 1 or 2 children were food insecure
- 7.4% were moderately food insecure
- 2.2% were severely food insecure
- 13.4% of households with 3 or more children were food insecure
- 10.5% were moderately food insecure
- 2.9% were severely food insecure
Among households without children:
- 7.6% were food insecure
- 4.9% were moderately food insecure
- 2.7% were severely food insecure
- 3.6% of couple households were food insecure
- 2.8% were moderately food insecure
- 0.7% were severely food insecure
- 11.6% of households of unattached individuals were food insecure
- 6.7% were moderately food insecure
- 4.9% were severely food insecure
Income
At the national level, the prevalence of food insecurity decreased from the first (lowest) household income distribution decile to the tenth (highest).
The income distribution reflects a distribution of respondents in deciles. The deciles are based on the adjusted ratio of the respondents' total household income. These have been adjusted to the low income cutoff corresponding to their household and community size.
For each respondent, the ratio provides a relative measure of their household income to the household incomes of all other respondents. This income distribution is divided into 10 equal parts so that each part represents 1/10 of the sample or population. These equal parts are referred to as decile 1, decile 2 and so on.
In the first decile, more than 2 out of 5 (41.2%) food insecure households were considered severely food insecure. The relative proportion of severe food insecurity among food insecure households decreased with increasing household income distribution decile.
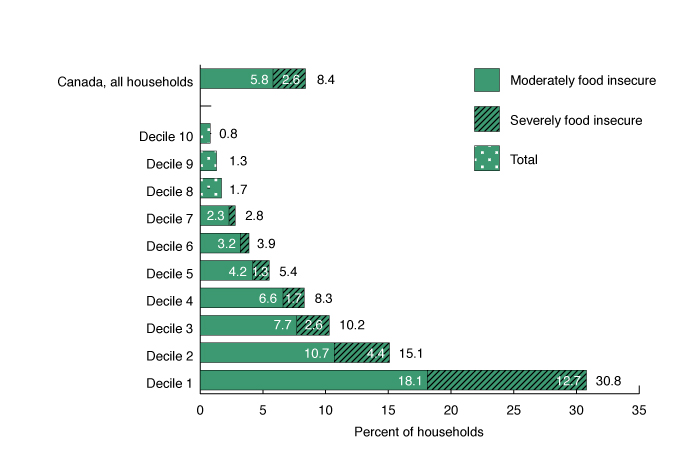
Figure 3. Household food insecurity in Canada by household income distribution decileFigure 3 note 1, excluding territories, 2011 to 2012.
Source: Health Canada
Data Source: Statistics Canada, Canadian Community Health Survey (CCHS), 2011-2012 - Share File, Household Weights
Figure 3 - Text description
This bar graph shows the prevalence of household food insecurity in Canada between 2011 and 2012 by income distribution decile. The territories were not included in the statistics provided.
Of all the households, 8.4% were food insecure. This included 5.8% that were moderately food insecure and 2.6% that were severely food insecure.
Food insecurity occurred in:
- 0.8% of the households in the tenth income distribution decile
- 1.3% of the households in the ninth household distribution decile
- 1.7% of the households in the eighth income distribution decile
- 2.8% of the households in the seventh income distribution decile
- 2.3% were moderately food insecure
- 0.5% were severely food insecure
- this is data with a coefficient of variation from 16.6% to 33.3%, so interpret with caution
- 3.9% of the households in the sixth income distribution decile
- 3.2% were moderately food insecure
- 0.7% were severely food insecure
- 5.4% of the households in the fifth income distribution decile
- 4.2% were moderately food insecure
- 1.3% were severely food insecure
- 8.3% of the households in the fourth income distribution decile
- 6.6% were moderately food insecure
- 1.7% were severely food insecure
Food insecurity also occurred in:
- 10.2% of the households in the third income distribution decile
- 7.7% were moderately food insecure
- 2.6% were severely food insecure
- 15.1% of the households in the second income distribution decile
- 10.7% were moderately food insecure
- 4.4% were severely food insecure
- 30.8% of the households in the first income distribution decile
- 18.1% were moderately food insecure
- 12.7% were severely food insecure
Main source of household income
Food insecurity was more prevalent in households in which the main source of household income was:
- social assistance (58.3%)
- worker's compensation or employment insurance (26%)
This is compared to households with other main sources of income.
Severe food insecurity (29.1%) was as common as moderate food insecurity (29.1%) where social assistance was the main source of household income.
Households with salary/wages (6.8%) and those with pensions/seniors' benefits (4.9%) as their main source of income experienced lower rates of food insecurity.
Highest level of education attained
The prevalence of food insecurity was lower with post-secondary graduation as the highest level of education achieved in the household (6.4%). This is compared to those with:
- some post-secondary education (16.9%)
- secondary graduation (11.6%)
- less than secondary graduation (16.1%)
These statistics refer to the highest level of education achieved by any member of the household.
Aboriginal status
Among off-reserve Aboriginal households, 22.3% were food insecure, including 8.4% with severe food insecurity. These rates are approximately 3 times higher than among non-Aboriginal households where 7.6% were food insecure. Of this number, 2.4% of households had severe food insecurity.
An affirmative response to the question 'Are you Aboriginal (North American Indian, Métis, Inuit)?' was used to identify Aboriginal respondents. This therefore identified Aboriginal households. It's recognized, however, that other members of the household may not necessarily self-identify as being of Aboriginal cultural or racial background.
Immigrant status
The prevalence of household food insecurity was higher among recent immigrant households (10.9%) compared to non-recent immigrant households (7.6%).
An affirmative response to Statistics Canada's original indicator variable on immigrant status was used to identify immigrant respondents. This was used to identify immigrant households. The indicator variable is based on a respondent's country of birth and Canadian citizenship at birth. Recent was defined as less than 5 years in Canada.
Home ownership
Not owning a dwelling was related to higher rates of food insecurity. In this situation, 18.7% of households were considered food insecure, compared to 3.7% of households where the dwelling was owned.
Area of residence
Overall, households in urban areas had a higher prevalence of food insecurity (8.7%) than those in rural areas (6.6%).
Urban areas are continuously built-up areas. They have a population concentration of 1,000 or more and a population density of 300 or more per square kilometre. This is based on current census population counts. All other areas are considered rural.
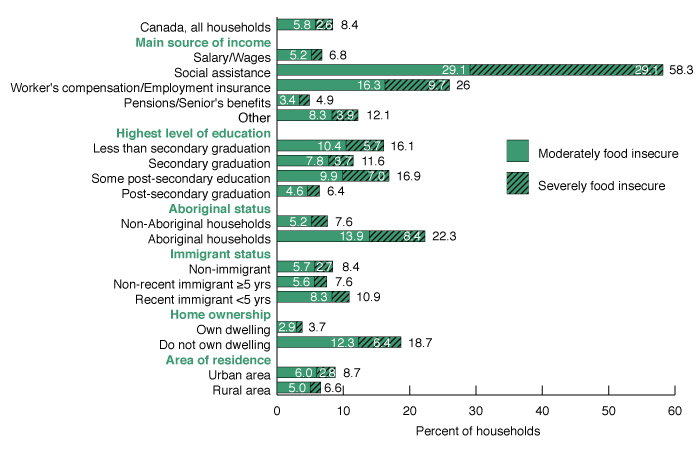
Figure 4. Household food insecurity in Canada by selected socio-demographic characteristics, 2011 to 2012.
Source: Health Canada
Data Source: Statistics Canada, Canadian Community Health Survey (CCHS), 2011-2012 - Share File, Household Weights
Figure 4 - Text description
This bar graph shows the prevalence of household food insecurity in Canada from 2011 to 2012. It's based on selected socio-demographic characteristics, including:
- the main source of income
- the highest level of education
- Aboriginal status
- immigrant status
- home ownership
- area of residence
Of all households, 8.4% were food insecure, where:
- 5.8% were moderately food insecure
- 2.6% were severely food insecure
Based on the main source of income:
- 6.8% of households whose main source of income is salary/wages were food insecure
- 5.2% were moderately food insecure
- 1.6% were severely food insecure
- 58.3% of households whose main source of income is social assistance were food insecure
- 29.1% were moderately food insecure
- 29.1% were severely food insecure
- 26% of households whose main source of income is worker's compensation/employment insurance were food insecure
- 16.3% were moderately food insecure
- 9.7% were severely food insecure
- 4.9% of households whose main source of income is pensions/seniors' benefits were food insecure
- 3.4% were moderately food insecure
- 1.5% were severely food insecure
- 12.1% of households who had other main sources of income were food insecure
- 8.3% were moderately food insecure
- 3.9% were severely food insecure
Based on the highest level of education achieved in the household:
- 16.1% of households with less than secondary graduation were food insecure
- 10.4% were moderately food insecure
- 5.7% were severely food insecure
- 11.6% of households with secondary graduation were food insecure
- 7.8% were moderately food insecure
- 3.7% were severely food insecure
- 16.9% of households with some post-secondary graduation were food insecure
- 9.9% were moderately food insecure
- 7% were severely food insecure
- 6.4% of households with post-secondary graduation were food insecure
- 4.6% were moderately food insecure
- 1.8% were severely food insecure
Based on Aboriginal status:
- 7.6% of non-Aboriginal households were food insecure
- 5.2% were moderately food insecure
- 2.4% were severely food insecure
- 22.3% of Aboriginal households were food insecure
- 13.9% were moderately food insecure
- 8.4% were severely food insecure
Based on immigrant status:
- 8.4% of non-immigrant households were food insecure
- 5.7% were moderately food insecure
- 2.7% were severely food insecure
- 7.6% of non-recent immigrant households (equal to or greater than 5 years) were food insecure
- 5.6% were moderately food insecure
- 1.9% were severely food insecure
- 10.9% of recent immigrant households (less than 5 years) were food insecure
- 8.3% were moderately food insecure
- 2.6% were severely food insecure
- this is data with a coefficient of variation from 16.6% to 33.3%, so interpret with caution
Based on home ownership:
- 3.7% of households who own their dwelling were food insecure
- 2.9% were moderately food insecure
- 0.9% were severely food insecure
- 18.7% of households who do not own their dwelling were food insecure
- 12.3% were moderately food insecure
- 6.4% were severely food insecure
Based on area of residence:
- 8.7% of households who reside in an urban area were food insecure
- 6% were moderately food insecure
- 2.8% were severely food insecure
- 6.6% of households who reside in a rural area were food insecure
- 5% were moderately food insecure
- 1.6% were severely food insecure
Prevalence in the provinces and territories
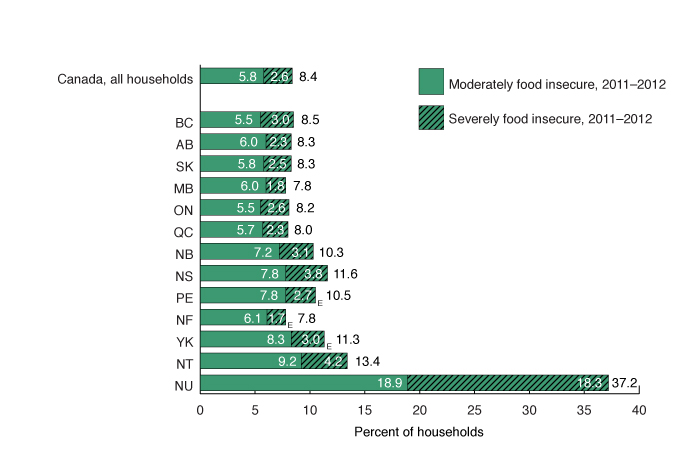
Household food insecurity in the provinces ranged from 7.8% in Manitoba and Newfoundland to 11.6% in Nova Scotia.
In the territories, the prevalence of food insecurity was:
- 11.3% in the Yukon
- 13.4% in the Northwest Territories
- 37.2% in Nunavut
- In Nunavut, because of operational difficulties inherent to remote locales, only the largest communities are covered by the survey. This includes:
- Arviat
- Iqaluit
- Igloolik
- Kugluktuk
- Pond Inlet
- Baker Lake
- Pangnirtung
- Rankin Inlet
- Cape Dorset
- Cambridge Bay
- In Nunavut, because of operational difficulties inherent to remote locales, only the largest communities are covered by the survey. This includes:
Food insecurity was higher than the national average in Nova Scotia, New Brunswick and all the territories. The rate of food insecurity in the other provinces was similar to the national average.
Figure 5. Household food insecurity by province and territory, 2011 to 2012.
Source: Health Canada
Data source: Statistics Canada, Canadian Community Health Survey (CCHS), 2011-2012 - Share File, Household Weights
Figure 5 - Text description
This bar graph shows the prevalence of household food insecurity in Canada between 2011 and 2012 for all provinces and territories.
For all households:
- 8.4% were food insecure
- 5.8% were moderately food insecure
- 2.6% were severely food insecure
In British Columbia, 8.5% of all households were food insecure, with:
- 5.5% that were moderately food insecure
- 3% that were severely food insecure
In Alberta, 8.3% of all households were food insecure, with:
- 6% that were moderately food insecure
- 2.3% that were severely food insecure
In Saskatchewan, 8.3% of all households were food insecure, with:
- 5.8% that were moderately food insecure
- 2.5% that were severely food insecure
In Manitoba, 7.8% of all households were food insecure, with:
- 6% that were moderately food insecure
- 1.8% that were severely food insecure
In Ontario, 8.2% of all households were food insecure, with:
- 5.5% that were moderately food insecure
- 2.6% that were severely food insecure
In Quebec, 8% of all households were food insecure, with:
- 5.7% that were moderately food insecure
- 2.3% that were severely food insecure
In New Brunswick, 10.3% of all households were food insecure, with:
- 7.2% that were moderately food insecure
- 3.1% that were severely food insecure
In Nova Scotia, 11.6% of all households were food insecure, with:
- 7.8% that were moderately food insecure
- 3.8% that were severely food insecure
In Prince Edward Island, 10.5% of all households were food insecure, with:
- 7.8% that were moderately food insecure
- 2.7% that were severely food insecure
- this is data with a coefficient of variation from 16.6% to 33.3%, so interpret with caution
In Newfoundland and Labrador, 7.8% of all households were food insecure, with:
- 6.1% that were moderately food insecure
- 1.7% that were severely food insecure
- this is data with a coefficient of variation from 16.6% to 33.3%, so interpret with caution
In the Yukon, 11.3% of all households were food insecure, with:
- 8.3% that were moderately food insecure
- 3% that were severely food insecure
- this is data with a coefficient of variation from 16.6% to 33.3%, so interpret with caution
In the Northwest Territories, 13.4% of all households were food insecure, with:
- 9.2% that were moderately food insecure
- 4.2% that were severely food insecure
In Nunavut, 37.2% of all households were food insecure, with:
- 18.9% that were moderately food insecure
- 18.3% that were severely food insecure
Copyright guidelines
Ensure that the Health Canada Copyright Guidelines are adhered to when using data and graphs from this webpage.
For more information
Detailed summary data tables on household food insecurity in Canada from 2011 to 2012 are available. You can order them from Health Canada's Office of Nutrition Policy and Promotion.