
Canadian Computed Tomography Survey - National Diagnostic Reference Levels
Contents
- Acknowledgements
- Executive Summary
- 1.0 Introduction
- 2.0 Survey Design and Implementation
- 3.0 Results
- 4.0 Discussion
- 5.0 Conclusions
- Appendix A - Samples of CT Survey Booklet Templates
- Appendix B - General Summary of Data Pools Used in Analysis (Individual Patient Sequences)
- Appendix C - Group/Sub-Group Individual Patient Data Summary Tables: Patient Characteristics and Dose Indices
- References - General
- References - Adult and Pediatric DRLs
Acknowledgements
This report was prepared by Graeme M. Wardlaw, PhD and Narine Martel, MSc of the Medical Imaging Division, Consumer and Clinical Radiation Protection Bureau (CCRPB), Health Canada (HC).
Sincere appreciation is extended to all organizations and individuals named below whose time and effort helped shape and support the Canadian Computed Tomography (CT) Survey. A special thank you is extended to all individual healthcare facility staff that helped collect CT equipment and examination data.
Development of electronic database and transposition of survey booklets into electronic format:
Data Analysis and Information System (DAIS) Team, Applied Research Analysis Directorate (ARAD), Health Canada

Download the alternative format
(PDF format, 2.86 MB, 122 pages)
Organization: Health Canada
- Jean-Francois Asselin
- William Blackler
- Nakissa Monemjou
- Lysa Buder
- Terhas Ghebretecle
- Mylène Given
- Roger Baan
- Anthony Bertrand
- Nicholas Schmitz-Hertzberg
- Carolane Daoust-Séguin
- Amy Rose
Sharing of United Kingdom (UK) survey template:
- Paul Shrimpton (Public Health England, PHE, formerly National Radiological Protection Board, UK)
Lead contacts/survey management teams in participating provinces and territories:
- Shirley Wong, Katherine Krystalowich, Kirk Eaton, Melissa Murdock (Ministry of Health, British Columbia) and Yogesh Thakur (Vancouver Coastal Health, British Columbia)
- Gary Hughes (Alberta Jobs, Skills, Training and Labour) and Marlene Stodgell-O'Grady (Alberta Health Services)
- Karen Giling, Tanya Solberg, Tracey Justason (Yukon Hospital Corporation, Yukon Territory)
- Gloria Badari, Cheryl Case and Liam Riordan (Stanton Territorial Health Authority, Northwest Territories)
- Rita Coshan, Megan Hunt and Steve Webster (Ministry of Labour Relations and Workplace Safety, Saskatchewan), Deborah Jordan, Patrick Au and Luke Jackiw (Ministry of Health, Saskatchewan),
- Theresa Mrozek (Cancer and Diagnostic Services, Manitoba), Ingvar Fife and Idris Elbakri (CancerCare Manitoba)
- Vasanthi Srinivasan, Nancy Kennedy, Sean Court, Anna Greenberg, Sheree Davis, Kelci Gershon, Paramjit Kaur, Payal Kapur, Mark Schroter, Natalie Kaiman, Chloe Macrae, and Christy Pentland (Ministry of Health and Long-term Care Ontario)
- Manon Rouleau and Renald Lemieux (Centre d'Expertise Clinique en Radioprotection, Québec), Patricia Gauthier (Centre hospitalier universitaire de Sherbrooke, Québec)
- Denis Allard, Scott Maclean and Eshwar Kumar (Department of Health, New Brunswick)
- Sandra Christie, Nancy Delaney and Suzanne Rhodenizer-Rose (Department of Health and Wellness, Nova Scotia)
- Bruce Cooper and Lesley Rogers (Department of Health and Community Services, Newfoundland and Labrador)
- Doug Currie, Joe Bradley (Department of Health and Wellness, Prince Edward Island) and Michelle Cottreau (Health PEI)
Other collaborators, and groups involved in survey promotion:
- Canadian Association of Radiologists (CAR)
- Canadian Association of Medical Radiation Technologists (CAMRT)
- Canadian Organization of Medical Physicists (COMP) & COMP Imaging Committee
- Thorarin Bjarnason, PhD, MCCPM and Santanu Chakraborty, MD, FRCPC (Radiation Protection Working Group, CAR)
- Nishard Abdeen, MD, FRCPC (Children's Hospital of Eastern Ontario, CHEO)
- Robert Chatelain, MRT (R) CTIC and Gary Heddon MRT (R) AC (The Ottawa Hospital, Ontario, TOH)
- General & Restorative Devices Division, Medical Devices Bureau, HC
- Karen Thomas, MD, FRCPC (Hospital for Sick Children, Ontario, SickKids)
Support for Figures and Tables
- Laura Close, Radiation Protection Bureau, HC
Survey Distribution Assistance
- Marie-France Gordian, CCRPB, HC
Executive Summary
This report summarizes the results of the first Canadian Computed Tomography (CT) Survey and provides national Diagnostic Reference Levels (DRLs) for CT imaging in Canada.
CT is a valuable x-ray imaging tool in medicine, providing information that supports the diagnosis, treatment, and monitoring of patients. In Canada, the number of CT scanners and the number of CT examinations performed has increased by approximately 41% and 57% respectively from 2004/2005 to 2011/2012. Over the same period, the rate of CT examinations per 1000 population increased steadily from 87.3 to 125.5, an increase of nearly 44%. While the clinical applications of CT equipment and their benefits to patients are significant, there is increased global focus on the need to carefully manage radiation exposures from CT imaging, as radiation doses from CT examinations are in general, higher than those from most other medical x-ray imaging examinations.
An internationally recognized approach to radiation protection of patients, recommended by the International Commission on Radiological Protection (ICRP), is the establishment and use of DRLs. DRLs are dosimetric indicators, established from surveys of imaging practice and provide guidance to help manage dose and promote optimization, so that the applied dose is appropriate for a given clinical need.
The primary goal of the Canadian CT Survey was to collect CT dose index data in order to establish national DRLs for commonly performed CT examinations of adults and pediatric patients. The survey was conducted using a highly collaborative approach between Health Canada, provincial and territorial governments as well as medical associations and other healthcare professionals who helped shape the survey, and promoted survey participation.
Overall participation was high and resulted in data collection from approximately 75% of all CT scanners in Canada from every province and territory having CT equipment. This provided data from 18 985 individual patient CT examinations and 24 280 CT imaging sequences. National DRLs were determined for seven commonly performed CT imaging examinations: Adult Head, Chest, Abdomen/Pelvis, and Chest/Abdomen/Pelvis, and Pediatric Head, Chest, and Abdomen. In addition, the survey data provides insights into the heterogeneity of CT imaging practice as well as some of the factors affecting radiation output from CT equipment.
The National CT Survey provides a current snap-shot of CT equipment technology and CT imaging practices in Canada. The national DRLs will help promote optimization of CT clinical protocols in Canada and ultimately contribute to national and international efforts to minimize medical exposures to ionizing radiation from CT.
1.0 Introduction
Computed Tomography (CT) is a medical imaging modality using specialized x-ray equipment to produce cross sectional and three-dimensional images of internal structures of the human body. It is a valuable tool in medicine, providing information that supports the diagnosis, treatment and management of patients. As CT technology has advanced, the number of medical applications of CT imaging has increased, along with increased availability and use of CT equipment Footnote A-1,Footnote A-2. This has led to increased global attention to patient radiation exposures from CT imaging.
In Canada, there has been a continuous increase in the number of CT scanners and CT examinations performed over the past 25 years. The Canadian Institute for Health Information (CIHI) has reported that in 2011/2012, there were 510 CT scanners in Canada and approximately 4.4 million examinations performed. This represents an approximate 41% increase in the number of CT scanners and 57% increase in the number of CT examinations since 2004/2005. Over the same period, the rate of CT examinations per 1000 population increased steadily from 87.3 to 125.5, an increase of nearly 44% Footnote A-3,Footnote A-4.
While the benefits of CT imaging in the delivery of healthcare are significant, there is increased international attention on the need to appropriately manage ionizing radiation exposures in CT. CT technology has advanced very quickly from first generation machines, to modern CT units which are capable of very rapidly scanning large volumes of the body resulting in relatively large exposures per exam when compared to planar radiography. In fact, a recent report of the United Nations Scientific Committee on the Effects of Atomic Radiation (UNSCEAR) indicated that, in many countries, radiation doses from CT examinations will make the largest contribution to population dose from man-made exposures Footnote A-5. This is likely in large part due to the increased availability and use of CT equipment, and relatively larger exposures per exam Footnote A-1,Footnote A-2,Footnote A-6.
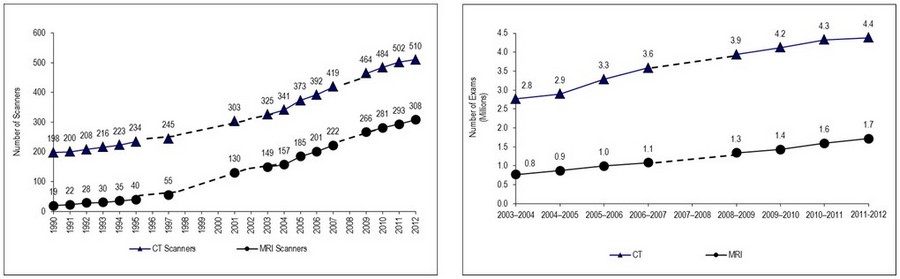
Figure 1 - Text Equivalent
Figure is comprised of two, framed, smaller line-plot figures, side by side, each with horizontal or x-axis representing year, increasing to right. Left figure vertical or y-axis represents number of Computed Tomography (CT) scanners in country - this shows an increasing number of scanners from 198 scanners in 1990, peaking at last data point of 512 scanners in 2012. The increase is gradually steeper in slope, but indicates a decrease in slope near peak value. The right figure vertical axis represents number of CT examinations performed in Canada, in millions. This shows a relatively linear increase in number of examinations - from approximately 2.8 million in 2003/2004 to 4.4 million in 2011/2012. In each of the figures similar, increasing plots for magnetic resonance imaging scanners and examinations are given, but are not the focus of this document. End of description.
Mitigating patient exposure risk in CT imaging focuses on two general principles: justification and optimization. Justification of imaging examinations ensures that only medically necessary examinations are carried out. Optimization involves the management of CT examinations such that the lowest possible dose of radiation is applied for a given clinical need. Application of these principles is especially important in pediatric CT examinations given the increased sensitivity of children's tissues to ionizing radiation. Recommendations from initiatives such as Image Gently Footnote A-7 have been particularly successful in bringing attention to pediatric CT dose optimization. Other initiatives such as Image Wisely Footnote A-8 have focused attention on optimization of adult x-ray imaging examinations.
In both pediatric and adult scanning, previous surveys of CT practice have shown that for given CT imaging procedures, wide variations in exposure can exist Footnote A-9 - thus, there is significant potential for optimization and reduction in exposure-risk for CT patients. A widely accepted approach to optimization of medical radiation exposures, recommended by the International Commission on Radiological Protection (ICRP) Footnote A-10,Footnote A-11 and the International Atomic Energy Agency (IAEA) Footnote A-12, is the establishment and use of national, regional and local DRLs.
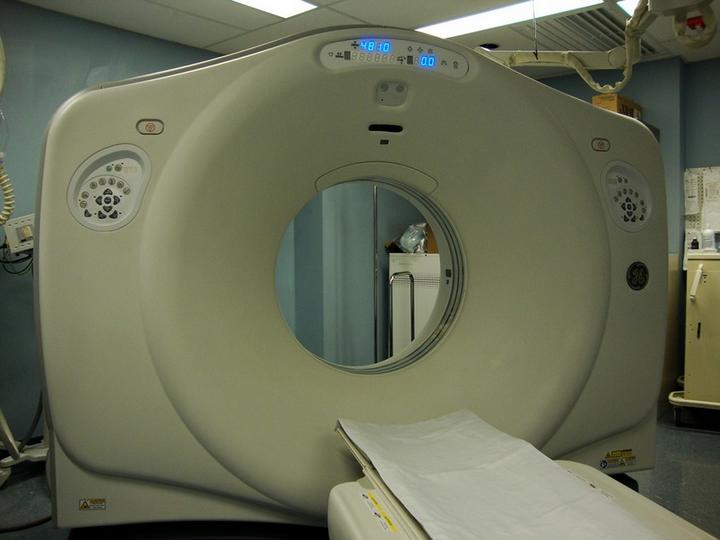
Figure 2 - Text Equivalent
Figure is a photograph of a typical computed tomography (CT) scanner in a hospital room. The scanner is a large unit, roughly square around the outside with buttons and electronic display on outer, front face. There is a circular opening in the centre that extends all the way through to the back side of machine and a moveable bed extending outward from centre of this opening. Bed fits through central opening, with small gap on either side - gives indication that if patient was placed on table and moved through scanner, that there would be a narrow, but comfortable gap between them and inner wall of central opening. End of description.
1.1 Diagnostic Reference Levels (DRLs) And CT Dose Indices
DRLs are used to address potential patient exposure-risk by focusing CT practice. DRLs are dosimetric indicators, established from surveys Footnote A-13 of imaging practice and provide guidance to help manage dose, so that the dose is commensurate with the clinical purpose. They attempt to summarize what would be considered reasonable and good application of the quantity or measure of ionizing radiation and have shown to be an effective measure in reducing patient exposure for frequently used protocols, while allowing clinical staff sufficient latitude to manage clinical needs and maintain diagnostic image quality for the purpose intended Footnote A-14,Footnote A-15. DRLs are not regulatory or punitive limits, and can be exceeded where there is clinical need, but provide thresholds at which reasons for exceeding should be investigated. While DRLs provide an initial target for optimization, it may be possible to acquire images of sufficient clinical quality at doses below DRLs.
DRLs for specific CT examinations and specific patient groups (e.g. adults and children of different sizes) are established based on surveys of dose indices displayed on CT equipment during clinical examinations and are usually taken as the 75th percentile of the dose index distributions. The two most common dose indices for CT are the volume Computed Tomography Dose Index (CTDIvol, units of mGy) and Dose-Length Product (DLP, units of mGy · cm). The displayed CTDIvol and DLP values are both calculated in a standard way across all CT models using plastic polymethylmethacrylate (PMMA) cylindrical phantoms (Figure 3). A 16cm diameter phantom is used to report adult and pediatric head examinations. A 32cm diameter phantom is used to report adult body examinations; however, when reporting pediatric body examinations, vendors may vary the standard phantom size - some use the 16cm and some use the 32cm phantom. Therefore, when reviewing CTDIvol and DLP values in pediatric body scanning the phantom size must be considered.
CTDIvol is a standard indicator of the dose delivered by a given CT scanner corresponding to the selected acquisition settings. This standardized "dose" or output is a weighted measure over the circular area of the central scan plane of the standard PMMA phantoms, and is adjusted for speed of table movement relative to x-ray beam collimation (variable pitch) - it does not represent patient dose. The DLP is calculated by multiplying the CTDIvol by the length of the region scanned, providing a standard indicator of dose to the scan volume - it also does not represent actual individual patient dose. Given that these dose indices represent the radiation output measured directly at the time of the CT examination, they provide a direct means to compare examination protocols and therefore offer the potential for patient dose reduction.
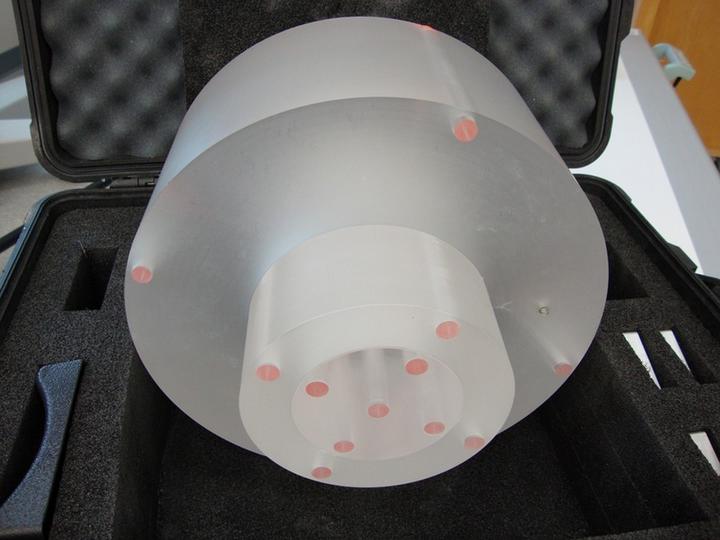
Figure 3 - Text Equivalent
Figure is a photograph of a 15cm long, plastic cylindrical object made up of three, nested sections - an inner 10cm diameter cylinder, middle 16cm diameter ring and an outer 32cm diameter ring. All sections are interlocked to form large 32cm diameter cylinder. Cylinder is called a "phantom" which is used to measure x-ray energy from CT machines in a standardised way that does not expose people. Phantom is shown, propped up in carrying case with circular face showing. End of description.
2.0 Survey Design and Implementation
The primary goal of the CT survey was to collect equipment and dose index data from across Canadian hospitals and clinics which could then be compiled and used to recommend current national DRLs supporting optimization of CT doses. Previous regional or provincial DRL surveys Footnote A-16 to Footnote A-19 have been performed in Canada; however, for this first national level survey it was important that a standard survey design be used to ensure consistency in data collection. The survey itself was adapted from the 2003 CT survey performed in the United Kingdom by the National Radiological Protection Board, now Public Health England Footnote A-20, which was kindly shared with Health Canada (HC).
From the early planning stages of the survey, HC identified and contacted key groups within provincial and territorial governments in order to establish a formal collaborative approach to the national survey. Working collaboratively with the provinces and territories offered important benefits to the survey. First, individual CT facilities would be able to collect their own data for establishing local DRLs. Second, provincial and territorial governments would also be able to collect their own data. Finally, HC would receive national data. Participation in the survey was voluntary, an invitation letter along with a survey participation form was sent to all CT facilities in the country via provincial/territorial collaborators. The provincial/territorial collaborators then informed HC of the number of CT scanners participating in the survey from their region and survey booklets were distributed accordingly.
Efforts were made to promote the survey in order to maximize the participation rate. Promotional information on the survey was prepared by HC and shared with our provincial/territorial collaborators as well as with the Canadian Association of Radiologists (CAR), the Canadian Association of Medical Radiation Technologists (CAMRT) and the Canadian Organization of Medical Physicists (COMP), who then in turn distributed the information to their members.
Survey booklets, one per CT scanner, were distributed across the country to participating facilities. Each survey booklet was uniquely numbered (on all pages to ensure no data loss if booklet pages were removed); however, facility-booklet pair information was blinded during the mass mailing. Only a record of booklet numeric identifiers and quantity mailed out was maintained, leaving no means to link survey data (in booklets) with specific facilities at the national level. In one province, the survey data collection was carried out using electronic data collection format (MS Excel templates), given their previous experience in CT imaging data collection.
The collection period began in late 2012/early 2013 and extended into summer of 2013. Facilities were given approximately 16 weeks to collect data. Some extensions were given where circumstances warranted, but limited as much as reasonably possible. In some cases, regions also started data collection at different times due to availability of local resources and receipt of survey booklets, but were still encouraged to limit data collection to 16 weeks. At all times during the collection period, HC and provincial/territorial collaborators were available to answer questions and support local data collection. Completed survey booklets from each province and territory were returned to the respective provincial/territorial government collaborators, who in turn removed any facility identifying information and submitted the survey booklets to HC.
2.1 Survey Booklets, Standard CT Examinations and Patient Groups
The survey data collection booklets consisted of four (4) sections:
- Section I: Facility and Scanner Information
- Section II: Routine CT protocols (as set on CT equipment)
- Section III: Individual patient examination data
- Section IV: Routine CTDI measurements (optional)
Section I of the survey captured general information on the CT scanner such as the manufacturer, model, maximum detector configuration and availability of dose reduction technology. This section also collected information on the healthcare facility in which the CT scanner is installed; however this information was retained only by provincial/territorial collaborators. No facility identifying information was collected by HC.
Section II of the survey collected information on the routine protocols programmed on CT scanners for defined adult and pediatric patient populations. These protocols were collected for seven standard examination types (anatomical regions), as shown below in Table 1. It was requested that data be collected according to specified clinical indications for each examination type in order to help focus data collection. This is important since, even when the same area of the body is being imaged, different protocols may be required for different clinical indications. During the collection period, some facilities also contacted HC in order to confirm if other indications could be collected for given anatomical regions being surveyed - this was allowed if the additional indications were deemed to have similar technical settings as those given in Table 1.
| Anatomical Region | Clinical Indication |
|---|---|
| Routine Head [Adult] | Headache, Cerebrovascular Accident (CVA), or Transient Ischemic Attack (TIA) |
| Chest [Adult] | Primary cancer, known/suspected metastasis or lung nodule follow-up |
| Abdomen, Pelvis [Adult] | Primary/metastatic work-up or abscess |
| Chest, Abdomen, Pelvis [Adult] | Lymphoma staging, follow-up or Trauma |
| Pediatric Head | Trauma, including non-accidental injury |
| Pediatric Chest | Detection of malignancy, Trauma |
| Pediatric Abdomen | Detection of malignancy, Trauma |
A single CT protocol may consist of one or more scan sequence or phase. Therefore, for each protocol, data was requested describing at least the first two sequences. Information captured for each sequence included a description of the anatomical range scanned and the equipment settings used (e.g. detector configuration, loading factors, scanning mode and console dose indices). For 3rd sequences or higher, only dose index (CTDI and DLP) information was requested.
CT protocols can vary depending on the size of the patient. Again in an effort to focus data collection, the survey collected data only for patients that were considered of "standard" size. Adults were considered to be greater than or equal to 19 years of age and between 50 and 90 kg (average ~70kg). Pediatric patients were considered to be less than or equal to 13 years and typically sized for their age - the aim being to keep pediatric data as unrestricted as possible in order to maximize the sample size.
For the purpose of assessing DRLs, 3 age group bins for pediatric data were chosen to closely resemble the ages of commonly reported pediatric DRL ages and commercially available tissue equivalent or anthropomorphic pediatric dosimetry phantoms (0-1, 5, 10 yrs. and older). As shown in Table 2, during analysis pediatric age bins were selected as 0-3, 3-7, and 7-13 years or target median ages of ~1.5, 5 and 10 years. Of course, children develop rapidly at a young age and it would be advantageous to have a much finer sampling of pediatric age bins for the examination types given; however, this would likely require a larger sample of pediatric patient examination data. Table 3 provides an overall summary of age and mass restrictions of the adult and pediatric survey data.
| Typical Pediatric Reference Ages (yrs.) | Survey Pediatric Age Range (yrs.) |
|---|---|
| 0-1 | 0-3 |
| 5 | 3-7 |
| 10 | 7-13 |
| Anatomical Region | Age (yrs.) | Mass (kg) |
|---|---|---|
| Routine Head [Adult] | ≥ 19 | 50 ≤ X ≤ 90 |
| Chest [Adult] | ≥ 19 | 50 ≤ X ≤ 90 |
| Abdomen, Pelvis [Adult] | ≥ 19 | 50 ≤ X ≤ 90 |
| Chest, Abdomen, Pelvis [Adult] | ≥ 19 | 50 ≤ X ≤ 90 |
| Pediatric Head | 0 < X ≤ 3 | < 50 |
| 3 < X ≤ 7 | ||
| 7 < X ≤ 13 | ||
| Pediatric Chest | 0 < X ≤ 3 | < 50 |
| 3 < X ≤ 7 | ||
| 7 < X ≤ 13 | ||
| Pediatric Abdomen | 0 < X ≤ 3 | < 50 |
| 3 < X ≤ 7 | ||
| 7 < X ≤ 13 |
Section III of the survey gathered information on actual CT examinations performed on clinical patients, since patient scanning may differ from the standard protocols collected in Section II. For each of the standard examinations shown in Table 1, data was requested for at least 15 unique patients. For each sequence of a patient examination, data was collected on the scanned range, equipment settings and the displayed CT dose indices (CTDI and DLP for each sequence and the examination DLP). In addition, generic patient characteristics such as age, mass and body habitus (axial anterior-posterior (AP) and lateral (LAT)) measurements were collected on the patient scanned. The survey did not collect any patient identifiable/re-identifiable information.
Section IV of the survey requested data on actual CTDI measurements performed on the CT equipment using the standard 16cm and 32cm standard PMMA phantoms in order to investigate the relationship between the measured and displayed values of CTDI for each phantom. This section of the survey was made optional to complete as it required time on the CT equipment (when not scanning patients), the availability of the phantoms, dosimetry instrumentation and also the availability of a qualified individual during the timeframe of the survey to perform the measurements.
Page samples of data collection templates for Sections I-IV are shown in Appendix A.
2.2 Survey Database, Data Quality and Pre-processing
A Statistical Package for the Social Sciences (SPSS) (Chicago, SPSS Inc.) database was developed by HC in order to compile the national survey data. A data entry team was responsible for transcription of the survey booklet data into the database. As with any survey of this scale, efforts must be made to optimize data quality. Prior to survey data entry, data entry staff received introductory sessions on CT imaging principles and practical training. The practical component consisted of entering a common training dataset, constructed with purposeful mistakes and omissions. The objective was to familiarize data entry staff with common content and data entry errors that may arise during transcription from booklet to database. Entries from each team member were evaluated on a "cell by cell" basis against the training dataset and were used to identify common mistakes, standardize the data entry process and thereby minimize individual variation/errors. The same feedback mechanism was repeated shortly after entry of actual survey data began and at subsequent periodic intervals (~3-4 months). A vetting regime was also established where data entry staff were required to review each booklet or page (if booklet is extensive) as completed. At all times, a close relationship between data entry staff, database administrator and analyst was maintained to provide additional support for interpretation of complex data or questions of inclusion. Reference tables for data entry staff were also constructed to help summarize common questions/issues as they arose and exclude unnecessary free comments/extraneous information which may have been included in survey booklets. Any instances where specific data fields were not completed in the survey booklets (e.g. missing patient mass) a "not-specified" (NS) or "not-applicable" (NA) marker was entered into the database accordingly.
2.3 Data Review for Consistency and Completeness
Upon completion of data entry, a review was conducted of the large data set to identify and address any data quality issues.
2.3.1 CT Scanner Naming Convention
Among the sample of CT equipment in the database, a verification process was undertaken to ensure that the specific CT scanner models were consistently named. For a given CT scanner model, various modified versions of the model name may be provided by those completing the survey booklets. A standard naming convention was established for vendors and models and applied to the data in order to facilitate filtering during the analysis processes.
2.3.2 Sample Size Optimization and Patient Characteristics
Before data could be analyzed for the determination of the national DRLs, a verification process was undertaken to ensure that all adult and pediatric data was obtained only from patients meeting the pre-defined age and mass restrictions shown in Table 3. For any instance where the patient's age was not provided, the corresponding data was excluded from the analysis; however, in any instance where the age was provided without the patient's mass, efforts were made to use the AP and LAT measures, when provided, to establish criteria for inclusion. Specifically, for a given sequence if the patient AP and LAT measures were within three standard deviations of the group sample mean they were considered similar to others and therefore appropriate to include. The purpose for applying this logical pre-processing of the data was to extend the sample sizes as much as possible in order to maximize the amount of useable data. Consequently, this ensured that all reported individual dose indices (CTDI, DLP) would be originating from data that had at least correlated patient age and mass, or age and AP and LAT measures - many sequences gave more than this minimal information. Individual patient sequence data that gave no age or significantly different body habitus (outside ±3σ) information from the group mean and where mass was not given were eliminated. The following examples illustrate this pre-processing logic:
Example 1: Adult Chest sequence Age = 28 yrs., Mass = 72 kg, AP = n/s, LAT = n/s. This sequence data can be included in Adult Chest group as it meets criteria.
Example 2: Adult Chest sequence Age = 39 yrs., Mass = n/s, AP = 25.1, LAT = 34.8. If only using age and mass as criteria this would be excluded; however, if AP and LAT are within ±3σ of Adult Chest group then it's reasonable to conclude it's "similar" to group and therefore can be included.
2.3.3 CT Practice Heterogeneity: Scan Mode, Contrast and Dose Reduction
The large volume of data collected during the survey presented a significant opportunity to delve into more than simply grouping dose indices (CTDI and DLP) per exam type. For example an important aspect to address was the overall heterogeneity of how given examinations are performed. Are most pediatric head scans performed using axial scanning without contrast? How frequent is dose reduction technology used? In order to filter data at that level, all data that was not specifically labelled as using; (i) axial or helical scanning, (ii) contrast or none (C+ or C-), and (iii) fixed tube current (Fix) or dose reduction (DR) technology had to be confirmed. Thus, custom code VBA (Visual Basic for Applications, MS Excel) templates were developed to score and verify whether an unlabeled sequence was actually axial or helical, C+ or C-, and Fix or DR. The templates searched associated data and comment fields of each individual CT sequence for the presence (or absence) of data that could help confirm the scan mode, contrast use and application of DR technology. While this was primarily targeted at those cases where data was transposed from booklet to database as either NA or NS, algorithms developed also helped uncover a small number of mistakes in previously (and assumed correctly) processed data. Ultimately, the process of verifying the mode of acquisition, the use of contrast and the use of dose reduction techniques permitted the separation of the data, for each standard examination, into 8 subgroups.
2.3.4 Pediatric Reference Phantoms
As outlined in section 1.1, the standard phantom sizes used in reporting pediatric body CTDI vary by vendor. Thus, efforts were made prior to analysis of DRLs to ensure that all pediatric body sequences were consistently reported relative to the standard 32cm body phantom. The survey data collection forms requested that the corresponding reference phantom size (16cm or 32cm) be provided along with pediatric body scanning dose indices. Where the reference phantom size was not provided in the survey booklets, further analysis was performed in order to confirm that the values of the dose indices (CTDI and DLP) provided were reported relative to the 16cm or 32cm standard phantom and to make corrections so that all pediatric body dose indices were reported relative to the 32cm phantom.
The correction approach involved dividing reported pediatric body CTDI values into two distributions (low and high range). The lower range of CTDI values corresponds approximately to the 32cm phantom whereas the higher range of CTDI values roughly correspond to the 16cm phantom - a larger diameter implies a larger volume, therefore less energy deposited per unit volume. Relatively high values could then be flagged and investigated further. With some prior knowledge of vendor preferences, along with data provided per sequence, most high pediatric CTDI body values could be corrected relative to the 32cm phantom. The correction used a simple factor of two since the diameter of the standard 32 versus 16cm phantom differs by a factor of two; however, this is approximate given that beam filtration, shaping filters and other machine settings could make this slightly higher, or lower than two. In the absence of confirmed reference phantoms it was felt this represented an appropriate correction for the purposes of DRLs.
3.0 Results
3.1 CT Equipment Sample
By working closely with provincial and territorial governments and through efforts to promote the survey, a large sample of Canadian facilities was polled. This ensured that the survey provided a representative sample of Canadian adult and pediatric CT examinations, spanning as many equipment vendors, models and provinces/territories as possible. Overall, there was a high level of participation from facilities across Canada. As shown in Table 4, 409 survey booklets were returned to HC and of those, 381 were transposed into a database. This implies that approximately 75% of the 510 CT units reported in Canada were surveyed, providing a large cross-section of vendors and models (Table 5). The 381 booklets (one per CT scanner) ultimately provided 18 985 individual patient samples, corresponding to 24 280 individual scan phases or sequences - 28 booklets were deemed incomplete, or contained insufficient machine and dose index information.
A significant amount of data was also obtained for routine CT protocols as set up on equipment (Section II of the survey); however, this report will focus on patient examination data only in the interest of providing representative CT DRLs. Routine protocol data may be used in future work.
Survey data on actual CTDI measurements using standard PMMA phantoms (Section IV of the survey) was limited. Hence this report does not include results from this section of the survey. Considering the limited data collected, future work will evaluate its potential use.
| Returned Booklets | Booklets Entered into Database | Number of CT scanners in CanadaTable 4 note * | ReturnedTable 4 note * (%) | DatabaseTable 4 note * (%) |
|---|---|---|---|---|
| 409 | 381 | 510 | 80.2 | 74.7 |
| Vendor | Model | Number of Rows | Count | Total (%) |
|---|---|---|---|---|
Note: No patient data was included for the Discovery CT 670NM. One Philips scanner was only identified by detector row maximum = 40, therefore assumed to be a Brilliance CT 40 for purposes of report. |
||||
| GENERAL ELECTRIC | HISPEED QX/i | 4 | 3 | |
| LIGHTSPEED QX/i | 4 | 3 | ||
| LIGHTSPEED PLUS | 4 | 2 | ||
| LIGHTSPEED ULTRA | 8 | 7 | ||
| LIGHTSPEED PRO 16 | 16 | 5 | ||
| LIGHTSPEED 16 | 16 | 22 | ||
| BRIGHTSPEED ELITE | 16 | 7 | ||
| LIGHTSPEED RT | 16 | 4 | ||
| DISCOVERY STE | 16 | 1 | ||
| LIGHTSPEED PRO 32 | 32 | 1 | ||
| LIGHTSPEED VCT | 64 | 73 | ||
| DISCOVERY CT 750HD | 64 | 31 | ||
| OPTIMA CT 660 | 64 | 5 | ||
| DISCOVERY CT 670NM | 64 | 1 | ||
| Count total: | 165 | 0.43 | ||
| SIEMENS | EMOTION DUO | 2 | 1 | |
| SENSATION 4 | 4 | 1 | ||
| EMOTION 6 | 6 | 3 | ||
| EMOTION 16 | 16 | 1 | ||
| SENSATION 16 | 16 | 14 | ||
| BIOGRAPH 16 | 16 | 1 | ||
| SENSATION 40 | 20 | 2 | ||
| DEFINITION AS 40 | 20 | 1 | ||
| SENSATION 64 | 32 | 23 | ||
| DEFINITION AS | 32 | 10 | ||
| DEFINITION AS+ | 64 | 14 | ||
| DEFINITION FLASH | 64 | 10 | ||
| Count total: | 81 | 0.21 | ||
| TOSHIBA | ASTEION | 4 | 3 | |
| AQUILION 16 | 16 | 12 | ||
| AQUILION 32 | 32 | 1 | ||
| AQUILION 64 | 64 | 54 | ||
| AQUILION PRIME | 80 | 1 | ||
| AQUILION ONE | 320 | 14 | ||
| Count total: | 85 | 0.22 | ||
| PHILIPS | BRILLIANCE CT 10 | 10 | 4 | |
| MX 8000 IDT 10 | 10 | 1 | ||
| MX 8000 IDT 16 | 16 | 4 | ||
| BRILLIANCE CT 16 | 16 | 9 | ||
| BRILLIANCE CT BIG BORE 16 | 16 | 3 | ||
| GEMINI GXL 16 | 16 | 1 | ||
| BRILLIANCE CT 40 | 40 | 2 | ||
| BRILLIANCE CT 64 | 64 | 16 | ||
| GEMINI TF 64 | 64 | 2 | ||
| BRILLIANCE iCT | 128 | 7 | ||
| Count total: | 49 | 0.13 | ||
| NEUROLOGICA | CERETOM NL 3000 | 8 | 1 | <0.01 |
| Totals: | 381 | 1.00 | ||
The manufactured and installation years of the surveyed CT equipment is shown in Figure 4. Installation year of Canadian CT equipment shows a mix of older and newer units. Most scanners seem to have been installed in facilities from approximately 2003 through 2012 with a median installation year of 2007. Figure 5 shows the distribution of maximum detector-row and slice capability of surveyed equipment. The predominant CT units in the survey had 16 or 64 detector rows representing 76% of the participating CT equipment (using table 5 data); however, there are a number of CT units that have ≤ 8 detector rows, representing 6.3%, and > 128 detector rows, representing 3.7%. Thus a broad range of available collimation widths are represented.
Figure 4 - Text Equivalent
Figure is a vertical bar histogram. Vertical axis represents number of CT scanners, plotted against horizontal axis with 14 bins or categories representing year from 2000, 2001, 2002 and so on up to 2013. In each bin or year there are two vertical bars side-by-side: One representing year of install of CT scanner and one representing year scanner was manufactured. The bars trace out a generally "bell" shaped curve over the years 2000 to 2013. The plot indicates a general increase up to approximately 2007 and then general decrease in number of CT scanners installed and their year of manufacture. Some smaller additional peaks are superimposed on overall trend near 2005, 2008, and 2011. End of description.
Almost all of the scanners surveyed are capable of helical (continuous) scanning and a large portion have some form of dose reduction technology available, including iterative reconstruction, as shown in Table 6. By far, most of the surveyed CT scanners are single x-ray tube (source), although clearly some specialized (dual source or energy, CT simulator) and combination CT units (PET/CT, SPECT/CT) are used for clinical purposes, as indicated in Figure 6.
Additional information was requested regarding other applications of CT scanners polled, namely whether given CT units were also used in virtual colonoscopy, interventional and angiographic procedures (Table 7). Clearly, the CT units surveyed also play significant roles in other diagnostic and interventional capacities.
Figure 5 - Text Equivalent
Figure is a vertical bar histogram, similar to Figure 4. Vertical axis represents number of CT scanners, plotted against horizontal axis with 7 bins or categories representing maximum number of available detector rows and corresponding maximum number of images or anatomical slices that can be obtained by scanner - these are not necessarily the same for all CT scanners. Bin or category values span increase from left to right, and are listed as ≤8, ≤16, ≤32, ≤64, ≤128, ≤256, and ≤320. In each horizontal category, there are two bars side-by-side: One representing maximum number of detector rows and the other maximum number of slices. All cases show counts of approximately 50 or less for each category, but scanners with ≤16 and ≤64 rows or slices show the highest counts - with values of 89 and 208 rows, along with 89 and 188 slices for same bins.
| Availability | Helical Scanning | Dose Reduction Technologies |
|---|---|---|
Note: Original design of survey intended only to survey availability of tube current modulation dose reduction schemes; however, iterative reconstruction is promoted as a dose reduction technology, therefore these are included here alongside commonly used tube current modulation techniques. |
||
| Yes | 372 | 298 |
| No | 0 | 56 |
| Not specified | 9 | 27 |
Figure 6 - Text Equivalent
Figure is a vertical bar histogram. Vertical axis represents number of CT scanners, plotted against horizontal axis with 7 bins or categories representing types of CT scanners. They are listed as: CT, Dual-Source, Dual-Energy, PET/CT, SPECT/CT, CT SIM, and not applicable. Bar height represents counts in each case. By far most scanners sampled are (standard) CT with a count of 341 out of 381. The other categories have numbers of 10, 16, 5, 2, 3, and 4 respectively as listed. End of description.
| Type | Yes | No | NS/NA |
|---|---|---|---|
| Virtual Colonoscopy | 173 | 177 | 31 |
| Interventional Procedures | 237 | 123 | 21 |
| Angiography | 324 | 50 | 7 |
The overwhelming majority of CT units surveyed are located in diagnostic imaging departments, with few located in nuclear medicine, emergency and "other" departments (Figure 7).
Figure 7 - Text Equivalent
Figure is a vertical bar histogram. Vertical axis represents number of CT scanners, plotted against horizontal axis with 4 bins or categories representing location of CT in clinical facilities. These are listed from left to right as Diagnostic Imaging, Nuclear Medicine, Emergency Department and "Other". Most CT scanners are located in the diagnostic imaging department, as bar height is far larger than all others, showing count of 356 out of 381 scanners sampled. Other categories have counts of 4, 7 and 14 as listed. End of description.
3.2 Patient Examination Data and Dose Indices
As outlined in section 2.3.2, processing logic that incorporated patient body habitus characteristics to expand the total number of samples per examination type was incorporated when the patient mass was not provided. By using this approach all sample pools for individual patient data were extended beyond using reported mass alone. This was welcomed in pediatric cases where any option to extend sample size would be beneficial. Considering Adult Head examination samples as an example, this approach allowed the group sample to be increased from n = 4834 available sequences to n = 5495 sequences. Appendix B shows similar increases for other exam types over using only reported age and body mass. Although pediatric sample sizes are reasonable, unfortunately, they still represent a small portion of the adult sample sizes.
Further processing algorithms also allowed available patient sequences to be further segmented by scan mode (axial or helical), use of contrast (C- or C+) and application of dose reduction technologies (fixed tube current (Fix) or dose reduction (DR)), as outlined in section 2.3.3. Ultimately, this resulted in a large, well defined patient sample of CT scanning practice. The sample sizes, in terms of number of sequences, of all individual patient exam groups and sub-groups are summarized in Table 8. Note that sequence counts per exam category in Table 8 are from the total number of sequences available and may differ from the actual number used for the assessment of DRLs, if for some sequences a given variable such as CTDIvol or DLP was not provided
| Axial | Helical | n | |||||||
|---|---|---|---|---|---|---|---|---|---|
| C- | C+ | C- | C+ | ||||||
| Fix | DR | Fix | DR | Fix | DR | Fix | DR | ||
Note that actual number of CTDI and DLP samples per group and sub-group will also vary according to heterogeneity of reporting - further details are given in Appendix C. Exam group totals and restrictions based upon age and body mass are presented in Appendix B. |
|||||||||
| Adult Examinations | |||||||||
| Head | 2288 | 1071 | 198 | 65 | 1223 | 469 | 131 | 50 | 5495 |
| Chest | 7 | 5 | 3 | 0 | 165 | 1539 | 143 | 2046 | 3908 |
| Abd+Pelvis | 0 | 0 | 33 | 5 | 67 | 429 | 217 | 3494 | 4245 |
| Chest+Abd+Pelvis | 0 | 0 | 24 | 3 | 80 | 310 | 318 | 5143 | 5878 |
| Pediatric Examinations | |||||||||
| Head (0 - 3 yrs.) | 74 | 11 | 8 | 1 | 47 | 32 | 1 | 0 | 174 |
| Head (3 - 7 yrs.) | 58 | 10 | 4 | 0 | 27 | 23 | 5 | 1 | 128 |
| Head (7 - 13 yrs.) | 82 | 18 | 3 | 0 | 29 | 32 | 2 | 2 | 168 |
| Chest (0 - 3 yrs.) | 1 | 0 | 0 | 0 | 2 | 15 | 6 | 27 | 51 |
| Chest (3 - 7 yrs.) | 0 | 0 | 0 | 0 | 3 | 12 | 4 | 19 | 38 |
| Chest (7 - 13 yrs.) | 0 | 0 | 0 | 0 | 0 | 13 | 4 | 17 | 34 |
| Abdomen (0 - 3 yrs.) | 0 | 0 | 0 | 0 | 0 | 2 | 1 | 32 | 35 |
| Abdomen (3 - 7 yrs.) | 0 | 0 | 0 | 0 | 0 | 5 | 2 | 38 | 45 |
| Abdomen (7 - 13 yrs.) | 0 | 0 | 0 | 0 | 0 | 3 | 1 | 44 | 48 |
Generally, in referring to Table 8, we can see that adult and pediatric head scanning spans a broad range of techniques for the clinical indications surveyed, including a mix of axial versus helical scanning and application of dose reduction. Contrast is used in a relatively small proportion of cases. Whereas adult and pediatric body scanning is dominated by helical type scanning and seems to show a higher proportion of contrast use and application of dose reduction relative to head scanning.
For each examination type (group) and its sub-groups, Figures 8-33 show dose index histograms for CTDIvol and DLP. In each case the CTDIvol DRL (75th percentile for whole group) is shown by a solid and dashed vertical line for axial and helical scanning respectively. Similarly in the DLP case, the DRL or 75th percentile line is shown for both DLP per sequence and for the entire exam (whole exams may be made up by multiple sequences) as a solid and dashed line respectively. The lower portions of Figures 8-33 show the corresponding 75th and 95th percentile values of dose indices for labelled sub-groups, providing valuable, additional context to help identify dose reduction opportunities. Sample size (frequency), patient characteristic and dose index summary tables for all exam groups and sub-groups are provided in Appendix C
In a number of sub-group plots (lower, horizontal bars), the DRL of the DLP for the whole exam (DLPexam) is equal to or less than the DRL for the DLP per sequence (DLPseq). In those cases where they are equivalent, this is simply because many exams are made up of single sequences; therefore DLPseq and DLPexam are the same. In some cases, sparse reporting of DLPseq and the corresponding DLPexam affected the dose index distribution shape of the subgroups; therefore the DRL of DLPseq may be greater depending on how DLPseq is reported relative to DLPexam. In all of these cases, the plots may seem to be missing the DRL of DLPexam values, but they are simply the same (so cannot be displayed) or are "over-lapped" by the DRL value of DLPseq and therefore not shown on horizontal bar plots.
In Figures 8-33, data was pre-processed to remove obvious outliers and inconsistent data. A fairly conservative approach was taken in removing extreme CTDIvol values. Specifically, twice the 99th percentile of the original raw data was taken as a limiting threshold. This removed those values of CTDIvol which were extremely high or very likely interchanged with DLP values, but even after applying this conservative threshold some relatively higher dose index values remained. Some additional investigation showed that a number of the higher CTDIvol (and associated DLP) values appeared valid and consistent, as clinical practice could warrant; however, it's possible that some may be other types of mistakes. For example, during data transposition from booklet to database, a small number of cases were discovered where it was suspected that CTDIvol values had been added over multiple sequences (first CTDIvol + second CTDIvol etc.) and then reported as single value. In some other cases, certain vendors provide options to report CTDIvol maximum, rather than typical average CTDIvol. In both of these cases, the reported value of CTDIvol would be higher than expected relative to other sequences in the same group; however, the small number of relatively high values and the elimination of extreme values should have a limited overall effect on the distribution. Using the Adult Head data as an example, if the outlier threshold is lowered to the 99th percentile from twice the 99th percentile then the calculated CTDIvol DRL changes from 83.4 to 81.9 mGy for axial scanning and showed no change in 79.1 mGy for helical scanning - a difference of approximately 1.8% in axial case. Thus, rather than eliminate potentially valid data with more stringent outlier thresholds, the above conservative approach was applied uniformly across all exam types. Following elimination of outlying CTDIvol values, DLP values were checked for consistency with the corresponding scan lengths.
Figure 8 - Text Equivalent
Figure is a combined, vertical bar histogram, stacked upon and directly above a multi-horizontal bar plot. Upper and lower plots share the same, common horizontal axis, labelled as CTDIvol in units of milligray (mGy) - arrangement of plots resembles a sideways capital "T".
The top, vertical axis is titled "Group" with label of frequency, typical of any histogram or distribution of values. The bottom vertical axis is simply titled "Sub-Group" - the sub-groups are obtained from possible, triplet combinations of three scan mode categories: Axial vs. Helical, contrast use vs. none, and fixed tube current vs. dose reduction technology. Thus, lower plot may show up to 8 separate horizontal bars extending to right where sufficient data was available.
Explicitly, in this figure the upper histogram portion shows distributions of the obtained axial and helical CTDIvol values - an emitted radiation dose indicator - for Adult Head data. Each horizontal bar in the lower plot shows the 75th and 95th percentile values of CTDIvol for each Adult Head sub-group as a solid and white appended bar. Light and dark gray colours designate axial vs. helical scanning modes respectively for entire figure. Solid and vertical dashed lines extend through both the upper and lower plots showing the overall, group 75th axial and helical percentiles, relative to both upper, group distribution of values and lower, segmented sub-group bar plots.
Figure 9 - Text Equivalent
Figure is a combined, vertical bar histogram, stacked upon and directly above a multi-horizontal bar plot. Upper and lower plots share the same, common horizontal axis, labelled as DLP in units of milligray centimetres (mGy · cm) - arrangement of plots resembles a sideways capital "T".
The top, vertical axis is titled "Group" with label of frequency, typical of any histogram or distribution of values. The bottom vertical axis is simply titled "Sub-Group" - the sub-groups are obtained from possible, triplet combinations of three scan mode categories: Axial vs. Helical, contrast use vs. none, and fixed tube current vs. dose reduction technology. Thus, lower plot may show up to 8 separate horizontal bars extending to right where sufficient data was available.
Explicitly, in this figure the upper histogram portion shows distributions of the obtained individual sequence and (multi-sequence) exam DLP values - an imparted radiation dose indicator - for Adult Head data. Each horizontal bar in the lower plot shows the individual sequence 75th, exam 75th and exam 95th percentile values of DLP for each Adult Head sub-group as an alternating dark gray, light gray and white appended bar. Dark and light gray colours designate sequence vs. whole exam or group DLP respectively for entire figure. Solid and vertical dashed lines extend through both the upper and lower plots showing the overall, 75th sequence and whole examination DLP percentiles, relative to both upper, group distribution of values and lower, segmented sub-group bar plots.
Figure 10 - Text Equivalent
Figure is a combined, vertical bar histogram, stacked upon and directly above a multi-horizontal bar plot. Upper and lower plots share the same, common horizontal axis, labelled as CTDIvol in units of milligray (mGy) - arrangement of plots resembles a sideways capital "T".
The top, vertical axis is titled "Group" with label of frequency, typical of any histogram or distribution of values. The bottom vertical axis is simply titled "Sub-Group" - the sub-groups are obtained from possible, triplet combinations of three scan mode categories: Axial vs. Helical, contrast use vs. none, and fixed tube current vs. dose reduction technology. Thus, lower plot may show up to 8 separate horizontal bars extending to right where sufficient data was available.
Explicitly, in this figure the upper histogram portion shows distributions of the obtained axial and helical CTDIvol values - an emitted radiation dose indicator - for Adult Chest data. Each horizontal bar in the lower plot shows the 75th and 95th percentile values of CTDIvol for each Adult Chest sub-group as a solid and white appended bar. Light and dark gray colours designate axial vs. helical scanning modes respectively for entire figure. Solid and vertical dashed lines extend through both the upper and lower plots showing the overall, group 75th axial and helical percentiles, relative to both upper, group distribution of values and lower, segmented sub-group bar plots.
Figure 11 - Text Equivalent
Figure is a combined, vertical bar histogram, stacked upon and directly above a multi-horizontal bar plot. Upper and lower plots share the same, common horizontal axis, labelled as DLP in units of milligray centimetres (mGy · cm) - arrangement of plots resembles a sideways capital "T".
The top, vertical axis is titled "Group" with label of frequency, typical of any histogram or distribution of values. The bottom vertical axis is simply titled "Sub-Group" - the sub-groups are obtained from possible, triplet combinations of three scan mode categories: Axial vs. Helical, contrast use vs. none, and fixed tube current vs. dose reduction technology. Thus, lower plot may show up to 8 separate horizontal bars extending to right where sufficient data was available.
Explicitly, in this figure the upper histogram portion shows distributions of the obtained individual sequence and (multi-sequence) exam DLP values - an imparted radiation dose indicator - for Adult Chest data. Each horizontal bar in the lower plot shows the individual sequence 75th, exam 75th and exam 95th percentile values of DLP for each Adult Chest sub-group as an alternating dark gray, light gray and white appended bar. Dark and light gray colours designate sequence vs. whole exam or group DLP respectively for entire figure. Solid and vertical dashed lines extend through both the upper and lower plots showing the overall, 75th sequence and whole examination DLP percentiles, relative to both upper, group distribution of values and lower, segmented sub-group bar plots.
Figure 12 - Text Equivalent
Figure is a combined, vertical bar histogram, stacked upon and directly above a multi-horizontal bar plot. Upper and lower plots share the same, common horizontal axis, labelled as CTDIvol in units of milligray (mGy) - arrangement of plots resembles a sideways capital "T".
The top, vertical axis is titled "Group" with label of frequency, typical of any histogram or distribution of values. The bottom vertical axis is simply titled "Sub-Group" - the sub-groups are obtained from possible, triplet combinations of three scan mode categories: Axial vs. Helical, contrast use vs. none, and fixed tube current vs. dose reduction technology. Thus, lower plot may show up to 8 separate horizontal bars extending to right where sufficient data was available.
Explicitly, in this figure the upper histogram portion shows distributions of the obtained axial and helical CTDIvol values - an emitted radiation dose indicator - for Abdomen + Pelvis data. Each horizontal bar in the lower plot shows the 75th and 95th percentile values of CTDIvol for each Abdomen + Pelvis sub-group as a solid and white appended bar. Light and dark gray colours designate axial vs. helical scanning modes respectively for entire figure. Solid and vertical dashed lines extend through both the upper and lower plots showing the overall, group 75th axial and helical percentiles, relative to both upper, group distribution of values and lower, segmented sub-group bar plots.
Figure 13 - Text Equivalent
Figure is a combined, vertical bar histogram, stacked upon and directly above a multi-horizontal bar plot. Upper and lower plots share the same, common horizontal axis, labelled as DLP in units of milligray centimetres (mGy · cm) – arrangement of plots resembles a sideways capital “T”.
The top, vertical axis is titled “Group” with label of frequency, typical of any histogram or distribution of values. The bottom vertical axis is simply titled “Sub-Group” – the sub-groups are obtained from possible, triplet combinations of three scan mode categories: Axial vs. Helical, contrast use vs. none, and fixed tube current vs. dose reduction technology. Thus, lower plot may show up to 8 separate horizontal bars extending to right where sufficient data was available.
Explicitly, in this figure the upper histogram portion shows distributions of the obtained individual sequence and (multi-sequence) exam DLP values – an imparted radiation dose indicator – for Abdomen + Pelvis data. Each horizontal bar in the lower plot shows the individual sequence 75th, exam 75th and exam 95th percentile values of DLP for each ABDOMEN + PELVIS sub-group as an alternating dark gray, light gray and white appended bar. Dark and light gray colours designate sequence vs. whole exam or group DLP respectively for entire figure. Solid and vertical dashed lines extend through both the upper and lower plots showing the overall, 75th sequence and whole examination DLP percentiles, relative to both upper, group distribution of values and lower, segmented sub-group bar plots.
Figure 14 - Text Equivalent
Figure is a combined, vertical bar histogram, stacked upon and directly above a multi-horizontal bar plot. Upper and lower plots share the same, common horizontal axis, labelled as CTDIvol in units of milligray (mGy) - arrangement of plots resembles a sideways capital "T".
The top, vertical axis is titled "Group" with label of frequency, typical of any histogram or distribution of values. The bottom vertical axis is simply titled "Sub-Group" - the sub-groups are obtained from possible, triplet combinations of three scan mode categories: Axial vs. Helical, contrast use vs. none, and fixed tube current vs. dose reduction technology. Thus, lower plot may show up to 8 separate horizontal bars extending to right where sufficient data was available.
Explicitly, in this figure the upper histogram portion shows distributions of the obtained axial and helical CTDIvol values - an emitted radiation dose indicator - for Chest+Abdomen+Pelvis data. Each horizontal bar in the lower plot shows the 75th and 95th percentile values of CTDIvol for each Chest+Abdomen+Pelvis sub-group as a solid and white appended bar. Light and dark gray colours designate axial vs. helical scanning modes respectively for entire figure. Solid and vertical dashed lines extend through both the upper and lower plots showing the overall, group 75th axial and helical percentiles, relative to both upper, group distribution of values and lower, segmented sub-group bar plots.
Figure 15 - Text Equivalent
Figure is a combined, vertical bar histogram, stacked upon and directly above a multi-horizontal bar plot. Upper and lower plots share the same, common horizontal axis, labelled as DLP in units of milligray centimetres (mGy · cm) - arrangement of plots resembles a sideways capital "T".
The top, vertical axis is titled "Group" with label of frequency, typical of any histogram or distribution of values. The bottom vertical axis is simply titled "Sub-Group" - the sub-groups are obtained from possible, triplet combinations of three scan mode categories: Axial vs. Helical, contrast use vs. none, and fixed tube current vs. dose reduction technology. Thus, lower plot may show up to 8 separate horizontal bars extending to right where sufficient data was available.
Explicitly, in this figure the upper histogram portion shows distributions of the obtained individual sequence and (multi-sequence) exam DLP values - an imparted radiation dose indicator - for Chest+Abdomen+Pelvis data. Each horizontal bar in the lower plot shows the individual sequence 75th, exam 75th and exam 95th percentile values of DLP for each Chest+Abdomen+Pelvis sub-group as an alternating dark gray, light gray and white appended bar. Dark and light gray colours designate sequence vs. whole exam or group DLP respectively for entire figure. Solid and vertical dashed lines extend through both the upper and lower plots showing the overall, 75th sequence and whole examination DLP percentiles, relative to both upper, group distribution of values and lower, segmented sub-group bar plots.
Figure 16 - Text Equivalent
Figure is a combined, vertical bar histogram, stacked upon and directly above a multi-horizontal bar plot. Upper and lower plots share the same, common horizontal axis, labelled as CTDIvol in units of milligray (mGy) - arrangement of plots resembles a sideways capital "T".
The top, vertical axis is titled "Group" with label of frequency, typical of any histogram or distribution of values. The bottom vertical axis is simply titled "Sub-Group" - the sub-groups are obtained from possible, triplet combinations of three scan mode categories: Axial vs. Helical, contrast use vs. none, and fixed tube current vs. dose reduction technology. Thus, lower plot may show up to 8 separate horizontal bars extending to right where sufficient data was available.
Explicitly, in this figure the upper histogram portion shows distributions of the obtained axial and helical CTDIvol values - an emitted radiation dose indicator - for Pediatric Head (0-3 years) data. Each horizontal bar in the lower plot shows the 75th and 95th percentile values of CTDIvol for each Pediatric Head (0-3 years) sub-group as a solid and white appended bar. Light and dark gray colours designate axial vs. helical scanning modes respectively for entire figure. Solid and vertical dashed lines extend through both the upper and lower plots showing the overall, group 75th axial and helical percentiles, relative to both upper, group distribution of values and lower, segmented sub-group bar plots.
Figure 17 - Text Equivalent
Figure is a combined, vertical bar histogram, stacked upon and directly above a multi-horizontal bar plot. Upper and lower plots share the same, common horizontal axis, labelled as DLP in units of milligray centimetres (mGy · cm) - arrangement of plots resembles a sideways capital "T".
The top, vertical axis is titled "Group" with label of frequency, typical of any histogram or distribution of values. The bottom vertical axis is simply titled "Sub-Group" - the sub-groups are obtained from possible, triplet combinations of three scan mode categories: Axial vs. Helical, contrast use vs. none, and fixed tube current vs. dose reduction technology. Thus, lower plot may show up to 8 separate horizontal bars extending to right where sufficient data was available.
Explicitly, in this figure the upper histogram portion shows distributions of the obtained individual sequence and (multi-sequence) exam DLP values - an imparted radiation dose indicator - for Pediatric Head (0-3 years) data. Each horizontal bar in the lower plot shows the individual sequence 75th, exam 75th and exam 95th percentile values of DLP for each Pediatric Head (0-3 years) sub-group as an alternating dark gray, light gray and white appended bar. Dark and light gray colours designate sequence vs. whole exam or group DLP respectively for entire figure. Solid and vertical dashed lines extend through both the upper and lower plots showing the overall, 75th sequence and whole examination DLP percentiles, relative to both upper, group distribution of values and lower, segmented sub-group bar plots.
Figure 18 - Text Equivalent
Figure is a combined, vertical bar histogram, stacked upon and directly above a multi-horizontal bar plot. Upper and lower plots share the same, common horizontal axis, labelled as CTDIvol in units of milligray (mGy) - arrangement of plots resembles a sideways capital "T".
The top, vertical axis is titled "Group" with label of frequency, typical of any histogram or distribution of values. The bottom vertical axis is simply titled "Sub-Group" - the sub-groups are obtained from possible, triplet combinations of three scan mode categories: Axial vs. Helical, contrast use vs. none, and fixed tube current vs. dose reduction technology. Thus, lower plot may show up to 8 separate horizontal bars extending to right where sufficient data was available.
Explicitly, in this figure the upper histogram portion shows distributions of the obtained axial and helical CTDIvol values - an emitted radiation dose indicator - for Pediatric Head (3-7 years) data. Each horizontal bar in the lower plot shows the 75th and 95th percentile values of CTDIvol for each Pediatric Head (3-7 years) sub-group as a solid and white appended bar. Light and dark gray colours designate axial vs. helical scanning modes respectively for entire figure. Solid and vertical dashed lines extend through both the upper and lower plots showing the overall, group 75th axial and helical percentiles, relative to both upper, group distribution of values and lower, segmented sub-group bar plots.
Figure 19 - Text Equivalent
Figure is a combined, vertical bar histogram, stacked upon and directly above a multi-horizontal bar plot. Upper and lower plots share the same, common horizontal axis, labelled as DLP in units of milligray centimetres (mGy · cm) - arrangement of plots resembles a sideways capital "T".
The top, vertical axis is titled "Group" with label of frequency, typical of any histogram or distribution of values. The bottom vertical axis is simply titled "Sub-Group" - the sub-groups are obtained from possible, triplet combinations of three scan mode categories: Axial vs. Helical, contrast use vs. none, and fixed tube current vs. dose reduction technology. Thus, lower plot may show up to 8 separate horizontal bars extending to right where sufficient data was available.
Explicitly, in this figure the upper histogram portion shows distributions of the obtained individual sequence and (multi-sequence) exam DLP values - an imparted radiation dose indicator - for Pediatric Head (3-7 years) data. Each horizontal bar in the lower plot shows the individual sequence 75th, exam 75th and exam 95th percentile values of DLP for each Pediatric Head (3-7 years) sub-group as an alternating dark gray, light gray and white appended bar. Dark and light gray colours designate sequence vs. whole exam or group DLP respectively for entire figure. Solid and vertical dashed lines extend through both the upper and lower plots showing the overall, 75th sequence and whole examination DLP percentiles, relative to both upper, group distribution of values and lower, segmented sub-group bar plots.
Figure 20 - Text Equivalent
Figure is a combined, vertical bar histogram, stacked upon and directly above a multi-horizontal bar plot. Upper and lower plots share the same, common horizontal axis, labelled as CTDIvol in units of milligray (mGy) - arrangement of plots resembles a sideways capital "T".
The top, vertical axis is titled "Group" with label of frequency, typical of any histogram or distribution of values. The bottom vertical axis is simply titled "Sub-Group" - the sub-groups are obtained from possible, triplet combinations of three scan mode categories: Axial vs. Helical, contrast use vs. none, and fixed tube current vs. dose reduction technology. Thus, lower plot may show up to 8 separate horizontal bars extending to right where sufficient data was available.
Explicitly, in this figure the upper histogram portion shows distributions of the obtained axial and helical CTDIvol values - an emitted radiation dose indicator - for Pediatric Head (7-13 years) data. Each horizontal bar in the lower plot shows the 75th and 95th percentile values of CTDIvol for each Pediatric Head (7-13 years) sub-group as a solid and white appended bar. Light and dark gray colours designate axial vs. helical scanning modes respectively for entire figure. Solid and vertical dashed lines extend through both the upper and lower plots showing the overall, group 75th axial and helical percentiles, relative to both upper, group distribution of values and lower, segmented sub-group bar plots.
Figure 21 - Text Equivalent
Figure is a combined, vertical bar histogram, stacked upon and directly above a multi-horizontal bar plot. Upper and lower plots share the same, common horizontal axis, labelled as DLP in units of milligray centimetres (mGy · cm) - arrangement of plots resembles a sideways capital "T".
The top, vertical axis is titled "Group" with label of frequency, typical of any histogram or distribution of values. The bottom vertical axis is simply titled "Sub-Group" - the sub-groups are obtained from possible, triplet combinations of three scan mode categories: Axial vs. Helical, contrast use vs. none, and fixed tube current vs. dose reduction technology. Thus, lower plot may show up to 8 separate horizontal bars extending to right where sufficient data was available.
Explicitly, in this figure the upper histogram portion shows distributions of the obtained individual sequence and (multi-sequence) exam DLP values - an imparted radiation dose indicator - for Pediatric Head (7-13 years) data. Each horizontal bar in the lower plot shows the individual sequence 75th, exam 75th and exam 95th percentile values of DLP for each Pediatric Head (7-13 years) sub-group as an alternating dark gray, light gray and white appended bar. Dark and light gray colours designate sequence vs. whole exam or group DLP respectively for entire figure. Solid and vertical dashed lines extend through both the upper and lower plots showing the overall, 75th sequence and whole examination DLP percentiles, relative to both upper, group distribution of values and lower, segmented sub-group bar plots.
Figure 22 - Text Equivalent
Figure is a combined, vertical bar histogram, stacked upon and directly above a multi-horizontal bar plot. Upper and lower plots share the same, common horizontal axis, labelled as CTDIvol in units of milligray (mGy) - arrangement of plots resembles a sideways capital "T".
The top, vertical axis is titled "Group" with label of frequency, typical of any histogram or distribution of values. The bottom vertical axis is simply titled "Sub-Group" - the sub-groups are obtained from possible, triplet combinations of three scan mode categories: Axial vs. Helical, contrast use vs. none, and fixed tube current vs. dose reduction technology. Thus, lower plot may show up to 8 separate horizontal bars extending to right where sufficient data was available.
Explicitly, in this figure the upper histogram portion shows distributions of the obtained axial and helical CTDIvol values - an emitted radiation dose indicator - for Pediatric Chest (0-3 years) data. Each horizontal bar in the lower plot shows the 75th and 95th percentile values of CTDIvol for each Pediatric Chest (0-3 years) sub-group as a solid and white appended bar. Light and dark gray colours designate axial vs. helical scanning modes respectively for entire figure. Solid and vertical dashed lines extend through both the upper and lower plots showing the overall, group 75th axial and helical percentiles, relative to both upper, group distribution of values and lower, segmented sub-group bar plots.
Figure 23 - Text Equivalent
Figure is a combined, vertical bar histogram, stacked upon and directly above a multi-horizontal bar plot. Upper and lower plots share the same, common horizontal axis, labelled as DLP in units of milligray centimetres (mGy · cm) - arrangement of plots resembles a sideways capital "T".
The top, vertical axis is titled "Group" with label of frequency, typical of any histogram or distribution of values. The bottom vertical axis is simply titled "Sub-Group" - the sub-groups are obtained from possible, triplet combinations of three scan mode categories: Axial vs. Helical, contrast use vs. none, and fixed tube current vs. dose reduction technology. Thus, lower plot may show up to 8 separate horizontal bars extending to right where sufficient data was available.
Explicitly, in this figure the upper histogram portion shows distributions of the obtained individual sequence and (multi-sequence) exam DLP values - an imparted radiation dose indicator - for Pediatric Chest (0-3 years) data. Each horizontal bar in the lower plot shows the individual sequence 75th, exam 75th and exam 95th percentile values of DLP for each Pediatric Chest (0-3 years) sub-group as an alternating dark gray, light gray and white appended bar. Dark and light gray colours designate sequence vs. whole exam or group DLP respectively for entire figure. Solid and vertical dashed lines extend through both the upper and lower plots showing the overall, 75th sequence and whole examination DLP percentiles, relative to both upper, group distribution of values and lower, segmented sub-group bar plots.
Figure 24 - Text Equivalent
Figure is a combined, vertical bar histogram, stacked upon and directly above a multi-horizontal bar plot. Upper and lower plots share the same, common horizontal axis, labelled as CTDIvol in units of milligray (mGy) - arrangement of plots resembles a sideways capital "T".
The top, vertical axis is titled "Group" with label of frequency, typical of any histogram or distribution of values. The bottom vertical axis is simply titled "Sub-Group" - the sub-groups are obtained from possible, triplet combinations of three scan mode categories: Axial vs. Helical, contrast use vs. none, and fixed tube current vs. dose reduction technology. Thus, lower plot may show up to 8 separate horizontal bars extending to right where sufficient data was available.
Explicitly, in this figure the upper histogram portion shows distributions of the obtained axial and helical CTDIvol values - an emitted radiation dose indicator - for Pediatric Chest (3-7 years) data. Each horizontal bar in the lower plot shows the 75th and 95th percentile values of CTDIvol for each Pediatric Chest (3-7 years) sub-group as a solid and white appended bar. Light and dark gray colours designate axial vs. helical scanning modes respectively for entire figure. Solid and vertical dashed lines extend through both the upper and lower plots showing the overall, group 75th axial and helical percentiles, relative to both upper, group distribution of values and lower, segmented sub-group bar plots.
Figure 25 - Text Equivalent
Figure is a combined, vertical bar histogram, stacked upon and directly above a multi-horizontal bar plot. Upper and lower plots share the same, common horizontal axis, labelled as DLP in units of milligray centimetres (mGy · cm) - arrangement of plots resembles a sideways capital "T".
The top, vertical axis is titled "Group" with label of frequency, typical of any histogram or distribution of values. The bottom vertical axis is simply titled "Sub-Group" - the sub-groups are obtained from possible, triplet combinations of three scan mode categories: Axial vs. Helical, contrast use vs. none, and fixed tube current vs. dose reduction technology. Thus, lower plot may show up to 8 separate horizontal bars extending to right where sufficient data was available.
Explicitly, in this figure the upper histogram portion shows distributions of the obtained individual sequence and (multi-sequence) exam DLP values - an imparted radiation dose indicator - for Pediatric Chest (3-7 years) data. Each horizontal bar in the lower plot shows the individual sequence 75th, exam 75th and exam 95th percentile values of DLP for each Pediatric Chest (3-7 years) sub-group as an alternating dark gray, light gray and white appended bar. Dark and light gray colours designate sequence vs. whole exam or group DLP respectively for entire figure. Solid and vertical dashed lines extend through both the upper and lower plots showing the overall, 75th sequence and whole examination DLP percentiles, relative to both upper, group distribution of values and lower, segmented sub-group bar plots.
Figure 26 - Text Equivalent
Figure is a combined, vertical bar histogram, stacked upon and directly above a multi-horizontal bar plot. Upper and lower plots share the same, common horizontal axis, labelled as CTDIvol in units of milligray (mGy) - arrangement of plots resembles a sideways capital "T".
The top, vertical axis is titled "Group" with label of frequency, typical of any histogram or distribution of values. The bottom vertical axis is simply titled "Sub-Group" - the sub-groups are obtained from possible, triplet combinations of three scan mode categories: Axial vs. Helical, contrast use vs. none, and fixed tube current vs. dose reduction technology. Thus, lower plot may show up to 8 separate horizontal bars extending to right where sufficient data was available.
Explicitly, in this figure the upper histogram portion shows distributions of the obtained axial and helical CTDIvol values - an emitted radiation dose indicator - for Pediatric Chest (7-13 years) data. Each horizontal bar in the lower plot shows the 75th and 95th percentile values of CTDIvol for each Pediatric Chest (7-13 years) sub-group as a solid and white appended bar. Light and dark gray colours designate axial vs. helical scanning modes respectively for entire figure. Solid and vertical dashed lines extend through both the upper and lower plots showing the overall, group 75th axial and helical percentiles, relative to both upper, group distribution of values and lower, segmented sub-group bar plots.
Figure 27 - Text Equivalent
Figure is a combined, vertical bar histogram, stacked upon and directly above a multi-horizontal bar plot. Upper and lower plots share the same, common horizontal axis, labelled as DLP in units of milligray centimetres (mGy · cm) - arrangement of plots resembles a sideways capital "T".
The top, vertical axis is titled "Group" with label of frequency, typical of any histogram or distribution of values. The bottom vertical axis is simply titled "Sub-Group" - the sub-groups are obtained from possible, triplet combinations of three scan mode categories: Axial vs. Helical, contrast use vs. none, and fixed tube current vs. dose reduction technology. Thus, lower plot may show up to 8 separate horizontal bars extending to right where sufficient data was available.
Explicitly, in this figure the upper histogram portion shows distributions of the obtained individual sequence and (multi-sequence) exam DLP values - an imparted radiation dose indicator - for Pediatric Chest (7-13 years) data. Each horizontal bar in the lower plot shows the individual sequence 75th, exam 75th and exam 95th percentile values of DLP for each Pediatric Chest (7-13 years) sub-group as an alternating dark gray, light gray and white appended bar. Dark and light gray colours designate sequence vs. whole exam or group DLP respectively for entire figure. Solid and vertical dashed lines extend through both the upper and lower plots showing the overall, 75th sequence and whole examination DLP percentiles, relative to both upper, group distribution of values and lower, segmented sub-group bar plots.
Figure 28 - Text Equivalent
Figure is a combined, vertical bar histogram, stacked upon and directly above a multi-horizontal bar plot. Upper and lower plots share the same, common horizontal axis, labelled as CTDIvol in units of milligray (mGy) - arrangement of plots resembles a sideways capital "T".
The top, vertical axis is titled "Group" with label of frequency, typical of any histogram or distribution of values. The bottom vertical axis is simply titled "Sub-Group" - the sub-groups are obtained from possible, triplet combinations of three scan mode categories: Axial vs. Helical, contrast use vs. none, and fixed tube current vs. dose reduction technology. Thus, lower plot may show up to 8 separate horizontal bars extending to right where sufficient data was available.
Explicitly, in this figure the upper histogram portion shows distributions of the obtained axial and helical CTDIvol values - an emitted radiation dose indicator - for Pediatric Abdomen (0-3 years) data. Each horizontal bar in the lower plot shows the 75th and 95th percentile values of CTDIvol for each Pediatric Abdomen (0-3 years) sub-group as a solid and white appended bar. Light and dark gray colours designate axial vs. helical scanning modes respectively for entire figure. Solid and vertical dashed lines extend through both the upper and lower plots showing the overall, group 75th axial and helical percentiles, relative to both upper, group distribution of values and lower, segmented sub-group bar plots.
Figure 29 - Text Equivalent
Figure is a combined, vertical bar histogram, stacked upon and directly above a multi-horizontal bar plot. Upper and lower plots share the same, common horizontal axis, labelled as DLP in units of milligray centimetres (mGy · cm) - arrangement of plots resembles a sideways capital "T".
The top, vertical axis is titled "Group" with label of frequency, typical of any histogram or distribution of values. The bottom vertical axis is simply titled "Sub-Group" - the sub-groups are obtained from possible, triplet combinations of three scan mode categories: Axial vs. Helical, contrast use vs. none, and fixed tube current vs. dose reduction technology. Thus, lower plot may show up to 8 separate horizontal bars extending to right where sufficient data was available.
Explicitly, in this figure the upper histogram portion shows distributions of the obtained individual sequence and (multi-sequence) exam DLP values - an imparted radiation dose indicator - for Pediatric Abdomen (0-3 years) data. Each horizontal bar in the lower plot shows the individual sequence 75th, exam 75th and exam 95th percentile values of DLP for each Pediatric Abdomen (0-3 years) sub-group as an alternating dark gray, light gray and white appended bar. Dark and light gray colours designate sequence vs. whole exam or group DLP respectively for entire figure. Solid and vertical dashed lines extend through both the upper and lower plots showing the overall, 75th sequence and whole examination DLP percentiles, relative to both upper, group distribution of values and lower, segmented sub-group bar plots.
Figure 30 - Text Equivalent
Figure is a combined, vertical bar histogram, stacked upon and directly above a multi-horizontal bar plot. Upper and lower plots share the same, common horizontal axis, labelled as CTDIvol in units of milligray (mGy) - arrangement of plots resembles a sideways capital "T".
The top, vertical axis is titled "Group" with label of frequency, typical of any histogram or distribution of values. The bottom vertical axis is simply titled "Sub-Group" - the sub-groups are obtained from possible, triplet combinations of three scan mode categories: Axial vs. Helical, contrast use vs. none, and fixed tube current vs. dose reduction technology. Thus, lower plot may show up to 8 separate horizontal bars extending to right where sufficient data was available.
Explicitly, in this figure the upper histogram portion shows distributions of the obtained axial and helical CTDIvol values - an emitted radiation dose indicator - for Pediatric Abdomen (3-7 years) data. Each horizontal bar in the lower plot shows the 75th and 95th percentile values of CTDIvol for each Pediatric Abdomen (3-7 years) sub-group as a solid and white appended bar. Light and dark gray colours designate axial vs. helical scanning modes respectively for entire figure. Solid and vertical dashed lines extend through both the upper and lower plots showing the overall, group 75th axial and helical percentiles, relative to both upper, group distribution of values and lower, segmented sub-group bar plots.
Figure 31 - Text Equivalent
Figure is a combined, vertical bar histogram, stacked upon and directly above a multi-horizontal bar plot. Upper and lower plots share the same, common horizontal axis, labelled as DLP in units of milligray centimetres (mGy · cm) - arrangement of plots resembles a sideways capital "T".
The top, vertical axis is titled "Group" with label of frequency, typical of any histogram or distribution of values. The bottom vertical axis is simply titled "Sub-Group" - the sub-groups are obtained from possible, triplet combinations of three scan mode categories: Axial vs. Helical, contrast use vs. none, and fixed tube current vs. dose reduction technology. Thus, lower plot may show up to 8 separate horizontal bars extending to right where sufficient data was available.
Explicitly, in this figure the upper histogram portion shows distributions of the obtained individual sequence and (multi-sequence) exam DLP values - an imparted radiation dose indicator - for Pediatric Abdomen (3-7 years) data. Each horizontal bar in the lower plot shows the individual sequence 75th, exam 75th and exam 95th percentile values of DLP for each Pediatric Abdomen (3-7 years) sub-group as an alternating dark gray, light gray and white appended bar. Dark and light gray colours designate sequence vs. whole exam or group DLP respectively for entire figure. Solid and vertical dashed lines extend through both the upper and lower plots showing the overall, 75th sequence and whole examination DLP percentiles, relative to both upper, group distribution of values and lower, segmented sub-group bar plots.
Figure 32 - Text Equivalent
Figure is a combined, vertical bar histogram, stacked upon and directly above a multi-horizontal bar plot. Upper and lower plots share the same, common horizontal axis, labelled as CTDIvol in units of milligray (mGy) - arrangement of plots resembles a sideways capital "T".
The top, vertical axis is titled "Group" with label of frequency, typical of any histogram or distribution of values. The bottom vertical axis is simply titled "Sub-Group" - the sub-groups are obtained from possible, triplet combinations of three scan mode categories: Axial vs. Helical, contrast use vs. none, and fixed tube current vs. dose reduction technology. Thus, lower plot may show up to 8 separate horizontal bars extending to right where sufficient data was available.
Explicitly, in this figure the upper histogram portion shows distributions of the obtained axial and helical CTDIvol values - an emitted radiation dose indicator - for Pediatric Abdomen (7-13 years) data. Each horizontal bar in the lower plot shows the 75th and 95th percentile values of CTDIvol for each Pediatric Abdomen (7-13 years) sub-group as a solid and white appended bar. Light and dark gray colours designate axial vs. helical scanning modes respectively for entire figure. Solid and vertical dashed lines extend through both the upper and lower plots showing the overall, group 75th axial and helical percentiles, relative to both upper, group distribution of values and lower, segmented sub-group bar plots.
Figure 33 - Text Equivalent
Figure is a combined, vertical bar histogram, stacked upon and directly above a multi-horizontal bar plot. Upper and lower plots share the same, common horizontal axis, labelled as DLP in units of milligray centimetres (mGy · cm) - arrangement of plots resembles a sideways capital "T".
The top, vertical axis is titled "Group" with label of frequency, typical of any histogram or distribution of values. The bottom vertical axis is simply titled "Sub-Group" - the sub-groups are obtained from possible, triplet combinations of three scan mode categories: Axial vs. Helical, contrast use vs. none, and fixed tube current vs. dose reduction technology. Thus, lower plot may show up to 8 separate horizontal bars extending to right where sufficient data was available.
Explicitly, in this figure the upper histogram portion shows distributions of the obtained individual sequence and (multi-sequence) exam DLP values - an imparted radiation dose indicator - for Pediatric Abdomen (7-13 years) data. Each horizontal bar in the lower plot shows the individual sequence 75th, exam 75th and exam 95th percentile values of DLP for each Pediatric Abdomen (7-13 years) sub-group as an alternating dark gray, light gray and white appended bar. Dark and light gray colours designate sequence vs. whole exam or group DLP respectively for entire figure. Solid and vertical dashed lines extend through both the upper and lower plots showing the overall, 75th sequence and whole examination DLP percentiles, relative to both upper, group distribution of values and lower, segmented sub-group bar plots.
Table 9: Summary of the 75th percentile and median values of CTDIvol (mGy), DLPseq (mGy · cm) and DLPexam (mGy · cm) for each exam type, as outlined in Tables 3 and 8. Median dose index values or "achievable doses" are shown in brackets Footnote A-21. The 75th percentiles and median values of CTDIvol, for axial (ax) and helical (he) scanning, are per sequence. Similarly, the 75th percentiles and median values of DLP are given per sequence (DLPseq) and for entire exam (DLPexam). CTDI and DLP values for pediatric body examinations are reported relative to the 32 cm reference phantom.
| axCTDIvol (mGy) | heCTDIvol (mGy) | DLPseq (mGy · cm) | DLPexam (mGy · cm) | |
|---|---|---|---|---|
| Adult Examinations | ||||
| Head | 83.4 [63.4] | 79.1 [71.7] | 1098 [709] | 1302 [1044] |
| Chest | 13.7 [3.6]Table 9 note * | 14.1 [9.5] | 483 [334] | 521 [362] |
| Abdo+Pelvis | 23.0 [16.4] | 18.1 [12.8] | 806 [562] | 874 [609] |
| Chest+Abd+Pelvis | 19.4 [16.4] | 16.6 [12.2] | 723 [502] | 1269 [931] |
| Pediatric Examinations | ||||
| Head (0 - 3 yrs.) | 37.4 [29.9] | 37.0 [27.3] | 549 [397] | 578 [446] |
| Head (3 - 7 yrs.) | 48.0 [38.1] | 51.5 [39.2] | 692 [552] | 843 [601] |
| Head (7 - 13 yrs.) | 59.1 [42.9] | 52.9 [47.0] | 834 [610] | 888 [665] |
| Chest (0 - 3 yrs.) | - | 2.8 [1.5] | 62 [40]Table 9 note * | 52 [36]Table 9 note * |
| Chest (3 - 7 yrs.) | - | 3.8 [2.8] | 87 [72]Table 9 note * | 85 [68]Table 9 note * |
| Chest (7 - 13 yrs.) | - | 4,8 [3.4] | 135 [105] | 136 [105] |
| Abdomen (0 - 3 yrs.) | - | 3.8 [3.0] | 114 [85] | 120 [103] |
| Abdomen (3 - 7 yrs.) | - | 4.9 [4.0] | 162 [128] | 185 [139] |
| Abdomen (7 - 13 yrs.) | - | 6.1 [4.9] | 257 [200] | 263 [194] |
Figures 8-33 show that a large variation in dose indices is possible for a given exam type. This is representative of the wide variation in application of technical settings and options that are available on todays' CT models. The 75th percentile values of dose indices (CTDI and DLP) from all dose index histograms are summarized in Table 9 along with median (50th percentile) values which are often reported in parallel and sometimes termed "achievable doses" Footnote A-21 - providing future dose optimization targets.
Combining data from Tables 8 and 9, allows a practice weighted 75th percentile of CTDIvol to be calculated using the frequency in which sequences, of a given examination type, were identified as being performed using axial or helical scanning. The resulting DRL values are summarized in Table 10 along with median age, mass, AP and LAT measures - providing essential patient context. Note that for any given sequence, the scanning mode could be indicated but the corresponding value of CTDIvol may or may not be given. This leads to a difference in the number of axial or helical sequences versus the number of corresponding CTDIvol values. Therefore, a similar calculation was undertaken using the frequency of axial and helical CTDI values actually reported (see Appendix C). Almost exactly the same results were obtained using this approach. In all but one case (Pediatric Head 3-7 years), practice weighted CTDI DRLs were identical when reported to one decimal place (Pediatric Head 3-7 CTDI differed by 0.1).
Table 10: Summary of DRLs - CTDI (frequency weighted using Tables 8 and 9) and DLP. CTDIvol values are per sequence and DLP values are for entire exam (multiple sequences). Similar to Table 9, median dose index values or "achievable doses" are also shown in brackets. All DRLs for head examinations (adult and pediatric) are reported relative to 16 cm reference phantom whereas all DRLs for body examinations are reported relative to the 32 cm reference phantom. Median age, mass, anterior-posterior (AP), and lateral (LAT) measurements of exam groups are also shown for appropriate comparison. Further details on dose indices and patient characteristics are given in Appendix C for all groups and sub-groups.
| CTDIvol per sequence (mGy) | DLP per exam (mGy · cm) | Age (yrs.) [median] | Mass (kg) [median] | AP (cm) [median] | LAT (cm) [median] | |
|---|---|---|---|---|---|---|
| Adult Examinations | ||||||
| Head | 82 [66] | 1302 [1044] | 63.0 | 70.3 | 18.6 | 15.2 |
| Chest | 14 [9.5] | 521 [362] | 66.0 | 70.3 | 25.9 | 34.0 |
| Abdo+Pelvis | 18 [13] | 874 [609] | 61.0 | 71.0 | 25.9 | 33.6 |
| Chest+Abd+Pelvis | 17 [12] | 1269 [931] | 65.0 | 72.0 | 25.7 | 33.9 |
| Pediatric Examinations | ||||||
| Head (0 - 3 yrs.) | 37 [29] | 578 [446] | 1.5 | 10.0 | 15.6 | 13.2 |
| Head (3 - 7 yrs.) | 49 [39] | 843 [601] | 6.0 | 20.0 | 17.1 | 14.0 |
| Head (7 - 13 yrs.) | 57 [44] | 888 [665] | 10.0 | 32.0 | 17.6 | 14.5 |
| Chest (0 - 3 yrs.) | 2.8 [1.5] | 62 [40] | 1.7 | 11.1 | 12.8 | 17.0 |
| Chest (3 - 7 yrs.) | 3.8 [2.8] | 87 [72] | 5.0 | 18.0 | 14.9 | 21.3 |
| Chest (7 - 13 yrs.) | 4.8 [3.4] | 136 [105] | 9.5 | 31.0 | 17.7 | 26.0 |
| Abdomen (0 - 3 yrs.) | 3.8 [3.0] | 120 [103] | 2.0 | 13.0 | 13.7 | 17.9 |
| Abdomen (3 - 7 yrs.) | 4.9 [4.0] | 185 [139] | 6.0 | 22.0 | 15.0 | 20.7 |
| Adomen (7 - 13 yrs.) | 6.1 [4.9] | 263 [194] | 10.0 | 34.0 | 17.8 | 24.6 |
4.0 Discussion
In Canada, radiation protection of patients is a shared responsibility between the federal government, the provincial/territorial governments and the various groups of medical professionals involved in the delivery of health care to patients. HC administers legislation governing the safety and effectiveness of CT equipment imported and sold in Canada, while provincial/territorial governments and medical professionals are responsible for the safe installation and use of equipment. Recognizing this shared responsibility for radiation protection, the collaborative approach in which this survey was conducted contributed to the high level of survey participation. With a large dataset, collected from approximately 75% of CT equipment from across the country and covering many equipment models, the national DRLs (shown in Table 10) are derived from a sufficiently broad sample of CT imaging in Canada.
The primary goal of the survey was to collect CT dose index data to establish national DRLs for commonly performed CT examinations; however the survey templates were designed intentionally to also gather quantitative information on the patient population (age, mass, AP and LAT body habitus measurements) as well as information on the CT equipment technology and scanning modes applied to examinations. This additional information allows the national DRLs presented here to be associated with a well characterized patient population and actual scanning practice. This will facilitate comparison with any future evaluations of national DRLs given that the patient population, CT equipment technology and scanning modes directly impact the CT dose indices.
It is important to note that the DRLs presented here are for overall examinations or protocols (e.g. head, chest, etc.) and do not provide explicit reference levels for sub-protocols (e.g. lower head) even if the exam is performed in multiple scan phases or sequences. Further analysis is required to obtain this level of reporting. DRLs here may average over multiple sequences of different anatomical regions - optimized DRLs would compare exactly similar regions - thus, are approximate over a given anatomical region. This is especially important for cases of chest/abdomen/pelvis exams performed in distinct chest and abdomen/pelvis multiple sequence exams; however, DRLs obtained through averaging over multiple sequences of different anatomical regions may still provide valuable targets to help optimize patient scanning.
In addition to the national DRL values for the standard CT examinations, this report also provides insight into subgroups of data, representing different modes of scanning (sub-group plots in Figures 8-33), to help identify potential points of guidance towards optimization of imaging. Specifically, for a given type of examination, it's clear from the perspective of the 75th percentiles of sub-groups that dose reduction technologies reduce standardized dose from machines. In almost all cases, when comparing the 75th percentile of sub-group CTDIvol values for a given examination type, with the only difference being application of dose reduction, the 75th percentile values of CTDIvol of the dose reduction subgroups are lower. This is also seen when comparing the 75th percentile of DLP values of sub-groups, but it's not as apparent since DLP is modulated by the varying scan lengths employed. While this data adds additional insights into factors affecting CT dose indices, it must be noted that the overall intent of the survey was not to test statistical significance between groups or prove any relationships; rather, it was simply to present evidence based DRLs for the purpose of reducing exposures to patients and helping identify optimization opportunities.
As this is the first national level survey of CT practice in Canada, this report cannot make comparisons with any previous national DRL values. To assist in interpreting the Canadian national DRLs and assessing the potential for further optimization of CT imaging in Canada, Tables 11 and Table 12 provide a summary of published Canadian regional and international CT DRLs for adult and pediatric imaging respectively.
| Region [Ref] | Age (yrs.) | Mass (kg) | Head | Chest | Abdo/Pelv | Chest/Abdo/Pelv | ||||
|---|---|---|---|---|---|---|---|---|---|---|
| CTDIvol (mGy) | DLPexam (mGy · cm) | CTDIvol (mGy) | DLPexam (mGy · cm) | CTDIvol (mGy) | DLPexam (mGy · cm) | CTDIvol (mGy) | DLPexam (mGy · cm) | |||
| AUS Footnote B-2 | >14 | - | 60 | 1000 | 15 | 450 | 15 | 700 | 30 | 1200 |
| BC Footnote B-10 | 13-98, Av: 59.4 | 27.3-175, Av: 74.6 | - | 1300 | - | 600 | - | 1100 | - | - |
| CHE Footnote B-21 | - | 60-85 | 65 | 1000 | 10 | 400 | 15 | 650 | 15 | 1000 |
| DEU Footnote B-3 | - | - | 65 | 950 | 12 | 400 | - | - | - | - |
| EC Footnote B-6,Footnote B-20 | - | - | 72 | 945 | 12 | 421 | 15 | 724 | - | - |
| FIN Footnote B-15 | - | 60-90, Av: 74.8 | 55 | 800 | 9Table 11 note a | 290Table 11 note a | - | - | - | - |
| FRA Footnote B-17 | - | - | 65 | 1050 | 15 | 475 | 17 | 800 | 20 | 1000 |
| GBR Footnote B-19 | - | - | 60 | 970 | 12 | 610 | 15 | 745 | - | 1000 |
| 60Table 11 note b | 4Table 11 note d | 140Table 11 note d | ||||||||
| 80Table 11 note c | 12Table 11 note e | 350Table 11 note e | ||||||||
| GRC Footnote B-20 | - | - | 67 | 1055 | 14 | 480 | 16 | 760 | 17 | 1020 |
| IRL Footnote B-11 | - | 60-80 | 58Table 11 note b | 940 | 9Table 11 note a | 390 | 12 | 600 | 12Table 11 note a | 850 |
| 66Table 11 note c | 11Table 11 note f | 10Table 11 note g | ||||||||
| JPN Footnote B-1 | - | 50-60 | 85 | 1350 | 15 | 550 | 20 | 1000 | 18 | 1300 |
| KOR Footnote B-14 | Av: 48 | 50-80, Av: 66.4 | 53 | 900 | 13 | 710 | - | - | - | - |
| MB Footnote B-9 | Av: 56.8 | Av: 78.3 | - | 1305 | - | 823 | - | 1325 | - | 2185 |
| NLD Footnote B-22 | - | 65.0-89.0 | - | 935.6 | - | 346.5 276.1Table 11 note h | - | - | - | - |
| NOR Footnote B-12 | - | 55-90 | 75 | 1000 | 15 | 400 | - | - | - | - |
| 35Table 11 note h | 280Table 11 note h | |||||||||
| PRT Footnote B-18 | >17 | - | 75 | 1010 | 14 | 470 | - | - | - | - |
| QC Footnote B-5 | - | - | - | 1352 | - | 496 | - | 850 | - | 1200 |
| SAU Footnote B-16 | - | 60-80 | - | - | 18 | 630 | 15 | 800 | 16 | 1040 |
| 20Table 11 note h | 600Table 11 note h | |||||||||
| SWE Footnote B-7 | - | 60-80, Av: 70 | 75 | 1200 | 20 | 600 | - | - | - | - |
| USA Footnote B-4 | - | - | 75 | - | - | - | - | - | - | - |
It is difficult to make exact comparisons of the Canadian national DRLs and values in the literature given the numerous factors that affect the dose indices used to establish DRLs for specific examinations. This includes the clinical indications for a given examination type, the patient's size, and specifically for pediatric DRLs, the patient's age and the reference phantom against which the dose indices are reported. Within this report, pediatric body dose indices are corrected (as best as possible) relative to a 32cm standard phantom. Care should be exercised when reporting and adopting pediatric CTDI values - the corresponding reference phantom must be noted. Failure to verify this information could result in CTDI (and DLP) being reported incorrectly by a factor of ~2 (depending on scanner beam and shaping filtration etc.).
In general, the overall results are consistent with international DRLs. Key points to notice are that Canadian DRLs, although they fall in the upper range of literature values in some cases, are not outside the overall minimum and maximum of similar data reported elsewhere. The DRLs for pediatric body examinations seem well below international levels. These results may be attributable, in large part, to dose reduction initiatives of specialized pediatric centres and can serve as guidance to other imaging centres to help reduce doses to children.
Local regions or individual facilities are encouraged to use the data provided, or adopt a similar approach, to establish DRLs that are representative of local practice and further commit to regular assessment of these levels with changes in CT technology and radiological practice. This process will allow facilities to identify imaging practices where unnecessarily high doses are being used for a given clinical purpose, as well as doses which may be too low. Where local DRLs for a given examination type are lower than the national DRLs and where the examination protocol is deemed to provide acceptable diagnostic image quality, this report does not encourage increasing dose indices. In these cases, the existing DRL values should be maintained and even further reduced where possible, exercising the ALARA (As Low As Reasonably Achievable) principle; however, optimization is always a balance between sufficient diagnostic image quality and reduced dose. Radiation output, via CTDIvol, that is reduced too far could result in significantly increased image noise and a diagnostically sub-standard image, therefore any reductions in CTDIvol values or particularly low local DRLs should always be carefully evaluated.
Given the significant volume of information obtained in this survey, further analysis into size specific optimization for adult and pediatric DRLs is also possible. Future work could focus upon incorporation of Size Specific Dose Estimates (SSDE) or the use of water equivalent diameter concepts as recently presented Footnote A-22,Footnote A-23. Linking DRLs to general or standardized noise/image quality measures would also be a beneficial aid to help further optimize patient exposures.
5.0 Conclusions
The response to Canada's first survey of CT imaging was very positive and the success of the survey can be attributed to the high level of co-operation between HC, provincial/territorial governments and medical professionals who promoted the survey and participated in the data collection. The collaborative approach resulted in the collection of a large sample of imaging data, spanning a wide array of CT equipment technologies, for seven common CT examinations: Adult Head, Chest, Abdomen/Pelvis, and Chest/Abdomen/Pelvis and Pediatric Head, Chest, and Abdomen.
DRLs are an effective starting point for evaluating imaging protocols and identifying situations where doses may be unusually high. The availability of national DRLs in Canada will allow CT imaging facilities to review, compare, and evaluate their local practice with the national survey results. The level of detailed information in this report will also support identification of potential opportunities for further optimization of imaging and promote the use of a narrower range of doses. This process will ultimately reduce unnecessary tissue radiation doses and therefore lead to reduced potential health risks from radiation.
The publication of this report is an important step forward in providing guidance for the purpose of reducing patient exposure in CT imaging. It is hoped that the analysis and summaries presented in this report will be used to optimize CT scanning within Canada and also contribute further to international efforts in radiation protection of patients.
Appendix A - Samples of CT Survey Booklet Templates
Figure Section I - Text Equivalent
Figure is image of template page used to collect data from CT survey section one (I) of four. Blank spaces or Yes/No circle options are provided in order to record information on general scanner information for a given CT machine: Including vendor, model, manufactured and installation year. It also collects information on available features (e.g. dose reduction technology), specific type of machine (e.g. dual energy, simulator etc.), other clinical uses for and location of the CT scanner.
Figure Section II - Text Equivalent
Figure is image of template page used to collect data from section two (II) of CT survey. The table shown is a multi-row, four column arrangement with headings indicating the exam type being surveyed (e.g. Adult Head, Chest etc.). First column, starting from left, lists heading names of technical settings being collected, such as scan start/end position, x-ray tube voltage, use of contrast, and CTDI. Columns two and three are blank, leaving space to record values. The final column has a small section to indicate use of patient shielding and remaining row space, to bottom is blank - leaving room for any additional written comments.
Section two templates collected data from CT machines, as they are set-up or available, prior to actual scanning.
Figure Section III - Text Equivalent
Figure is image of template page used to collect data from section three (III) of CT survey. The table is almost identical to Section two, showing a multi-row, four column arrangement with headings indicating the exam type being surveyed (e.g. Adult Head, Chest etc.). First column, starting from left, lists heading names of technical settings being collected, such as scan start/end position, x-ray tube voltage, use of contrast, and CTDI. Columns two and three are blank, leaving space to record values. The final column has a small section to indicate use of patient shielding and remaining row space, to bottom is blank - leaving room for any additional written comments.
Section three templates collected data from CT machines, as they were applied to actual patients, or after actual scanning. In addition to the variables collected in section two, patient age, body mass, body habitus and additional dose indices (DLP for sequence and examination) were collected in this part of survey.
Figure Section IV - Text Equivalent
Figure is image of template page used to collect data from section four (IV) of CT survey. Data recorded here is from actual measurements using standard equipment: An ionisation chamber paired with an electrometer to measure air kerma or "dose" and standard, cylindrical plastic objects known as "phantoms". The measurement phantoms are placed in the CT scanner with the long (or longitudinal) axis parallel and centered to the length of the CT scanner patient table. Ultimately, a manual measurement of CTDI is obtained in order to compare with any "on-screen" values. Shown are two data recording sections, one directly above the other on a single page. The first section reserved for measurements on a 16cm diameter phantom, typically used to approximate an adult head and the second section is labelled for measurements on a 32cm diameter phantom, used to approximate standard sized adult torso.
Each section has spaces to measure and enter the Scan Field of View (SFOV) pre-set name and size in centimetres (cm). Two small circular diagrams, representing end face of phantom, outline positions within phantom where measurements must be taken: Centre, and one cm inward from phantom surface around periphery at 0, 90, 180 and 270 degrees. Holes are drilled longitudinally in standard phantoms for this purpose. Space is also given to record the manufacturers calculated, or on-screen measurement along with the measurement error in percent of the ionisation chamber/electrometer combination.
Appendix B - General Summary of Data Pools Used in Analysis (Individual Patient Sequences)
Tables below provide a summary of the total number of individual patient sequences or scan phases for examination types surveyed. Text in key cells is highlighted (bold) in order to draw attention to those sequences which met age and body mass criteria. Specifically, greater than or equal to 19 years of age and between 50 and 90 kg (inclusive) for adults, compared to less than or equal to 13 years of age and less than 50 kg for pediatric patients. Those sequences where mass was reported as not stated (NS) or not applicable (NA) shows the potential for increasing compliant sample size as discussed in section 2.3.2 above. Further explanatory notes are provided below each table.
Age is provided in ~99% of adult cases and greater than 99% of pediatric cases. Any future secondary analysis will most likely rely on age to provide context information on population sampled - age, mass, cross-sectional area etc. as function of dose indices, thus is important to include.
The seven (7) Tables below account for 24 279 of 24 280 individual patient data sequences in the survey database - one sequence was eliminated during analysis as it provided no patient characteristic or dose information.
| Restriction | Num. Samples (phases/seqs) | % Total | |
|---|---|---|---|
| Age (yrs.)Table 13 note * | Mass (kg - lbs also incl.) | ||
| ≥19 | <50 | 131 | 1.97 |
| >90 | 298 | 4.48 | |
| 50 ≤ X ≤ 90 | 4834 | 72.6 | |
| NS/NA | 1262 | 20.0 | |
| - | 6525 | 98.1 | |
| <19 | - | 64 | 1.0 |
| Age Provided | - | 6589 | 99.0 |
| Age Omitted | - | 65 | 0.98 |
| Totals: | 6654 | ~100 | |
In the tables for the adult examinations, (*) indicates that only cases where a valid age was provided are included. "Age Provided" summarizes the number of sequences for which age is given, "Age Omitted" where age is not given.
| Restriction | Num. Samples (phases/seqs) | % Total | |
|---|---|---|---|
| Age (yrs.)Table 14 note * | Mass (kg - lbs also incl.) | ||
| ≥19 | <50 | 95 | 2.02 |
| >90 | 277 | 5.89 | |
| 50 ≤ X ≤ 90 | 3489 | 74.2 | |
| NS/NA | 774 | 16.5 | |
| - | 4635 | 98.6 | |
| <19 | - | 10 | 0.21 |
| Age Provided | - | 4645 | 98.9 |
| Age Omitted | - | 54 | 1.15 |
| Totals: | 4699 | ~100 | |
| Restriction | Num. Samples (phases/seqs) | % Total | |
|---|---|---|---|
| Age (yrs.)Table 15 note * | Mass (kg - lbs also incl.) | ||
| ≥19 | <50 | 97 | 1.92 |
| >90 | 324 | 6.43 | |
| 50 ≤ X ≤ 90 | 3925 | 77.9 | |
| NS/NA | 621 | 12.3 | |
| - | 4967 | 98.6 | |
| <19 | - | 20 | 0.40 |
| Age Provided | - | 4987 | 99.0 |
| Age Omitted | - | 51 | 1.01 |
| Totals: | 5038 | ~100 | |
| Restriction | Num. Samples (phases/seqs) | % Total | |
|---|---|---|---|
| Age (yrs.)Table 16 note * | Mass (kg - lbs also incl.) | ||
| ≥19 | <50 | 142 | 2.03 |
| >90 | 395 | 5.65 | |
| 50 ≤ X ≤ 90 | 5428 | 77.6 | |
| NS/NA | 943 | 13.5 | |
| - | 6908 | 98.8 | |
| <19 | - | 9 | 0.13 |
| Age Provided | - | 6917 | 98.9 |
| Age Omitted | - | 78 | 1.12 |
| Totals: | 6995 | ~100 | |
| Restriction | Num. Samples (phases/seqs) | % Total | |
|---|---|---|---|
| Age (yrs.) | Mass (kg - lbs also incl.) | ||
| 0 < X ≤ 3 | ≥50 | 0 | 0.00 |
| <50 | 139 | 22.8 | |
| NS/NA | 65 | 10.7 | |
| - | 204 | 33.5 | |
| 3 < X ≤ 7 | ≥50 | 0 | 0.00 |
| <50 | 104 | 17.1 | |
| NS/NA | 55 | 9.03 | |
| - | 159 | 26.1 | |
| 7 < X ≤ 13 | ≥50 | 9 | 1.48 |
| <50 | 122 | 20.0 | |
| NS/NA | 95 | 15.6 | |
| - | 226 | 37.1 | |
| ≤13Table 17 note ** | - | 591 | 97.0 |
| >13Table 17 note * | - | 16 | 2.63 |
| Age Provided | - | 607 | 99.6 |
| Age Omitted | - | 2 | 0.33 |
| Totals: | 609 | ~100 | |
Similar to tables for adult examinations, in all tables for pediatric examinations (*) indicates that only cases where a valid age was provided are included. (**) includes cases where age = 0. In table above, two sequences indicated age = 0 yrs.
| Restriction | Num. Samples (phases/seqs) | % Total | |
|---|---|---|---|
| Age (yrs.) | Mass (kg - lbs also incl.) | ||
| 0 < X ≤ 3 | ≥50 | 0 | 0.00 |
| <50 | 49 | 36.8 | |
| NS/NA | 5 | 3.76 | |
| - | 54 | 40.6 | |
| 3 < X ≤ 7 | ≥50 | 0 | 0.00 |
| <50 | 36 | 27.1 | |
| NS/NA | 3 | 2.26 | |
| - | 39 | 29.3 | |
| 7 < X ≤ 13 | ≥50 | 2 | 1.50 |
| <50 | 33 | 24.8 | |
| NS/NA | 3 | 2.26 | |
| - | 38 | 28.6 | |
| ≤13Table 18 note ** | - | 131 | 98.5 |
| >13Table 18 note * | - | 2 | 1.50 |
| Age Provided | - | 133 | ~100 |
| Age Omitted | - | 0 | 0.00 |
| Totals: | 133 | ~100 | |
* See explanation below table B5. ** No cases where age = 0.
| Restriction | Num. Samples (phases/seqs) | % Total | |
|---|---|---|---|
| Age (yrs.) | Mass (kg - lbs also incl.) | ||
| 0 < X ≤ 3 | ≥50 | 0 | 0.00 |
| <50 | 35 | 23.2 | |
| NS/NA | 0 | 0.00 | |
| - | 35 | 23.2 | |
| 3 < X ≤ 7 | ≥50 | 0 | 0.00 |
| <50 | 45 | 29.8 | |
| NS/NA | 1 | 0.7 | |
| - | 46 | 30.5 | |
| 7 < X ≤ 13 | ≥50 | 8 | 5.30 |
| <50 | 45 | 29.8 | |
| NS/NA | 12 | 7.95 | |
| - | 65 | 43.0 | |
| ≤13Table 19 note ** | - | 146 | 96.7 |
| >13Table 19 note * | - | 4 | 2.65 |
| Age Provided | - | 150 | 99.3 |
| Age Omitted | - | 1 | 0.66 |
| Totals: | 151 | ~100 | |
* See explanation below table B5. ** No cases where age = 0.
Appendix C - Group/Sub-Group Individual Patient Data Summary Tables: Patient Characteristics and Dose Indices
Tables (in sets of three) are given below containing summaries of sample size, patient characteristics, and dose indices for all 13 examinations (groups) surveyed, as listed in Table 3 (four adult, and three pediatric X three age groups).
Each set of tables provides key descriptive values for the exam type as a whole or for the eight individual sub-groups of the given exam. The first table provides a summary of booklet, patient and sequence/scan phase counts, along with the average sequence to patient ratio and patient male/female count. The second table provides a select statistical summary of the corresponding patient characteristics: age (years); mass (kg); anterior - posterior (AP) and lateral (LAT) measures. Similarly, the third table provides a select statistical summary of key and related dose indices: CTDIvol (mGy, axial and helical separately); Scan Range (cm); scan length (cm); and DLP (mGy · cm, per sequence and whole exam).
Both Scan Range and length provide a quantitative link between CTDIvol and DLP, but differ in how they were originally designed to be collected and reported. Scan Range was intended to capture the overall measure of the planned distance to scan from the scan start to the scan stop position (see example of Section III survey template provided in Appendix A). This was to be correlated with secondary measures of actual scan distance: slice thickness and number of slices in axial scanning (their product giving scan length) and reported scan length in helical scanning - providing some redundancy of measure for scan distance. In either case, secondary measures were expected to be similar in value to Scan Range, but any differences would help reveal the extent of under or over-scanning along the z-axis. Unfortunately; the number of axial slices was often only reported for single rotations, not the entire scan region (i.e. product of the number of slices and slice thickness was only representative of total collimation for one rotation, not entire region). So ultimately, Scan Range gave best option for correlation with axial scanning dose indices, being representative of entire scan distance, but both Scan Range and scan length were well suited for correlation with helical scanning dose indices. Hence, why sub-group tables below summarizing axial scanning show Scan Range data and tables summarizing helical scanning show both Scan Range and scan length. In either case, their inclusion helps provide additional insight.
Ultimately, for each exam type surveyed there are potentially nine sets of summary tables. Using the Adult Head exam type as an example, these would be listed as follows:
- Group (Exam type) - Adult Head - considering all patient sequences/scan phases reported for that exam type and providing summary of group key descriptors and dose indices.
- Sub-group - Adult Head - Axial Mode Scan/No IV Contrast/Fixed Tube Current - considering contribution of only these segmented sequences via same key descriptors and dose indices)
- Sub-group - Adult Head - Axial/No Contrast/Dose Reduction technology employed
- Sub-group - Adult Head - Axial/With Contrast/Fixed Current
- Sub-group - Adult Head - Axial/With Contrast/Dose Reduction
- Sub-group - Adult Head - Helical/No Contrast/Fixed Current
- Sub-group - Adult Head - Helical/No Contrast/Dose Reduction
- Sub-group - Adult Head - Helical/With Contrast/Fixed Current
- Sub-group - Adult Head - Helical/No Contrast/Dose Reduction
For the purposes of the survey, the term dose reduction (DR) technologies was used throughout to collectively summarize available options on CT units which may ultimately result in potential dose savings - aware that the reduction in dose specifically arises from the devices' ability to produce images of similar quality at a lower dose for a given clinical purpose. Originally, the DR flag was intended to focus information capture on tube-current modulation schemes; however, many CT units now also apply iterative reconstruction techniques which aim to provide less noisy images at lower doses than non-iterative techniques and are marketed as dose reduction options, therefore these were also included under the DR term.
Ultimately, this means that "Fixed" versus "DR" in the report equates to comparison of fixed (constant) tube current versus any option (or combination of) that is designed to reduce dose:
- typical reconstruction technique and modulated tube current,
- iterative reconstruction and fixed tube current, and
- iterative reconstruction and modulated tube current.
In some sub-groups, there were an insufficient number of sequences (n < 10) reported, thus no summary tables are given. There were also five "border-line" cases where the number of sub-group sequences reported was ≥ 10, but the actual number of dose index or other key descriptor values reported were less than 10 - these cases were limited to pediatric sub-groups where overall numbers were relatively low. Table cells are highlighted below for those cases. Tables 8-10 (Section 3.2 above) use sequence numbers as a frequency weighted calculation, no sub-group patient characteristics or dose indices are used. Thus, the "border-line" sub-group cases have no direct impact on DRL recommendations here, but their summary data is used in Figures 7-32 (lower plots) to provide additional context for each exam. In two cases, Pediatric Head (3-7) and Pediatric Chest (3-7) the number of DLPseq values is less than 10 (n = 9), thus is technically below the threshold of minimum sample size imposed (n = 10), but close enough that it was thought appropriate to include in plots for completeness. Note that no sub-group DLPexam values are included in tables below, given that segmentation of data was performed and compiled on a per sequence basis; however, for consistency and appropriate relative comparison, DLPexam percentiles of sub-groups are included graphically in Figures 8-33.
There are two group (exam) cases (Pediatric Chest 0-3 and 3-7 years) where the 75th percentile of DLPseq is greater than that of DLPexam which seems counter-intuitive (DLPexam ≥ DLPseq); however, it occurs in those cases where the sample size (n) is low and reported DLPseq values were not inserted in both DLPseq and DLPexam boxes for single sequence examinations. It's clear in these small sample, single sequence cases, if a number of lower values are reported as DLPexam only, but no similar values are also reported as DLPseq then it affects the DLP distributions - the net result being, a slightly lower DLPexam. Data could have been "copied" in place, but a "report as-is" approach was taken. The greater of DLPseq and DLPexam has been taken as a conservative approach in such cases. For all pediatric body dose indices, values are reported relative to 32 cm reference phantom, as outlined in section 2.3.4.
Adult Head - Entire Group
| CT Units | 339 |
|---|---|
| Patients | 4071 |
| Sequences | 5495 |
| Seq/Pat Ratio | 1.35 |
| Male | 2264 |
| Female | 3200 |
| Group | Min | 25th % | Mean | Median | 75th % | Max | N | SD | IQRTable 21 note * |
|---|---|---|---|---|---|---|---|---|---|
| Age (yrs.) | 19.0 | 47.5 | 61.0 | 63.0 | 77.0 | 100.0 | 5495 | 19.1 | 29.5 |
| Mass (kg) | 49.9 | 62.1 | 70.6 | 70.3 | 79.4 | 90.0 | 4832 | 10.6 | 17.2 |
| AP (cm) | 13.8 | 17.8 | 18.4 | 18.6 | 19.4 | 23.1 | 4344 | 1.5 | 1.6 |
| LAT (cm) | 11.4 | 14.5 | 15.4 | 15.2 | 16.0 | 19.6 | 4243 | 1.4 | 1.5 |
| Group | Min | 25th % | Mean | Median | 75th % | Max | N | SD | IQR |
|---|---|---|---|---|---|---|---|---|---|
| axCTDIvol (mGy) | 6.1 | 55.0 | 69.7 | 63.4 | 83.4 | 281.3 | 3333 | 24.5 | 28.3 |
| Scan Range (cm) | 0.3 | 9.2 | 12.8 | 14.0 | 15.5 | 30.0 | 3482 | 5.2 | 6.3 |
| heCTDIvol (mGy) | 4.9 | 54.9 | 70.1 | 71.7 | 79.1 | 200.6 | 1796 | 20.0 | 24.2 |
| Scan Len. (cm) | 3.9 | 14.4 | 15.4 | 15.1 | 16.0 | 31.2 | 1453 | 1.7 | 1.6 |
| DLPseq (mGy · cm) | 6 | 479 | 808 | 709 | 1098 | 2558 | 4582 | 443 | 619 |
| DLPexam (mGy · cm) | 78 | 853 | 1137 | 1044 | 1302 | 5102 | 3735 | 449 | 449 |
Adult Head - Sub-Groups (8)
Adult Head - Axial / No Contrast / Fixed Current
| CT Units | 143 |
|---|---|
| Patients | 1519 |
| Sequences | 2288 |
| Seq/Pat Ratio | 1.51 |
| Male | 960 |
| Female | 1315 |
| Sub-Group | Min | 25th % | Mean | Median | 75th % | Max | n | SD | IQR |
|---|---|---|---|---|---|---|---|---|---|
| Age (yrs.) | 19.0 | 48.0 | 61.4 | 64.0 | 78.0 | 100.0 | 2288 | 19.4 | 30.0 |
| Mass (kg) | 49.9 | 62.1 | 70.6 | 71.0 | 79.4 | 90.0 | 2036 | 10.6 | 17.2 |
| AP (cm) | 13.8 | 17.6 | 18.3 | 18.5 | 19.3 | 23.0 | 1714 | 1.6 | 1.7 |
| LAT (cm) | 11.4 | 14.5 | 15.5 | 15.2 | 16.0 | 19.6 | 1713 | 1.5 | 1.5 |
| Sub-Group | Min | 25th % | Mean | Median | 75th % | Max | n | SD | IQR |
|---|---|---|---|---|---|---|---|---|---|
| axCTDIvol (mGy) | 11.48 | 57.1 | 72.9 | 65.7 | 87.9 | 281.3 | 2039 | 24.3 | 30.8 |
| Scan Range (cm) | 0.2 | 7.5 | 11.9 | 13.1 | 15.0 | 30.0 | 1323 | 5.8 | 7.5 |
| heCTDIvol (mGy) | - | - | - | - | - | - | 0 | - | - |
| Scan Len. (cm) | - | - | - | - | - | - | 0 | - | - |
| DLPseq (mGy · cm) | 6 | 455 | 681 | 599 | 848 | 2518 | 1940 | 354 | 393 |
Adult Head - Axial / No Contrast / Dose Reduction
| CT Units | 74 |
|---|---|
| Patients | 701 |
| Sequences | 1071 |
| Seq/Pat Ratio | 1.53 |
| Male | 407 |
| Female | 652 |
| Sub-Group | Min | 25th % | Mean | Median | 75th % | Max | N | SD | IQR |
|---|---|---|---|---|---|---|---|---|---|
| Age (yrs.) | 19.0 | 49.0 | 61.5 | 65.0 | 77.0 | 97.0 | 1071 | 18.7 | 28.0 |
| Mass (kg) | 49.9 | 63.0 | 70.2 | 68.9 | 79.4 | 90.0 | 986 | 10.4 | 16.4 |
| AP (cm) | 13.8 | 17.6 | 18.3 | 18.5 | 19.3 | 22.9 | 741 | 1.6 | 1.7 |
| LAT (cm) | 11.8 | 14.6 | 15.5 | 15.3 | 16.1 | 19.0 | 705 | 1.4 | 1.5 |
| Sub-Group | Min | 25th % | Mean | Median | 75th % | Max | N | SD | IQR |
|---|---|---|---|---|---|---|---|---|---|
| axCTDIvol (mGy) | 6.1 | 50.0 | 63.1 | 60.2 | 71.8 | 144.3 | 1052 | 21.9 | 21.9 |
| Scan Range (cm) | 0.4 | 6.1 | 10.2 | 9.5 | 14.0 | 20.0 | 772 | 4.4 | 7.9 |
| heCTDIvol (mGy) | - | - | - | - | - | - | 0 | - | - |
| Scan Len. (cm) | - | - | - | - | - | - | 0 | - | - |
| DLPseq (mGy · cm) | 27 | 338 | 567 | 472 | 748 | 1915 | 1032 | 340 | 410 |
Adult Head - Axial / Contrast / Fixed Current
| CT Units | 53 |
|---|---|
| Patients | 145 |
| Sequences | 198 |
| Seq/Pat Ratio | 1.37 |
| Male | 82 |
| Female | 116 |
| Sub-Group | Min | 25th % | Mean | Median | 75th % | Max | n | SD | IQR |
|---|---|---|---|---|---|---|---|---|---|
| Age (yrs.) | 19.0 | 44.3 | 56.5 | 57.0 | 69.0 | 91.0 | 198 | 17.5 | 24.8 |
| Mass (kg) | 49.9 | 64.4 | 71.8 | 72.6 | 80.0 | 89.8 | 190 | 9.9 | 15.6 |
| AP (cm) | 14.0 | 17.9 | 18.5 | 18.7 | 19.4 | 21.7 | 151 | 1.3 | 1.5 |
| LAT (cm) | 12.9 | 14.6 | 15.3 | 15.3 | 15.8 | 19.3 | 152 | 1.2 | 1.2 |
| Sub-Group | Min | 25th % | Mean | Median | 75th % | Max | n | SD | IQR |
|---|---|---|---|---|---|---|---|---|---|
| axCTDIvol (mGy) | 35.4 | 55.7 | 73.2 | 64.3 | 88.2 | 178.7 | 192 | 25.4 | 32.5 |
| Scan Range (cm) | 0.2 | 9.5 | 12.4 | 14.1 | 15.0 | 30.0 | 112 | 5.5 | 5.5 |
| heCTDIvol (mGy) | - | - | - | - | - | - | 0 | - | - |
| Scan Len. (cm) | - | - | - | - | - | - | 0 | - | - |
| DLPseq (mGy · cm) | 38 | 485 | 704 | 643 | 884 | 1643 | 184 | 340 | 399 |
Adult Head - Axial / Contrast / Dose Reduction
| CT Units | 22 |
|---|---|
| Patients | 55 |
| Sequences | 65 |
| Seq/Pat Ratio | 1.18 |
| Male | 16 |
| Female | 49 |
| Sub-Group | Min | 25th % | Mean | Median | 75th % | Max | n | SD | IQR |
|---|---|---|---|---|---|---|---|---|---|
| Age (yrs.) | 20.0 | 43.0 | 58.8 | 57.0 | 75.0 | 92.0 | 65 | 20.0 | 32.0 |
| Mass (kg) | 49.9 | 59.5 | 67.4 | 68.0 | 73.7 | 86.2 | 59 | 9.7 | 14.2 |
| AP (cm) | 14.0 | 17.5 | 17.9 | 18.0 | 19.0 | 20.2 | 52 | 1.5 | 1.5 |
| LAT (cm) | 12.7 | 14.1 | 15.3 | 14.8 | 16.0 | 19.0 | 50 | 1.8 | 1.9 |
| Sub-Group | Min | 25th % | Mean | Median | 75th % | Max | n | SD | IQR |
|---|---|---|---|---|---|---|---|---|---|
| axCTDIvol (mGy) | 39.1 | 52.7 | 62.6 | 57.1 | 70.6 | 147.7 | 61 | 18.4 | 17.9 |
| Scan Range (cm) | 3.8 | 6.8 | 10.9 | 10.2 | 14.3 | 20.0 | 39 | 4.6 | 7.5 |
| heCTDIvol (mGy) | - | - | - | - | - | - | 0 | - | - |
| Scan Len. (cm) | - | - | - | - | - | - | 0 | - | - |
| DLPseq (mGy · cm) | 243 | 432 | 633 | 601 | 798 | 1344 | 58 | 242 | 365 |
Adult Head - Helical / No Contrast / Fixed Current
| CT Units | 109 |
|---|---|
| Patients | 1215 |
| Sequences | 1223 |
| Seq/Pat Ratio | 1.01 |
| Male | 521 |
| Female | 699 |
| Sub-Group | Min | 25th % | Mean | Median | 75th % | Max | n | SD | IQR |
|---|---|---|---|---|---|---|---|---|---|
| Age (yrs.) | 19.0 | 47.0 | 61.0 | 63.0 | 77.0 | 99.0 | 1223 | 19.2 | 30.0 |
| Mass (kg) | 49.9 | 62.2 | 70.8 | 71.7 | 79.4 | 90.0 | 1042 | 10.9 | 17.2 |
| AP (cm) | 13.8 | 18.0 | 18.6 | 18.8 | 19.5 | 23.1 | 1146 | 1.4 | 1.5 |
| LAT (cm) | 11.8 | 14.5 | 15.3 | 15.1 | 15.9 | 19.6 | 1095 | 1.2 | 1.4 |
| Sub-Group | Min | 25th % | Mean | Median | 75th % | Max | n | SD | IQR |
|---|---|---|---|---|---|---|---|---|---|
| axCTDIvol (mGy) | - | - | - | - | - | - | 0 | - | - |
| Scan Range (cm) | 7.2 | 14.5 | 16.2 | 15.4 | 16.8 | 25.6 | 785 | 2.9 | 2.3 |
| heCTDIvol (mGy) | 26.9 | 60.1 | 74.2 | 74.4 | 79.1 | 186.6 | 1170 | 19.2 | 19.0 |
| Scan Len. (cm) | 9.8 | 14.4 | 15.4 | 15.2 | 16.0 | 31.2 | 1099 | 1.6 | 1.6 |
| DLPseq (mGy · cm) | 185 | 1084 | 1317 | 1276 | 1463 | 2558 | 851 | 369 | 379 |
Adult Head - Helical / No Contrast / Dose Reduction
| CT Units | 46 |
|---|---|
| Patients | 444 |
| Sequences | 469 |
| Seq/Pat Ratio | 1.06 |
| Male | 207 |
| Female | 260 |
| Sub-Group | Min | 25th % | Mean | Median | 75th % | Max | n | SD | IQR |
|---|---|---|---|---|---|---|---|---|---|
| Age (yrs.) | 19.0 | 47.0 | 61.2 | 63.0 | 78.0 | 97.0 | 469 | 19.9 | 31.0 |
| Mass (kg) | 49.9 | 60.2 | 69.8 | 70.3 | 79.4 | 90.0 | 351 | 11.6 | 19.2 |
| AP (cm) | 14.0 | 18.0 | 18.7 | 18.8 | 19.7 | 22.9 | 397 | 1.5 | 1.7 |
| LAT (cm) | 12.5 | 14.5 | 15.5 | 15.3 | 16.2 | 19.6 | 392 | 1.5 | 1.7 |
| Sub-Group | Min | 25th % | Mean | Median | 75th % | Max | n | SD | IQR |
|---|---|---|---|---|---|---|---|---|---|
| axCTDIvol (mGy) | - | - | - | - | - | - | 0 | - | - |
| Scan Range (cm) | 4.4 | 14.0 | 14.4 | 15.0 | 16.0 | 24.8 | 341 | 3.3 | 2.0 |
| heCTDIvol (mGy) | 4.9 | 45.2 | 57.4 | 55.1 | 64.9 | 105.4 | 448 | 15.6 | 19.7 |
| Scan Len. (cm) | 4.3 | 14.1 | 15.2 | 15.0 | 16.0 | 24.0 | 220 | 1.7 | 1.9 |
| DLPseq (mGy · cm) | 290 | 721 | 892 | 878 | 1082 | 1797 | 392 | 287 | 361 |
Adult Head - Helical / Contrast / Fixed Current
| CT Units | 49 |
|---|---|
| Patients | 127 |
| Sequences | 131 |
| Seq/Pat Ratio | 1.03 |
| Male | 54 |
| Female | 76 |
| Sub-Group | Min | 25th % | Mean | Median | 75th % | Max | n | SD | IQR |
|---|---|---|---|---|---|---|---|---|---|
| Age (yrs.) | 19.0 | 48.5 | 57.8 | 60.0 | 68.5 | 91.0 | 131 | 16.2 | 20.0 |
| Mass (kg) | 49.9 | 65.2 | 72.1 | 72.6 | 79.4 | 90.0 | 127 | 10.2 | 14.2 |
| AP (cm) | 14.2 | 18.5 | 19.1 | 19.2 | 19.8 | 23.1 | 107 | 1.3 | 1.3 |
| LAT (cm) | 12.5 | 14.7 | 15.4 | 15.3 | 16.1 | 19.1 | 101 | 1.2 | 1.4 |
| Sub-Group | Min | 25th % | Mean | Median | 75th % | Max | n | SD | IQR |
|---|---|---|---|---|---|---|---|---|---|
| axCTDIvol (mGy) | - | - | - | - | - | - | 0 | - | - |
| Scan Range (cm) | 13.0 | 14.5 | 16.0 | 15.5 | 17.0 | 25.5 | 63 | 2.2 | 2.6 |
| heCTDIvol (mGy) | 18.0 | 72.2 | 79.8 | 77.3 | 99.9 | 107.8 | 119 | 17.3 | 27.7 |
| Scan Len. (cm) | 6.4 | 14.6 | 15.6 | 15.5 | 16.3 | 20.9 | 116 | 1.7 | 1.7 |
| DLPseq (mGy · cm) | 521 | 1184 | 1389 | 1342 | 1580 | 2130 | 97 | 343 | 396 |
Adult Head - Helical / Contrast / Dose Reduction
| CT Units | 23 |
|---|---|
| Patients | 44 |
| Sequences | 50 |
| Seq/Pat Ratio | 1.14 |
| Male | 17 |
| Female | 33 |
| Sub-Group | Min | 25th % | Mean | Median | 75th % | Max | n | SD | IQR |
|---|---|---|---|---|---|---|---|---|---|
| Age (yrs.) | 21.0 | 42.5 | 55.8 | 60.5 | 66.8 | 84.0 | 50 | 16.0 | 24.3 |
| Mass (kg) | 51.0 | 65.0 | 71.2 | 68.9 | 76.2 | 89.0 | 41 | 9.0 | 11.2 |
| AP (cm) | 16.0 | 18.1 | 18.8 | 18.8 | 19.8 | 20.6 | 36 | 1.2 | 1.7 |
| LAT (cm) | 13.5 | 14.8 | 15.2 | 15.1 | 15.5 | 18.5 | 35 | 1.0 | 0.6 |
| Sub-Group | Min | 25th % | Mean | Median | 75th % | Max | n | SD | IQR |
|---|---|---|---|---|---|---|---|---|---|
| axCTDIvol (mGy) | - | - | - | - | - | - | 0 | - | - |
| Scan Range (cm) | 3.9 | 9.3 | 13.2 | 14.8 | 15.6 | 20.0 | 39 | 4.4 | 6.4 |
| heCTDIvol (mGy) | 29.4 | 46.8 | 60.4 | 56.0 | 64.9 | 200.6 | 42 | 27.5 | 18.1 |
| Scan Len. (cm) | 3.9 | 14.0 | 15.2 | 14.6 | 16.7 | 24.0 | 16 | 4.1 | 2.7 |
| DLPseq (mGy · cm) | 280 | 556 | 838 | 963 | 1047 | 1602 | 40 | 333 | 491 |
Adult Chest - Entire Group
| CT Units | 332 |
|---|---|
| Patients | 3770 |
| Sequences | 3908 |
| Seq/Pat Ratio | 1.04 |
| Male | 1865 |
| Female | 2020 |
| Group | Min | 25th % | Mean | Median | 75th % | Max | n | SD | IQR |
|---|---|---|---|---|---|---|---|---|---|
| Age (yrs.) | 19.0 | 56.0 | 65.0 | 66.0 | 75.0 | 100.0 | 3908 | 13.9 | 19.0 |
| Mass (kg) | 49.9 | 61.7 | 70.3 | 70.3 | 79.4 | 90.0 | 3487 | 10.9 | 17.7 |
| AP (cm) | 14.0 | 23.4 | 26.3 | 25.9 | 28.5 | 38.6 | 3654 | 4.1 | 5.1 |
| LAT (cm) | 20.0 | 30.9 | 33.6 | 34.0 | 36.5 | 47.5 | 3595 | 4.7 | 5.6 |
| Group | Min | 25th % | Mean | Median | 75th % | Max | n | SD | IQR |
|---|---|---|---|---|---|---|---|---|---|
| axCTDIvol (mGy) | 0.8 | 1.9 | 11.0 | 3.6 | 13.7 | 51.3 | 15 | 14.6 | 11.7 |
| Scan Range (cm) | 1.0 | 29.3 | 32.2 | 31.9 | 35.0 | 67.5 | 2649 | 5.5 | 5.8 |
| heCTDIvol (mGy) | 0.6 | 6.3 | 10.8 | 9.5 | 14.1 | 41.4 | 3638 | 5.9 | 7.8 |
| Scan Len. (cm) | 9.0 | 29.1 | 31.9 | 31.5 | 34.3 | 62.0 | 3151 | 4.9 | 5.2 |
| DLPseq (mGy · cm) | 3 | 224 | 375 | 334 | 483 | 1478 | 3279 | 212 | 260 |
| DLPexam (mGy · cm) | 39 | 236 | 401 | 362 | 521 | 2047 | 3357 | 222 | 285 |
Adult Chest - Sub-Groups (8)
Adult Chest - Axial / No Contrast / Fixed Current
Insufficient data, n = 7 (≥10 sequences set as threshold)
Adult Chest - Axial / No Contrast / Dose Reduction
Insufficient data, n = 5
Adult Chest - Axial / Contrast / Fixed Current
Insufficient data, n = 3
Adult Chest - Axial / Contrast / Dose Reduction
No data, n = 0
Adult Chest - Helical / No Contrast / Fixed Current
| CT Units | 50 |
|---|---|
| Patients | 165 |
| Sequences | 165 |
| Seq/Pat Ratio | 1.00 |
| Male | 70 |
| Female | 90 |
| Sub-Group | Min | 25th % | Mean | Median | 75th % | Max | n | SD | IQR |
|---|---|---|---|---|---|---|---|---|---|
| Age (yrs.) | 19.0 | 56.0 | 64.1 | 65.0 | 73.0 | 90.0 | 165 | 13.0 | 17.0 |
| Mass (kg) | 49.9 | 59.9 | 69.9 | 70.3 | 79.4 | 89.8 | 137 | 11.6 | 19.5 |
| AP (cm) | 17.8 | 22.8 | 25.7 | 25.5 | 27.6 | 37.0 | 133 | 4.0 | 4.8 |
| LAT (cm) | 20.0 | 30.4 | 33.2 | 33.6 | 36.0 | 46.8 | 127 | 5.2 | 5.6 |
| Sub-Group | Min | 25th % | Mean | Median | 75th % | Max | n | SD | IQR |
|---|---|---|---|---|---|---|---|---|---|
| axCTDIvol (mGy) | - | - | - | - | - | - | 0 | - | - |
| Scan Range (cm) | 3.9 | 29.1 | 31.1 | 32.0 | 34.6 | 50.0 | 93 | 8.1 | 5.5 |
| heCTDIvol (mGy) | 1.1 | 3.2 | 9.4 | 5.7 | 15.9 | 35.5 | 145 | 8.2 | 12.7 |
| Scan Len. (cm) | 17.4 | 29.8 | 33.5 | 32.5 | 35.6 | 51.6 | 132 | 6.4 | 5.9 |
| DLPseq (mGy · cm) | 3 | 116 | 424 | 235 | 706 | 1478 | 107 | 401 | 590 |
Adult Chest - Helical / No Contrast / Dose Reduction
| CT Units | 272 |
|---|---|
| Patients | 1528 |
| Sequences | 1539 |
| Seq/Pat Ratio | 1.01 |
| Male | 718 |
| Female | 810 |
| Sub-Group | Min | 25th % | Mean | Median | 75th % | Max | n | SD | IQR |
|---|---|---|---|---|---|---|---|---|---|
| Age (yrs.) | 19.0 | 56.0 | 65.1 | 66.0 | 75.0 | 97.0 | 1539 | 13.5 | 19.0 |
| Mass (kg) | 49.9 | 62.2 | 70.5 | 70.3 | 79.4 | 90.0 | 1318 | 10.8 | 17.2 |
| AP (cm) | 15.8 | 23.6 | 26.5 | 26.0 | 28.9 | 38.6 | 1456 | 4.1 | 5.3 |
| LAT (cm) | 20.1 | 31.0 | 33.6 | 33.9 | 36.5 | 47.0 | 1438 | 4.6 | 5.5 |
| Sub-Group | Min | 25th % | Mean | Median | 75th % | Max | n | SD | IQR |
|---|---|---|---|---|---|---|---|---|---|
| axCTDIvol (mGy) | - | - | - | - | - | - | 0 | - | - |
| Scan Range (cm) | 1.0 | 29.3 | 32.2 | 31.7 | 34.8 | 62.0 | 1098 | 4.9 | 5.5 |
| heCTDIvol (mGy) | 0.6 | 5.7 | 9.8 | 8.5 | 13.0 | 36.6 | 1475 | 5.5 | 7.3 |
| Scan Len. (cm) | 9.0 | 29.0 | 31.4 | 31.2 | 33.8 | 62.0 | 1184 | 4.1 | 4.8 |
| DLPseq (mGy · cm) | 5 | 197 | 334 | 302 | 440 | 1323 | 1316 | 188 | 243 |
Adult Chest - Helical / Contrast / Fixed Current
| CT Units | 34 |
|---|---|
| Patients | 142 |
| Sequences | 143 |
| Seq/Pat Ratio | 1.01 |
| Male | 63 |
| Female | 80 |
| Sub-Group | Min | 25th % | Mean | Median | 75th % | Max | n | SD | IQR |
|---|---|---|---|---|---|---|---|---|---|
| Age (yrs.) | 23.0 | 57.5 | 65.3 | 67.0 | 75.0 | 91.0 | 143 | 13.4 | 17.5 |
| Mass (kg) | 49.9 | 60.3 | 70.1 | 70.3 | 79.4 | 90.0 | 137 | 10.8 | 19.1 |
| AP (cm) | 18.2 | 24.0 | 26.4 | 26.0 | 28.5 | 36.1 | 110 | 3.6 | 4.5 |
| LAT (cm) | 20.7 | 30.9 | 34.6 | 35.6 | 38.8 | 44.7 | 110 | 5.5 | 8.0 |
| Sub-Group | Min | 25th % | Mean | Median | 75th % | Max | n | SD | IQR |
|---|---|---|---|---|---|---|---|---|---|
| axCTDIvol (mGy) | - | - | - | - | - | - | 0 | - | - |
| Scan Range (cm) | 18.3 | 29.5 | 32.5 | 32.0 | 34.1 | 50.0 | 67 | 5.7 | 4.6 |
| heCTDIvol (mGy) | 3.1 | 12.4 | 16.1 | 14.1 | 18.3 | 35.8 | 117 | 6.3 | 5.9 |
| Scan Len. (cm) | 18.3 | 28.6 | 31.1 | 31.4 | 33.5 | 40.5 | 127 | 3.5 | 4.9 |
| DLPseq (mGy · cm) | 108 | 443 | 561 | 496 | 688 | 1374 | 101 | 242 | 245 |
Adult Chest - Helical / Contrast / Dose Reduction
| CT Units | 282 |
|---|---|
| Patients | 1960 |
| Sequences | 2046 |
| Seq/Pat Ratio | 1.04 |
| Male | 1004 |
| Female | 1035 |
| Sub-Group | Min | 25th % | Mean | Median | 75th % | Max | n | SD | IQR |
|---|---|---|---|---|---|---|---|---|---|
| Age (yrs.) | 19.0 | 56.0 | 64.9 | 66.0 | 75.0 | 100.0 | 2046 | 14.3 | 19.0 |
| Mass (kg) | 49.9 | 61.5 | 70.2 | 70.3 | 79.3 | 90.0 | 1881 | 10.8 | 17.8 |
| AP (cm) | 14.0 | 23.3 | 26.2 | 25.8 | 28.4 | 38.4 | 1940 | 4.2 | 5.1 |
| LAT (cm) | 20.0 | 30.8 | 33.6 | 33.8 | 36.3 | 47.5 | 1905 | 4.6 | 5.5 |
| Sub-Group | Min | 25th % | Mean | Median | 75th % | Max | n | SD | IQR |
|---|---|---|---|---|---|---|---|---|---|
| axCTDIvol (mGy) | - | - | - | - | - | - | 0 | - | - |
| Scan Range (cm) | 1.0 | 29.0 | 32.4 | 32.0 | 35.4 | 67.5 | 1382 | 5.7 | 6.4 |
| heCTDIvol (mGy) | 1.3 | 6.9 | 11.3 | 10.0 | 14.5 | 41.4 | 1905 | 5.7 | 7.6 |
| Scan Len. (cm) | 9.1 | 29.1 | 32.1 | 31.8 | 34.8 | 60.2 | 1706 | 5.3 | 5.7 |
| DLPseq (mGy · cm) | 6 | 248 | 394 | 356 | 503 | 1370 | 1740 | 200 | 255 |
Adult Abdo/Pelvis - Entire Group
| CT Units | 333 |
|---|---|
| Patients | 3908 |
| Sequences | 4245 |
| Seq/Pat Ratio | 1.09 |
| Male | 1909 |
| Female | 2317 |
| Group | Min | 25th % | Mean | Median | 75th % | Max | n | SD | IQR |
|---|---|---|---|---|---|---|---|---|---|
| Age (yrs.) | 19.0 | 50.0 | 60.2 | 61.0 | 73.0 | 100.0 | 4245 | 16.3 | 23.0 |
| Mass (kg) | 49.9 | 62.7 | 70.7 | 71.0 | 79.4 | 90.0 | 3925 | 10.7 | 16.7 |
| AP (cm) | 13.0 | 23.0 | 26.4 | 25.9 | 29.4 | 40.8 | 3864 | 4.8 | 6.4 |
| LAT (cm) | 19.2 | 30.7 | 33.5 | 33.6 | 36.3 | 47.8 | 3804 | 4.8 | 5.6 |
| Group | Min | 25th % | Mean | Median | 75th % | Max | n | SD | IQR |
|---|---|---|---|---|---|---|---|---|---|
| axCTDIvol (mGy) | 3.3 | 9.4 | 17.9 | 16.4 | 23.0 | 52.5 | 37 | 10.9 | 13.6 |
| Scan Range (cm) | 0.5 | 41.0 | 43.6 | 44.1 | 47.5 | 88.5 | 2860 | 8.5 | 6.5 |
| heCTDIvol (mGy) | 1.0 | 9.1 | 14.6 | 12.8 | 18.1 | 66.9 | 3953 | 7.7 | 9.1 |
| Scan Len. (cm) | 5.4 | 40.8 | 42.7 | 43.8 | 46.7 | 89.9 | 3411 | 7.9 | 5.9 |
| DLPseq (mGy · cm) | 3.5 | 389 | 630 | 562 | 806 | 3085 | 3591 | 348 | 417 |
| DLPexam (mGy · cm) | 124 | 427 | 700 | 609 | 874 | 2993 | 3483 | 385 | 446 |
Adult Abdo/Pelvis - Sub-Groups (8)
Adult Abdo/Pelvis - Axial / No Contrast / Fixed Current
No data, n = 0
Adult Abdo/Pelvis - Axial / No Contrast / Dose Reduction
No data, n = 0
Adult Abdo/Pelvis - Axial / Contrast / Fixed Current
| CT Units | 4 |
|---|---|
| Patients | 33 |
| Sequences | 33 |
| Seq/Pat Ratio | 1.00 |
| Male | 19 |
| Female | 14 |
| Sub-Group | Min | 25th % | Mean | Median | 75th % | Max | n | SD | IQR |
|---|---|---|---|---|---|---|---|---|---|
| Age (yrs.) | 34.0 | 51.0 | 62.5 | 65.0 | 73.0 | 83.0 | 33 | 13.8 | 22.0 |
| Mass (kg) | 49.9 | 65.8 | 72.2 | 72.6 | 80.3 | 89.8 | 33 | 10.1 | 14.5 |
| AP (cm) | 16.9 | 20.7 | 22.8 | 22.6 | 25.8 | 28.6 | 13 | 3.6 | 5.1 |
| LAT (cm) | 25.6 | 30.5 | 32.0 | 32.1 | 33.3 | 39.5 | 13 | 3.5 | 2.8 |
| Sub-Group | Min | 25th % | Mean | Median | 75th % | Max | n | SD | IQR |
|---|---|---|---|---|---|---|---|---|---|
| axCTDIvol (mGy) | 3.3 | 9.4 | 18.1 | 16.4 | 23.5 | 52.5 | 33 | 11.5 | 14.1 |
| Scan Range (cm) | - | - | - | - | - | - | 0 | - | - |
| heCTDIvol (mGy) | - | - | - | - | - | - | 0 | - | - |
| Scan Len. (cm) | - | - | - | - | - | - | 0 | - | - |
| DLPseq (mGy · cm) | 4 | 7 | 11 | 9 | 15 | 27 | 33 | 7 | 8 |
Adult Abdo/Pelvis - Axial / Contrast / Dose Reduction
Insufficient data, n = 5.
Adult Abdo/Pelvis - Helical / No Contrast / Fixed Current
| CT Units | 22 |
|---|---|
| Patients | 66 |
| Sequences | 67 |
| Seq/Pat Ratio | 1.02 |
| Male | 40 |
| Female | 27 |
| Sub-Group | Min | 25th % | Mean | Median | 75th % | Max | n | SD | IQR |
|---|---|---|---|---|---|---|---|---|---|
| Age (yrs.) | 24.0 | 57.5 | 63.9 | 65.0 | 72.5 | 90.0 | 67 | 14.5 | 15.0 |
| Mass (kg) | 49.9 | 65.8 | 72.5 | 72.0 | 79.8 | 90.0 | 53 | 10.3 | 14.1 |
| AP (cm) | 14.0 | 21.7 | 24.5 | 23.9 | 26.4 | 38.1 | 48 | 4.8 | 4.7 |
| LAT (cm) | 23.0 | 31.6 | 34.6 | 35.4 | 37.0 | 45.4 | 46 | 4.8 | 5.4 |
| Sub-Group | Min | 25th % | Mean | Median | 75th % | Max | n | SD | IQR |
|---|---|---|---|---|---|---|---|---|---|
| axCTDIvol (mGy) | - | - | - | - | - | - | 0 | - | - |
| Scan Range (cm) | 1.1 | 20.5 | 31.3 | 28.3 | 43.5 | 80.0 | 29 | 18.1 | 23.0 |
| heCTDIvol (mGy) | 9.8 | 17.5 | 22.4 | 23.7 | 26.5 | 43.3 | 60 | 7.8 | 9.0 |
| Scan Len. (cm) | 19.0 | 35.4 | 41.6 | 43.0 | 48.5 | 84.6 | 53 | 12.4 | 12.6 |
| DLPseq (mGy · cm) | 62 | 491 | 952 | 1013 | 1226 | 3085 | 58 | 617 | 734 |
Adult Abdo/Pelvis - Helical / No Contrast / Dose Reduction
| CT Units | 163 |
|---|---|
| Patients | 415 |
| Sequences | 429 |
| Seq/Pat Ratio | 1.03 |
| Male | 196 |
| Female | 231 |
| Sub-Group | Min | 25th % | Mean | Median | 75th % | Max | n | SD | IQR |
|---|---|---|---|---|---|---|---|---|---|
| Age (yrs.) | 19.0 | 52.0 | 63.3 | 65.0 | 75.0 | 97.0 | 429 | 16.0 | 23.0 |
| Mass (kg) | 49.9 | 63.1 | 71.0 | 72.0 | 79.4 | 90.0 | 376 | 10.6 | 16.2 |
| AP (cm) | 14.0 | 23.2 | 26.4 | 26.0 | 29.0 | 40.1 | 385 | 4.3 | 5.8 |
| LAT (cm) | 20.0 | 31.3 | 33.9 | 34.0 | 36.4 | 47.0 | 381 | 4.5 | 5.1 |
| Sub-Group | Min | 25th % | Mean | Median | 75th % | Max | n | SD | IQR |
|---|---|---|---|---|---|---|---|---|---|
| axCTDIvol (mGy) | - | - | - | - | - | - | 0 | - | - |
| Scan Range (cm) | 1.0 | 39.0 | 41.0 | 43.8 | 48.0 | 88.5 | 295 | 11.1 | 9.0 |
| heCTDIvol (mGy) | 3.5 | 8.6 | 14.2 | 12.9 | 17.6 | 45.6 | 416 | 7.3 | 9.0 |
| Scan Len. (cm) | 8.9 | 37.8 | 39.7 | 43.0 | 46.5 | 54.1 | 305 | 10.3 | 8.7 |
| DLPseq (mGy · cm) | 9 | 349 | 590 | 516 | 735 | 2333 | 359 | 352 | 386 |
Adult Abdo/Pelvis - Helical / Contrast / Fixed Current
| CT Units | 36 |
|---|---|
| Patients | 200 |
| Sequences | 217 |
| Seq/Pat Ratio | 1.09 |
| Male | 100 |
| Female | 117 |
| Sub-Group | Min | 25th % | Mean | Median | 75th % | Max | n | SD | IQR |
|---|---|---|---|---|---|---|---|---|---|
| Age (yrs.) | 20.0 | 53.0 | 62.2 | 64.0 | 75.0 | 94.0 | 217 | 16.2 | 22.0 |
| Mass (kg) | 49.9 | 63.5 | 70.9 | 70.3 | 78.0 | 90.0 | 216 | 9.8 | 14.5 |
| AP (cm) | 14.2 | 24.4 | 28.5 | 28.0 | 32.4 | 39.7 | 162 | 5.2 | 8.1 |
| LAT (cm) | 19.5 | 27.9 | 32.7 | 32.5 | 37.0 | 47.8 | 157 | 6.3 | 9.1 |
| Sub-Group | Min | 25th % | Mean | Median | 75th % | Max | n | SD | IQR |
|---|---|---|---|---|---|---|---|---|---|
| axCTDIvol (mGy) | - | - | - | - | - | - | 0 | - | - |
| Scan Range (cm) | 8.5 | 40.9 | 47.0 | 45.5 | 50.0 | 85.0 | 110 | 16.4 | 9.1 |
| heCTDIvol (mGy) | 5.3 | 13.7 | 18.9 | 17.5 | 24.1 | 44.2 | 180 | 7.4 | 10.3 |
| Scan Len. (cm) | 5.0 | 40.0 | 41.4 | 43.8 | 46.5 | 73.5 | 197 | 9.4 | 6.5 |
| DLPseq (mGy · cm) | 138 | 595 | 825 | 843 | 956 | 1990 | 162 | 344 | 362 |
Adult Abdo/Pelvis - Helical / Contrast / Dose Reduction
| CT Units | 316 |
|---|---|
| Patients | 3358 |
| Sequences | 3494 |
| Seq/Pat Ratio | 1.04 |
| Male | 1552 |
| Female | 1925 |
| Sub-Group | Min | 25th % | Mean | Median | 75th % | Max | n | SD | IQR |
|---|---|---|---|---|---|---|---|---|---|
| Age (yrs.) | 19.0 | 49.0 | 59.6 | 61.0 | 72.0 | 100.0 | 3494 | 16.3 | 23.0 |
| Mass (kg) | 49.9 | 62.6 | 70.6 | 70.8 | 79.4 | 90.0 | 3242 | 10.8 | 16.8 |
| AP (cm) | 13.0 | 23.0 | 26.4 | 25.8 | 29.2 | 40.8 | 3251 | 4.8 | 6.2 |
| LAT (cm) | 19.2 | 30.7 | 33.5 | 33.5 | 36.3 | 47.8 | 3202 | 4.7 | 5.6 |
| Sub-Group | Min | 25th % | Mean | Median | 75th % | Max | n | SD | IQR |
|---|---|---|---|---|---|---|---|---|---|
| axCTDIvol (mGy) | - | - | - | - | - | - | 0 | - | - |
| Scan Range (cm) | 3.8 | 41.3 | 43.9 | 44.1 | 47.5 | 81.1 | 2422 | 6.9 | 6.2 |
| heCTDIvol (mGy) | 1.0 | 8.9 | 14.3 | 12.4 | 17.7 | 66.9 | 3295 | 7.6 | 8.8 |
| Scan Len. (cm) | 5.4 | 41.0 | 43.1 | 43.8 | 46.8 | 89.9 | 2859 | 7.4 | 5.8 |
| DLPseq (mGy · cm) | 5 | 394 | 626 | 557 | 792 | 2645 | 2972 | 329 | 399 |
Adult Che/Abd/Pel - Entire Group
| CT Units | 316 |
|---|---|
| Patients | 3444 |
| Sequences | 5878 |
| Seq/Pat Ratio | 1.71 |
| Male | 2860 |
| Female | 3009 |
| Group | Min | 25th % | Mean | Median | 75th % | Max | n | SD | IQR |
|---|---|---|---|---|---|---|---|---|---|
| Age (yrs.) | 19.0 | 56.0 | 64.2 | 65.0 | 74.0 | 97.0 | 5878 | 13.7 | 18.0 |
| Mass (kg) | 49.9 | 63.5 | 71.2 | 72.0 | 79.4 | 90.0 | 5427 | 10.5 | 15.9 |
| AP (cm) | 13.0 | 23.2 | 26.3 | 25.7 | 29.0 | 39.7 | 5320 | 4.4 | 5.8 |
| LAT (cm) | 20.0 | 31.0 | 33.8 | 33.9 | 36.7 | 47.7 | 5224 | 4.6 | 5.7 |
| Group | Min | 25th % | Mean | Median | 75th % | Max | n | SD | IQR |
|---|---|---|---|---|---|---|---|---|---|
| axCTDIvol (mGy) | 2.3 | 11.7 | 21.7 | 16.4 | 19.4 | 84.1 | 27 | 19.6 | 7.7 |
| Scan Range (cm) | 0.5 | 31.1 | 42.9 | 41.8 | 50.5 | 100.0 | 3882 | 14.7 | 19.4 |
| heCTDIvol (mGy) | 1.2 | 8.4 | 13.3 | 12.2 | 16.6 | 51.8 | 5474 | 6.7 | 8.2 |
| Scan Len. (cm) | 1.5 | 31.2 | 42.9 | 41.8 | 50.5 | 97.4 | 4593 | 13.6 | 19.3 |
| DLPseq (mGy · cm) | 1 | 335 | 570 | 502 | 723 | 2853 | 5256 | 332 | 389 |
| DLPexam (mGy · cm) | 210 | 662 | 1021 | 931 | 1269 | 4344 | 3213 | 494 | 608 |
Adult Che/Abd/Pel - Sub-Groups (8)
Adult Che/Abd/Pel - Axial / No Contrast / Fixed Current
No data, n = 0.
Adult Che/Abd/Pel - Axial / No Contrast / Dose Reduction
No data, n = 0
Adult Che/Abd/Pel - Axial / Contrast / Fixed Current
| CT Units | 2 |
|---|---|
| Patients | 24 |
| Sequences | 24 |
| Seq/Pat Ratio | 1.00 |
| Male | 14 |
| Female | 10 |
| Sub-Group | Min | 25th % | Mean | Median | 75th % | Max | n | SD | IQR |
|---|---|---|---|---|---|---|---|---|---|
| Age (yrs.) | 32.0 | 56.8 | 62.6 | 64.0 | 71.0 | 78.0 | 24 | 11.5 | 14.3 |
| Mass (kg) | 54.4 | 64.5 | 71.7 | 71.3 | 79.9 | 90.0 | 24 | 11.4 | 15.4 |
| AP (cm) | 25.1 | 25.3 | 25.4 | 25.4 | 25.6 | 25.7 | 2 | 0.4 | 0.3 |
| LAT (cm) | 32.3 | 32.9 | 33.4 | 33.4 | 34.0 | 34.5 | 2 | 1.6 | 1.1 |
| Sub-Group | Min | 25th % | Mean | Median | 75th % | Max | n | SD | IQR |
|---|---|---|---|---|---|---|---|---|---|
| axCTDIvol (mGy) | 2.3 | 11.7 | 16.6 | 14.1 | 18.8 | 32.8 | 24 | 8.3 | 7.0 |
| Scan Range (cm) | - | - | - | - | - | - | 0 | - | - |
| heCTDIvol (mGy) | - | - | - | - | - | - | 0 | - | - |
| Scan Len. (cm) | - | - | - | - | - | - | 0 | - | - |
| DLPseq (mGy · cm) | 1 | 6 | 9 | 8 | 10 | 16 | 24 | 4 | 4 |
Adult Che/Abd/Pel - Axial / Contrast / Dose Reduction
Insufficient data, n = 3.
Adult Che/Abd/Pel - Helical / No Contrast / Fixed Current
| CT Units | 23 |
|---|---|
| Patients | 71 |
| Sequences | 80 |
| Seq/Pat Ratio | 1.13 |
| Male | 39 |
| Female | 41 |
| Sub-Group | Min | 25th % | Mean | Median | 75th % | Max | n | SD | IQR |
|---|---|---|---|---|---|---|---|---|---|
| Age (yrs.) | 21.0 | 57.8 | 66.5 | 69.0 | 76.0 | 88.0 | 80 | 13.5 | 18.3 |
| Mass (kg) | 49.9 | 63.0 | 70.8 | 71.7 | 79.5 | 89.8 | 80 | 11.6 | 16.4 |
| AP (cm) | 20.9 | 24.1 | 26.5 | 25.9 | 29.0 | 37.0 | 34 | 3.5 | 4.9 |
| LAT (cm) | 27.9 | 31.3 | 34.2 | 33.4 | 35.9 | 47.1 | 33 | 4.7 | 4.6 |
| Sub-Group | Min | 25th % | Mean | Median | 75th % | Max | n | SD | IQR |
|---|---|---|---|---|---|---|---|---|---|
| axCTDIvol (mGy) | - | - | - | - | - | - | 0 | - | - |
| Scan Range (cm) | 2.4 | 20.7 | 31.0 | 25.8 | 36.6 | 69.9 | 36 | 17.5 | 15.9 |
| heCTDIvol (mGy) | 4.9 | 9.7 | 15.5 | 14.4 | 18.0 | 38.0 | 75 | 7.6 | 8.3 |
| Scan Len. (cm) | 10.0 | 24.0 | 35.4 | 28.5 | 44.5 | 69.9 | 35 | 15.4 | 20.5 |
| DLPseq (mGy · cm) | 52 | 316 | 528 | 463 | 647 | 2027 | 71 | 351 | 331 |
Adult Che/Abd/Pel - Helical / No Contrast / Dose Reduction
| CT Units | 118 |
|---|---|
| Patients | 243 |
| Sequences | 310 |
| Seq/Pat Ratio | 1.28 |
| Male | 162 |
| Female | 147 |
| Sub-Group | Min | 25th % | Mean | Median | 75th % | Max | n | SD | IQR |
|---|---|---|---|---|---|---|---|---|---|
| Age (yrs.) | 21.0 | 59.0 | 68.1 | 71.0 | 79.0 | 92.0 | 310 | 13.9 | 20.0 |
| Mass (kg) | 49.9 | 61.4 | 71.0 | 72.6 | 79.4 | 90.0 | 277 | 11.5 | 18.0 |
| AP (cm) | 17.9 | 23.6 | 26.3 | 25.6 | 28.2 | 38.0 | 258 | 4.1 | 4.6 |
| LAT (cm) | 23.0 | 31.1 | 34.1 | 34.0 | 37.0 | 47.5 | 251 | 4.1 | 5.9 |
| Sub-Group | Min | 25th % | Mean | Median | 75th % | Max | n | SD | IQR |
|---|---|---|---|---|---|---|---|---|---|
| axCTDIvol (mGy) | - | - | - | - | - | - | 0 | - | - |
| Scan Range (cm) | 1.5 | 33.8 | 44.6 | 43.0 | 59.6 | 97.4 | 227 | 16.4 | 25.8 |
| heCTDIvol (mGy) | 1.9 | 7.9 | 13.4 | 12.6 | 17.4 | 35.4 | 294 | 6.5 | 9.5 |
| Scan Len. (cm) | 16.4 | 35.2 | 48.6 | 47.1 | 62.5 | 97.4 | 225 | 15.4 | 27.3 |
| DLPseq (mGy · cm) | 15 | 357 | 604 | 564 | 818 | 1693 | 282 | 334 | 461 |
Adult Che/Abd/Pel - Helical / Contrast / Fixed Current
| CT Units | 43 |
|---|---|
| Patients | 205 |
| Sequences | 318 |
| Seq/Pat Ratio | 1.55 |
| Male | 154 |
| Female | 164 |
| Sub-Group | Min | 25th % | Mean | Median | 75th % | Max | n | SD | IQR |
|---|---|---|---|---|---|---|---|---|---|
| Age (yrs.) | 22.0 | 57.3 | 64.7 | 66.0 | 73.0 | 93.0 | 318 | 13.7 | 15.8 |
| Mass (kg) | 49.9 | 61.2 | 70.4 | 71.7 | 78.0 | 90.0 | 317 | 10.6 | 16.8 |
| AP (cm) | 18.0 | 23.8 | 27.5 | 27.0 | 30.8 | 39.5 | 234 | 4.8 | 6.9 |
| LAT (cm) | 20.0 | 30.0 | 33.8 | 33.9 | 38.0 | 47.5 | 234 | 5.9 | 8.0 |
| Sub-Group | Min | 25th % | Mean | Median | 75th % | Max | n | SD | IQR |
|---|---|---|---|---|---|---|---|---|---|
| axCTDIvol (mGy) | - | - | - | - | - | - | 0 | - | - |
| Scan Range (cm) | 18.0 | 31.9 | 49.7 | 42.5 | 61.3 | 120.0 | 152 | 24.9 | 29.4 |
| heCTDIvol (mGy) | 3.1 | 13.2 | 15.6 | 14.1 | 18.5 | 41.9 | 269 | 5.5 | 5.3 |
| Scan Len. (cm) | 1.5 | 30.6 | 40.7 | 40.5 | 46.4 | 74.0 | 261 | 12.8 | 15.8 |
| DLPseq (mGy · cm) | 103 | 485 | 683 | 663 | 809 | 1656 | 236 | 287 | 324 |
Adult Che/Abd/Pel - Helical / Contrast / Dose Reduction
| CT Units | 298 |
|---|---|
| Patients | 3109 |
| Sequences | 5143 |
| Seq/Pat Ratio | 1.65 |
| Male | 2489 |
| Female | 2646 |
| Sub-Group | Min | 25th % | Mean | Median | 75th % | Max | n | SD | IQR |
|---|---|---|---|---|---|---|---|---|---|
| Age (yrs.) | 19.0 | 56.0 | 63.9 | 65.0 | 74.0 | 97.0 | 5143 | 13.7 | 18.0 |
| Mass (kg) | 49.9 | 63.5 | 71.2 | 72.0 | 79.4 | 90.0 | 4726 | 10.5 | 15.9 |
| AP (cm) | 13.0 | 23.1 | 26.3 | 25.7 | 29.0 | 39.7 | 4789 | 4.4 | 5.9 |
| LAT (cm) | 20.0 | 31.0 | 33.7 | 33.9 | 36.6 | 47.7 | 4701 | 4.6 | 5.6 |
| Sub-Group | Min | 25th % | Mean | Median | 75th % | Max | n | SD | IQR |
|---|---|---|---|---|---|---|---|---|---|
| axCTDIvol (mGy) | - | - | - | - | - | - | 0 | - | - |
| Scan Range (cm) | 6.4 | 31.2 | 43.0 | 41.8 | 50.1 | 99.5 | 3464 | 14.3 | 19.0 |
| heCTDIvol (mGy) | 1.2 | 8.3 | 13.2 | 11.8 | 16.4 | 51.8 | 4839 | 6.8 | 8.1 |
| Scan Len. (cm) | 10.0 | 31.1 | 42.8 | 41.7 | 50.0 | 87.8 | 4072 | 13.5 | 18.9 |
| DLPseq (mGy · cm) | 6 | 331 | 567 | 497 | 717 | 2853 | 4636 | 331 | 385 |
Pediatric Head (0<X≤3) - Entire Group
| CT Units | 53 |
|---|---|
| Patients | 151 |
| Sequences | 174 |
| Seq/Pat Ratio | 1.15 |
| Male | 118 |
| Female | 56 |
| Group | Min | 25th % | Mean | Median | 75th % | Max | n | SD | IQR |
|---|---|---|---|---|---|---|---|---|---|
| Age (yrs.) | 0.0 | 0.7 | 1.5 | 1.5 | 2.0 | 3.0 | 174 | 1.0 | 1.3 |
| Mass (kg) | 2.5 | 8.0 | 10.4 | 10.0 | 13.6 | 19.0 | 139 | 3.7 | 5.6 |
| AP (cm) | 10.0 | 14.0 | 15.3 | 15.6 | 16.6 | 18.8 | 136 | 1.8 | 2.7 |
| LAT (cm) | 9.0 | 12.1 | 13.0 | 13.2 | 14.0 | 17.4 | 134 | 1.6 | 1.9 |
| Group | Min | 25th % | Mean | Median | 75th % | Max | n | SD | IQR |
|---|---|---|---|---|---|---|---|---|---|
| axCTDIvol (mGy) | 15.1 | 19.9 | 33.1 | 29.9 | 37.4 | 131.6 | 91 | 19.6 | 17.5 |
| Scan Range (cm) | 3.0 | 12.1 | 13.1 | 13.7 | 14.2 | 20.0 | 132 | 2.7 | 2.1 |
| heCTDIvol (mGy) | 6.0 | 21.0 | 31.1 | 27.3 | 37.0 | 85.8 | 78 | 17.4 | 16.0 |
| Scan Len. (cm) | 9.9 | 12.8 | 13.7 | 14.0 | 14.7 | 16.7 | 47 | 1.5 | 1.9 |
| DLPseq (mGy · cm) | 12 | 266 | 430 | 397 | 549 | 1308 | 148 | 251 | 284 |
| DLPexam (mGy · cm) | 111 | 302 | 490 | 446 | 578 | 1331 | 135 | 274 | 277 |
Pediatric Head (0<X≤3) - Sub-Groups (8)
Pediatric Head (0<X≤3) - Axial / No Contrast / Fixed Current
| CT Units | 21 |
|---|---|
| Patients | 61 |
| Sequences | 74 |
| Seq/Pat Ratio | 1.21 |
| Male | 54 |
| Female | 20 |
| Sub-Group | Min | 25th % | Mean | Median | 75th % | Max | n | SD | IQR |
|---|---|---|---|---|---|---|---|---|---|
| Age (yrs.) | 0.0 | 0.8 | 1.6 | 1.6 | 3.0 | 3.0 | 74 | 1.0 | 2.3 |
| Mass (kg) | 3.0 | 8.2 | 11.2 | 11.1 | 14.5 | 19.0 | 60 | 3.7 | 6.3 |
| AP (cm) | 11.0 | 14.7 | 15.6 | 16.0 | 16.8 | 18.8 | 52 | 1.6 | 2.1 |
| LAT (cm) | 9.7 | 12.7 | 13.5 | 13.6 | 14.3 | 17.4 | 51 | 1.5 | 1.6 |
| Sub-Group | Min | 25th % | Mean | Median | 75th % | Max | n | SD | IQR |
|---|---|---|---|---|---|---|---|---|---|
| axCTDIvol (mGy) | 16.0 | 20.9 | 35.0 | 30.3 | 38.0 | 131.6 | 72 | 21.2 | 17.0 |
| Scan Range (cm) | 3.5 | 11.7 | 12.3 | 13.3 | 14.0 | 17.3 | 59 | 3.1 | 2.3 |
| heCTDIvol (mGy) | - | - | - | - | - | - | 0 | - | - |
| Scan Len. (cm) | - | - | - | - | - | - | 0 | - | - |
| DLPseq (mGy · cm) | 12 | 247 | 368 | 346 | 500 | 828 | 72 | 173 | 253 |
Pediatric Head (0<X≤3) - Axial / No Contrast / Dose Reduction
| CT Units | 6 |
|---|---|
| Patients | 11 |
| Sequences | 11 |
| Seq/Pat Ratio | 1.00 |
| Male | 6 |
| Female | 5 |
| Sub-Group | Min | 25th % | Mean | Median | 75th % | Max | n | SD | IQR |
|---|---|---|---|---|---|---|---|---|---|
| Age (yrs.) | 0.0 | 0.3 | 1.2 | 1.2 | 2.0 | 3.0 | 11 | 1.0 | 1.7 |
| Mass (kg) | 2.5 | 4.8 | 8.7 | 8.3 | 12.2 | 15.0 | 11 | 4.5 | 7.4 |
| AP (cm) | 11.0 | 13.9 | 15.1 | 16.6 | 16.8 | 17.0 | 7 | 2.3 | 2.9 |
| LAT (cm) | 10.0 | 11.5 | 13.0 | 13.5 | 14.3 | 15.2 | 8 | 1.9 | 2.9 |
| Sub-Group | Min | 25th % | Mean | Median | 75th % | Max | n | SD | IQR |
|---|---|---|---|---|---|---|---|---|---|
| axCTDIvol (mGy) | 15.1 | 18.1 | 24.1 | 19.1 | 30.3 | 40.0 | 11 | 9.1 | 12.2 |
| Scan Range (cm) | 12.0 | 14.0 | 14.8 | 14.0 | 15.2 | 20.0 | 9 | 2.2 | 1.2 |
| heCTDIvol (mGy) | - | - | - | - | - | - | 0 | - | - |
| Scan Len. (cm) | - | - | - | - | - | - | 0 | - | - |
| DLPseq (mGy · cm) | 15 | 216 | 322 | 268 | 455 | 628 | 11 | 182 | 238 |
Pediatric Head (0<X≤3) - Axial / Contrast / Fixed Current
Insufficient data, n = 8.
Pediatric Head (0<X≤3) - Axial / Contrast / Dose Reduction
Insufficient data, n = 1.
Pediatric Head (0<X≤3) - Helical / No Contrast / Fixed Current
| CT Units | 19 |
|---|---|
| Patients | 46 |
| Sequences | 47 |
| Seq/Pat Ratio | 1.02 |
| Male | 31 |
| Female | 16 |
| Sub-Group | Min | 25th % | Mean | Median | 75th % | Max | n | SD | IQR |
|---|---|---|---|---|---|---|---|---|---|
| Age (yrs.) | 0.1 | 0.7 | 1.5 | 1.6 | 2.0 | 3.0 | 47 | 0.9 | 1.3 |
| Mass (kg) | 3.2 | 7.4 | 9.9 | 10.0 | 12.5 | 18.3 | 39 | 3.6 | 5.1 |
| AP (cm) | 10.5 | 13.6 | 14.9 | 15.0 | 16.3 | 18.3 | 41 | 1.9 | 2.7 |
| LAT (cm) | 9.0 | 11.9 | 12.9 | 13.0 | 14.0 | 16.3 | 39 | 1.7 | 2.1 |
| Sub-Group | Min | 25th % | Mean | Median | 75th % | Max | n | SD | IQR |
|---|---|---|---|---|---|---|---|---|---|
| axCTDIvol (mGy) | - | - | - | - | - | - | 0 | - | - |
| Scan Range (cm) | 10.0 | 12.8 | 14.3 | 13.8 | 15.0 | 29.6 | 36 | 3.3 | 2.2 |
| heCTDIvol (mGy) | 6.0 | 20.9 | 32.9 | 27.6 | 39.1 | 85.8 | 45 | 21.1 | 18.2 |
| Scan Len. (cm) | 9.9 | 13.3 | 13.8 | 14.1 | 15.0 | 15.7 | 21 | 1.5 | 1.7 |
| DLPseq (mGy · cm) | 84 | 324 | 637 | 565 | 760 | 1308 | 29 | 368 | 436 |
Pediatric Head (0<X≤3) - Helical / No Contrast / Dose Reduction
| CT Units | 13 |
|---|---|
| Patients | 32 |
| Sequences | 32 |
| Seq/Pat Ratio | 1.00 |
| Male | 19 |
| Female | 13 |
| Sub-Group | Min | 25th % | Mean | Median | 75th % | Max | n | SD | IQR |
|---|---|---|---|---|---|---|---|---|---|
| Age (yrs.) | 0.0 | 0.3 | 1.3 | 1.0 | 2.0 | 3.0 | 32 | 1.0 | 1.8 |
| Mass (kg) | 4.4 | 6.1 | 9.0 | 9.1 | 10.7 | 15.0 | 19 | 3.3 | 4.5 |
| AP (cm) | 10.0 | 13.9 | 14.8 | 15.0 | 16.1 | 17.7 | 30 | 1.9 | 2.2 |
| LAT (cm) | 9.0 | 11.8 | 12.3 | 12.5 | 13.4 | 14.3 | 30 | 1.4 | 1.5 |
| Sub-Group | Min | 25th % | Mean | Median | 75th % | Max | n | SD | IQR |
|---|---|---|---|---|---|---|---|---|---|
| axCTDIvol (mGy) | - | - | - | - | - | - | 0 | - | - |
| Scan Range (cm) | 9.9 | 12.2 | 13.3 | 13.6 | 14.1 | 15.6 | 22 | 1.4 | 2.0 |
| heCTDIvol (mGy) | 8.3 | 23.4 | 28.4 | 26.4 | 35.2 | 53.7 | 32 | 10.1 | 11.8 |
| Scan Len. (cm) | 9.9 | 12.5 | 13.4 | 13.5 | 14.4 | 16.0 | 25 | 1.4 | 1.9 |
| DLPseq (mGy · cm) | 140 | 350 | 454 | 404 | 576 | 915 | 28 | 188 | 226 |
Pediatric Head (0<X≤3) - Helical / Contrast / Fixed
Insufficient data, n = 1.
Pediatric Head (0<X≤3) - Helical / Contrast / Dose Reduction
No data, n = 0
Pediatric Head (3<X≤7) - Entire Group
| CT Units | 56 |
|---|---|
| Patients | 105 |
| Sequences | 128 |
| Seq/Pat Ratio | 1.22 |
| Male | 72 |
| Female | 56 |
| Group | Min | 25th % | Mean | Median | 75th % | Max | n | SD | IQR |
|---|---|---|---|---|---|---|---|---|---|
| Age (yrs.) | 3.5 | 5.0 | 5.7 | 6.0 | 7.0 | 7.0 | 128 | 1.1 | 2.0 |
| Mass (kg) | 7.0 | 16.8 | 19.6 | 20.0 | 22.0 | 32.0 | 100 | 4.7 | 5.3 |
| AP (cm) | 14.0 | 16.6 | 17.1 | 17.1 | 17.8 | 19.3 | 92 | 1.1 | 1.2 |
| LAT (cm) | 12.0 | 13.4 | 14.0 | 14.0 | 14.5 | 15.8 | 88 | 0.7 | 1.1 |
| Group | Min | 25th % | Mean | Median | 75th % | Max | n | SD | IQR |
|---|---|---|---|---|---|---|---|---|---|
| axCTDIvol (mGy) | 17.7 | 30.6 | 44.7 | 38.1 | 48.0 | 123.0 | 60 | 24.8 | 17.4 |
| Scan Range (cm) | 3.8 | 12.0 | 12.8 | 13.8 | 14.9 | 19.8 | 81 | 3.7 | 2.9 |
| heCTDIvol (mGy) | 23.2 | 30.7 | 41.2 | 39.2 | 51.5 | 87.9 | 52 | 12.8 | 20.8 |
| Scan Len. (cm) | 4.7 | 14.0 | 14.9 | 14.9 | 15.8 | 19.2 | 40 | 2.5 | 1.8 |
| DLPseq (mGy · cm) | 24.0 | 370 | 544 | 552 | 692 | 1332 | 97 | 253 | 322 |
| DLPexam (mGy · cm) | 237 | 494 | 706 | 601 | 843 | 2161 | 101 | 329 | 349 |
Pediatric Head (3<X≤7) - Sub-Groups (8)
Pediatric Head (3<X≤7) - Axial / No Contrast / Fixed Current
| CT Units | 25 |
|---|---|
| Patients | 42 |
| Sequences | 58 |
| Seq/Pat Ratio | 1.38 |
| Male | 34 |
| Female | 24 |
| Sub-Group | Min | 25th % | Mean | Median | 75th % | Max | n | SD | IQR |
|---|---|---|---|---|---|---|---|---|---|
| Age (yrs.) | 3.7 | 5.6 | 5.9 | 6.0 | 7.0 | 7.0 | 58 | 1.1 | 1.4 |
| Mass (kg) | 9.1 | 16.5 | 20.1 | 20.0 | 22.4 | 32.0 | 50 | 4.9 | 5.9 |
| AP (cm) | 14.0 | 16.6 | 17.1 | 17.3 | 17.9 | 19.3 | 32 | 1.3 | 1.3 |
| LAT (cm) | 13.1 | 13.9 | 14.3 | 14.4 | 14.7 | 15.8 | 28 | 0.7 | 0.8 |
| Sub-Group | Min | 25th % | Mean | Median | 75th % | Max | n | SD | IQR |
|---|---|---|---|---|---|---|---|---|---|
| axCTDIvol (mGy) | 17.7 | 32.3 | 48.1 | 39.9 | 51.1 | 123.0 | 46 | 27.2 | 18.9 |
| Scan Range (cm) | 3.8 | 7.8 | 11.0 | 13.2 | 14.0 | 17.5 | 40 | 4.0 | 6.2 |
| heCTDIvol (mGy) | - | - | - | - | - | - | 0 | - | - |
| Scan Len. (cm) | - | - | - | - | - | - | 0 | - | - |
| DLPseq (mGy · cm) | 24 | 290 | 456 | 496 | 644 | 773 | 45 | 203 | 354 |
Pediatric Head (3<X≤7) - Axial / No Contrast / Dose Reduction
| CT Units | 4 |
|---|---|
| Patients | 7 |
| Sequences | 10 |
| Seq/Pat Ratio | 1.43 |
| Male | 7 |
| Female | 3 |
| Sub-Group | Min | 25th % | Mean | Median | 75th % | Max | n | SD | IQR |
|---|---|---|---|---|---|---|---|---|---|
| Age (yrs.) | 4.0 | 5.0 | 5.7 | 6.0 | 6.8 | 7.0 | 10 | 1.2 | 1.8 |
| Mass (kg) | 15.0 | 18.1 | 19.0 | 20.4 | 20.4 | 22.7 | 9 | 2.6 | 2.3 |
| AP (cm) | 16.1 | 16.5 | 16.9 | 17.2 | 17.3 | 17.3 | 5 | 0.5 | 0.8 |
| LAT (cm) | 13.5 | 14.0 | 14.5 | 14.5 | 15.2 | 15.4 | 5 | 0.8 | 1.2 |
| Sub-Group | Min | 25th % | Mean | Median | 75th % | Max | n | SD | IQR |
|---|---|---|---|---|---|---|---|---|---|
| axCTDIvol (mGy) | 26.6 | 30.6 | 33.1 | 31.1 | 36.4 | 42.6 | 10 | 4.9 | 5.8 |
| Scan Range (cm) | 16.0 | 16.0 | 16.0 | 16.0 | 16.0 | 16.0 | 2 | 0.0 | 0.0 |
| heCTDIvol (mGy) | - | - | - | - | - | - | 0 | - | - |
| Scan Len. (cm) | - | - | - | - | - | - | 0 | - | - |
| DLPseq (mGy · cm) | 77 | 256 | 359 | 429 | 489 | 490 | 9 | 154 | 233 |
Pediatric Head (3<X≤7) - Axial / Contrast / Fixed Current
Insufficient data, n = 4.
Pediatric Head (3<X≤7) - Axial / Contrast / Dose Reduction
No data, n = 0
Pediatric Head (3<X≤7) - Helical / No Contrast / Fixed Current
| CT Units | 15 |
|---|---|
| Patients | 27 |
| Sequences | 27 |
| Seq/Pat Ratio | 1.00 |
| Male | 13 |
| Female | 14 |
| Sub-Group | Min | 25th % | Mean | Median | 75th % | Max | n | SD | IQR |
|---|---|---|---|---|---|---|---|---|---|
| Age (yrs.) | 3.5 | 4.9 | 5.4 | 5.0 | 6.0 | 7.0 | 27 | 1.1 | 1.1 |
| Mass (kg) | 10.4 | 16.0 | 19.4 | 19.0 | 22.7 | 31.8 | 21 | 4.9 | 6.7 |
| AP (cm) | 15.5 | 16.4 | 17.1 | 17.1 | 17.7 | 19.0 | 26 | 1.0 | 1.3 |
| LAT (cm) | 12.0 | 13.4 | 13.9 | 14.0 | 14.4 | 15.3 | 26 | 0.7 | 0.9 |
| Sub-Group | Min | 25th % | Mean | Median | 75th % | Max | n | SD | IQR |
|---|---|---|---|---|---|---|---|---|---|
| axCTDIvol (mGy) | - | - | - | - | - | - | 0 | - | - |
| Scan Range (cm) | 4.7 | 14.0 | 14.7 | 14.9 | 15.5 | 19.8 | 20 | 3.2 | 1.6 |
| heCTDIvol (mGy) | 29.7 | 39.1 | 45.0 | 43.8 | 51.5 | 87.9 | 25 | 12.0 | 12.4 |
| Scan Len. (cm) | 4.7 | 14.0 | 14.8 | 14.8 | 16.0 | 19.2 | 19 | 3.1 | 2.0 |
| DLPseq (mGy · cm) | 343 | 558 | 751 | 829 | 866 | 1077 | 17 | 201 | 308 |
Pediatric Head (3<X≤7) - Helical / No Contrast / Dose Reduction
| CT Units | 13 |
|---|---|
| Patients | 23 |
| Sequences | 23 |
| Seq/Pat Ratio | 1.00 |
| Male | 14 |
| Female | 9 |
| Sub-Group | Min | 25th % | Mean | Median | 75th % | Max | n | SD | IQR |
|---|---|---|---|---|---|---|---|---|---|
| Age (yrs.) | 4.0 | 4.0 | 5.3 | 5.0 | 6.0 | 7.0 | 23 | 1.1 | 2.0 |
| Mass (kg) | 7.0 | 16.0 | 18.2 | 19.5 | 22.4 | 27.2 | 11 | 6.1 | 6.4 |
| AP (cm) | 14.0 | 17.0 | 17.2 | 17.2 | 18.0 | 18.7 | 21 | 1.1 | 1.0 |
| LAT (cm) | 12.8 | 13.1 | 13.7 | 14.0 | 14.0 | 14.8 | 21 | 0.6 | 0.9 |
| Sub-Group | Min | 25th % | Mean | Median | 75th % | Max | n | SD | IQR |
|---|---|---|---|---|---|---|---|---|---|
| axCTDIvol (mGy) | - | - | - | - | - | - | 0 | - | - |
| Scan Range (cm) | 10.5 | 13.1 | 13.8 | 14.0 | 14.6 | 17.2 | 13 | 1.6 | 1.5 |
| heCTDIvol (mGy) | 23.2 | 28.3 | 34.3 | 29.7 | 37.0 | 71.8 | 23 | 10.7 | 8.7 |
| Scan Len. (cm) | 10.5 | 14.3 | 15.1 | 15.2 | 15.8 | 18.5 | 14 | 1.9 | 1.6 |
| DLPseq (mGy · cm) | 360 | 456 | 612 | 597 | 732 | 1174 | 18 | 201 | 276 |
Pediatric Head (3<X≤7) - Helical / Contrast / Fixed Current
Insufficient data, n = 5.
Pediatric Head (3<X≤7) - Helical / Contrast / Dose Reduction
Insufficient data, n = 1.
Pediatric Head (7<X≤13) - Entire Group
| CT Units | 61 |
|---|---|
| Patients | 146 |
| Sequences | 168 |
| Seq/Pat Ratio | 1.15 |
| Male | 91 |
| Female | 77 |
| Group | Min | 25th % | Mean | Median | 75th % | Max | n | SD | IQR |
|---|---|---|---|---|---|---|---|---|---|
| Age (yrs.) | 7.5 | 8.4 | 9.9 | 10.0 | 11.0 | 13.0 | 168 | 1.6 | 2.6 |
| Mass (kg) | 21.0 | 27.2 | 32.4 | 32.0 | 36.3 | 48.0 | 121 | 6.8 | 9.1 |
| AP (cm) | 14.1 | 17.0 | 17.6 | 17.6 | 18.4 | 20.0 | 140 | 1.2 | 1.4 |
| LAT (cm) | 12.8 | 14.0 | 14.6 | 14.5 | 15.2 | 17.4 | 132 | 1.0 | 1.2 |
| Group | Min | 25th % | Mean | Median | 75th % | Max | n | SD | IQR |
|---|---|---|---|---|---|---|---|---|---|
| axCTDIvol (mGy) | 17.4 | 34.7 | 51.2 | 42.9 | 59.1 | 144.2 | 97 | 26.3 | 24.4 |
| Scan Range (cm) | 3.5 | 12.5 | 13.2 | 14.0 | 15.0 | 28.0 | 121 | 3.9 | 2.5 |
| heCTDIvol (mGy) | 10.6 | 36.0 | 46.5 | 47.0 | 52.9 | 91.1 | 61 | 15.9 | 17.0 |
| Scan Len. (cm) | 13.0 | 14.3 | 15.2 | 15.0 | 15.9 | 21.6 | 42 | 1.5 | 1.6 |
| DLPseq (mGy · cm) | 24 | 420 | 635 | 610 | 834 | 1645 | 144 | 330 | 414 |
| DLPexam (mGy · cm) | 77 | 551 | 749 | 665 | 888 | 1645 | 132 | 302 | 337 |
Pediatric Head (7<X≤13) - Sub-Groups (8)
Pediatric Head (7<X≤13) - Axial / No Contrast / Fixed Current
| CT Units | 25 |
|---|---|
| Patients | 61 |
| Sequences | 82 |
| Seq/Pat Ratio | 1.34 |
| Male | 45 |
| Female | 37 |
| Sub-Group | Min | 25th % | Mean | Median | 75th % | Max | n | SD | IQR |
|---|---|---|---|---|---|---|---|---|---|
| Age (yrs.) | 7.5 | 8.0 | 9.8 | 9.9 | 11.0 | 13.0 | 82 | 1.7 | 3.0 |
| Mass (kg) | 21.5 | 26.0 | 32.0 | 32.0 | 36.8 | 47.0 | 66 | 7.2 | 10.8 |
| AP (cm) | 14.1 | 16.3 | 17.5 | 17.6 | 18.5 | 20.0 | 58 | 1.4 | 2.2 |
| LAT (cm) | 12.8 | 14.0 | 14.8 | 14.8 | 15.3 | 17.4 | 54 | 1.1 | 1.3 |
| Sub-Group | Min | 25th % | Mean | Median | 75th % | Max | n | SD | IQR |
|---|---|---|---|---|---|---|---|---|---|
| axCTDIvol (mGy) | 17.4 | 33.4 | 50.9 | 42.7 | 55.3 | 144.2 | 77 | 27.7 | 21.9 |
| Scan Range (cm) | 3.5 | 8.3 | 11.4 | 12.8 | 14.0 | 18.1 | 61 | 4.0 | 5.7 |
| heCTDIvol (mGy) | - | - | - | - | - | - | 0 | - | - |
| Scan Len. (cm) | - | - | - | - | - | - | 0 | - | - |
| DLPseq (mGy · cm) | 24 | 248 | 489 | 496 | 665 | 1343 | 76 | 292 | 416 |
Pediatric Head (7<X≤13) - Axial / No Contrast / Dose Reduction
| CT Units | 7 |
|---|---|
| Patients | 18 |
| Sequences | 18 |
| Seq/Pat Ratio | 1.00 |
| Male | 8 |
| Female | 10 |
| Sub-Group | Min | 25th % | Mean | Median | 75th % | Max | n | SD | IQR |
|---|---|---|---|---|---|---|---|---|---|
| Age (yrs.) | 8.0 | 9.0 | 10.2 | 10.0 | 11.0 | 12.0 | 18 | 1.4 | 2.0 |
| Mass (kg) | 27.2 | 30.1 | 33.1 | 32.7 | 36.3 | 40.8 | 13 | 4.1 | 6.2 |
| AP (cm) | 16.6 | 17.5 | 17.8 | 17.9 | 18.3 | 18.7 | 16 | 0.6 | 0.9 |
| LAT (cm) | 13.0 | 14.2 | 14.5 | 14.5 | 14.8 | 16.2 | 14 | 0.9 | 0.6 |
| Sub-Group | Min | 25th % | Mean | Median | 75th % | Max | n | SD | IQR |
|---|---|---|---|---|---|---|---|---|---|
| axCTDIvol (mGy) | 20.8 | 42.6 | 53.8 | 58.4 | 59.6 | 110.9 | 18 | 21.5 | 16.9 |
| Scan Range (cm) | 3.4 | 13.7 | 13.1 | 14.0 | 14.0 | 15.9 | 10 | 3.5 | 0.3 |
| heCTDIvol (mGy) | - | - | - | - | - | - | 0 | - | - |
| Scan Len. (cm) | - | - | - | - | - | - | 0 | - | - |
| DLPseq (mGy · cm) | 298 | 533 | 752 | 834 | 834 | 1553 | 16 | 316 | 301 |
Pediatric Head (7<X≤13) - Axial / Contrast / Fixed Current
Insufficient data, n = 3.
Pediatric Head (7<X≤13) - Axial / Contrast / Dose Reduction
No data, n = 0.
Pediatric Head (7<X≤13) - Helical / No Contrast / Fixed Current
| CT Units | 17 |
|---|---|
| Patients | 29 |
| Sequences | 29 |
| Seq/Pat Ratio | 1.00 |
| Male | 14 |
| Female | 15 |
| Sub-Group | Min | 25th % | Mean | Median | 75th % | Max | n | SD | IQR |
|---|---|---|---|---|---|---|---|---|---|
| Age (yrs.) | 8.0 | 8.0 | 9.5 | 9.0 | 10.3 | 13.0 | 29 | 1.4 | 2.3 |
| Mass (kg) | 21.0 | 27.2 | 31.7 | 31.1 | 36.3 | 47.0 | 24 | 6.5 | 9.1 |
| AP (cm) | 14.8 | 16.8 | 17.3 | 17.5 | 18.3 | 18.9 | 29 | 1.1 | 1.5 |
| LAT (cm) | 13.0 | 14.0 | 14.4 | 14.3 | 15.0 | 16.3 | 28 | 0.8 | 1.1 |
| Sub-Group | Min | 25th % | Mean | Median | 75th % | Max | n | SD | IQR |
|---|---|---|---|---|---|---|---|---|---|
| axCTDIvol (mGy) | - | - | - | - | - | - | 0 | - | - |
| Scan Range (cm) | 13.0 | 14.2 | 14.9 | 14.7 | 15.0 | 20.0 | 20 | 1.4 | 0.8 |
| heCTDIvol (mGy) | 10.6 | 47.0 | 54.4 | 51.5 | 64.3 | 91.1 | 27 | 16.0 | 17.3 |
| Scan Len. (cm) | 13.0 | 14.7 | 15.1 | 15.0 | 16.0 | 16.8 | 21 | 1.0 | 1.3 |
| DLPseq (mGy · cm) | 539 | 879 | 1026 | 966 | 1212 | 1645 | 20 | 267 | 332 |
Pediatric Head (7<X≤13) - Helical / No Contrast / Dose Reduction
| CT Units | 17 |
|---|---|
| Patients | 32 |
| Sequences | 32 |
| Seq/Pat Ratio | 1.00 |
| Male | 20 |
| Female | 12 |
| Sub-Group | Min | 25th % | Mean | Median | 75th % | Max | n | SD | IQR |
|---|---|---|---|---|---|---|---|---|---|
| Age (yrs.) | 7.5 | 9.0 | 10.2 | 10.0 | 11.3 | 13.0 | 32 | 1.5 | 2.3 |
| Mass (kg) | 21.0 | 29.3 | 33.1 | 31.9 | 38.0 | 46.3 | 14 | 7.0 | 8.6 |
| AP (cm) | 14.6 | 17.1 | 17.9 | 17.6 | 18.7 | 19.6 | 30 | 1.1 | 1.6 |
| LAT (cm) | 12.9 | 13.9 | 14.5 | 14.4 | 15.1 | 17.2 | 30 | 1.0 | 1.2 |
| Sub-Group | Min | 25th % | Mean | Median | 75th % | Max | n | SD | IQR |
|---|---|---|---|---|---|---|---|---|---|
| axCTDIvol (mGy) | - | - | - | - | - | - | 0 | - | - |
| Scan Range (cm) | 9.2 | 14.3 | 15.5 | 15.0 | 16.0 | 21.6 | 25 | 2.4 | 1.8 |
| heCTDIvol (mGy) | 23.4 | 31.5 | 39.6 | 36.5 | 43.2 | 83.4 | 31 | 13.0 | 11.6 |
| Scan Len. (cm) | 13.0 | 14.3 | 15.4 | 15.0 | 15.6 | 21.6 | 19 | 1.9 | 1.3 |
| DLPseq (mGy · cm) | 415 | 495 | 672 | 615 | 759 | 1297 | 28 | 218 | 264 |
Pediatric Head (7<X≤13) - Helical / Contrast / Fixed Current
Insufficient data, n = 2.
Pediatric Head (7<X≤13) - Helical / Contrast / Dose Reduction
Insufficient data, n = 2.
Pediatric Chest (0<X≤3) - Entire Group
| CT Units | 15 |
|---|---|
| Patients | 50 |
| Sequences | 51 |
| Seq/Pat Ratio | 1.02 |
| Male | 32 |
| Female | 19 |
| Group | Min | 25th % | Mean | Median | 75th % | Max | n | SD | IQR |
|---|---|---|---|---|---|---|---|---|---|
| Age (yrs.) | 0.0 | 0.5 | 1.5 | 1.7 | 2.9 | 3.0 | 51 | 1.1 | 2.4 |
| Mass (kg) | 2.4 | 7.0 | 10.3 | 11.1 | 14.0 | 22.5 | 49 | 4.8 | 7.0 |
| AP (cm) | 8.7 | 10.9 | 12.5 | 12.8 | 13.9 | 17.8 | 47 | 2.1 | 3.0 |
| LAT (cm) | 8.8 | 14.1 | 16.6 | 17.0 | 19.7 | 21.7 | 47 | 3.4 | 5.6 |
| Group | Min | 25th % | Mean | Median | 75th % | Max | n | SD | IQR |
|---|---|---|---|---|---|---|---|---|---|
| axCTDIvol (mGy) | - | - | - | - | - | - | 0 | - | - |
| Scan Range (cm) | 3.9 | 12.0 | 15.5 | 16.0 | 18.9 | 24.7 | 45 | 4.6 | 6.9 |
| heCTDIvol (mGy) | 0.8 | 1.3 | 2.2 | 1.5 | 2.8 | 6.4 | 48 | 1.3 | 1.5 |
| Scan Len. (cm) | 8.3 | 12.4 | 16.0 | 16.9 | 19.1 | 24.7 | 32 | 4.2 | 6.8 |
| DLPseq (mGy · cm) | 14 | 30 | 51 | 40 | 62 | 143 | 37 | 30 | 31 |
| DLPexam (mGy · cm) | 12 | 26 | 45 | 36 | 52 | 143 | 44 | 29 | 26 |
Pediatric Chest (0<X≤3) - Sub-Groups (8)
Pediatric Chest (0<X≤3) - Axial / No Contrast / Fixed Current
Insufficient data, n = 1.
Pediatric Chest (0<X≤3) - Axial / No Contrast Dose Reduction
No data, n = 0.
Pediatric Chest (0<X≤3) - Axial / Contrast / Fixed Current
No data, n = 0.
Pediatric Chest (0<X≤3) - Axial / Contrast / Dose Reduction
No data, n = 0.
Pediatric Chest (0<X≤3) - Helical / No Contrast / Fixed Current
Insufficient data, n = 2.
Pediatric Chest (0<X≤3) - Helical / No Contrast / Dose Reduction
| CT Units | 8 |
|---|---|
| Patients | 15 |
| Sequences | 15 |
| Seq/Pat Ratio | 1.00 |
| Male | 10 |
| Female | 5 |
| Sub-Group | Min | 25th % | Mean | Median | 75th % | Max | n | SD | IQR |
|---|---|---|---|---|---|---|---|---|---|
| Age (yrs.) | 0.1 | 1.5 | 2.1 | 2.0 | 3.0 | 3.0 | 15 | 1.1 | 1.5 |
| Mass (kg) | 4.5 | 12.5 | 13.7 | 14.1 | 15.5 | 22.5 | 15 | 4.2 | 3.0 |
| AP (cm) | 10.7 | 13.1 | 13.7 | 14.2 | 15.0 | 16.4 | 13 | 1.6 | 1.9 |
| LAT (cm) | 14.0 | 18.1 | 19.1 | 20.1 | 20.4 | 21.7 | 13 | 2.4 | 2.3 |
| Sub-Group | Min | 25th % | Mean | Median | 75th % | Max | n | SD | IQR |
|---|---|---|---|---|---|---|---|---|---|
| axCTDIvol (mGy) | - | - | - | - | - | - | 0 | - | - |
| Scan Range (cm) | 10.8 | 15.3 | 17.1 | 17.1 | 19.3 | 22.5 | 14 | 2.9 | 4.0 |
| heCTDIvol (mGy) | 1.0 | 1.3 | 1.9 | 1.3 | 1.9 | 4.8 | 14 | 1.1 | 0.7 |
| Scan Len. (cm) | 16.1 | 17.1 | 18.5 | 18.6 | 19.5 | 22.5 | 10 | 1.9 | 2.4 |
| DLPseq (mGy · cm) | 25 | 31 | 50 | 38 | 44 | 143 | 13 | 34 | 13 |
Pediatric Chest (0<X≤3) - Helical / Contrast / Fixed Current
Insufficient data, n = 6.
Pediatric Chest (0<X≤3) - Helical / Contrast / Dose Reduction
| CT Units | 9 |
|---|---|
| Patients | 27 |
| Sequences | 27 |
| Seq/Pat Ratio | 1.00 |
| Male | 18 |
| Female | 9 |
| Sub-Group | Min | 25th % | Mean | Median | 75th % | Max | n | SD | IQR |
|---|---|---|---|---|---|---|---|---|---|
| Age (yrs.) | 0.0 | 0.5 | 1.3 | 1.1 | 2.0 | 3.0 | 27 | 1.1 | 1.5 |
| Mass (kg) | 2.4 | 7.0 | 9.0 | 9.4 | 12.0 | 14.0 | 25 | 3.5 | 5.0 |
| AP (cm) | 9.0 | 10.2 | 11.8 | 11.6 | 13.0 | 15.3 | 26 | 1.6 | 2.8 |
| LAT (cm) | 10.7 | 14.2 | 16.6 | 17.2 | 18.9 | 20.5 | 26 | 2.9 | 4.7 |
| Sub-Group | Min | 25th % | Mean | Median | 75th % | Max | n | SD | IQR |
|---|---|---|---|---|---|---|---|---|---|
| axCTDIvol (mGy) | - | - | - | - | - | - | 0 | - | - |
| Scan Range (cm) | 9.5 | 11.9 | 16.0 | 16.0 | 19.5 | 24.7 | 23 | 4.9 | 7.5 |
| heCTDIvol (mGy) | 0.8 | 1.3 | 2.4 | 1.9 | 3.0 | 6.4 | 27 | 1.4 | 1.6 |
| Scan Len. (cm) | 9.5 | 11.9 | 15.8 | 15.8 | 19.0 | 24.7 | 18 | 4.4 | 7.1 |
| DLPseq (mGy · cm) | 14 | 33 | 52 | 49 | 66 | 116 | 20 | 28 | 33 |
Pediatric Chest (3<X≤7) - Entire Group
| CT Units | 18 |
|---|---|
| Patients | 37 |
| Sequences | 38 |
| Seq/Pat Ratio | 1.03 |
| Male | 17 |
| Female | 21 |
| Group | Min | 25th % | Mean | Median | 75th % | Max | n | SD | IQR |
|---|---|---|---|---|---|---|---|---|---|
| Age (yrs.) | 4.0 | 4.1 | 5.3 | 5.0 | 6.0 | 7.0 | 38 | 1.0 | 1.9 |
| Mass (kg) | 12.8 | 16.4 | 18.1 | 18.0 | 20.0 | 23.0 | 34 | 2.8 | 3.6 |
| AP (cm) | 12.6 | 13.6 | 14.9 | 14.9 | 16.1 | 18.7 | 35 | 1.7 | 2.6 |
| LAT (cm) | 13.3 | 19.8 | 20.8 | 21.3 | 22.1 | 26.0 | 35 | 2.8 | 2.3 |
| Group | Min | 25th % | Mean | Median | 75th % | Max | n | SD | IQR |
|---|---|---|---|---|---|---|---|---|---|
| axCTDIvol (mGy) | - | - | - | - | - | - | 0 | - | - |
| Scan Range (cm) | 8.0 | 17.3 | 19.5 | 20.0 | 22.0 | 24.8 | 34 | 3.4 | 4.6 |
| heCTDIvol (mGy) | 1.1 | 1.7 | 3.0 | 2.8 | 3.8 | 7.9 | 38 | 1.7 | 2.1 |
| Scan Len. (cm) | 8.0 | 18.2 | 20.0 | 21.0 | 22.1 | 24.5 | 22 | 3.6 | 3.9 |
| DLPseq (mGy · cm) | 18 | 45 | 77 | 72 | 87 | 193 | 27 | 40 | 43 |
| DLPexam (mGy · cm) | 19 | 43 | 71 | 68 | 85 | 195 | 34 | 37 | 41 |
Pediatric Chest (3<X≤7) - Sub-Groups (8)
Pediatric Chest (3<X≤7) - Axial / No Contrast / Fixed Current
No data, n = 0.
Pediatric Chest (3<X≤7) - Axial / No Contrast / Dose Reduction
No data, n = 0.
Pediatric Chest (3<X≤7) - Axial / Contrast / Fixed Current
No data, n = 0.
Pediatric Chest (3<X≤7) - Axial / Contrast Dose Reduction
No data, n = 0.
Pediatric Chest (3<X≤7) - Helical / No Contrast / Fixed Current
Insufficient data, n = 3.
Pediatric Chest (3<X≤7) - Helical / No Contrast / Dose Reduction
| CT Units | 5 |
|---|---|
| Patients | 11 |
| Sequences | 12 |
| Seq/Pat Ratio | 1.09 |
| Male | 5 |
| Female | 7 |
| Sub-Group | Min | 25th % | Mean | Median | 75th % | Max | n | SD | IQR |
|---|---|---|---|---|---|---|---|---|---|
| Age (yrs.) | 4.0 | 5.0 | 5.3 | 5.0 | 6.0 | 7.0 | 12 | 0.9 | 1.0 |
| Mass (kg) | 13.0 | 16.0 | 18.2 | 18.0 | 20.0 | 22.5 | 11 | 3.0 | 4.0 |
| AP (cm) | 12.9 | 13.1 | 14.4 | 13.6 | 15.9 | 18.0 | 11 | 1.8 | 2.8 |
| LAT (cm) | 19.0 | 19.7 | 21.1 | 20.6 | 21.7 | 25.1 | 11 | 2.1 | 2.0 |
| Sub-Group | Min | 25th % | Mean | Median | 75th % | Max | n | SD | IQR |
|---|---|---|---|---|---|---|---|---|---|
| axCTDIvol (mGy) | - | - | - | - | - | - | 0 | - | - |
| Scan Range (cm) | 8 | 17.4 | 18.4 | 19.4 | 20.6 | 22.1 | 12 | 3.8 | 3.1 |
| heCTDIvol (mGy) | 1.1 | 1.2 | 2.2 | 1.5 | 3.7 | 4.1 | 12 | 1.2 | 2.4 |
| Scan Len. (cm) | 16.3 | 19.3 | 20.0 | 20.5 | 21.7 | 22.1 | 6 | 2.2 | 2.4 |
| DLPseq (mGy · cm) | 18 | 34 | 53 | 42 | 76 | 90 | 9 | 27 | 42 |
Pediatric Chest (3<X≤7) - Helical / Contrast / Fixed Current
Insufficient data, n = 4.
Pediatric Chest (3<X≤7) - Helical / Contrast / Dose Reduction
| CT Units | 12 |
|---|---|
| Patients | 19 |
| Sequences | 19 |
| Seq/Pat Ratio | 1.00 |
| Male | 7 |
| Female | 12 |
| Sub-Group | Min | 25th % | Mean | Median | 75th % | Max | n | SD | IQR |
|---|---|---|---|---|---|---|---|---|---|
| Age (yrs.) | 4.0 | 4.1 | 5.4 | 5.3 | 6.0 | 7.0 | 19 | 1.2 | 1.9 |
| Mass (kg) | 15.0 | 17.0 | 18.6 | 18.7 | 20.0 | 22.7 | 17 | 2.1 | 3.0 |
| AP (cm) | 12.6 | 14.0 | 14.8 | 14.9 | 15.5 | 17.7 | 17 | 1.3 | 1.5 |
| LAT (cm) | 19.0 | 20.6 | 21.7 | 21.8 | 22.0 | 26.0 | 17 | 1.7 | 1.4 |
| Sub-Group | Min | 25th % | Mean | Median | 75th % | Max | n | SD | IQR |
|---|---|---|---|---|---|---|---|---|---|
| axCTDIvol (mGy) | - | - | - | - | - | - | 0 | - | - |
| Scan Range (cm) | 15.7 | 17.6 | 20.4 | 21.0 | 23.0 | 24.8 | 15 | 3.1 | 5.3 |
| heCTDIvol (mGy) | 1.4 | 2.3 | 3.3 | 3.1 | 3.6 | 7.9 | 19 | 1.8 | 1.4 |
| Scan Len. (cm) | 16.0 | 18.3 | 20.5 | 21.0 | 22.3 | 24.5 | 11 | 2.6 | 4.0 |
| DLPseq (mGy · cm) | 35.21 | 62 | 80 | 72 | 92 | 141 | 15 | 33 | 29 |
Pediatric Chest (7<X≤13) - Entire Group
| CT Units | 13 |
|---|---|
| Patients | 34 |
| Sequences | 34 |
| Seq/Pat Ratio | 1.00 |
| Male | 20 |
| Female | 14 |
| Group | Min | 25th % | Mean | Median | 75th % | Max | n | SD | IQR |
|---|---|---|---|---|---|---|---|---|---|
| Age (yrs.) | 7.3 | 8.1 | 9.8 | 9.5 | 11.0 | 13.0 | 34 | 1.7 | 2.9 |
| Mass (kg) | 20.0 | 27.0 | 32.4 | 31.0 | 38.7 | 46.0 | 33 | 7.5 | 11.7 |
| AP (cm) | 13.9 | 17.0 | 18.1 | 17.7 | 19.8 | 22.2 | 33 | 2.0 | 2.8 |
| LAT (cm) | 18.7 | 22.8 | 25.6 | 26.0 | 28.9 | 32.6 | 34 | 3.7 | 6.2 |
| Group | Min | 25th % | Mean | Median | 75th % | Max | n | SD | IQR |
|---|---|---|---|---|---|---|---|---|---|
| axCTDIvol (mGy) | - | - | - | - | - | - | 0 | - | - |
| Scan Range (cm) | 18.3 | 21.6 | 23.9 | 23.5 | 24.8 | 39.8 | 29 | 4.0 | 3.2 |
| heCTDIvol (mGy) | 1.8 | 2.4 | 3.6 | 3.4 | 4.8 | 7.2 | 33 | 1.4 | 2.4 |
| Scan Len. (cm) | 18.9 | 21.0 | 23.0 | 23.5 | 24.5 | 26.5 | 13 | 2.3 | 3.5 |
| DLPseq (mGy · cm) | 5 | 60 | 101 | 105 | 135 | 177 | 32 | 44 | 75 |
| DLPexam (mGy · cm) | 47 | 61 | 104 | 105 | 136 | 181 | 30 | 42 | 75 |
Pediatric Chest (7<X≤13) - Sub-Groups (8)
Pediatric Chest (7<X≤13) - Axial / No Contrast / Fixed Current
No data, n = 0.
Pediatric Chest (7<X≤13) - Axial / No Contrast / Dose Reduction
No data, n = 0.
Pediatric Chest (7<X≤13) - Axial / Contrast / Fixed Current
No data, n = 0.
Pediatric Chest (7<X≤13) - Axial / Contrast / Dose Reduction
No data, n = 0.
Pediatric Chest (7<X≤13) - Helical / No Contrast / Fixed Current
No data, n = 0.
Pediatric Chest (7<X≤13) - Helical / No Contrast / Dose Reduction
| CT Units | 6 |
|---|---|
| Patients | 13 |
| Sequences | 13 |
| Seq/Pat Ratio | 1.00 |
| Male | 5 |
| Female | 8 |
| Sub-Group | Min | 25th % | Mean | Median | 75th % | Max | n | SD | IQR |
|---|---|---|---|---|---|---|---|---|---|
| Age (yrs.) | 7.3 | 8.0 | 9.0 | 9.0 | 9.0 | 13.0 | 13 | 1.6 | 1.0 |
| Mass (kg) | 20.0 | 25.0 | 30.3 | 28.7 | 36.0 | 44.0 | 13 | 7.5 | 11.0 |
| AP (cm) | 16.0 | 17.0 | 18.5 | 17.7 | 19.8 | 21.2 | 13 | 1.7 | 2.8 |
| LAT (cm) | 21.8 | 22.7 | 25.9 | 25.4 | 29.4 | 30.2 | 13 | 3.4 | 6.7 |
| Sub-Group | Min | 25th % | Mean | Median | 75th % | Max | n | SD | IQR |
|---|---|---|---|---|---|---|---|---|---|
| axCTDIvol (mGy) | - | - | - | - | - | - | 0 | - | - |
| Scan Range (cm) | 18.3 | 21.2 | 22.7 | 23.3 | 23.7 | 28.0 | 12 | 2.6 | 2.5 |
| heCTDIvol (mGy) | 1.8 | 2.0 | 3.5 | 3.4 | 4.3 | 5.3 | 13 | 1.3 | 2.3 |
| Scan Len. (cm) | 22.0 | 23.1 | 23.3 | 23.5 | 23.6 | 24.0 | 4 | 0.9 | 0.5 |
| DLPseq (mGy · cm) | 5 | 54 | 87 | 94 | 123 | 147 | 11 | 44 | 69 |
Pediatric Chest (7<X≤13) - Helical / Contrast / Fixed Current
Insufficient data, n = 4.
Pediatric Chest (7<X≤13) - Helical / Contrast / Dose Reduction
| CT Units | 10 |
|---|---|
| Patients | 17 |
| Sequences | 17 |
| Seq/Pat Ratio | 1.00 |
| Male | 12 |
| Female | 5 |
| Sub-Group | Min | 25th % | Mean | Median | 75th % | Max | n | SD | IQR |
|---|---|---|---|---|---|---|---|---|---|
| Age (yrs.) | 8.0 | 9.0 | 10.5 | 10.5 | 11.0 | 13.0 | 17 | 1.5 | 2.0 |
| Mass (kg) | 22.7 | 30.0 | 34.0 | 32.8 | 40.2 | 45.0 | 16 | 6.6 | 10.2 |
| AP (cm) | 14.0 | 17.4 | 18.5 | 18.0 | 20.1 | 22.2 | 16 | 2.1 | 2.7 |
| LAT (cm) | 18.7 | 25.0 | 26.5 | 26.8 | 28.8 | 32.6 | 17 | 3.5 | 3.8 |
| Sub-Group | Min | 25th % | Mean | Median | 75th % | Max | n | SD | IQR |
|---|---|---|---|---|---|---|---|---|---|
| axCTDIvol (mGy) | - | - | - | - | - | - | 0 | - | - |
| Scan Range (cm) | 18.9 | 23.2 | 25.5 | 24.7 | 27.3 | 39.8 | 14 | 4.8 | 4.0 |
| heCTDIvol (mGy) | 2.02 | 2.5 | 3.7 | 3.3 | 4.8 | 7.2 | 16 | 1.5 | 2.3 |
| Scan Len. (cm) | 18.9 | 20.8 | 23.2 | 23.9 | 25.7 | 26.5 | 6 | 3.2 | 5.0 |
| DLPseq (mGy · cm) | 53 | 76 | 110 | 121 | 139 | 177 | 17 | 41 | 63 |
Pediatric Abdomen (0<X≤3) - Entire Group
| CT Units | 14 |
|---|---|
| Patients | 34 |
| Sequences | 35 |
| Seq/Pat Ratio | 1.03 |
| Male | 22 |
| Female | 12 |
| Group | Min | 25th % | Mean | Median | 75th % | Max | n | SD | IQR |
|---|---|---|---|---|---|---|---|---|---|
| Age (yrs.) | 0.0 | 1.0 | 1.8 | 2.0 | 3.0 | 3.0 | 35 | 1.0 | 2.0 |
| Mass (kg) | 3.2 | 9.5 | 12.4 | 13.0 | 15.0 | 20.0 | 35 | 4.6 | 5.5 |
| AP (cm) | 8.9 | 12.2 | 13.5 | 13.7 | 14.2 | 18.6 | 34 | 1.8 | 1.9 |
| LAT (cm) | 12.0 | 16.6 | 18.0 | 17.9 | 20.1 | 22.0 | 33 | 2.6 | 3.5 |
| Group | Min | 25th % | Mean | Median | 75th % | Max | n | SD | IQR |
|---|---|---|---|---|---|---|---|---|---|
| axCTDIvol (mGy) | - | - | - | - | - | - | 0 | - | - |
| Scan Range (cm) | 6.1 | 24.1 | 27.1 | 27.4 | 30.5 | 41.6 | 32 | 7.1 | 6.4 |
| heCTDIvol (mGy) | 1.4 | 2.2 | 3.2 | 3.0 | 3.8 | 6.6 | 33 | 1.4 | 1.6 |
| Scan Len. (cm) | 16.0 | 23.8 | 27.7 | 26.7 | 30.6 | 41.6 | 20 | 6.2 | 6.9 |
| DLPseq (mGy · cm) | 26 | 58 | 94 | 85 | 114 | 203 | 33 | 45 | 56 |
| DLPexam (mGy · cm) | 34 | 67 | 101 | 103 | 120 | 205 | 29 | 45 | 53 |
Pediatric Abdomen (0<X≤3) - Sub-Groups (8)
Pediatric Abdomen (0<X≤3) - Axial / No Contrast / Fixed Current
No data, n = 0.
Pediatric Abdomen (0<X≤3) - Axial / No Contrast / Dose Reduction
No data, n = 0.
Pediatric Abdomen (0<X≤3) - Axial / Contrast / Fixed Current
No data, n = 0.
Pediatric Abdomen (0<X≤3) - Axial / Contrast / Dose Reduction
No data, n = 0.
Pediatric Abdomen (0<X≤3) - Helical / No Contrast / Fixed Current
No data, n = 0.
Pediatric Abdomen (0<X≤3) - Helical / No Contrast / Dose Reduction
Insufficient data, n = 2.
Pediatric Abdomen (0<X≤3) - Helical / Contrast / Fixed Current
Insufficient data, n = 1.
Pediatric Abdomen (0<X≤3) - Helical / Contrast / Dose Reduction
| CT Units | 12 |
|---|---|
| Patients | 32 |
| Sequences | 32 |
| Seq/Pat Ratio | 1.00 |
| Male | 21 |
| Female | 10 |
| Sub-Group | Min | 25th % | Mean | Median | 75th % | Max | n | SD | IQR |
|---|---|---|---|---|---|---|---|---|---|
| Age (yrs.) | 0.0 | 1.0 | 1.8 | 2.0 | 3.0 | 3.0 | 32 | 1.0 | 2.0 |
| Mass (kg) | 3.2 | 9.8 | 12.4 | 12.7 | 15.0 | 20.0 | 32 | 4.4 | 5.3 |
| AP (cm) | 8.9 | 12.6 | 13.5 | 13.7 | 14.3 | 18.6 | 32 | 1.9 | 1.7 |
| LAT (cm) | 12.0 | 16.7 | 18.2 | 18.5 | 20.1 | 22.0 | 31 | 2.5 | 3.4 |
| Sub-Group | Min | 25th % | Mean | Median | 75th % | Max | n | SD | IQR |
|---|---|---|---|---|---|---|---|---|---|
| axCTDIvol (mGy) | - | - | - | - | - | - | 0 | - | - |
| Scan Range (cm) | 16.0 | 24.4 | 27.8 | 27.8 | 30.5 | 41.6 | 31 | 6.0 | 6.1 |
| heCTDIvol (mGy) | 1.42 | 2.2 | 3.2 | 3.1 | 3.7 | 6.6 | 30 | 1.3 | 1.5 |
| Scan Len. (cm) | 16.0 | 23.5 | 27.9 | 27.0 | 30.8 | 41.6 | 19 | 6.4 | 7.3 |
| DLPseq (mGy · cm) | 34 | 62 | 95 | 90 | 114 | 203 | 30 | 42 | 52 |
Pediatric Abdomen (3<X≤7) - Entire Group
| CT Units | 17 |
|---|---|
| Patients | 42 |
| Sequences | 45 |
| Seq/Pat Ratio | 1.07 |
| Male | 33 |
| Female | 9 |
| Group | Min | 25th % | Mean | Median | 75th % | Max | n | SD | IQR |
|---|---|---|---|---|---|---|---|---|---|
| Age (yrs.) | 3.8 | 5.0 | 6.0 | 6.0 | 7.0 | 7.0 | 45 | 0.9 | 2.0 |
| Mass (kg) | 13.7 | 18.0 | 22.8 | 22.0 | 25.0 | 41.0 | 45 | 6.6 | 7.0 |
| AP (cm) | 12.1 | 14.1 | 15.4 | 15.0 | 16.2 | 20.9 | 43 | 2.0 | 2.1 |
| LAT (cm) | 17.3 | 19.0 | 20.9 | 20.7 | 22.5 | 26.1 | 41 | 2.3 | 3.5 |
| Group | Min | 25th % | Mean | Median | 75th % | Max | n | SD | IQR |
|---|---|---|---|---|---|---|---|---|---|
| axCTDIvol (mGy) | - | - | - | - | - | - | 0 | - | - |
| Scan Range (cm) | 8.9 | 29.0 | 31.5 | 31.3 | 33.6 | 48.4 | 38 | 7.7 | 4.6 |
| heCTDIvol (mGy) | 1.4 | 3.1 | 4.0 | 4.0 | 4.9 | 7.7 | 44 | 1.6 | 1.8 |
| Scan Len. (cm) | 16.1 | 28.9 | 31.7 | 30.6 | 33.3 | 48.4 | 33 | 5.9 | 4.4 |
| DLPseq (mGy · cm) | 44 | 93 | 133 | 128 | 162 | 273 | 42 | 57 | 70 |
| DLPexam (mGy · cm) | 44 | 94 | 153 | 139 | 185 | 398 | 39 | 83 | 91 |
Pediatric Abdomen (3<X≤7) - Sub-Groups (8)
Pediatric Abdomen (3<X≤7) - Axial / No Contrast / Fixed Current
No data, n = 0.
Pediatric Abdomen (3<X≤7) - Axial / No Contrast / Dose Reduction
No data, n = 0.
Pediatric Abdomen (3<X≤7) - Axial / Contrast / Fixed Current
No data, n = 0.
Pediatric Abdomen (3<X≤7) - Axial / Contrast / Dose Reduction
No data, n = 0.
Pediatric Abdomen (3<X≤7) - Helical / No Contrast / Fixed Current
No data, n = 0.
Pediatric Abdomen (3<X≤7) - Helical / No Contrast / Dose Reduction
Insufficient data, n = 5.
Pediatric Abdomen (3<X≤7) - Helical / Contrast / Fixed Current
Insufficient data, n = 2.
Pediatric Abdomen (3<X≤7) - Helical / Contrast / Dose Reduction
| CT Units | 15 |
|---|---|
| Patients | 37 |
| Sequences | 38 |
| Seq/Pat Ratio | 1.03 |
| Male | 27 |
| Female | 9 |
| Sub-Group | Min | 25th % | Mean | Median | 75th % | Max | n | SD | IQR |
|---|---|---|---|---|---|---|---|---|---|
| Age (yrs.) | 3.8 | 5.0 | 6.0 | 6.0 | 7.0 | 7.0 | 38 | 0.9 | 2.0 |
| Mass (kg) | 13.7 | 18.0 | 22.2 | 22.0 | 24.4 | 41.0 | 38 | 6.3 | 6.4 |
| AP (cm) | 12.1 | 14.3 | 15.7 | 15.4 | 16.4 | 20.9 | 36 | 2.1 | 2.1 |
| LAT (cm) | 17.3 | 18.9 | 20.9 | 20.8 | 22.6 | 26.1 | 35 | 2.4 | 3.7 |
| Sub-Group | Min | 25th % | Mean | Median | 75th % | Max | n | SD | IQR |
|---|---|---|---|---|---|---|---|---|---|
| axCTDIvol (mGy) | - | - | - | - | - | - | 0 | - | - |
| Scan Range (cm) | 14.1 | 29.1 | 32.5 | 31.4 | 33.5 | 48.4 | 32 | 6.7 | 4.4 |
| heCTDIvol (mGy) | 1.4 | 3.1 | 4.0 | 3.8 | 4.9 | 7.7 | 37 | 1.6 | 1.8 |
| Scan Len. (cm) | 25.5 | 29.0 | 32.3 | 30.8 | 33.4 | 48.4 | 28 | 5.5 | 4.4 |
| DLPseq (mGy · cm) | 45 | 96 | 136 | 128 | 162 | 273 | 34 | 55 | 66 |
Pediatric Abdomen (7<X≤13) - Entire Group
| CT Units | 23 |
|---|---|
| Patients | 47 |
| Sequences | 48 |
| Seq/Pat Ratio | 1.02 |
| Male | 21 |
| Female | 25 |
| Group | Min | 25th % | Mean | Median | 75th % | Max | n | SD | IQR |
|---|---|---|---|---|---|---|---|---|---|
| Age (yrs.) | 8.0 | 8.9 | 10.2 | 10.0 | 12.0 | 13.0 | 48 | 1.7 | 3.1 |
| Mass (kg) | 21.5 | 29.0 | 34.4 | 34.0 | 40.0 | 49.0 | 45 | 7.9 | 11.0 |
| AP (cm) | 12.3 | 15.4 | 17.9 | 17.8 | 19.7 | 25.8 | 46 | 3.3 | 4.3 |
| LAT (cm) | 16.6 | 22.6 | 24.6 | 24.6 | 26.4 | 32.9 | 46 | 3.4 | 3.8 |
| Group | Min | 25th % | Mean | Median | 75th % | Max | n | SD | IQR |
|---|---|---|---|---|---|---|---|---|---|
| axCTDIvol (mGy) | - | - | - | - | - | - | 0 | - | - |
| Scan Range (cm) | 19.2 | 35.3 | 38.0 | 37.6 | 41.9 | 51.9 | 41 | 7.2 | 6.7 |
| heCTDIvol (mGy) | 1.3 | 3.2 | 4.8 | 4.9 | 6.1 | 8.9 | 47 | 2.1 | 2.9 |
| Scan Len. (cm) | 26.5 | 33.3 | 37.2 | 36.5 | 39.0 | 57.9 | 31 | 6.4 | 5.8 |
| DLPseq (mGy · cm) | 9 | 111 | 197 | 200 | 257 | 429 | 37 | 102 | 146 |
| DLPexam (mGy · cm) | 44 | 116 | 204 | 194 | 263 | 545 | 44 | 107 | 147 |
Pediatric Abdomen (7<X≤13) - Sub-Groups (8)
Pediatric Abdomen (7<X≤13) - Axial / No Contrast / Fixed Current
No data, n = 0.
Pediatric Abdomen (7<X≤13) - Axial / No Contrast / Dose Reduction
No data, n = 0.
Pediatric Abdomen (7<X≤13) - Axial / Contrast / Fixed Current
No data, n = 0.
Pediatric Abdomen (7<X≤13) - Axial / Contrast / Dose Reduction
No data, n = 0.
Pediatric Abdomen (7<X≤13) - Helical / No Contrast / Fixed Current
No data, n = 0.
Pediatric Abdomen (7<X≤13) - Helical / No Contrast / Dose Reduction
Insufficient data, n = 3.
Pediatric Abdomen (7<X≤13) - Helical / Contrast / Fixed Current
Insufficient data, n = 1.
Pediatric Abdomen (7<X≤13) - Helical / Contrast / Dose Reduction
| CT Units | 21 |
|---|---|
| Patients | 43 |
| Sequences | 44 |
| Seq/Pat Ratio | 1.02 |
| Male | 18 |
| Female | 24 |
| Sub-Group | Min | 25th % | Mean | Median | 75th % | Max | n | SD | IQR |
|---|---|---|---|---|---|---|---|---|---|
| Age (yrs.) | 8.0 | 9.0 | 10.2 | 10.0 | 12.0 | 13.0 | 44 | 1.7 | 3.0 |
| Mass (kg) | 21.5 | 29.3 | 34.8 | 35.2 | 40.0 | 49.0 | 42 | 7.7 | 10.8 |
| AP (cm) | 12.3 | 15.6 | 17.8 | 17.8 | 19.6 | 25.8 | 42 | 3.1 | 4.0 |
| LAT (cm) | 16.6 | 22.7 | 24.7 | 24.9 | 26.4 | 32.9 | 42 | 3.3 | 3.7 |
| Sub-Group | Min | 25th % | Mean | Median | 75th % | Max | n | SD | IQR |
|---|---|---|---|---|---|---|---|---|---|
| axCTDIvol (mGy) | - | - | - | - | - | - | 0 | - | - |
| Scan Range (cm) | 19.2 | 33.9 | 38.1 | 38.1 | 42.1 | 51.9 | 38 | 7.5 | 8.2 |
| heCTDIvol (mGy) | 1.3 | 3.2 | 4.7 | 4.9 | 6.1 | 8.9 | 43 | 2.1 | 2.9 |
| Scan Len. (cm) | 26.5 | 33.3 | 37.6 | 36.5 | 39.6 | 57.9 | 27 | 6.6 | 6.3 |
| DLPseq (mGy · cm) | 9 | 108 | 194 | 200 | 254 | 429 | 35 | 100 | 146 |