
Residential Radon Mitigation Actions Follow-Up Study: Public Summary
Purpose
This study was conducted by Health Canada to:
- Determine the proportion of Canadians from the two previous residential surveys that took action to reduce radon levels in their homes;
- Gather insights about reasons for taking action or not taking action;
- Obtain statistics on the types of radon mitigation actions taken, and the success rates of various mitigation techniques;
- Determine if financial barriers impact testing and mitigation; and
- Gather insights into public risk perception versus costs of mitigation that could guide future policies in this direction.
Methodology
The participants in this study were drawn from the pool of homeowners who had radon results of 150 Bq/m3 or higher from the earlier national surveys.Footnote2,Footnote3 They were recruited by a contract market research firm, Prairie Research Associates (PRA), using a telephone survey. Participants were asked a series of questions regarding whether they had mitigated or not, what mitigation actions they had taken, and what their mitigation costs were. Socio-economic and demographic details were also collected for the participating households. Participants that mitigated their homes were offered a free long-term post-mitigation radon test by Health Canada’s National Radon Laboratory. The intent was for the participant to test their home in the same location where the pre-mitigation radon test had been conducted in either of the initial surveys, in order to determine how effective their mitigation actions had been at reducing radon levels. The test kits were mailed out to the study participants by the National Radon Laboratory and participants were reminded by the market research firm to start their radon test, and to end their radon test roughly three months later. The detectors were then analyzed and results were mailed to all the participants.
For homes where the indoor radon level was still above 200 Bq/m3 following participants’ reported mitigation efforts, further radon reduction guidance was included when their radon results letter was mailed out. For those households where no mitigation actions were taken, information was collected to determine contributing factors for inaction and gather insights into radon risk perception.
Recruitment of survey participants
The study consisted of two components: the recruitment of survey participants through a telephone survey, and a long-term post mitigation test to evaluate the efficiency of the radon reduction action for those who reported mitigating and had conducted the follow-up test.
Telephone Survey: A total of 1,747 homeowners agreed to participate in the telephone survey: 615 who had originally measured levels between 150-200 Bq/m3, and 1132 who had originally exceeded the 200 Bq/m3 guideline. This represents approximately 62% and 64% of eligible participants from each group. Even at relatively high radon levels (more than 800 Bq/m3), the participation rate was 62%, indicating that participants with high radon levels did not appear to be any more or less willing to talk about mitigation.
Post–Mitigation Radon Test: The free post-mitigation radon test was offered to all willing and eligible participants who indicated having taken some action to reduce their radon levels. For the 150-200 Bq/m3 group, there was a 76% detector return rate. For those that tested above the guideline, there was a 90% detector return rate. The overall refusal rate was fairly low at 13%, and was similar between the two groups of radon levels.
Survey findings
Based on all the responses received, some key findings from the survey are highlighted below.
- Only 5% of the participants who had tested at or just below the guideline (150-200 Bq/m3) reported taking steps to mitigate.
- About 29% of those who had radon levels of 200 Bq/m3 or greater in the initial Health Canada studies reported taking steps to reduce the radon levels in their home (Figure 1).
- Approximately 39% of survey participants who tested above 800 Bq/m3 (n= 92) and 43% of survey participants who tested above 1000 Bq/m3 (n= 53) indicated they had mitigated.
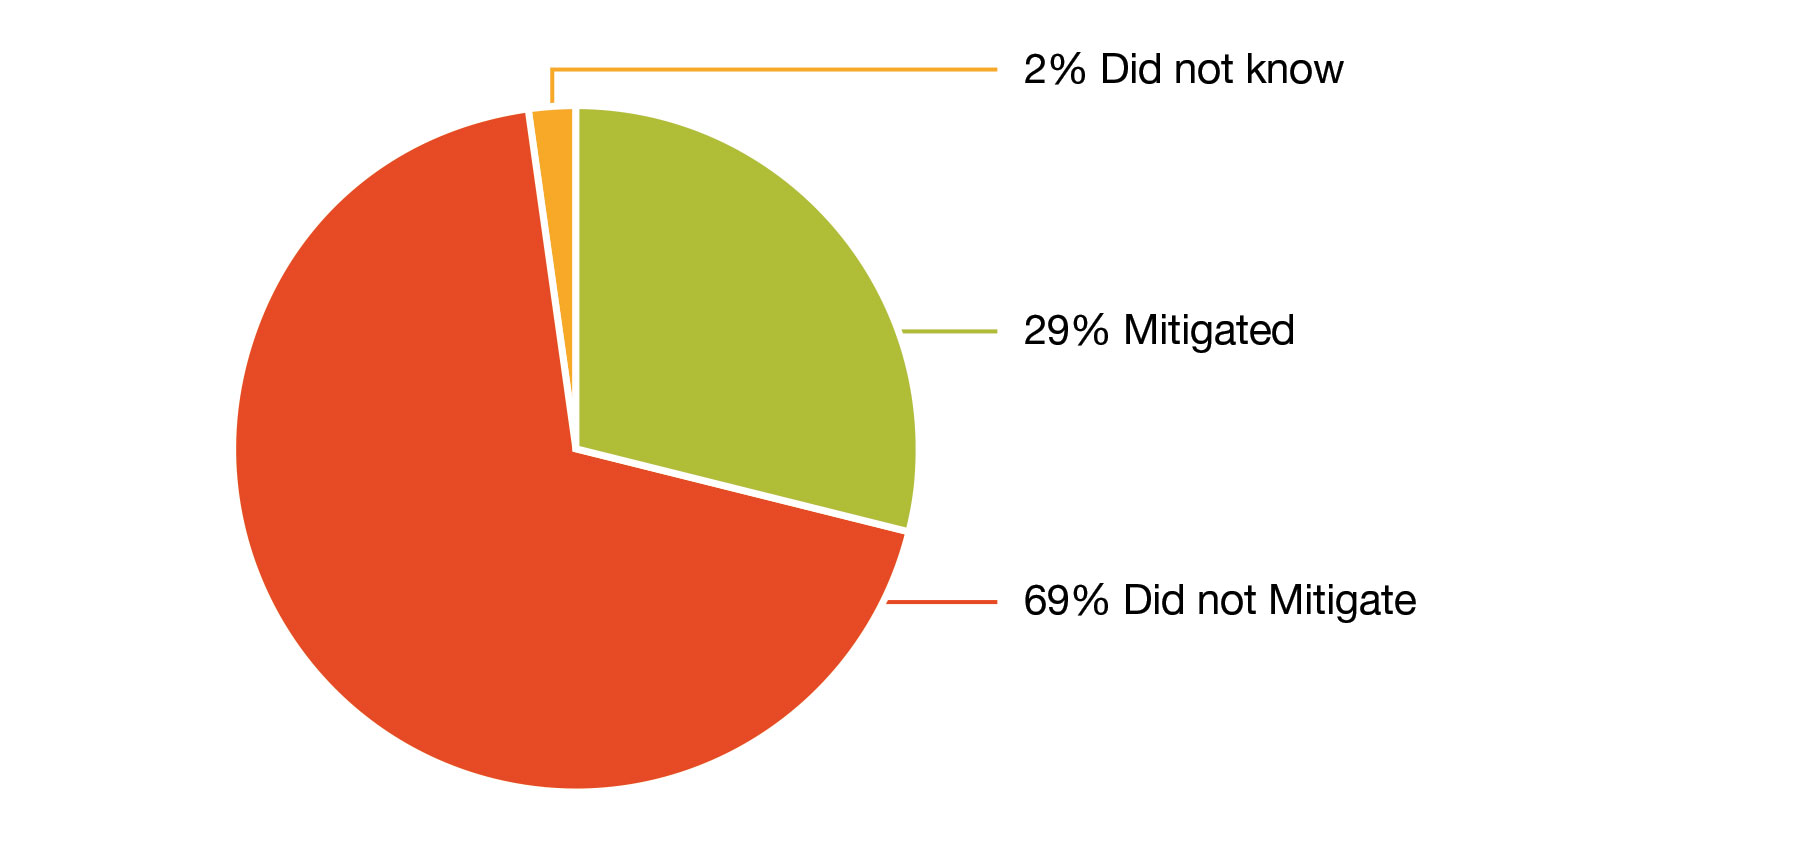
Figure 1 text description
- 69% did not mitigate
- 29% mitigated
- 2% did not know
A. Those who took steps to mitigate
- Among those who tested above the 200 Bq/m3 radon guideline and who mitigated, the three most popular reasons cited for reducing their radon levels were:
- The result letter they had received from the initial survey said their radon level was high (42% of respondents);
- They wanted to reduce the radon level in their home (28% of respondents); and
- Concern for the risk of developing lung cancer (10%).
- The most prevalent time lag to mitigating was less than three months, with 55% of those who tested above the guideline having mitigated within this period (Table 1).
| Time Lag to Mitigating | % of ParticipantsTable 1 Footnote 1 |
|---|---|
| < 3 months | 55% |
| 3 to 6 months | 22% |
| 7 to 12 months | 11% |
| > 12 months | 10% |
| Don’t know | 3% |
|
|
- Those with higher levels of radon appeared to have taken steps to reduce their radon levels sooner than those who did not.
- Those who undertook mitigation were not influenced by factors like children under 18 years of age in their household, presence of any smokers in the household, their level of education, household income, or the geographic region (Eastern/Central/Western) where they lived.
B. Results of radon reduction efforts
- Roughly 70% of participants who took action experienced a reduction in their radon levels.
- Average percentage radon reductions where a single mitigation method was reported are shown in Figure 2.
- An average radon reduction of approximately 13% was achieved from the group that reported sealing entry routes as their sole method for reducing radon. This supports the conclusion that sealing of entry points is not very effective as a standalone technique for radon reduction.
- Active soil depressurization (ASD) was the most effective single method for radon reduction (Figure 2). In addition, having an ASD system installed by a contractor or certified radon professional resulted in the greatest average radon reductions, around 83% (Figure 3).
- In general, the highest radon reductions were seen where ASD systems were installed, for those who hired someone to do the work, and for those who spent more on mitigation.
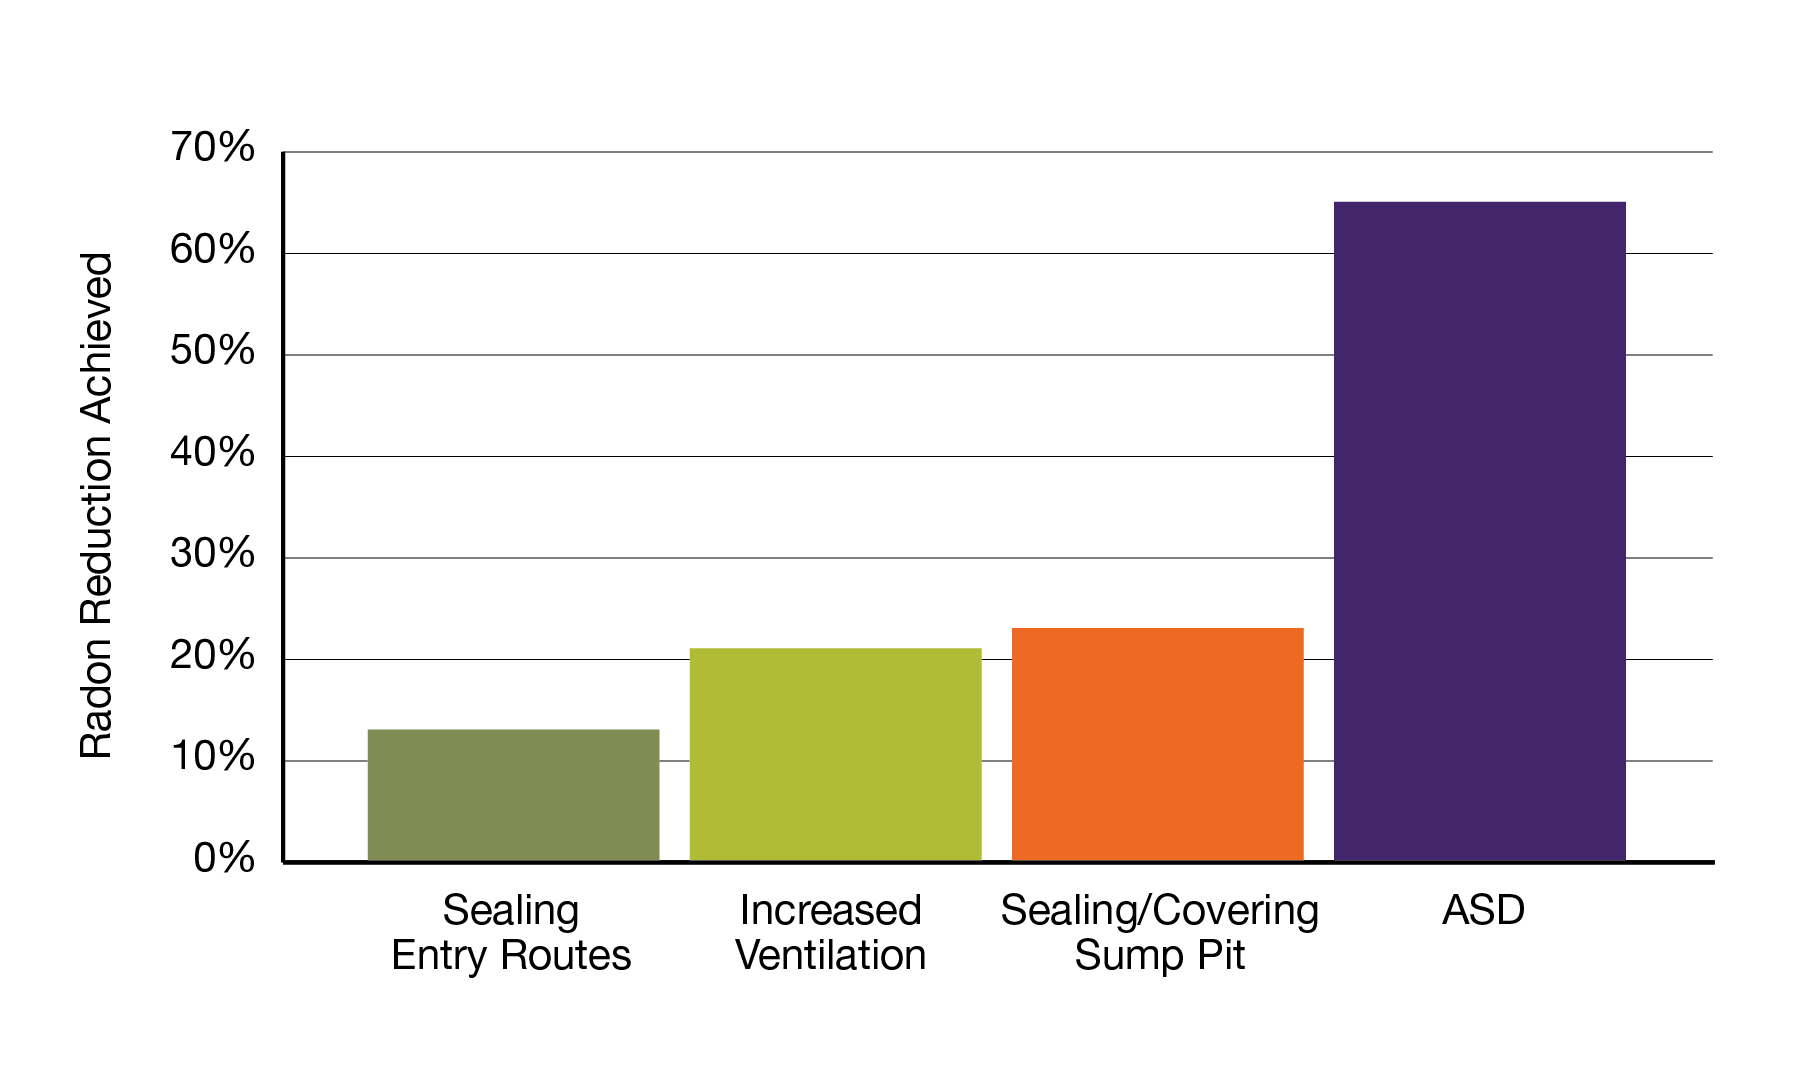
Figure 2 text description
Radon reduction achieved:
- Sealing Entry Routes: 13%
- Increased Ventilation: 21%
- Seal/Covering Sump Pump: 23%
- ASD: 65%
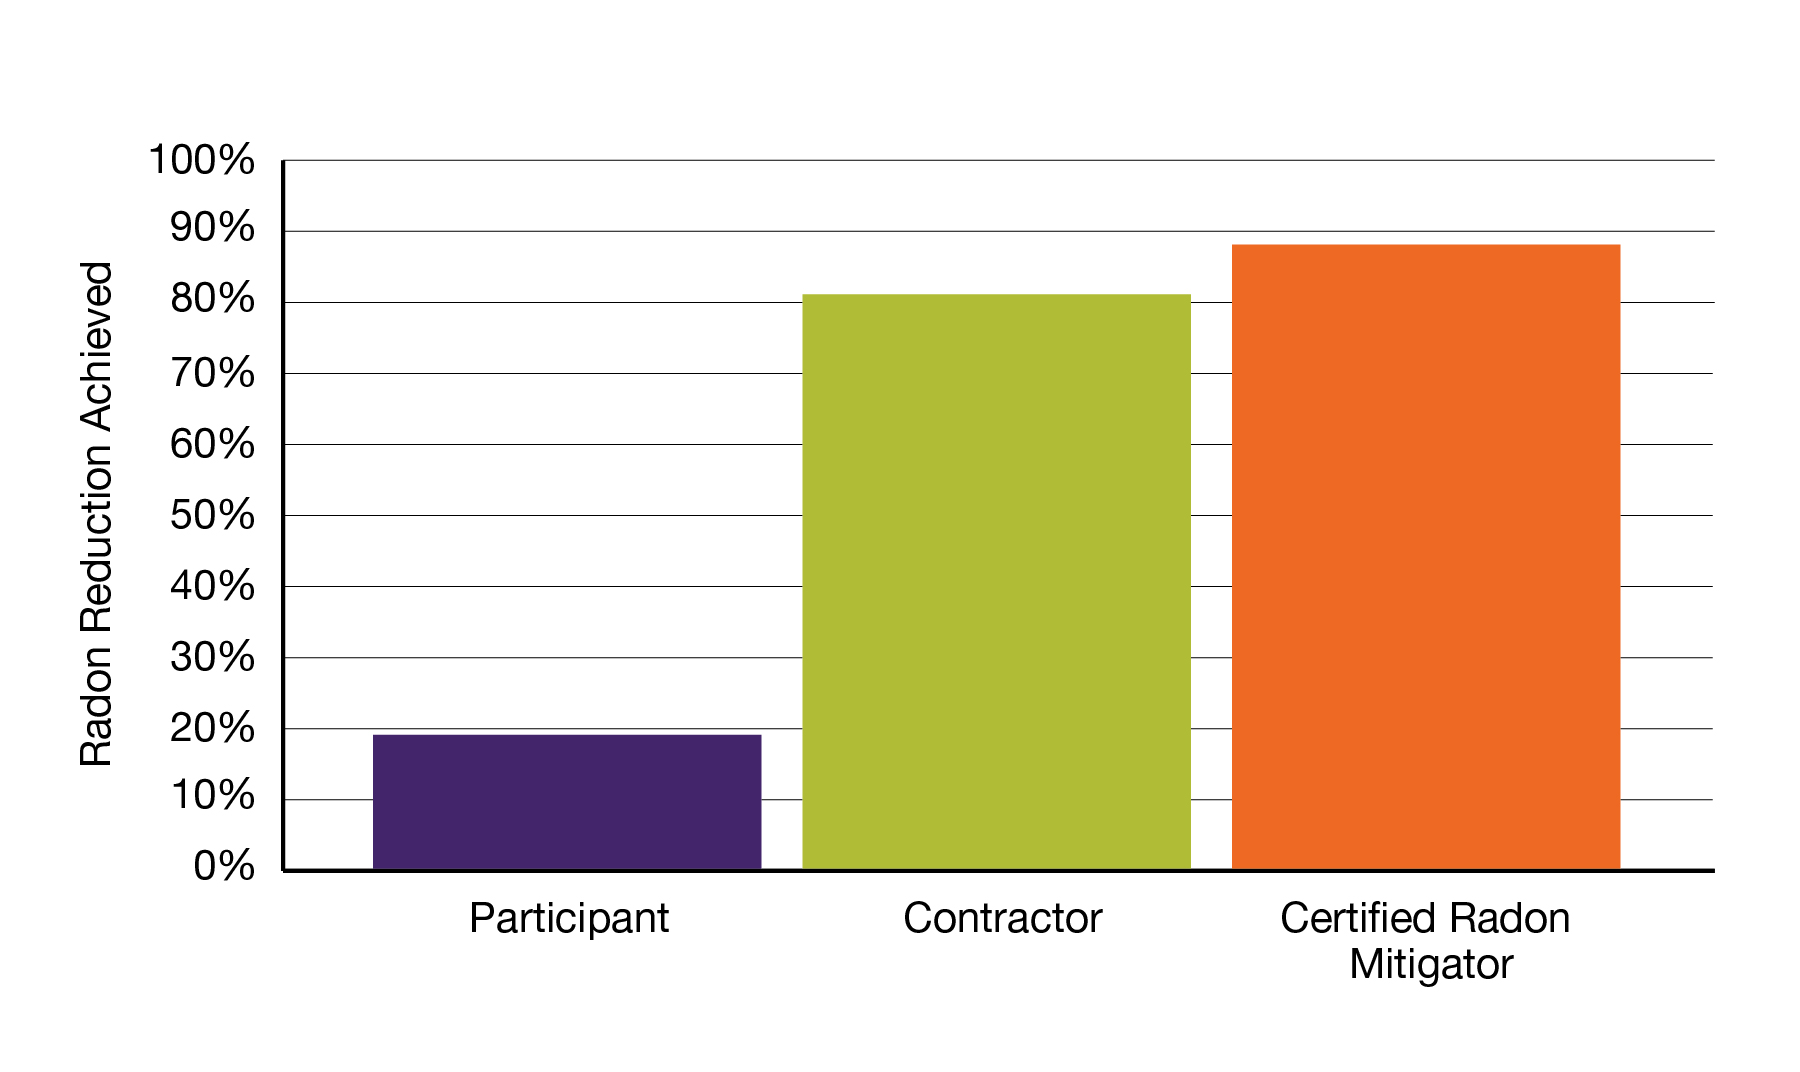
Figure 3 text description
Radon reduction achieved:
- Participant: 19%
- Contractor: 81%
- Certified Radon Mitigator: 88%
C. Those who did not take steps to mitigate
Reasons for not taking steps to reduce radon levels
The most common reasons for not taking action to reduce radon levels cited by participants testing above the 200 Bq/m3 radon guideline were:
- Did not consider their radon levels were particularly high (35% of respondents)
- Concern about the cost of mitigation (18% of respondents)
- Did not yet find the time to mitigate (8%)
- Lack of information or didn’t know what to do to reduce their radon levels (8%)
To help put context to the reasons for inaction seen in this survey, these results were compared with findings from similar international studies. In a 2016 Irish surveyFootnote4 on radon mitigation rates, 35% of participants were not certain that there was a serious enough health risk, while 34% cited costs as reasons for not mitigating. In a 2011 study in the United Kingdom,Footnote5 the cost of mitigation was the number one reason reported for not mitigating, followed by not believing the health risk was serious. In a study done in Vermont, USA,Footnote6 not thinking the health risk from radon was serious and the cost of mitigation were also the top two reasons given for not mitigating. In a New York State mitigation studyFootnote7 the top two reasons given for not mitigating were: the radon level was not perceived as high or as being a health concern; and the cost of mitigating.
The findings from this first ever Canadian study, therefore, are consistent with the same general trends seen in other jurisdictions regarding why people have not mitigated high radon levels in their homes.
Factors influencing mitigation action
Those who had levels of 200 Bq/m3 or greater and did not take steps to mitigate were asked a series of hypothetical questions regarding willingness to mitigate.
Cost of mitigation: Those with the highest level of education (postgraduate) were the most likely (73%) to say they would have taken steps to reduce their radon levels if there had been a subsidy or rebate for mitigation.
Household income: In addition, those with the highest household income ($120,000 or more) also indicated they would be willing to spend more on mitigation. Among those with household incomes of $120,000 or more, 24% would be willing to spend over $1,000, compared with just 4% of those with an income of under $40,000.
Conclusions
This is the first ever Canadian national study that provides information about current rates of radon mitigation in Canada, insights on public perception of radon risk, and some data on mitigation actions that are being applied to address the public health risks from indoor radon exposure. A majority of participants from this survey indicated they would be willing to be contacted in the future by the National Radon Laboratory if another mitigation action follow-up study was performed. The 29% mitigation rate found in this study compares well with mitigation rates reported by other countries and jurisdictionsFootnote4,Footnote5,Footnote6,Footnote7 ranging from 15 to 50%. Nonetheless, much work remains to be done to encourage both radon testing and mitigation in Canada. The National Radon Program continues to strengthen partnerships across the country in an effort to improve the national statistics for testing and mitigation rates. The information gathered through this survey provides an important metric to evaluate and enhance the radon reduction strategies across the country, and further supports the National Radon Program’s mandate in focusing and implementing radon risk reduction strategies, and in assessing public perception of radon risk.
Acknowledgements
Health Canada would like to thank Prairie Research Associates (PRA) for their dedication during the recruitment and surveying of participants, and for their analysis of responses from the study.