
Benzene releases from gasoline stations - Implications for human health: Background
On this page
- Health effects of benzene
- Gasoline station and delivery tanker truck statistics in Canada
- Benzene concentrations in ambient air in Canada
Health effects of benzene
Benzene has been classified as a Group 1 carcinogen ("carcinogenic to humans") by the International Agency for Research on Cancer (IARC 2012, 2018) and as carcinogenic to humans by the Government of Canada (Canada 1993). Benzene was added to the List of Toxic Substances in Schedule 1 of CEPA 1999 (Canada 1999a). The adverse health effects of benzene have been reviewed and assessed in previous Canadian and international guideline documents (Canada 1993; ATSDR 2007; Health Canada 2009; Health Canada 2013).
Among the volatile components of liquid gasoline, benzene represents the highest health concern. Additionally, gasoline has been classified by the European Commission as a Category 1B carcinogen ("presumed to have carcinogenic potential for humans") when the concentration of benzene in liquid gasoline is ≥ 0.1% by weight (w/w) (European Union 2008, 2009; UN 2013; IMAP 2018).
The Government of Canada's Priority Substances List (PSL) Assessment Report on Benzene (Canada 1993) developed estimates of carcinogenic potency associated with inhalation exposure to benzene. A 5% tumourigenic concentration (TC05) for benzene was calculated to be 14,700 μg/m3 from the epidemiological investigation of Rinsky et al. (1987), based on acute myelogenous leukemia in Pliofilm workers. The TC05 value is the air concentration of a substance associated with a 5% increase in incidence or mortality due to tumours. Linear extrapolation from the TC05 results to benzene concentrations associated with risk levels of 1 in 1,000,000 and 1 in 100,000 equal to 0.29 μg/m3 and 2.9 μg/m3, respectively. Accordingly, the risk level associated with a benzene concentration of 1 μg/m3 is 1 in 290,000.
The Health Canada cancer potency estimate from the PSL Assessment Report (Canada 1993) can be compared with those determined by other organizations. The US EPA has derived reference values for benzene (US EPA 1998) using similar epidemiological datasets. The US EPA (1998) derived a range of cancer potencies for benzene, and it was estimated that exposure concentrations of 0.13 to 0.45 μg/m3 are associated with a risk level of 1 in 1,000,000 and 1.3 to 4.5 μg/m3 are associated with a risk level of 1 in 100,000. Additionally, the California Office of the Environmental Health Hazard Assessment (OEHHA 2001) identified a cancer potency estimate for benzene equivalent to 0.6 μg/m3 associated with a risk level of 1 in 100,000 based on the Pliofilm workers cohort and an additional cohort (Chinese Worker cohort). Overall, the benzene cancer potencies range from 0.6 to 4.5 μg/m3 for a 1 in 100,000 risk level considering results presented in Canada (1993), US EPA (1998) and OEHHA (2001). This range of cancer potencies was identified by Health Canada (2013) based on review of these 3 key risk assessments of benzene. The value derived from Canada (1993) is approximately in the middle of that range. Health Canada continues to evaluate the literature on the health effects of benzene and updates of the hazard assessment may be provided in the future.
The PSL Assessment Report (Canada 1993) also identified non-cancer effects from short-term benzene exposure. The most sensitive endpoint was developmental hematotoxicity in fetal and neonatal mice exposed to 5 ppm (16 mg/m3) benzene in utero (Keller and Snyder 1986; Canada 1993). In the United States, OEHHA derived an Acute Reference Exposure Level (AREL) of 0.008 ppm or 27 μg/m3 for benzene based on this effect in mice by applying an uncertainty factor of 600 to the 5 ppm value (5 ppm / 600 = 0.008 ppm). The uncertainty factor was based on the use of a lowest observed adverse effect level as the point of departure, interspecies differences and intraspecies differences. This AREL was considered protective for the general population exposed to infrequent 1-hr exposures to benzene (OEHHA 2014).
Gasoline station and delivery tanker truck statistics in Canada
Gasoline stations are ubiquitous in urban and rural settings. Gasoline stations vary in size as characterized by physical footprint and yearly average gasoline throughput. Market survey data indicates that as of December 31, 2020, there were 11,908 retail gasoline stations operating in Canada (Kalibrate 2021). A survey of 411 regions, covering all major and many minor markets across the 10 provinces in Canada, identified a total of 7,138 gasoline stations accounting for approximately 70% of total gasoline gross sales in Canada. Of these, detailed information including station name, address and throughput were collected for 6,565 gasoline stations identified as having annual gasoline throughputs greater than 1 million L (Kent Group 2020). The total annual gasoline throughput for these stations was 32 billion L, with a median and 95th percentile station throughput (the latter called "high throughput" from here onwards) of 4 and 10.6 million L/year, respectively. These values were used to model potential gasoline vapour releases from gasoline stations and resulting benzene exposures of Canadians residing within the vicinity. It was noted that there are gasoline stations in Canada with annual throughputs significantly higher than the 95th percentile throughput. However, the 95th percentile limit is more typical of high throughput gasoline stations with exposure to the general population for the purposes of this assessment.
Gasoline storage tank filling schedules depend on the tank capacity and throughput of each individual gasoline station. Individual gasoline station storage tanks range from 45,000 to 91,000 L (Transcourt 2018). Typical gasoline delivery tanker trucks have holding capacities between 11,400 and 43,900 L (USDT 2012). For this report, a typical gasoline delivery tanker truck was assumed to have a capacity of 35,000 L (Statistics Canada 2012) and a large tanker truck was assumed to have a capacity of 43,900 L. For median- and high-throughput gasoline stations, this corresponds to approximately 2 to 6 fuel deliveries per week.
Gasoline vapour forms in the gasoline station storage tank due to partial evaporation of liquid gasoline under operating temperatures. To prevent pressure imbalances in storage tanks due to the expansion and contraction of the gasoline vapour, stacks of vent pipes are installed on the tanks. They connect the vapour phase in the tank to the external atmosphere. In Canada, the vent pipes open directly to the atmosphere at elevated heights of approximately 3 m or more. These vent stacks are usually positioned in groups at the edges of gasoline stations (Figure 1 a). For some gasoline stations, the vent stacks may be located close to residential buildings (Hilpert 2019).
In the absence of any vapour recovery on the gasoline delivery tanker truck, liquid gasoline delivered to a gasoline station storage tank pushes the gasoline–air mixture in the empty tank into the atmosphere via the storage tank vent pipes (Figure 1b). This gasoline loss during refilling of the storage tank is called the working loss.
Figure 1a. Two examples of gasoline station vent stacks connected to the underground storage tanks in close proximity to residential areas
Figure 1b: A schematic representation of gasoline delivery by a tanker truck in the absence of vapour recovery where the gasoline vapour in the storage tank is driven out of the vent pipe into the atmosphere to balance the pressure inside the storage tank

Figure 1a - Text description
Figure 1a shows 2 examples of sets of 4 or 5 gasoline station vent stacks connected to the underground storage tanks, which are 10 metres or less from residential buildings. The vent stacks are close to the gasoline station fence line and are about 3 metres high. The vents release gasoline vapour at fairly close distances to open windows in the residential buildings.
Figure 1b - Text description
Figure 1b is a diagram of a tanker truck without vapour recovery delivering gas. The tanker has an evacuation tube at the bottom, from which it empties gasoline into an underground storage tank. Gasoline vapour forms on top of the liquid gasoline in the tanker. There is pre-existing gasoline vapour in the underground storage tank, in addition to residual gasoline liquid. As the tanker empties liquid into the underground tank, the vapour in the tank is released into the atmosphere through a vent pipe connected to the underground tank. This balances the pressure inside the underground storage tank with the atmosphere and allows further entry of liquid gasoline from the tanker to the underground tank.
Photos: Health Canada, Existing Substances Risk Assessment Bureau, September 2021
Graphic: Washington State JLARC Report on Gas Vapor Regulations
In the absence of vapour recovery, average total evaporative losses of 0.15% of the gasoline station throughput were estimated by the Statistics Canada Survey of Industrial Processes (SIP) using models and exposure factors from the US EPA AP 42 (Statistics Canada 2012; Yerushlami and Rastan 2014).
Cross-referencing station location information (Kent Group 2020) with satellite imagery has identified residential areas as close as 10 m to the gasoline station fencelines. A typical gasoline station set-up is schematically shown in Figure 2.
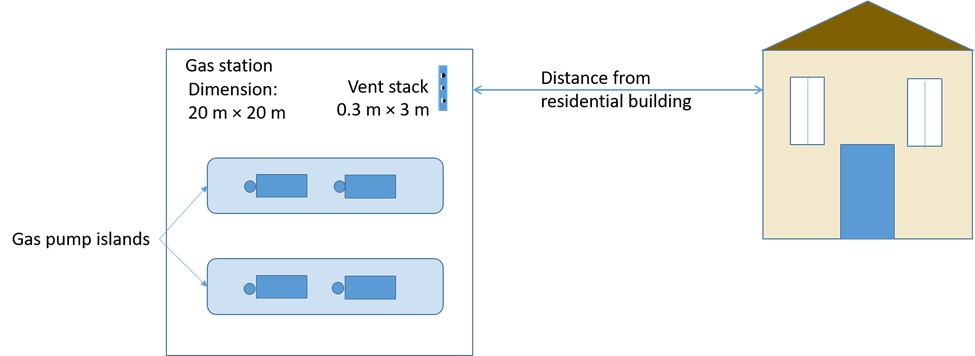
Figure 2 - Text description
Figure 2 is a diagram of a typical gasoline station layout in a residential area. The gasoline station is considered to be a 20 x 20 metre square in which 2 gasoline pump islands are included. A vent stack is located near the fence line on one side of the gasoline station. The vent stack is assumed to be placed in a rectangle area of 0.3 x 3 metres. The gasoline station is assumed to be near a residential building. The distance between the gasoline station fence line and the residential building is indicated.
Benzene concentrations in ambient air in Canada
Numerous studies have reported on the concentration of benzene in ambient air in Canada and trends indicate a decrease in the average outdoor benzene air concentration across Canada over time (Dann 2015; Stroud 2016; Galarneau 2016).Outdoor benzene concentrations in Canada from 1999 to 2019 from the National Air Pollution Surveillance (NAPS) program are shown in Figure 3, confirming a downward trend in ambient benzene concentrations, particularly at urban sites, during this period (NAPS 2019). In 2019, annual average rural and urban benzene concentrations were 0.20 and 0.44 µg/m3, respectively. These benzene concentrations represent averages from data collected from 51 urban and 16 rural areas.
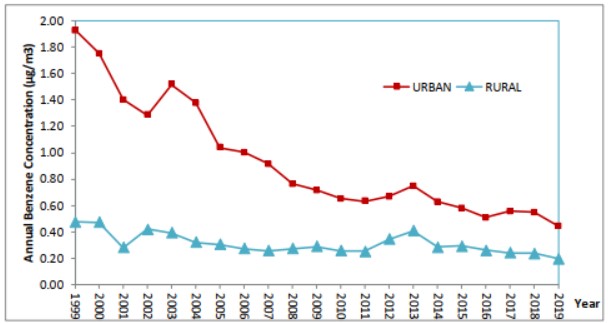
Figure 3 - Text description
Figure 3 shows average annual urban and rural benzene concentrations in ambient air in Canada (the y-axis) from 1999 to 2019 (the x-axis). The y-axis shows benzene concentrations from 0 to 2.0 µg/m3. The urban concentrations begin at ~1.9 µg/m3 in 1999 and drop down to ~0.6 µg/m3 in 2019. The rural concentrations are lower and begin at ~0.5 µg/m3 in 1999 and drop down to ~0.3 µg/m3 in 2019.
Figure prepared from data provided in personal communication from ECCC, Air Quality Research Division
The trends in Figure 3 show that, over time, the concentration of urban benzene concentrations in outdoor air has decreased, but these average concentrations do not indicate the direct impact of individual gasoline stations on local benzene concentrations in nearby residential areas. Gasoline stations have the potential to increase the near-field benzene concentration above the general background values. Short-term (1-hr) increases in benzene concentration in residential areas adjacent to gasoline stations due to activities such as storage tank refilling are also not specifically reflected in these overall outdoor trends. The gasoline station releases can lead to additional benzene exposures and health effects for the general population in Canada living within the vicinity of gasoline stations.