
In Focus: The Emergence of Opioids in Canada
On this page
- Drug Analysis Service
- Summary
- Context: The overdose crisis in Canada
- Aim
- Data limitations
- Data analysis
- Opioid drug supply in Canada
- Fentanyl supply in Canada
- Fentanyl analogues supply in Canada
- Conclusion
- References
- Suggested citation
Drug Analysis Service
Health Canada's Drug Analysis Service (DAS) operates laboratories across Canada that analyze illicit drugs and substances submitted by Canadian law enforcement and public health officials. DAS data is based solely on samples submitted to the laboratories and as such, samples analyzed by DAS may not be completely representative of drug seizures in Canada, including substances circulating on the market. DAS data should therefore be used with caution when determining trends or drawing conclusions about the type and nature of substances circulating in the illicit market. The data in this report represents the number of times a substance was identified in samples submitted to DAS. A single sample may contain more than one substance.
Summary
- Since 2012, the Drug Analysis Service (DAS) has consistently identified Fentanyl, Heroin, Hydromorphone, Oxycodone, and Morphine as the most frequently encountered opioids in samples submitted by Canadian law enforcement and public health officials.
- In 2017, Fentanyl replaced Heroin as the most frequently identified opioid.
- As the prevalence of Fentanyl has increased over the years, the co-occurrence patterns have also evolved. In 2021, benzodiazepines became the most frequently observed co-occurring substances with Fentanyl, found in approximately 36% of samples containing Fentanyl. Methamphetamine has been increasingly found alongside Fentanyl. Lastly, new and emerging substances of concern, Xylazine and nitazenes, have consistently co-occurred with Fentanyl and Fentanyl analogues.
- Recently, a Fentanyl analogue, para-Fluorofentanyl was the second most frequently identified opioid after Fentanyl in samples analyzed by DAS in 2023.
- Prior to 2023, Fentanyl identifications were ten times higher than those of Fentanyl analogues. However, the rise of para-Fluorofentanyl in 2023 has lowered this ratio with Fentanyl identifications being approximately 2 times higher than Fentanyl analogue identifications. In 2021 and 2022, Carfentanil and para-Fluorofentanyl were the most frequently identified Fentanyl analogues, with para-Fluorofentanyl being the most common in 2023. These analogues were predominantly found in co-occurrence with Fentanyl and, in recent years, sometimes alongside benzodiazepines.
Context: The overdose crisis in Canada
Canada is currently facing an opioid crisis stemming from the abuse of both illegal and prescription opioids. Opioids are substances that can reduce pain. Research indicates that the escalation of the overdose crisis in Canada can be partly attributed to the growth in use of prescription opioids in recent decades, subsequently leading to an increase in reported harms associated with their use. Additionally, there has been a surge in the consumption of non-prescription opioids. The COVID-19 pandemic has further exacerbated the situation. Recognizing the urgency of this crisis, the Government of Canada has made substantial investments in harm reduction, introducing various initiatives aimed at preventing opioid-related harms and reducing the excessive prescription of opioids Note de bas de page 1 Note de bas de page 2.
Recent data reveals that from all accidental apparent opioid toxicity deaths in 2023, 88% of deaths were linked to non-pharmaceutical opioids, and 82% of these deaths involved Fentanyl Note de bas de page 3.
In Canada, a total of 44,592 fatalities due to apparent opioid toxicity were recorded from January 2016 to December 2023. 2023 witnessed an alarming average of 22 deaths per day. In comparison, the number of deaths per day was approximately 8 in 2016 and 12 in 2018, underscoring a significant increase over recent years. The evolving toxicity of the opioid supply in Canada stands as a major contributing factor to the devastating rise in opioid-related deaths Note de bas de page 3.
Aim
This In Focus report outlines the trends observed in the opioid supply in Canada since 2012 based on samples submitted to the DAS by law enforcement and public health officials. Specifically, it aims to characterize trends related to opioids, and particularly, patterns observed in co-occurrences with Fentanyl, including with benzodiazepines, Heroin, Fentanyl analogues, and multiple drug classes.
Data limitations
This report is based on data made available by the DAS, which analyzes illicit drugs and substances submitted by Canadian law enforcement and public health officials. Certain limitations are associated with the present data. Firstly, law enforcement officials submit samples for laboratory analysis based on investigation needs and priorities. Thus, analyzed samples may not be completely representative of substances circulating on the market as a number of factors may influence substances submitted by Canadian law enforcement officials. Additionally, DAS' mandate is to report substances that are controlled under the Controlled Drugs and Substances Act (CDSA). As such, it is possible that not all noncontrolled substance were reported.
Data analysis
Results of analyzed samples submitted by Canadian law enforcement and public health officials are reported in a centralized database called the Laboratory Information Management System (LIMS). The presented data were retrieved from the LIMS and cover the period between January 1, 2012, and December 31, 2023, inclusively.
Identifications refer to the number of times a substance is identified in samples submitted. Multiple substances may be identified in a single sample. For example, a sample containing Fentanyl, Morphine, and Isotonitazene would be interpreted as one identification of Fentanyl, one identification of Morphine, and one identification of Isotonitazene. Therefore, the number of identifications does not necessarily equal the number of samples.
For the purposes of this report, we have categorized opioids into 4 distinct subclasses:
Fentanyl & Analogues: This subclass includes Fentanyl, its derivatives, and other analogues, all of which are controlled under Schedule I Item 16 of the CDSA.
Opiates: This subclass comprises opium or opium derivatives derived from the poppy plant, as well as compounds that have the core chemical structure of morphine. Drugs falling under this subclass are controlled under Schedule I Item 1 and 10 of the CDSA.
Nitazenes: This subclass includes all nitazenes controlled under Schedule I, Item 13 of the CDSA, excluding Brorphine (classified in Other (Opioids)). Nitazenes are potent synthetic opioids.
Other opioids: This subclass encompasses all other synthetic opioids that share similar properties with Fentanyl & Analogues, Opiates, and Nitazenes. Drugs under this subclass are controlled under Schedule I, Item 3, 4, 5, 6, 7, 8, 9, 11, 12, 17, 22, 23, 24, 25, 26, 27. Some substances in this subclass are also not controlled.
The analysis of data presented was performed in R 4.2.3. Data wrangling and visualization was done using the tidyverse package Note de bas de page 4.
Opioid drug supply in Canada
Opioids are potent analgesic drugs used for pain relief. Due to their capacity to induce euphoria (a sense of being high), opioids carry a significant risk for problematic use. The prolonged use of opioids can lead to severe side effects, including physical dependence, substance use disorder, and overdose Note de bas de page 5. Naloxone, a fast-acting medication, can be administered to temporarily reverse the effects of an overdose from opioid use Note de bas de page 6. The sale, possession and production of opioids are illegal, unless authorized for medical, scientific or industrial purposes. They are controlled under Schedule I of the CDSA Note de bas de page 7.
Most frequently identified opioids
The most frequently identified opioids by DAS in samples submitted by Canadian law enforcement and public health officials in 2023 are Fentanyl, para-Fluorofentanyl, Hydromorphone, Oxycodone, and Heroin (Figure 1, Table 1) Note de bas de page 8. In 2017, Fentanyl emerged as the primary opioid in the Canadian drug supply, surpassing Heroin (Figure 1). Fentanyl is a potent opioid used in medical settings for pain management. Illicit Fentanyl can be mixed with other substances to increase the potency of the product, which increases the risk of an accidental overdose Note de bas de page 9.
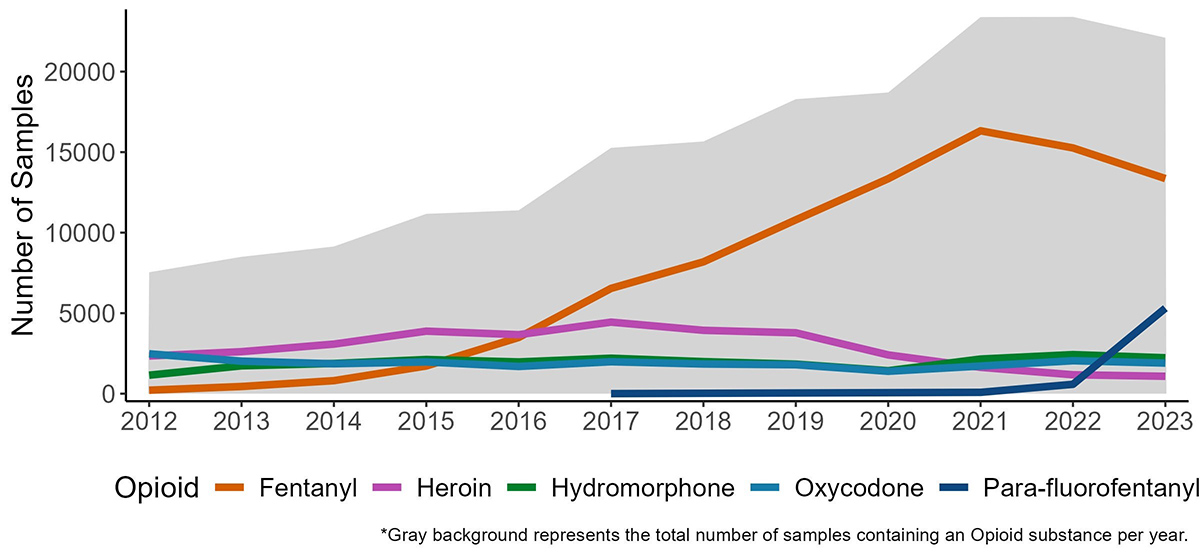
Figure 1: Text description
| Year | Fentanyl | Heroin | Hydromorphone | Oxycodone | para-Fluorofentanyl | Total |
|---|---|---|---|---|---|---|
| 2012 | 217 | 2339 | 1149 | 2477 | - | 6182 |
| 2013 | 446 | 2609 | 1730 | 2021 | - | 6806 |
| 2014 | 809 | 3079 | 1877 | 1857 | - | 7622 |
| 2015 | 1732 | 3883 | 2121 | 1970 | - | 9706 |
| 2016 | 3492 | 3664 | 1973 | 1692 | - | 10821 |
| 2017 | 6542 | 4443 | 2203 | 1983 | 4 | 15175 |
| 2018 | 8189 | 3936 | 1991 | 1844 | - | 15960 |
| 2019 | 10798 | 3783 | 1835 | 1797 | - | 18213 |
| 2020 | 13351 | 2408 | 1427 | 1390 | - | 18576 |
| 2021 | 16330 | 1636 | 2151 | 1717 | 83 | 21917 |
| 2022 | 15260 | 1174 | 2426 | 2045 | 582 | 21487 |
| 2023 | 13359 | 1081 | 2230 | 1901 | 5309 | 23880 |
| Total | 90525 | 34035 | 23113 | 22694 | 5978 | 176345 |
| Opioid | Subclass | General Information | Therapeutic Uses |
|---|---|---|---|
| Fentanyl | Fentanyl & Analogues | Fentanyl is a synthetic opioid, 50 to 100 times more potent than morphine, and has played a significant role in the Canadian overdose crisis Note de bas de page 9. | It is prescribed to manage severe pain, particularly after surgical procedures Note de bas de page 9. |
| para-Fluorofentanyl | Fentanyl & Analogues | Para-Fluorofentanyl is a synthetic opioid. It is a Fentanyl analogue. There is little information in the literature concerning its potency, but it is likely similar to Fentanyl Note de bas de page 10. | Para-Fluorofentanyl is not a prescription medicine and has no approved therapeutic use. |
| Hydromorphone | Opiates | Hydromorphone is a semi-synthetic opioid that can be synthesized from Morphine, a minor constituent of opium Note de bas de page 11. It is approximately 5 times more potent than morphine Note de bas de page 12. | Hydromorphone is indicated for the relief of moderate to severe pain Note de bas de page 11. |
| Oxycodone | Opiates | Oxycodone is a semi-synthetic opioid derived from Thebaine (a minor constituent of opium) Note de bas de page 11. It is 1.5 times more potent than morphine Note de bas de page 12. | Oxycodone is indicated for the management of moderate to severe pain Note de bas de page 11. |
| Heroin | Opiates | Heroin is a semi-synthetic opioid derived from morphine. It is 2 to 4 times more potent than morphine and is primarily used as an illegal recreational substance Note de bas de page 13. | Under medical supervision, prescriptions for Heroin may be obtained through the Urgent Public Health Need process for treating problematic opioid use Note de bas de page 14. |
Trends in the opioid-related drug supply
Trends are represented by way of identifications (see "Data analysis" section).
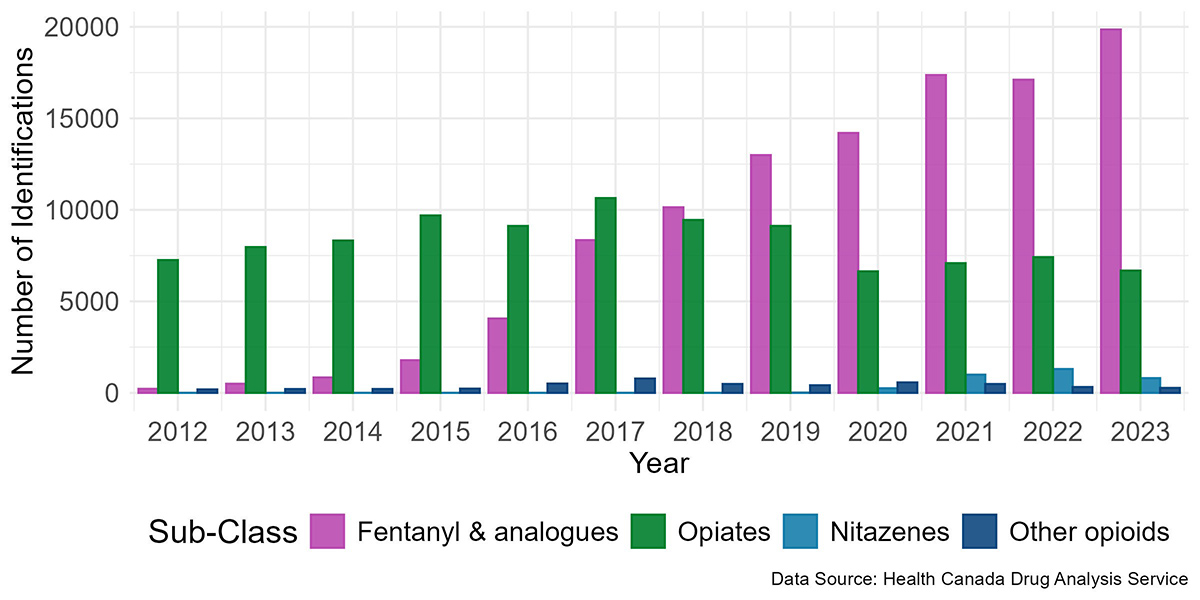
Opiates, specifically Heroin, Oxycodone, and Hydromorphone, were the most commonly identified opioids in the illicit drug supply in Canada until 2016.
By 2018, Fentanyl and its analogues had surpassed all other opioid subclasses combined in the number of identifications, becoming the dominant subclass of opioids identified and displacing the opiates subclass. Fentanyl analogues are substances chemically similar to Fentanyl. Often manufactured by modifying the chemical structure of Fentanyl, they have a high potential for misuse and dependence. Note de bas de page 15
Since 2020, Heroin identifications have notably decline, and there has been an emerging presence of non-Fentanyl and non-opiate opioids, specifically nitazenes. Nitazenes are potent synthetic opioids only present in the illicit drug supply. Certain nitazenes are estimated to have greater potencies than Fentanyl Note de bas de page 16.
Overall, trends observed in Canada in the past decade indicate a shift in the opioid supply towards more potent substances (Figure 2, Table 2).
Note: Samples may contain multiple substances and other substances than those listed.
Figure 2: Text description
The data presented in this figure is available in Table 2.
| Substance | 2012 | 2013 | 2014 | 2015 | 2016 | 2017 | 2018 | 2019 | 2020 | 2021 | 2022 | 2023 | Total |
|---|---|---|---|---|---|---|---|---|---|---|---|---|---|
| Fentanyl & analogues |
|||||||||||||
Acetylfentanyl |
- |
48 |
29 |
45 |
232 |
138 |
51 |
111 |
404 |
16 |
35 |
40 |
1149 |
Carfentanil |
- |
- |
- |
- |
32 |
740 |
977 |
1766 |
312 |
890 |
1116 |
810 |
6643 |
Cyclopropylfentanyl |
- |
- |
- |
- |
- |
199 |
328 |
106 |
36 |
5 |
- |
6 |
680 |
Fentanyl |
217 |
446 |
809 |
1721 |
3491 |
6538 |
8187 |
10795 |
13349 |
16325 |
15260 |
13359 |
90497 |
Furanylfentanyl |
- |
- |
- |
- |
164 |
637 |
278 |
78 |
47 |
12 |
10 |
7 |
1233 |
para-Fluorofentanyl |
- |
- |
- |
- |
- |
4 |
- |
- |
- |
83 |
582 |
5309 |
5978 |
Other - Fentanyl & Analogues |
- |
- |
- |
15 |
139 |
89 |
318 |
134 |
52 |
34 |
105 |
321 |
1207 |
Total - Fentanyl & Analogues |
217 |
494 |
838 |
1781 |
4058 |
8345 |
10139 |
12990 |
14200 |
17365 |
17108 |
19852 |
107387 |
| Nitazenes | |||||||||||||
Etodesnitazene |
- |
- |
- |
- |
- |
- |
- |
- |
84 |
255 |
145 |
21 |
505 |
Isotonitazene |
- |
- |
- |
- |
- |
- |
- |
8 |
166 |
176 |
251 |
31 |
632 |
Metonitazene |
- |
- |
- |
- |
- |
- |
- |
- |
- |
342 |
346 |
334 |
1022 |
N-pyrrolidino Protonitazene |
- |
- |
- |
- |
- |
- |
- |
- |
- |
- |
- |
25 |
25 |
N-desethyl Isotonitazene |
- |
- |
- |
- |
- |
- |
- |
- |
- |
- |
- |
69 |
69 |
Protonitazene |
- |
- |
- |
- |
- |
- |
- |
- |
- |
171 |
415 |
302 |
888 |
Other - Nitazenes |
- |
- |
- |
- |
- |
- |
- |
- |
- |
46 |
144 |
21 |
305 |
Total - Nitazenes |
- |
- |
- |
- |
- |
- |
- |
8 |
250 |
990 |
1301 |
803 |
3352 |
| Opiates | |||||||||||||
6-Acetylmorphine |
28 |
18 |
27 |
58 |
39 |
34 |
37 |
66 |
139 |
57 |
78 |
62 |
643 |
Buprenorphine |
28 |
33 |
77 |
127 |
185 |
272 |
301 |
337 |
324 |
360 |
359 |
248 |
2651 |
Codeine |
482 |
529 |
541 |
671 |
696 |
757 |
568 |
571 |
383 |
404 |
367 |
367 |
6336 |
Heroin |
2339 |
2609 |
3079 |
3883 |
3664 |
4443 |
3935 |
3781 |
2408 |
1636 |
1174 |
1081 |
34032 |
Hydromorphone |
1149 |
1730 |
1877 |
2121 |
1972 |
2203 |
1991 |
1835 |
1427 |
2151 |
2426 |
2230 |
23112 |
Morphine |
620 |
836 |
700 |
734 |
739 |
811 |
657 |
633 |
425 |
574 |
723 |
578 |
8030 |
Opium |
105 |
176 |
151 |
104 |
129 |
126 |
98 |
85 |
111 |
166 |
211 |
192 |
1654 |
Oxycodone |
2477 |
2021 |
1857 |
1970 |
1690 |
1983 |
1843 |
1797 |
1390 |
1717 |
2045 |
1901 |
22691 |
Other - Opiates |
37 |
17 |
14 |
34 |
35 |
22 |
27 |
28 |
40 |
29 |
31 |
29 |
343 |
Total - Opiates |
7265 |
7969 |
8323 |
9702 |
9149 |
10651 |
9457 |
9133 |
6647 |
7094 |
7414 |
6688 |
99492 |
| Other opioids | |||||||||||||
Furanyl UF-17 |
- |
- |
- |
- |
- |
- |
- |
37 |
258 |
218 |
100 |
38 |
651 |
Methadone |
110 |
137 |
112 |
145 |
154 |
168 |
136 |
106 |
131 |
117 |
82 |
129 |
1527 |
Tramadol |
46 |
24 |
49 |
45 |
103 |
101 |
52 |
112 |
86 |
78 |
69 |
71 |
836 |
U-47700 |
- |
- |
- |
- |
208 |
451 |
228 |
92 |
27 |
1 |
1 |
1 |
1009 |
Other – Other (opioids) |
30 |
46 |
48 |
39 |
81 |
122 |
94 |
80 |
76 |
76 |
80 |
35 |
807 |
Total - Other (opioids) |
186 |
207 |
209 |
229 |
546 |
842 |
510 |
427 |
578 |
490 |
332 |
274 |
4830 |
| Note: Samples may contain multiple substances and other substances than those listed. | |||||||||||||
Opiates continue to dominate as the most prevalent substances in the eastern provinces (Maritimes and Quebec). In 2023, the eastern provinces had higher proportions of opiates, while the rest of the country had a higher proportion of Fentanyl and Fentanyl analogue identifications (Figure 3).
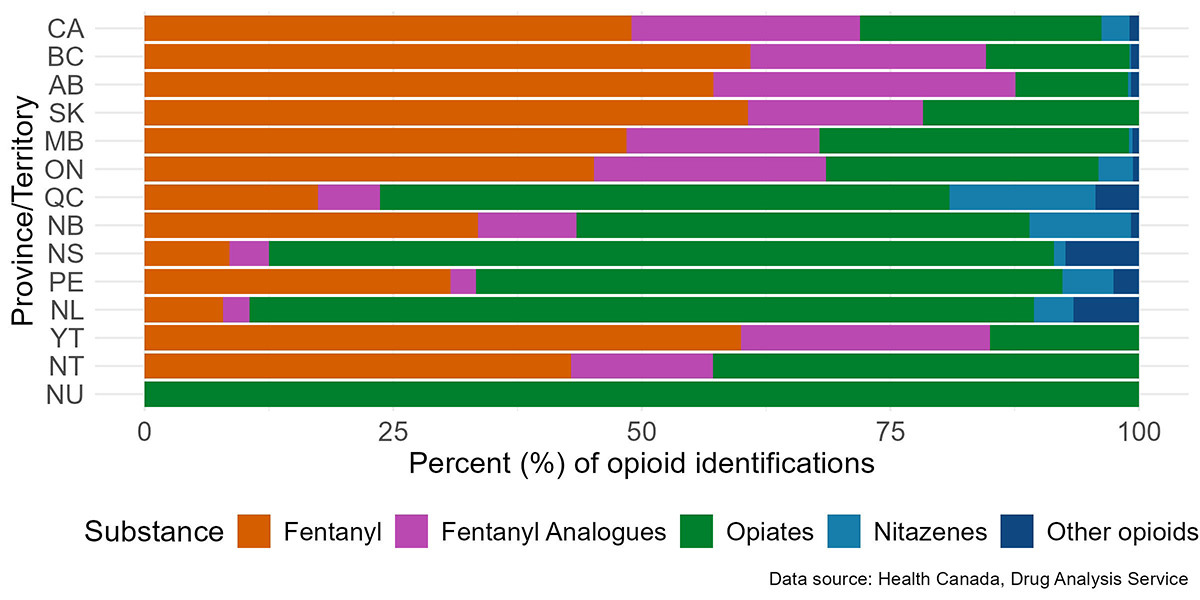
Figure 3: Text description
| Province/Territory | Fentanyl | Fentanyl analogues | Nitazenes | Opiates | Other opioids | Total |
|---|---|---|---|---|---|---|
| Canada | 13,358 (48.9%) | 6,278 (23.0%) | 765 (2.8%) | 6,631 (24.3%) | 270 (1.0%) | 27,302 |
| British Columbia | 3,827 (60.9%) | 1,485 (23.6%) | 8 (0.1%) | 908 (14.5%) | 56 (0.9%) | 6,284 |
| Alberta | 2,737 (57.2%) | 1,452 (30.4%) | 16 (0.3%) | 542 (11.3%) | 37 (0.8%) | 4,784 |
| Saskatchewan | 165 (60.7%) | 48 (17.6%) | - | 59 (21.7%) | - | 272 |
| Manitoba | 392 (48.5%) | 157 (19.4%) | 3 (0.4%) | 252 (31.2%) | 5 (0.6%) | 809 |
| Ontario | 5,762 (45.2%) | 2,976 (23.3%) | 443 (3.5%) | 3,491 (27.4%) | 76 (0.6%) | 12,748 |
| Quebec | 296 (17.4%) | 105 (6.2%) | 249 (14.7%) | 973 (57.3%) | 74 (4.4%) | 1,697 |
| New Brunswick | 128 (33.5%) | 38 (10.0%) | 39 (10.2%) | 174 (45.6%) | 3 (0.8%) | 382 |
| Nova Scotia | 15 (8.5%) | 7 (4.0%) | 2 (1.1%) | 139 (79.0%) | 13 (7.4%) | 176 |
| Prince Edward Island | 12 (30.8%) | 1 (2.6%) | 2 (5.1%) | 23 (59.0%) | 1 (2.6%) | 39 |
| Newfoundland and Labrador | 6 (7.9%) | 2 (2.6%) | 3 (4.0%) | 60 (79.0%) | 5 (6.6%) | 76 |
| Yukon | 12 (60.0%) | 5 (25.0%) | - | 3 (15.0%) | - | 20 |
| Northwest Territories | 6 (42.9%) | 2 (14.3%) | - | 6 (42.9%) | - | 14 |
| Nunavut | - | - | - | 1 (100%) | - | 1 |
Sample forms in the opioid-related drug supply
The form of analyzed substances differs by opioid type. Fentanyl and analogue-class opioids have a high proportion of samples in powder form. In contrast, opiate-class opioids are more frequently found in tablet/capsule form (Figure 4, Table 3). Opioid samples in powder form often contain a greater variety of substances than those in tablet or capsule forms. This is especially true in recent years, where the proportion of the number of co-occurring substances has increased in powered samples (Figure 5).
The most common form of opioid samples found varies geographically, with Eastern provinces generally exhibiting fewer powder form samples of each opioid class, whereas Western provinces having a higher proportion of samples in powder form across all opioid classes compared to the Eastern provinces (Figure 4, Table 3).
a) Fentanyl and analogues
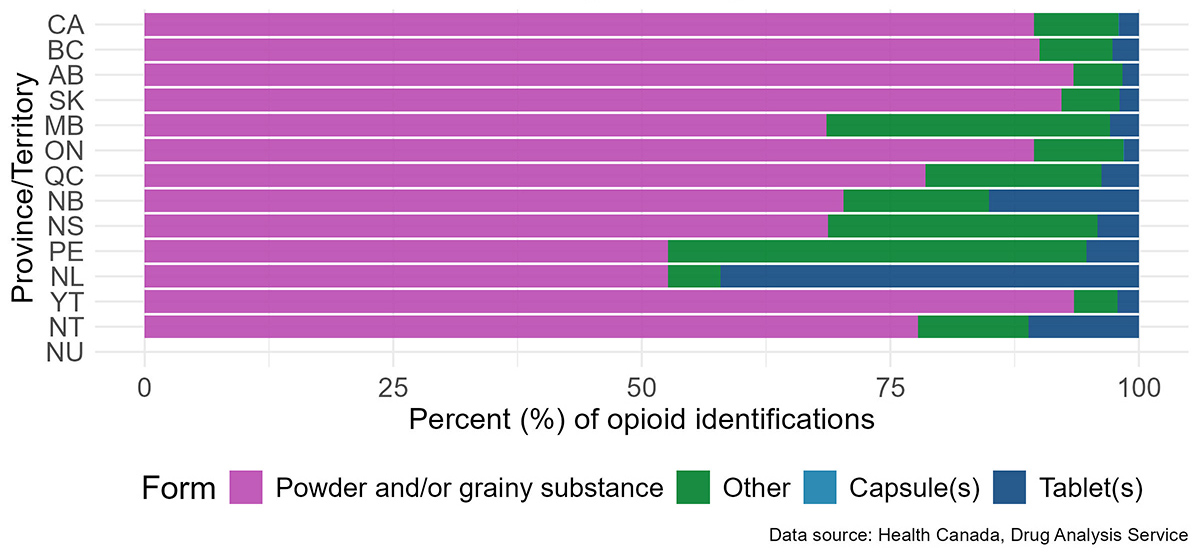
Figure 4a: Text description
The data presented in this figure is available in Table 3a.
b) Opiates
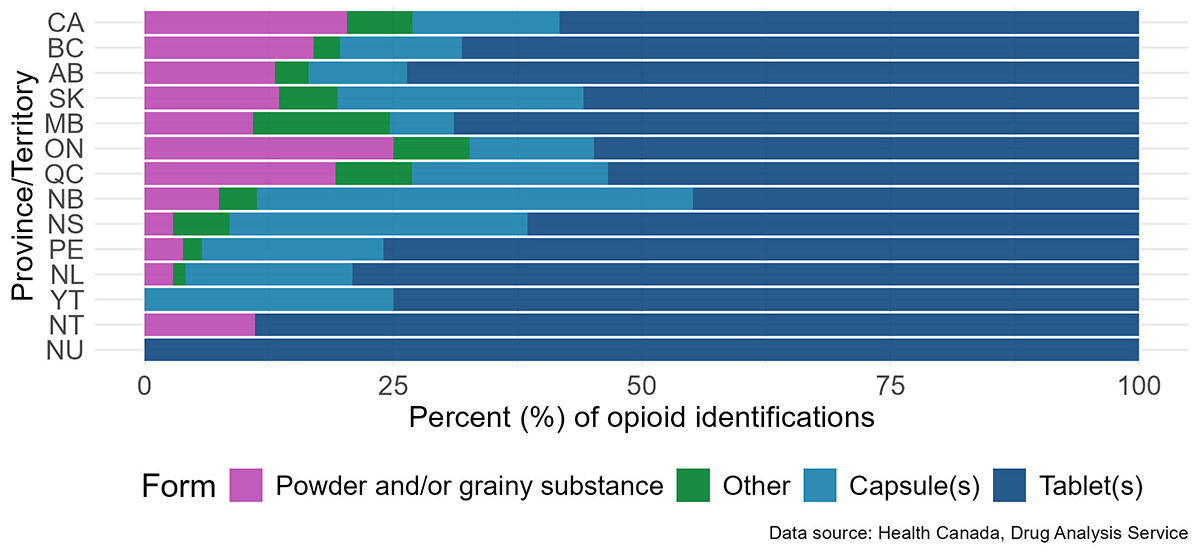
Figure 4b: Text description
The data presented in this figure is available in Table 3b.
c) Nitazenes
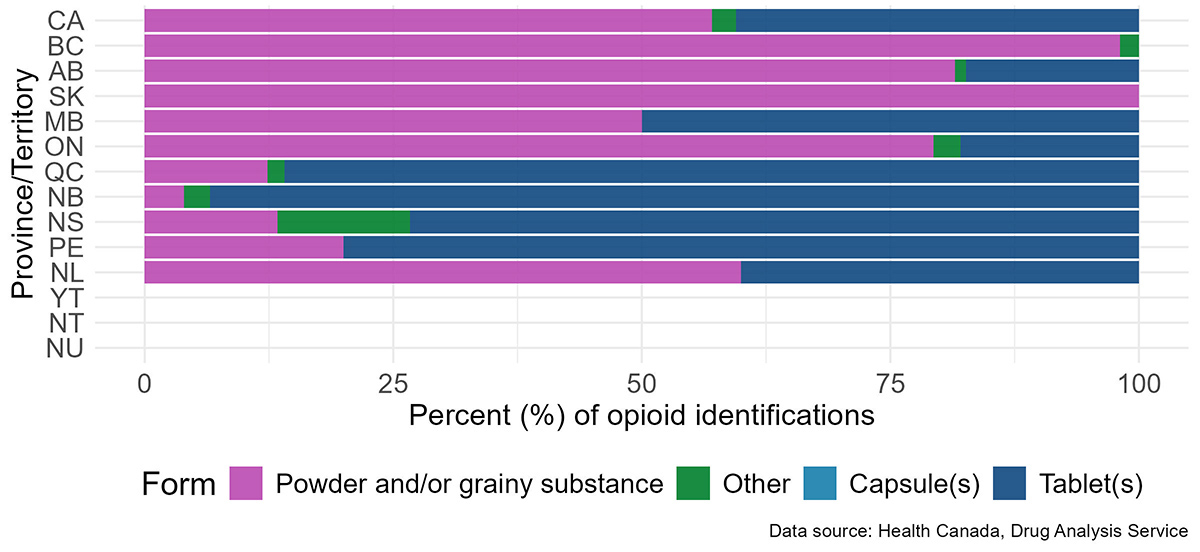
Figure 4c: Text description
The data presented in this figure is available in Table 3c.
Note: No nitazene samples were identified in Yukon, Northwest Territories, or Nunavut for 2021-2023.
Note: The subclass "other opioids" was not included in this figure in order to focus on the most frequently analyzed subclasses.
Table 3. Percentage of opioid identifications by subclass and form per Province/Territory for 2021 – 2023
| Province | Capsule(s) | Powder and/or grainy substance | Tablet(s) | Other | Total |
|---|---|---|---|---|---|
| Canada | 13 (0.0%) |
42,315 (89.4%) |
948 (2.0%) |
4,041 (8.5%) |
47,317 |
| British Columbia | 1 (0.0%) |
11,194 (90.0%) |
331 (2.7%) |
910 (7.3%) |
12,436 |
| Alberta | 1 (0.0%) |
7,605 (93.4%) |
134 (1.7%) |
402 (4.9%) |
8,142 |
| Saskatchewan | - | 427 (92.2%) |
9 (1.9%) |
27 (5.8%) |
463 |
| Manitoba | - | 777 (68.6%) |
33 (2.9%) |
323 (28.5%) |
1,133 |
| Ontario | 11 (0.1%) |
21,269 (89.4%) |
355 (1.5%) |
2,145 (9.0%) |
23,780 |
| Quebec | - | 772 (78.5%) |
37 (3.8%) |
174 (17.7%) |
983 |
| New Brunswick | - | 168 (70.3%) |
36 (15.1%) |
35 (14.6%) |
239 |
| Nova Scotia | - | 33 (68.8%) |
2 (4.2%) |
13 (27.1%) |
48 |
| Prince Edward Island | - | 10 (52.6%) |
1 (5.3%) |
8 (42.1%) |
19 |
| Newfoundland and Labrador | - | 10 (52.6%) |
8 (42.1%) |
1 (5.3%) |
19 |
| Yukon | - | 43 (93.5%) |
1 (2.2%) |
2 (4.4%) |
46 |
| Northwest Territories | - | 7 (77.8%) |
1 (11.1%) |
1 (11.1%) |
9 |
| Nunavut | - | - | - | - | - |
| Province | Capsule(s) | Powder and/or grainy substance | Tablet(s) | Other | Total |
|---|---|---|---|---|---|
| Canada | 3,114 (14.8%) |
4,294 (20.4%) |
12,285 (58.3%) |
1,388 (6.6%) |
21,081 |
| British Columbia | 310 (12.3%) |
429 (17.0%) |
1,721 (68.1%) |
68 (2.7%) |
2,528 |
| Alberta | 168 (10.0) |
221 (13.1%) |
1,244 (73.6%) |
57 (3.4%) |
1,690 |
| Saskatchewan | 55 (24.8%) |
30 (13.5%) |
124 (55.9%) |
13 (5.9%) |
222 |
| Manitoba | 36 (6.4%) |
61 (10.9%) |
385 (68.9%) |
77 (13.8%) |
559 |
| Ontario | 1,458 (12.5%) |
2,913 (25.0%) |
6,373 (54.8%) |
889 (7.6%) |
11,633 |
| Quebec | 576 (19.7%) |
561 (19.2%) |
1,562 (53.4%) |
227 (7.8%) |
2,926 |
| New Brunswick | 323 (43.9%) |
55 (7.5%) |
330 (44.8%) |
28 (3.8%) |
736 |
| Nova Scotia | 126 (29.9%) |
12 (2.9%) |
259 (61.5%) |
24 (5.7%) |
421 |
| Prince Edward Island | 19 (18.3%) |
4 (3.9%) |
79 (76.0%) |
2 (1.9%) |
104 |
| Newfoundland and Labrador | 41 (16.8%) |
7 (2.9%) |
193 (79.1%) |
3 (1.2%) |
244 |
| Yukon | 2 (25.0%) |
- | 6 (75.0%) |
- | 8 |
| Northwest Territories | - | 1 (11.1%) |
8 (89.0%) |
- | 9 |
| Nunavut | - | - | 1 (100.0%) |
- | 1 |
| Province | Capsule(s) | Powder and/or grainy substance | Tablet(s) | Other | Total |
|---|---|---|---|---|---|
| Canada | - | 1,608 (57.1%) |
1,141 (40.5%) |
68 (2.4%) |
2,817 |
| British Columbia | - | 52 (98.1%) |
- | 1 (1.9%) |
53 |
| Alberta | - | 75 (81.5%) |
16 (17.4%) |
1 (1.1%) |
92 |
| Saskatchewan | - | 10 (100.0%) |
- | - | 10 |
| Manitoba | - | 3 (50.0%) |
3 (50.0%) |
- | 6 |
| Ontario | - | 1,362 (79.3%) |
308 (17.9%) |
47 (2.7%) |
1,717 |
| Quebec | - | 94 (12.3%) |
655 (86.0%) |
13 (1.7%) |
762 |
| New Brunswick | - | 6 (4.0%) |
142 (93.4%) |
4 (2.6%) |
152 |
| Nova Scotia | - | 2 (13.3%) |
11 (73.3%) |
2 (13.3%) |
15 |
| Prince Edward Island | - | 1 (20.0%) |
4 (80.0%) |
- | 5 |
| Newfoundland and Labrador | - | 3 (60.0%) |
2 (40.0%) |
- | 5 |
| Yukon | - | - | - | - | - |
| Northwest Territories | - | - | - | - | - |
| Nunavut | - | - | - | - | - |
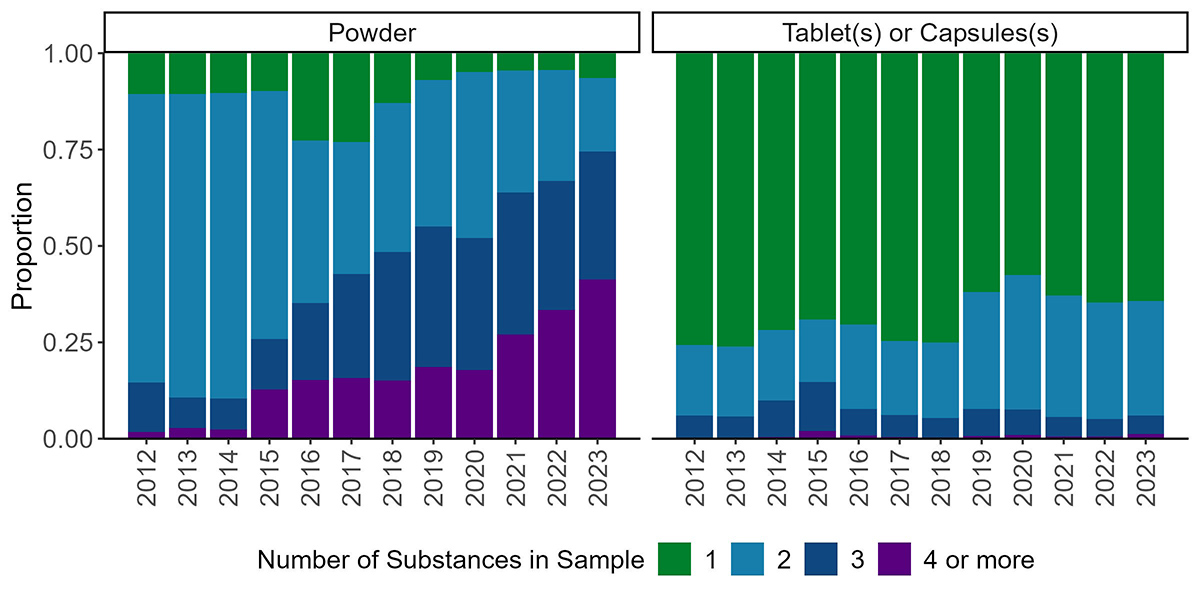
Figure 5: Text description
| Number of substances | Description | 2012 | 2013 | 2014 | 2015 | 2016 | 2017 | 2018 | 2019 | 2020 | 2021 | 2022 | 2023 |
|---|---|---|---|---|---|---|---|---|---|---|---|---|---|
| 1 | Tablets or Capsules | 3303 | 3518 | 3389 | 3891 | 3905 | 4500 | 3899 | 3155 | 2367 | 3474 | 4048 | 3756 |
| Powder | 89 | 111 | 142 | 122 | 460 | 1085 | 929 | 769 | 611 | 695 | 664 | 935 | |
| 2 | Tablets or Capsules | 796 | 841 | 866 | 913 | 1221 | 1159 | 1020 | 1542 | 1435 | 1742 | 1889 | 1738 |
| Powder | 629 | 822 | 1092 | 804 | 855 | 1611 | 2787 | 4226 | 5398 | 4968 | 4384 | 2803 | |
| 3 | Tablets or Capsules | 260 | 257 | 447 | 718 | 380 | 348 | 261 | 354 | 275 | 278 | 287 | 282 |
| Powder | 107 | 83 | 111 | 163 | 404 | 1267 | 2402 | 4050 | 4283 | 5778 | 5076 | 4872 | |
| 4 or more | Tablets or Capsules | 5 | 11 | 20 | 111 | 46 | 24 | 17 | 38 | 38 | 33 | 35 | 70 |
| Powder | 15 | 29 | 33 | 159 | 309 | 742 | 1085 | 2072 | 2242 | 4230 | 5083 | 6060 |
Fentanyl supply in Canada
Trends in this section are based on analysis results of samples submitted to the DAS by Canadian law enforcement and public health officials. Trends are presented by way of samples.
Fentanyl is routinely used in clinical settings for anesthesia and analgesia, however illicit Fentanyl has become prevalent nationwide, changing the composition of the illicit opioid supply across Canada. Its distinct pharmacological profile has led to unprecedented rates of mortality and morbidity among people who use drugs. Note de bas de page 17
The number of samples that were found to contain Fentanyl and analogues varied across the country, with high quantities of samples found in Ontario, British Columbia and Alberta in 2023. Adjusting for the population of each Province, the highest rates were in British Columbia and Alberta followed closely by Ontario. Yukon Territory and Manitoba had moderately high rates as well, with the rest of the country being lower (Figure 6).
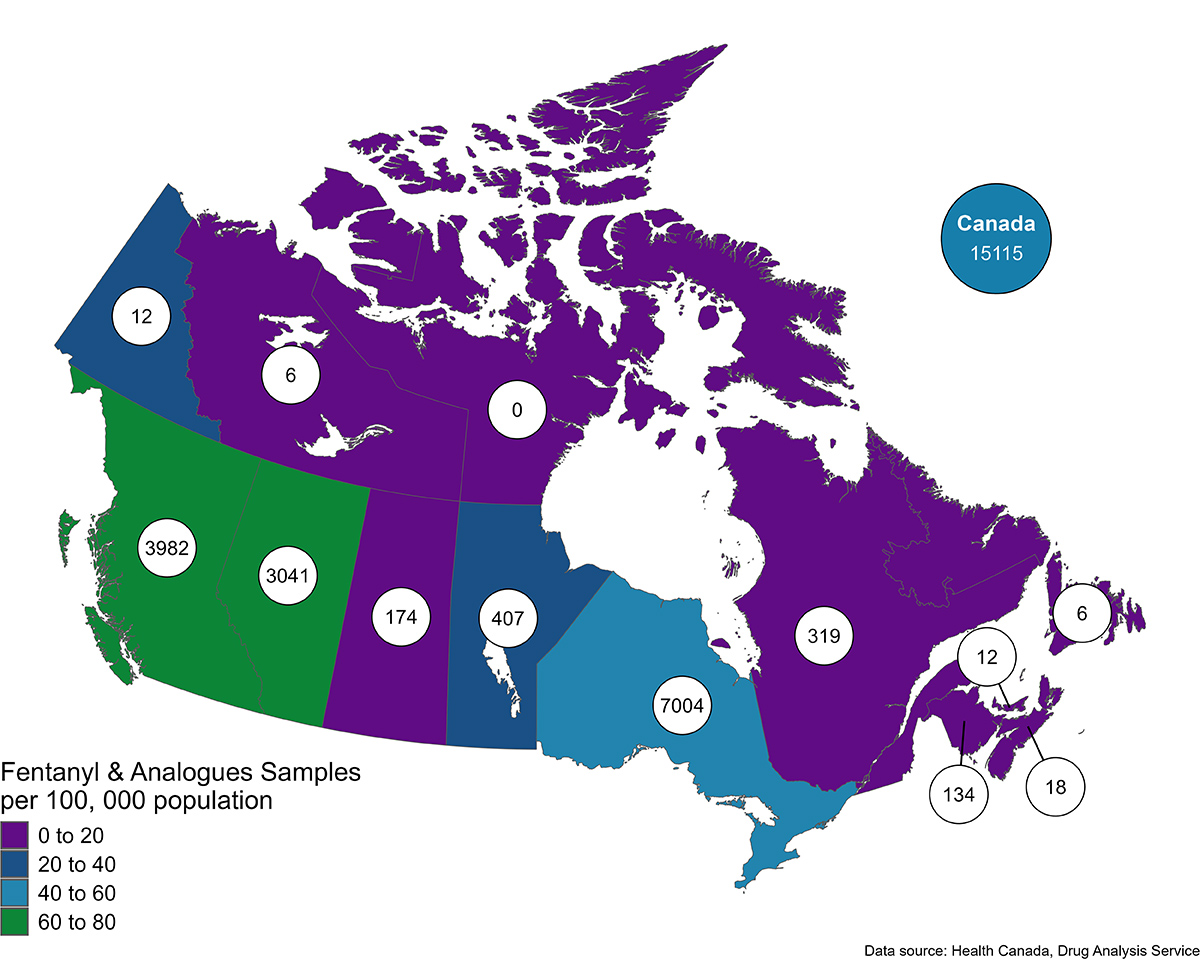
Note: The numbers in the bubbles represent the number of samples per Province/Territory
Figure 6: Text description
| Province/Territory | Fentanyl and analogues samples | Rate per 100,000 |
|---|---|---|
| Canada | 15115 | 37.3 |
| British Columbia | 3982 | 71.4 |
| Alberta | 3041 | 63.9 |
| Saskatchewan | 174 | 14.3 |
| Manitoba | 407 | 27.8 |
| Ontario | 7004 | 44.3 |
| Quebec | 319 | 3.6 |
| New Brunswick | 134 | 16.0 |
| Nova Scotia | 18 | 1.7 |
| Prince Edward Island | 12 | 6.8 |
| Newfoundland and Labrador | 6 | 1.1 |
| Yukon | 12 | 26.6 |
| Northwest Territories | 6 | 13.4 |
| Nunavut | - | - |
Trends in benzodiazepine, stimulant, xylazine, and nitazene samples co-occurring with Fentanyl and analogues
Polysubstance use (defined as the use of 2 or more substances simultaneously, or close in time) presents a serious risk to people who use drugs, including poor health outcomes and death. Exposure to polysubstance use is not always intentional or expected, whereby products from the illicit drug market are inherently uncontrolled and unpredictable. Note de bas de page 18
The simultaneous consumption of benzodiazepines and opioids may increase the risk of overdose since both drug types cause sedation and supress breathing Note de bas de page 19. 2021 saw a marked increase in the number of benzodiazepine samples, with the majority of these samples also containing Fentanyl and/or Fentanyl analogues (Figure 7). This trend varied regionally, with Quebec and the Maritimes having a lower proportion of benzodiazepine samples that contained Fentanyl and/or Fentanyl analogues compared to the rest of the country (Figure 8).
There has been a slight decrease in the proportion of opiates class substance samples that also contain Fentanyl and/or Fentanyl analogues (Figure 7), a trend observed nationwide (Figure 8).
The prevalence of co-occurrence of Fentanyl and/or Fentanyl analogues and stimulants is driven by samples from British Columbia, Alberta and Ontario. In general, Fentanyl and/or Fentanyl analogues have not frequently been identified in Cocaine samples (Figure 7) and this pattern is consistent across regions (Figure 8). Over time, there has been a slight increase in Methamphetamine samples that also contain Fentanyl and/or Fentanyl analogues, rising from 0% in 2012 to just over 4% in 2023 (Figure 7). However, this trend is region-specific, with British Columbia and Manitoba showing the greatest rise in recent years (Figure 8).
Since the emergence of nitazenes in 2019, a significant proportion of nitazene samples have been found to also contain Fentanyl and/or Fentanyl analogues (Figure 7). Regional differences are notable, with the largest proportion of nitazene samples co-occurring with Fentanyl and/or Fentanyl analogues in British Columbia and Ontario (Figure 8).
Xylazine is a non-opioid analgesic, sedative and muscle relaxant used in veterinary medicine Note de bas de page 20. Since its emergence in 2019, the majority of Xylazine samples have been found to also contain Fentanyl and/or Fentanyl analogues (>90%) (Figure 7). This is consistent across regions, with nearly all samples of Xylazine across the country containing Fentanyl and/or Fentanyl analogues (Figure 8).
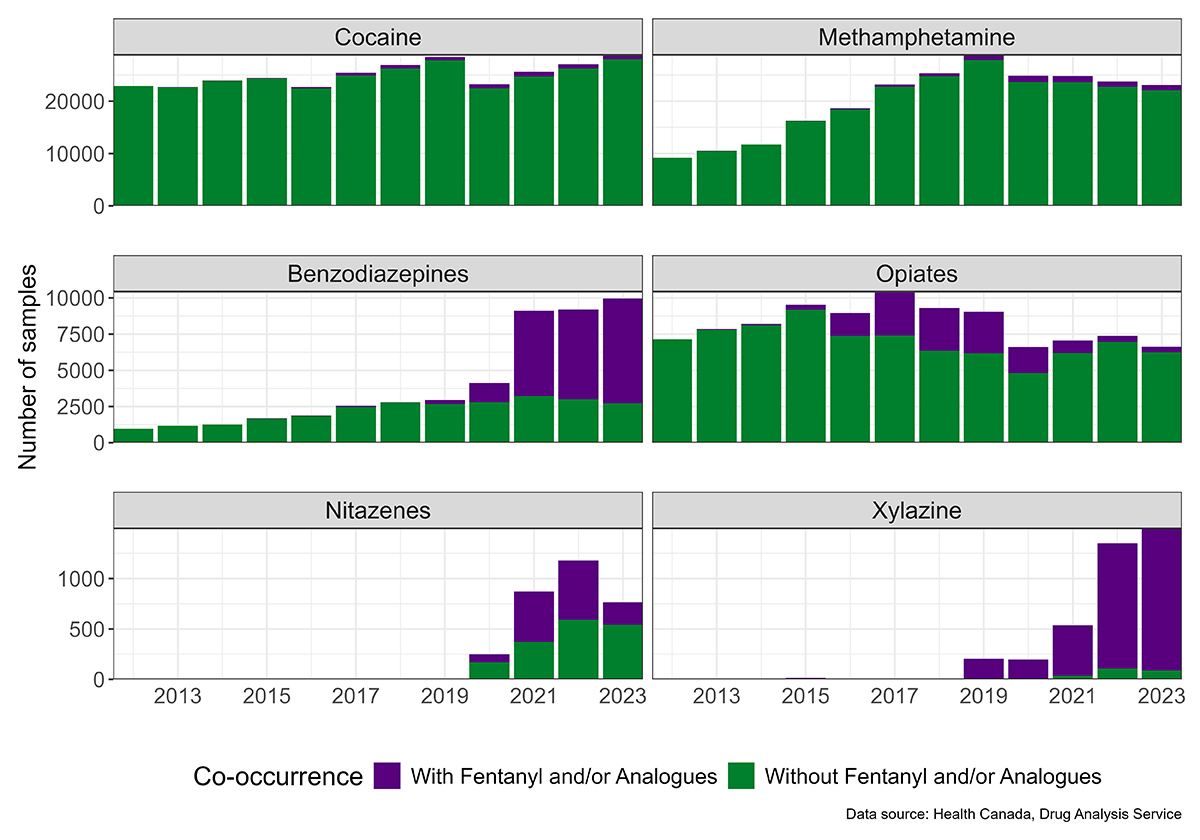
Note: Samples may contain multiple substances and other substances than those listed.
Figure 7: Text description
| Year | With Fentanyl and/or Analogues | Without Fentanyl and/or Analogues | Total |
|---|---|---|---|
| 2012 | - | 964 (100.0%) | 964 |
| 2013 | 4 (0.3%) | 1,172 (99.7%) | 1,176 |
| 2014 | - | 1,259 (100.0%) | 1,259 |
| 2015 | 33 (2.0%) | 1,663 (98.1%) | 1,696 |
| 2016 | 29 (1.6%) | 1,836 (98.5%) | 1,865 |
| 2017 | 82 (3.2%) | 2,473 (96.8%) | 2,555 |
| 2018 | 31 (1.1%) | 2,759 (98.9%) | 2,790 |
| 2019 | 284 (9.6%) | 2,661 (90.4%) | 2,945 |
| 2020 | 1,348 (32.7%) | 2,780 (67.3%) | 4,128 |
| 2021 | 5,892 (64.7%) | 3,218 (35.3%) | 9,110 |
| 2022 | 6,205 (67.4%) | 3,001 (32.6%) | 9,206 |
| 2023 | 7,240 (72.7%) | 2,722 (27.3%) | 9,962 |
| Year | With Fentanyl and/or Analogues | Without Fentanyl and/or Analogues | Total |
|---|---|---|---|
| 2012 | 5 (0.1%) | 7,145 (99.9%) | 7,150 |
| 2013 | 50 (0.6%) | 7,806 (99.4%) | 7,856 |
| 2014 | 97 (1.2%) | 8,107 (98.8%) | 8,204 |
| 2015 | 353 (3.7%) | 9,186 (96.3%) | 9,539 |
| 2016 | 1,567 (17.5%) | 7,388 (82.5%) | 8,955 |
| 2017 | 3,025 (28.9%) | 7,428 (71.1%) | 10,453 |
| 2018 | 2,959 (31.8%) | 6,354 (68.2%) | 9,313 |
| 2019 | 2,870 (31.6%) | 6,200 (68.4%) | 9,070 |
| 2020 | 1,810 (27.3%) | 4,812 (72.7%) | 6,622 |
| 2021 | 861 (12.2%) | 6,213 (87.8%) | 7,074 |
| 2022 | 416 (5.6%) | 6,974 (94.4%) | 7,390 |
| 2023 | 375 (5.6%) | 6,271 (94.4%) | 6,646 |
| Year | With Fentanyl and/or Analogues | Without Fentanyl and/or Analogues | Total |
|---|---|---|---|
| 2012 | 3 (0.0%) | 22,890 (99.9%) | 22,893 |
| 2013 | 24 (0.1%) | 22,669 (99.9%) | 22,693 |
| 2014 | 38 (0.2%) | 23,919 (99.8%) | 23,957 |
| 2015 | 78 (0.3%) | 24,329 (99.7%) | 24,407 |
| 2016 | 234 (1.0%) | 22,498 (99.0%) | 22,732 |
| 2017 | 518 (2.0%) | 24,904 (98.0%) | 25,422 |
| 2018 | 716 (2.7%) | 26,229 (97.3%) | 26,945 |
| 2019 | 655 (2.3%) | 27,802 (97.7%) | 28,457 |
| 2020 | 750 (3.2%) | 22,485 (96.8%) | 23,235 |
| 2021 | 908 (3.5%) | 24,730 (96.5%) | 25,638 |
| 2022 | 824 (3.0%) | 26,238 (97.0%) | 27,062 |
| 2023 | 651 (2.3%) | 28,035 (97.7%) | 28,686 |
| Year | With Fentanyl and/or Analogues | Without Fentanyl and/or Analogues | Total |
|---|---|---|---|
| 2012 | - | 9,185 (100.0%) | 9,185 |
| 2013 | 3 (0.0%) | 10,491 (99.9%) | 10,494 |
| 2014 | 21 (0.2%) | 11,708 (99.8%) | 11,729 |
| 2015 | 27 (0.2%) | 16,208 (99.8%) | 16,235 |
| 2016 | 191 (1.0%) | 18,451 (99.0%) | 18,642 |
| 2017 | 439 (1.9%) | 22,736 (98.1%) | 23,175 |
| 2018 | 556 (2.2%) | 24,775 (97.8%) | 25,331 |
| 2019 | 1,011 (3.5%) | 27,842 (96.5%) | 28,853 |
| 2020 | 1,175 (4.7%) | 23,678 (95.3%) | 24,853 |
| 2021 | 1,187 (4.8%) | 23,628 (95.2%) | 24,815 |
| 2022 | 1,003 (4.2%) | 22,764 (95.8%) | 23,767 |
| 2023 | 1,011 (4.4%) | 22,069 (95.6%) | 23,080 |
| Year | With Fentanyl and/or Analogues | Without Fentanyl and/or Analogues | Total |
|---|---|---|---|
| 2012 | - | - | - |
| 2013 | - | - | - |
| 2014 | - | - | - |
| 2015 | - | - | - |
| 2016 | - | - | - |
| 2017 | - | - | - |
| 2018 | - | - | - |
| 2019 | - | 8 (100.0%) | 8 |
| 2020 | 78 (31.5%) | 170 (68.6%) | 248 |
| 2021 | 500 (57.3%) | 372 (42.7%) | 872 |
| 2022 | 589 (49.9%) | 591 (50.1%) | 1,180 |
| 2023 | 225 (29.3%) | 544 (70.7%) | 769 |
| Year | With Fentanyl and/or Analogues | Without Fentanyl and/or Analogues | Total |
|---|---|---|---|
2012 |
- |
1 (100.0%) |
1 |
2013 |
- |
1 (100.0%) |
1 |
2014 |
- |
- |
- |
2015 |
14 (87.5%) |
2 (12.5%) |
16 |
2016 |
2 (22.2%) |
7 (77.8%) |
9 |
2017 |
2 (66.7%) |
1 (33.3%) |
3 |
2018 |
4 (80.0%) |
1 (20.0%) |
5 |
2019 |
205 (100.0%) |
- |
205 |
2020 |
196 (99.0%) |
2 (1.0%) |
198 |
2021 |
499 (93.1%) |
37 (6.9%) |
536 |
2022 |
1,242 (92.0%) |
108 (8.0%) |
1,350 |
2023 |
1,409 (94.1%) |
89 (5.9%) |
1,498 |
Note: Samples may contain multiple substances and other substances than those listed.
Figure 8. Samples of benzodiazepines, opiates, Cocaine, Methamphetamine, nitazenes, and Xylazine co-occurring with Fentanyl and/or Fentanyl analogues by Province/Territory
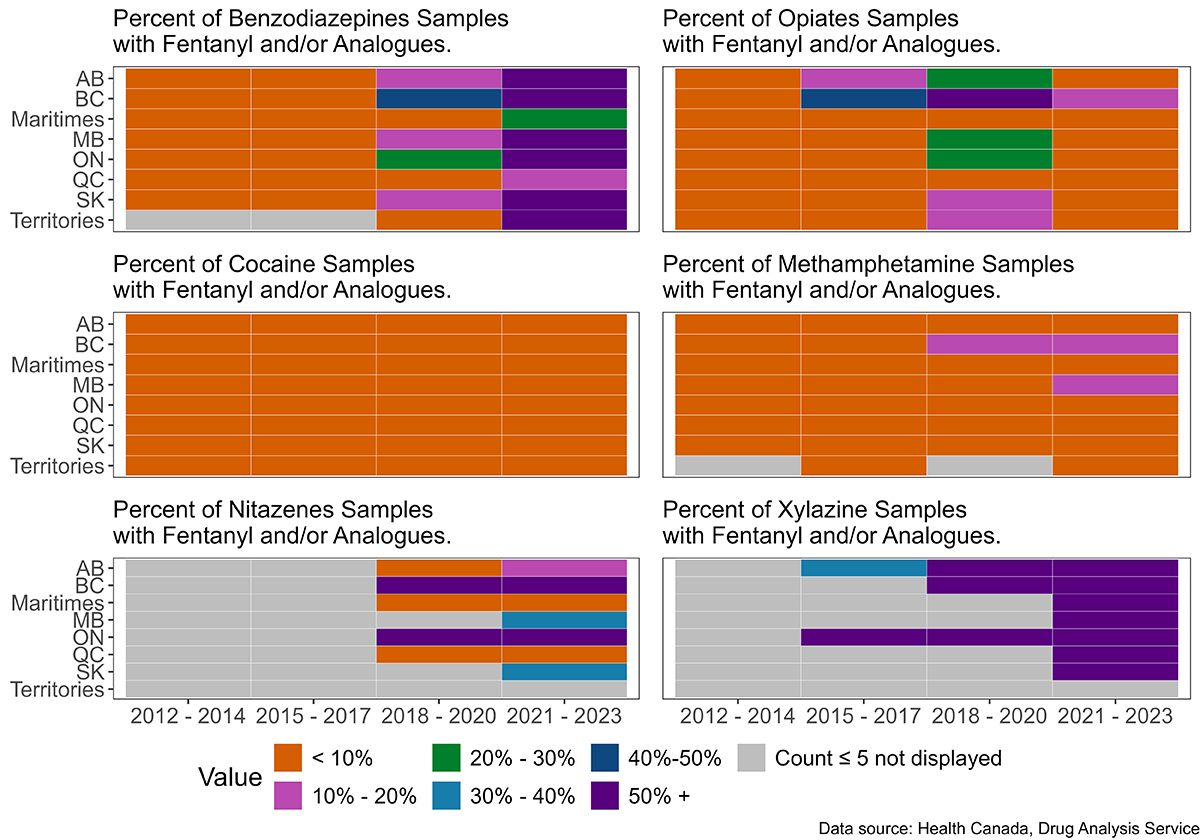
Note:
- Samples may contain multiple substances and other substances than those listed.
- Territories (Yukon, Northwest Territories and Nunavut), and the Maritimes (Newfoundland, New Brunswick, Nova Scotia and Prince Edward Island) were grouped due to low counts in these regions.
- The number of Fentanyl and/or Fentanyl analogues co-occurring with each of the six substance categories is divided by the total number of samples of each of the six substance categories by Province and time period.
Figure 8: Text description
| Province | 2012 - 2014 | 2015 - 2017 | 2018 - 2020 | 2021 - 2023 |
|---|---|---|---|---|
| Alberta | - | 3.1 | 18.1 | 84.0 |
| British Columbia | 0.9 | 5.9 | 41.7 | 81.4 |
| Manitoba | - | 2.1 | 11.9 | 69.7 |
| Maritimes | - | 2.0 | 0.7 | 20.2 |
| Ontario | - | 2.3 | 29.5 | 77.7 |
| Quebec | - | 0.7 | 2.6 | 12.6 |
| Saskatchewan | - | 1.5 | 10.3 | 64.4 |
| Territories | - | - | - | 70.6 |
| Province | 2012 - 2014 | 2015 - 2017 | 2018 - 2020 | 2021 - 2023 |
|---|---|---|---|---|
| Alberta | 0.1 | 0.6 | 1.8 | 2.2 |
| British Columbia | 0.3 | 3.9 | 6.9 | 5.8 |
| Manitoba | 0.1 | 0.9 | 3.1 | 6.3 |
| Maritimes | - | - | 0.2 | 0.9 |
| Ontario | - | 1.0 | 3.5 | 4.2 |
| Quebec | - | - | 0.2 | 0.3 |
| Saskatchewan | 0.2 | 0.2 | 0.7 | 0.5 |
| Territories | - | 0.6 | 0.5 | 1.1 |
| Province | 2012 - 2014 | 2015 - 2017 | 2018 - 2020 | 2021 - 2023 |
|---|---|---|---|---|
| Alberta | 0.2 | 1.0 | 3.4 | 5.8 |
| British Columbia | 0.2 | 6.4 | 11.7 | 10.8 |
| Manitoba | - | 1.2 | 3.9 | 12.0 |
| Maritimes | - | - | 0.2 | 1.3 |
| Ontario | - | 0.8 | 4.7 | 7.5 |
| Quebec | 0.1 | - | 0.1 | 0.1 |
| Saskatchewan | - | 0.1 | 1.0 | 0.9 |
| Territories | - | - | - | - |
| Province | 2012 - 2014 | 2015 - 2017 | 2018 - 2020 | 2021 - 2023 |
|---|---|---|---|---|
| Alberta | - | - | 6.7 | 13.0 |
| British Columbia | - | - | 64.7 | 79.2 |
| Manitoba | - | - | - | 33.3 |
| Maritimes | - | - | - | 5.1 |
| Ontario | - | - | 77.4 | 68.5 |
| Quebec | - | - | 0.8 | 9.1 |
| Saskatchewan | - | - | - | 40.0 |
| Territories | - | - | - | - |
| Province | 2012 - 2014 | 2015 - 2017 | 2018 - 2020 | 2021 - 2023 |
|---|---|---|---|---|
| Alberta | 0.5 | 12.7 | 29.1 | 7.5 |
| British Columbia | 2.1 | 43.8 | 74.1 | 12.8 |
| Manitoba | - | 6.1 | 22.6 | 5.7 |
| Maritimes | - | 0.8 | 2.0 | 1.0 |
| Ontario | 0.2 | 8.0 | 25.4 | 8.3 |
| Quebec | - | 3.6 | 3.5 | 6.0 |
| Saskatchewan | 1.9 | 5.1 | 12.3 | 7.2 |
| Territories | - | 9.5 | 17.9 | - |
| Province | 2012 - 2014 | 2015 - 2017 | 2018 - 2020 | 2021 - 2023 |
|---|---|---|---|---|
| Alberta | - | 40.0 | 99.6 | 97.8 |
| British Columbia | - | 80.0 | 100.0 | 95.1 |
| Manitoba | - | - | 100.0 | 100.0 |
| Maritimes | - | - | 100.0 | 100.0 |
| Ontario | - | 90.9 | 100.0 | 92.9 |
| Quebec | - | - | 33.3 | 71.4 |
| Saskatchewan | - | - | 100.0 | 75.0 |
| Territories | - | - | - | 100.0 |
Trends in Fentanyl co-occurrences with Fentanyl analogues
In the illicit market, substances are often deliberately added into illicit drugs to increase volume or intensify drug effects. Additionally, contaminants may also inadvertently enter during production. Thus, samples may contain various substances in uncertain amounts, raising the risk of harms for people who use drugs. Fentanyl and Fentanyl analogues consumption is therefore not always intentional or expected Note de bas de page 21. Some Fentanyl analogues are more potent than Fentanyl and are responsible for a growing number of severe and fatal opioid-related overdoses. Note de bas de page 22
The number of samples containing Fentanyl and/or its analogues analyzed has increased substantially over time (2012 – 2023), rising from a total of 217 samples in 2012, to 15,115 in 2023. Concurrently, the composition of this group of opioids has shifted. In 2023, there was a considerable decrease in instances where Fentanyl was found alone, without Fentanyl analogues within the same sample. In tandem, there was a marked increase in Fentanyl analogues in general, with many of these co-occurring with Fentanyl (Figure 9, Table 4).
Figure 9. Co-occurrence of Fentanyl with Fentanyl analogues in DAS samples by year 2012-2023
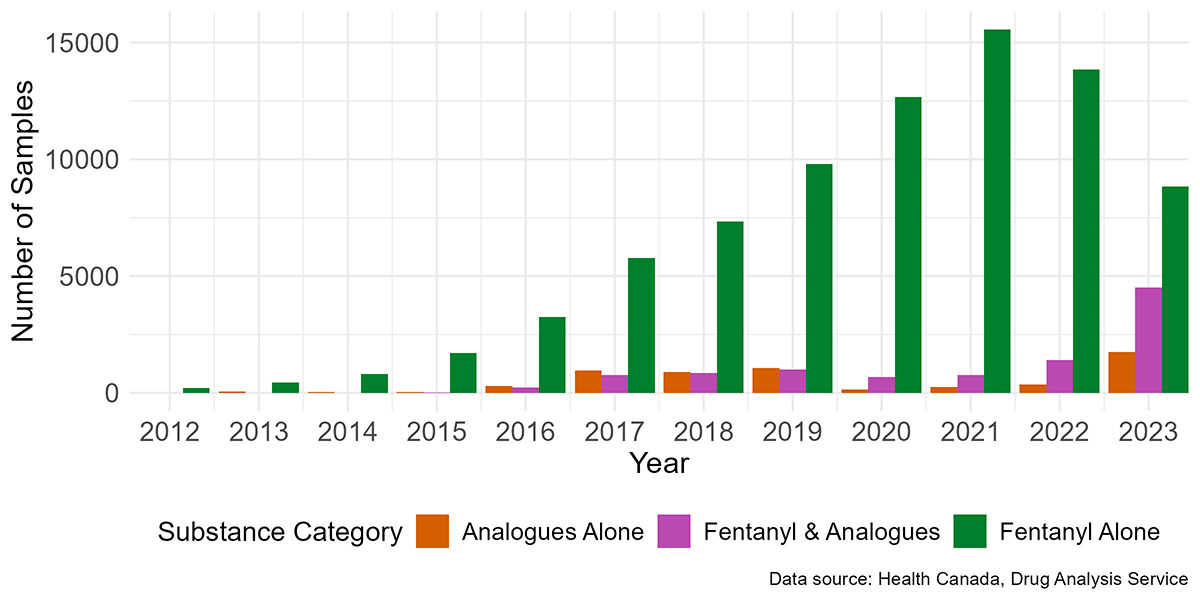
Note: Samples may contain multiple substances and other substances than those listed.
Figure 9: Text description
The data presented in this figure is available in Table 4.
| Year | Fentanyl alone | Analogues alone | Fentanyl & analogues | Total |
|---|---|---|---|---|
| 2012 | 217 | - | - | 217 |
| 2013 | 446 | 48 | - | 494 |
| 2014 | 808 | 28 | 1 | 837 |
| 2015 | 1708 | 44 | 13 | 1765 |
| 2016 | 3256 | 290 | 235 | 3781 |
| 2017 | 5770 | 966 | 768 | 7504 |
| 2018 | 7341 | 895 | 846 | 9082 |
| 2019 | 9804 | 1068 | 991 | 11863 |
| 2020 | 12673 | 138 | 676 | 13487 |
| 2021 | 15557 | 252 | 768 | 16577 |
| 2022 | 13843 | 365 | 1417 | 15625 |
| 2023 | 8837 | 1757 | 4521 | 15115 |
| Note: Samples may contain multiple substances and other substances than those listed. | ||||
Fentanyl analogues supply in Canada
Trends in this section are based on analysis results of samples submitted to the DAS by Canadian law enforcement and public health officials. Trends are represented by way of identifications (see ‘’Data analysis’’ section).
Fentanyl analogues
Many Fentanyl analogues have been synthesized since the 1960s. Due to the lack of clinical testing on humans, the relative analgesic potency of most Fentanyl analogues has been inferred from animal experiments, laboratory studies on cells, or investigations of related compounds in humans and toxicological case reports Note de bas de page 10. The main Fentanyl analogues identified by DAS between 2020 and 2022 were Acetylfentanyl, Bromofentanyl, Carfentanil, Cyclopropylfentanyl, Furanylfentanyl, Methoxyacetylfentanyl and para-Fluorofentanyl (Table 5) Note de bas de page 8.
| Fentanyl analogues | First DAS identification in Canada | General information |
|---|---|---|
| Acetylfentanyl | June 2013 Montreal, Quebec |
Studies suggest that Acetylfentanyl is less potent than Fentanyl (30% as effective) but, approximately 16 times more potent than Morphine Note de bas de page 23. Since its emergence on the illicit market, numerous reports of fatalities and overdose cases associated with Acetylfentanyl have been documented Note de bas de page 24. |
| Bromofentanyl | November 2021 Nanaimo, British Columbia |
No data available. |
| Carfentanil | July 2016 Surrey, British Columbia |
Carfentanil has been utilized as a veterinary anesthetic for large animals since 1986. It is documented to be approximately 10 000 times more potent than Morphine, and 100 times more potent than Fentanyl. Numerous reports of fatalities and overdose cases associated with Carfentanil have been reported Note de bas de page 24 Note de bas de page 22. |
| Cyclopropylfentanyl | September 2017 Surrey, British Columbia |
Limited information is available, but some studies suggest that Cyclopropylfentanyl exhibits a potency that is approximately threefold or higher than Fentanyl Note de bas de page 25. |
| Furanylfentanyl | July 2016 Surrey, British Columbia |
While there are no specific studies on its potency, Furanylfentanyl has been identified in several reports of fatalities Note de bas de page 23. |
| Methoxyacetylfentanyl | March 2018 Nanaimo, British Columbia |
Limited information is available, but some studies suggest that Methoxyacetylfentanyl has a potency that is approximately 30% of the potency of Fentanyl Note de bas de page 23. |
| para-Fluorofentanyl | February 2017 Victoria, British Columbia |
There is little information in the literature concerning its potency, but it is likely similar to Fentanyl Note de bas de page 23. |
Despite the fluctuations in the prevalence of Fentanyl analogues, Fentanyl itself continues to dominate the opioid drug supply. In 2022, Fentanyl identifications outnumbered Fentanyl analogue identifications by approximately 10 to one. Most recently, in 2023, this ratio decreased to twice the number of identifications of Fentanyl compared to Fentanyl analogues (Figure 10).
Among Fentanyl analogues, Carfentanil was the most frequently identified until 2023, where para-Fluorofentanyl became the most commonly identified by a significant margin. Carfentanil reached its peak in early 2019 (Figure 10).
Para-Fluorofentanyl was first identified by the DAS in a sample from British Columbia in February 2017. In 2021 and 2022, it emerged as the second most identified Fentanyl analogue after Carfentanil, eventually surpassing it in 2023 (Figure 10). In 2023, over 70% of samples with para-Fluorofentanyl also contained Fentanyl, and approximately 50% contained a benzodiazepine (data not shown).
Bromofentanyl was first identified by the DAS in a sample from British Columbia in November 2021. In 2022, it ranked as the third most frequently identified Fentanyl analogue. In 2023, almost all samples with Bromofentanyl also contained Fentanyl (99%) and a majority (61%) of Bromofentanyl samples contained a benzodiazepine (data not shown).
Since 2020, over 70% of sample containing at least one Fentanyl analogue also contained Fentanyl (data not shown).
Figure 10. Fentanyl and Fentanyl analogue identifications in Canada (2012 to 2023)
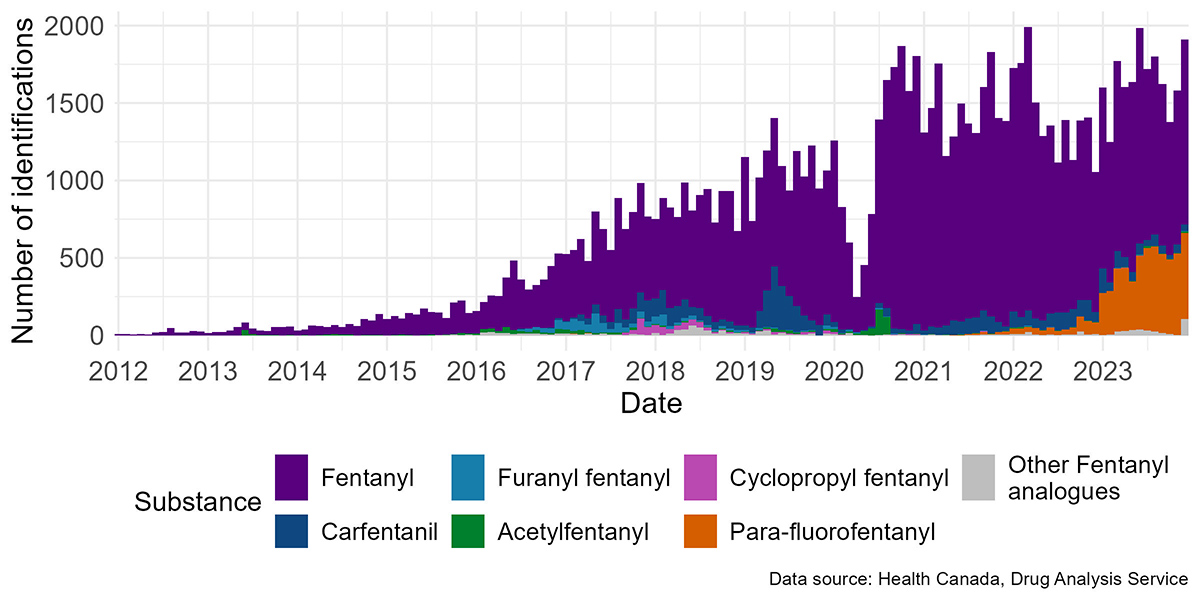
Note: Decrease of identifications in April 2020 is due to a number of factors related to the COVID-19 pandemic.
Figure 10: Text description
The data presented in this figure is available in Table 2.
Conclusion
This In Focus report provides a summary of the trends in the main opioids identified and the co-occurrences of Fentanyl with other substances including benzodiazepines, Methamphetamine, nitazenes, and Xylazine based on samples submitted to DAS in the past 12 years.
Until 2016, the opiates, which include Heroin, Morphine, Oxycodone, and Hydromorphone, were the primary opioids identified. However, in 2016, there was a shift, with Fentanyl emerging as the most frequently identified opioid. Fentanyl has continued dominating the illicit drug market since then.
Regarding the co-occurrence of Fentanyl with other substances, benzodiazepines are frequently detected alongside Fentanyl and/or Fentanyl analogues, and Xylazine is almost always found alongside Fentanyl and/or Fentanyl analogues.
Turning to the prevalence of Fentanyl analogues, Carfentanil, and para-Fluorofentanyl are the most frequently identified substances in samples analyzed by DAS. However, the number of Fentanyl identifications was approximately ten times higher than the number of Fentanyl analogue identifications in 2022. In 2023, the rise of para-Fluorofentanyl has changed this ratio significantly and is now the most commonly occurring opioid other than Fentanyl. For more specific information about Fentanyl, please refer to our report "Spotlight: The evolution of Fentanyl in Canada over the past 11 years” Note de bas de page 26.
Continued monitoring of the opioid supply in Canada is necessary to ensure accurate information is available regarding the presence of harmful substances on the Canadian illicit drug market.
Drug analysis service - Health Canada:
- Michèle Boileau-Falardeau
- Caroline Maurice-Gélinas
- Justin Dyck
- Sophie Gagnon
- Melina Thibault
- Cindy Leung Soo
- Marie-Line Gilbert
- Janike Pitre
- Benoit Archambault
References
- Footnote 1
-
Public Health Agency of Canada, "Evidence synthesis - The opioid crisis in Canada: a national perspective," Health Promotion and Chronic Disease Prevention in Canada, vol. 38, no. 6, 2018.
- Footnote 2
-
L. Hatt, "The Opioid Crisis in Canada," 6 January 2022. [Online]. Available: https://lop.parl.ca/sites/PublicWebsite/default/en_CA/ResearchPublications/202123E. [Accessed 24 03 2023].
- Footnote 3
-
Public Health Agency of Canada, "Federal, provincial, and territorial Special Advisory Committee on the Epidemic of Opioid Overdoses. Opioid- and Stimulant-related Harms in Canada.," June 2024. [Online]. Available: https://health-infobase.canada.ca/substance-related-harms/opioids-stimulants/. [Accessed 04 09 2024].
- Footnote 4
-
Wickham H, Averick M, Bryan J, Chang W, McGowan LD, François R, Grolemund G, Hayes A, Henry L, Hester J, Kuhn M, Pedersen TL, Miller E, Bache SM, Müller K, Ooms J, Robinson D, Seidel DP, Spinu V, Takahashi K, Vaughan D, Wilke C, Woo K, Yutani H, "Welcome to the tidyverse," Journal of Open Source Software, vol. 4, no. 43, p. 1686, 2019.
- Footnote 5
-
Government of Canada, "Opioids," 05 07 2022. [Online]. Available: https://www.canada.ca/en/health-canada/services/opioids.html. [Accessed 24 03 2023].
- Footnote 6
-
Government of Canada, "Naloxone," 19 12 2022. [Online]. Available: https://www.canada.ca/fr/sante-canada/services/opioides/naloxone.html. [Accessed 24 03 2023].
- Footnote 7
-
Government of Canada, "Controlled Drugs and Substances Act (S.C. 1996, c. 19)," 14 01 2023. [Online]. Available: https://laws-lois.justice.gc.ca/eng/acts/c-38.8/. [Accessed 24 03 2023].
- Footnote 8
-
Drug Analysis Service, "Analyzed Drug Report," 08 03 2023. [Online]. Available: https://health-infobase.canada.ca/drug-analysis-service/analyzed-drug-report.html?p=CA&y=2020&q=all. [Accessed 24 03 2023].
- Footnote 9
-
Gouvernement of Canada, "Fentanyl," [Online]. Available: https://www.canada.ca/en/health-canada/services/substance-use/controlled-illegal-drugs/fentanyl.html. [Accessed 21 July 2022].
- Footnote 10
-
S. H. Hassanien, J. R. Bassman, C. M. Perrien Naccarato, J. J. Twarozynski, J. R. Traynor, D. M. Iula and J. P. Anand, "In vitro pharmacology of fentanyl analogs at the human muopioid receptor and their spectroscopic analysis," Drug Testing and Analysis, vol. 12, no. 8, pp. 1212-1221, 15 May 2020.
- Footnote 11
-
V. H. Ruben Vardanyan, "Chapter 3 - Analgesics," in Synthesis of Best-Seller Drugs, Academic Press, 2016, pp. 15-64.
- Footnote 12
-
J. W. Busse, S. Craigie, D. N. Juurlink, N. D. Buckley, L. Wang, R. J. Couban, T. Agoritsas, E. A. Akl, A. Carrasco-Labra, L. Cooper, C. Cull, B. R. da Costa, J. W. Frank, G. Grant, A. Iorio, N. Persaud, S. Stern, P. Tugwell, P. O. Vandvik and G. H. Guyatt, "Guideline for opioid therapy and chronic noncancer pain," Canadian Medical Association Journal, vol. 189, no. 18, pp. 659-666, 2017.
- Footnote 13
-
C. W. Reichle, G. M. Smith, J. S. Gravenstein, S. G. Macris and H. K. Beecher, "Comparative Analgesic Potency of Heroin and Morphine in Postoperative Patients," The Journal of Pharmacology and Experimental Therapeutics, vol. 136, no. 1, pp. 43-46, 1962.
- Footnote 14
-
Government of Canada, "Heroin," 14 03 2023. [Online]. Available: https://www.canada.ca/en/health-canada/services/substance-use/controlled-illegal-drugs/heroin.html. [Accessed 24 03 2023].
- Footnote 15
-
K. Tennyson, C. Ray and K. Maass, "Fentanyl and Fentanyl Analogues: Federal Trends and Trafficking Patterns," United States Sentencing Commission, 2021.
- Footnote 16
-
Canadian Community Epidemiology Network on Drug Use, "CCENDU Drug Alert: Nitazenes," Canadian Centre on Substance Use and Addition, 2022.
- Footnote 17
-
H. E. Bird, A. S. Huhn and K. E. Dunn, "Fentanyl Absorption, Distribution, Metabolism, and Excretion: Narrative Review and Clinical Significance Related to Illicitly Manufactured Fentanyl.," Journal of Addiction Medicine, vol. 17, no. 5, pp. 503-508, 2023.
- Footnote 18
-
J. N. P. Park, K. E. Schneider, D. Fowler, S. G. Sherman, R. Mojtabai and P. S. Nestadt, "Polysubstance Overdose Deaths in the Fentanyl Era: A Latent Class Analysis.," Journal of Addiction Medicine, vol. 16, no. 1, pp. 49-55, 2022.
- Footnote 19
-
National Institute on Drug Abuse, "Benzodiazepines and Opioids," 7 November 2022. [Online]. Available: https://nida.nih.gov/research-topics/opioids/benzodiazepines-opioids#:~:text=Combining%20opioids%20and%20benzodiazepines%20can,addition%20to%20impairing%20cognitive%20functions.. [Accessed 31 March 2023].
- Footnote 20
-
National Institute on Drug Abuse, "Xylazine," June 2024. [Online]. Available: https://nida.nih.gov/research-topics/xylazine#treat-xylazine-related-wounds. [Accessed 06 09 2024].
- Footnote 21
-
D. Y. M. M.-H. B. M. C. L. P. B. J. Payer, "Adulterants, Contaminants and Co-occuring Substances in Drugs on the Illegal Market in Canada: An analysis of data from drug seizures, drug checking and urine," Canadian Centre on Substance Use and Addiction, Ottawa, 2020.
- Footnote 22
-
A. L. A. Mohr, B. K. Logan, M. F. Fogarty, A. J. Krotulski, D. Papsun, S. L. Kacinko, M. A. Huestis and J. D. Ropero-Miller, "Reports of Adverse Events Associated with Use of Novel Psychoactive Substances, 2017–2020: A Review," Journal of Analytical Toxicology, vol. 46, pp. 116-185, 2022.
- Footnote 23
-
Y. Higashikawa and S. Suzuki, "Studies on 1-(2-phenethyl)-4-(N-propionylanilino)piperidine (fentanyl) and its related compounds. VI. Structure-analgesic activity relationship for fentanyl, methyl-substituted fentanyls and other analogues," Forensic Toxicology, vol. 26, pp. 1-5, 2008.
- Footnote 24
-
M. P. Prekupec and M. H. Baumann, "Misuse of Novel Synthetic Opioids: A Deadly New Trend," Journal of Addiction Medecine, vol. 11, no. 4, pp. 256-265, 2017.
- Footnote 25
-
M. Wilde, S. Pichini, R. Pacifici, A. Tagliabracci, F. P. Busardo, V. Auwärter and R. Solimini, "Metabolic Pathways and Potencies of New Fentanyl Analogs," Frontiers in Pharmacology, vol. 10, 2019.
- Footnote 26
-
Governement of Canada, Health Canada Drug Analysis Service, "Spotlight: The evolution of Fentanyl in Canada over the past 11 years," 2023. [Online]. Available: https://www.canada.ca/en/health-canada/services/publications/healthy-living/evolution-fentanyl-canada-11-years.html.
Suggested citation
Government of Canada. (2025). Health Canada Drug Analysis Service. In Focus: The Emergence of Opioids in Canada. Longueuil (QC), 2025. Retrieved from https://www.canada.ca/en/health-canada/services/publications/healthy-living/emergence-opioids-canada.html
For more information, please contact Health Canada’s Drug Analysis Service.
© His Majesty the King in Right of Canada, as represented by the Minister of Health, 2025
Cat.: H139-87/2025E-PDF
ISBN: 978-0-660-33613-8
Pub.: 240868