
ARCHIVED - Infographic: Opioid-related harms in Canada – December 2018
Download the alternative format
(PDF format, 1.5 MB, 1 page)
Organization: Health Canada
Type: Infographic
Published: 2016-12-12
December 12, 2018
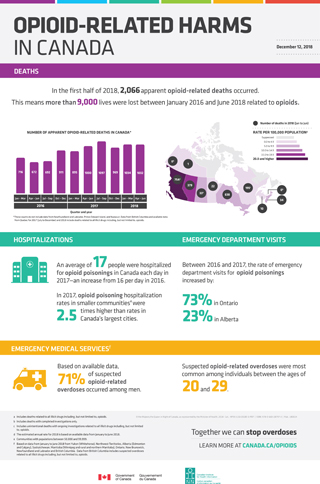
Deaths
In the first half of 2018, 2,066 apparent opioid-related deaths occurred.
This means more than 9,000 lives were lost between January 2016 and June 2018 related to opioids.
| Year and quarter | ||||||||||
|---|---|---|---|---|---|---|---|---|---|---|
| 2016 | 2017 | 2018 | ||||||||
| Jan to Mar | Apr to Jun | Jul to Sep | Oct to Dec | Jan to Mar | Apr to Jun | Jul to Sep | Oct to Dec | Jan to Mar | Apr to Jun | |
| Number of apparent opioid-related deaths in CanadaTable 1 Footnote * | 716 | 672 | 692 | 911 | 895 | 1000 | 1097 | 969 | 1034 | 1032 |
|
||||||||||
| Province or territory | Number of deaths | Rate per 100,000 populationTable 2 Footnote d |
|---|---|---|
| British ColumbiaTable 2 Footnote a | 754 | 20.0 and higher |
| Alberta | 379 | 15.0 to 19.9 |
| SaskatchewanTable 2 Footnote b | 33 | 5.0 to 9.9 |
| Manitoba | 22 | 0.0 to 4.9 |
| Ontario | 638 | 5.0 to 9.9 |
| QuebecTable 2 Footnote c | 195 | 0.0 to 4.9 |
| New Brunswick | 10 | 0.0 to 4.9 |
| Nova Scotia | 34 | 5.0 to 9.9 |
| Prince Edward IslandTable 2 Footnote b | 0 | 0.0 to 4.9 |
| Newfoundland and Labrador | Suppressed | Suppressed |
| YukonTable 2 Footnote b | 0 | 0.0 to 4.9 |
| Northwest Territories | 1 | 0.0 to 4.9 |
| Nunavut | Suppressed | Suppressed |
|
||
Hospitalizations
An average of 17 people were hospitalized for opioid poisonings in Canada each day in 2017–an increase from 16 per day in 2016.
In 2017, opioid poisoning hospitalization rates in smaller communitiesFootnote 1 were 2.5 times higher than rates in Canada's largest cities.
Emergency department visits
Between 2016 and 2017, the rate of emergency department visits for opioid poisonings increased by:
- 73% in Ontario
- 23% in Alberta
Emergency medical servicesFootnote 2
Based on available data, 71% of suspected opioid-related overdoses occurred among men.
Suspected opioid-related overdoses were most common among individuals between the ages of 20 and 29.
Notes
Together we can stop overdoses
Learn more at Canada.ca/Opioids
Footnotes
- Footnote 1
-
Communities with populations between 50,000 and 99,999.
- Footnote 2
-
Based on data from January to June 2018 from Yukon (Whitehorse), Northwest Territories, Alberta (Edmonton and Calgary), Saskatchewan, Manitoba (Winnipeg and rural and northern Manitoba), Ontario, New Brunswick, Newfoundland and Labrador and British Columbia. Data from British Columbia includes suspected overdoses related to all illicit drugs including, but not limited to, opioids.