
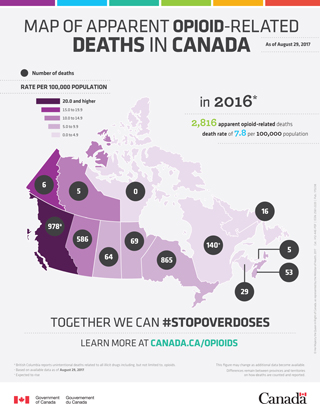
Map: Apparent opioid-related deaths in Canada (August 29, 2017)
In 2016Footnote *
- 2,816 apparent opioid-related deaths
- Death rate of 7.8 per 100,000 population
| Province/territory | Rate range per 100,000 population in 2016 | Number of deaths |
|---|---|---|
| Alberta | 10.0 to 14.9 | 586 |
| British ColumbiaFootnote a | 20.0 and higher | 978Footnote a |
| New Brunswick | 0 to 4.9 | 29 |
| Newfoundland and Labrador | 0 to 4.9 | 16 |
| Northwest Territories | 10.0 to 14.9 | 5 |
| Nova Scotia | 5.0 to 9.9 | 53 |
| Nunavut | 0 to 4.9 | 0 |
| Ontario | 5.0 to 9.9 | 865 |
| QuebecFootnote + | 0.0 to 4.9 | 140Footnote + |
| Manitoba | 5.0 to 9.9 | 69 |
| Saskatchewan | 5.0 to 9.9 | 64 |
| Prince Edward Island | 0.0 to 4.9 | 5 |
| Yukon | 15.0 to 19.9 | 6 |
Together we can #stopoverdoses
Learn more at Canada.ca/opioids
This figure may change as more updated data become available.
Differences remain between provinces and territories on how deaths are counted and reported.
Footnotes
- Footnote 1
British Columbia reports unintentional deaths related to all illicit drugs including, but not limited to, opioids.
- Footnote 2
Based on available data as of August 29, 2017
- Footnote 3
Expected to rise
Download the alternative format
(PDF format, 1.06 MB, 1 pages)
Organization: Health Canada
Type: Poster
Published: 2017-09-14
Related Topics
Page details
- Date modified: