
Traffic-Related Air Pollution: Asthma, Allergies, and Lung Function Assessment
Acknowledgements
This risk assessment was reviewed by the following external scientific experts:
- Elaine Fuertes, M.Sc., Ph.D. (Imperial College London)
- Zhiwei Gao, M.Sc., MD, Ph.D. (Memorial University of Newfoundland)
Table of contents
- Acknowledgements.
- List of tables
- List of figures
- List of abbreviations
- Executive summary
- Chapter 1. Introduction
- Chapter 2. Methodology
- Chapter 3. Umbrella review
- Chapter 4. Risk characterization and evaluation of causality
- Conclusion
- Key uncertainties and gaps
- References
- Appendices
- Appendix A. Refined search strategy for literature update
- Appendix B. Study quality assessment table using the AMSTAR 2 rating instrument adapted to environmental epidemiology studies
- Appendix C. List of cited studies across the reviews included in this assessment
- Appendix D. Summary table of the primary reviews considered in the umbrella review
List of tables
- Table 1.1 Summary of health outcomes and classification of causal associations from the HEI review (HEI Panel on the Health Effects of Traffic-Related Air Pollution 2010)
- Table 2.1 Critical domains of the AMSTAR 2 rating instrument adapted for environmental epidemiology studies
- Table 2.2 Weight of evidence for determination of causality (derived from US EPA 2015)
- Table 3.1 Random-effects meta-analyses between TRAP pollutants and asthma development in children from birth to 18 years old as reported in Khreis et al. (2017)
- Table 3.2 Random-effects meta-analyses between TRAP pollutants and asthma incidence and wheeze prevalence in children and adolescents as reported in Heinrich et al. (2016)
- Table 4.1 Pooled estimates of allergic outcomes in children reported by Heinrich et al. (2016) and Bowatte et al. (2015)
List of figures
- Figure 2.1 Study selection process for the scoping review and the umbrella review
- Figure 4.1 Forest plot of pooled ORs from SR-MAs for asthma incidence and asthma prevalence in childhood standardized to an increment of 10 µg/m3 of NO2; n represents the number of studies included in the meta-analysis, and I2 represents the heterogeneity
- Figure 4.2 Forest plot of pooled ORs from SR-MAs for asthma incidence and asthma prevalence in childhood standardized to an increment of 1 µg/m3 of PM2.5; n represents the number of studies included in the meta-analysis, and I2 represents the heterogeneity
- Figure 4.3 Forest plot of pooled ORs from SR-MAs for asthma incidence in childhood standardized to an increment of 0.5 × 10⁻⁵/m of BC; n represents the number of studies included in the meta-analysis, and I2 represents the heterogeneity
- Figure 4.4 Forest plot of pooled ORs from SR-MAs for asthma incidence and asthma prevalence in childhood standardized to an increment of 2 µg/m3 PM10; n represents the number of studies included in the meta-analysis and I2 represents the heterogeneity
List of abbreviations
- AHR
- airway hyperresponsiveness
- AMSTAR 2
- A Measurement Tool of Assess Systematic Reviews
- BAMSE
- Barn Allergi Miljö Stockholm Epidemiologi
- BC
- black carbon
- CAP
- concentrated ambient particle
- CCAAPS
- Cincinnati Childhood Allergy and Air Pollution Study
- CCCEH
- Columbia Center for Children's Environmental Health
- CI
- confidence interval
- CO
- carbon monoxide
- COPD
- chronic obstructive pulmonary disease
- COPSAC
- Copenhagen Prospective Study on Asthma in Childhood
- DALY
- disability-adjusted life year
- DE
- diesel exhaust
- DEP
- diesel exhaust particles
- ECHRS
- European Community Respiratory Health Survey
- ESCAPE
- European Study of Cohorts for Air Pollution Effects
- FEF25–75
- forced expiratory flow between the 25th and 75th percentile of forced vital capacity
- FEV1
- forced expiratory volume in 1 second
- FLEHS
- Flemish Environment and Health Survey
- FVC
- forced vital capacity
- GBD
- Global Burden of Disease Study
- GE
- gasoline exhaust
- GEP
- gasoline exhaust particles
- GINI
- German Infant Nutrition Intervention Programme
- GIS
- geographic information system
- GSTP1
- glutathione S-transferase P1
- HEI
- Health Effects Institute
- IgE
- immunoglobulin E
- ISA
- Integrated Science Assessment
- LISA
- Lifestyle Related Factors on the Human Immune System and Development of Allergies in Children
- LUR
- land-use regression
- MMEF
- maximal mid-expiratory flow
- NO
- nitrogen oxide
- NO2
- nitrogen dioxide
- NOx
- nitrogen oxides
- O3
- ozone
- OR
- odds ratio
- PAH
- polycyclic aromatic hydrocarbon
- PEF
- peak expiratory flow
- PIAMA
- Prevention and Incidence of Asthma and Mite Allergy
- PM
- particulate matter
- PM2.5
- particulate matter with a diameter less than 2.5 micrometres
- PM10
- particulate matter with a diameter less than 10 micrometres
- RAW
- airway resistance
- RoB
- risk of bias
- ROS
- reactive oxygen species
- SES
- socioeconomic status
- SO2
- sulphur dioxide
- sRAW
- specific airway resistance
- SR-MA
- systematic review–meta-analysis
- STROBE
- Strengthening the Reporting of Observational Studies in Epidemiology
- TNF
- tumour necrosis factor
- TRAP
- traffic-related air pollution
- UFP
- ultrafine particle
- US EPA
- United States Environmental Protection Agency
Executive summary
Traffic, a major source of air pollutants, is a global issue. In urban areas of the world, including in Canada, the impacts of traffic are of particular concern. The mixture of vehicle exhausts, secondary air pollutants formed in the atmosphere, evaporative emissions from vehicles, and non-combustion emissions (e.g., road dust and tire wear) is referred to as traffic-related air pollution (TRAP). Key TRAP species include nitrogen dioxide (NO2), particulate matter with a diameter less than 2.5 micrometres (PM2.5) and less than 10 micrometres (PM10), and black carbon (BC). Of these, NO2 is considered to be the most direct measure of TRAP, since local traffic sources have been reported to contribute up to 80% of ambient NO2.
The objective of this risk assessment is to evaluate the association of asthma, allergy, and lung function with TRAP exposure in order to inform and support programs and policies designed to mitigate exposure to, and health impacts of, TRAP in Canada. TRAP best represents the real-world pollutant mixture that many Canadians are exposed to on a daily basis. An estimated 10 million people in Canada, which is almost 1/3 of the total population, live in elevated TRAP exposure zones (i.e., within 500 m of highways or 100 m of major urban roads). In addition, urban Canadians spend on average an hour or more of daily time in microenvironments influenced by moderate to heavy traffic, including travelling in a vehicle or being engaged in active transportation (e.g., walking, cycling).
An umbrella review approach was used to systematically search, organize, and evaluate existing epidemiological evidence from multiple systematic reviews or selected other reviews, including reviews with quantitative synthesis, on the impact of TRAP exposure on asthma, allergy, and lung function. For this risk assessment, 17 publications were reviewed and evaluated. The evidence synthesis also included mechanistic evidence gathered from a review of existing assessment documents for components of TRAP. Together, the umbrella review and the review of the experimental evidence were conducted to support a weight of evidence approach to determine the causal role of TRAP exposure on asthma, allergy, and lung function.
Based on a weight of evidence approach, it is concluded that the evidence supports a causal relationship between TRAP exposure and asthma incidence (i.e., diagnosis of cases) and asthma prevalence (i.e., existing cases) in children. Additionally, the weight of evidence indicates that the relationship between TRAP exposure and asthma prevalence in adults is suggestive of, but not sufficient to infer, a causal relationship. However, there is inadequate evidence to infer a causal association between TRAP exposure and asthma incidence in adults. The weight of evidence also indicates that the relationship between TRAP exposure and allergic sensitization and allergic responses is suggestive of, but not sufficient to infer, a causal relationship, and that the relationship between TRAP exposure and lung function is likely to be causal.
Chapter 1. Introduction
1.1 Background
Air pollution is a global health concern. For 2017, the Global Burden of Disease Study (GBD) estimated that over 4.9 million deaths and 147 million disability-adjusted life years (DALYs) globally were attributable to air pollution (GBD Risk Factor Collaborators 2018). Additionally, of the 84 risk factors considered in the GBD, ambient particulate matter (PM) was the only environmental risk factor in the top 10 risks. Using a methodology similar to the GBD, Health Canada has estimated that 14,600 premature deaths per year in Canada are linked to air pollution from particulate matter with a diameter less than 2.5 micrometres (PM2.5), nitrogen dioxide (NO2), and ozone (O3) (Health Canada 2019).
Around the world, traffic is a major source of air pollutants, especially in urban areas. The mixture of vehicle exhausts, secondary air pollutants formed in the atmosphere, evaporative emissions from vehicles, and non-combustion emissions (e.g., road dust and tire wear) is referred to as traffic-related air pollution (TRAP). In addition to its ubiquitous nature and predominance in urban areas, TRAP's high spatial and temporal variability render it a particularly challenging exposure to study (Khreis and Nieuwenhuijsen 2017). Most of the TRAP literature has focused on NO2, PM2.5, particulate matter with a diameter less than 10 micrometres (PM10), and black carbon (BC) as important TRAP pollutants. Nitrogen dioxide is considered to be the most direct measure of TRAP, since local traffic sources have been reported to contribute up to 80% of ambient NO2, while the traffic-attributable contributions to ambient PM2.5 and PM10 are much lower, at 9% to 66% and 9% to 53%, respectively (reviewed in Khreis and Nieuwenhuijsen 2017). Black carbon is considered a marker for diesel vehicle traffic (Richmond-Bryant et al. 2009). In 2010, the Health Effects Institute (HEI) published a critical review of the literature on emissions, exposure, and health effects of TRAP (HEI Panel on the Health Effects of Traffic-Related Air Pollution 2010). With respect to health effects, the epidemiological literature was evaluated to infer the presence of causal associations between TRAP exposure and health outcomes. In support of that evaluation, the toxicological literature was reviewed to identify any mechanism(s) for the purposes of understanding the role of traffic emissions in the effects observed in the epidemiological studies. The HEI review classified the causal associations between exposure to TRAP and a number of health outcomes (Table 1.1). Since the publication of the HEI review, TRAP has remained an active area of research interest in environmental health research. To this end, Health Canada will publish several reports characterizing and evaluating exposure to TRAP, health effects of TRAP exposure, and the associated health impacts for the Canadian context. This current report focuses on select health effects associated with TRAP exposure.
| Health outcome | Classification of causal association |
|---|---|
| Mortality and morbidity | |
| All-cause and cardiovascular mortality | Suggestive but not sufficient |
| Cardiovascular morbidity | Suggestive but not sufficient |
| Asthma and respiratory (children) | |
| Asthma incidence and prevalence | Sufficient, or suggestive but not sufficient |
| Exacerbations of symptoms with asthma | Sufficient |
| Exacerbations of symptoms without asthma | Inadequate and insufficient |
| Health care utilization | Inadequate and insufficient |
| Asthma and respiratory (adults) | |
| Adult-onset asthma | Inadequate and insufficient |
| Respiratory symptom | Suggestive but not sufficient |
| Respiratory | |
| Pulmonary function (all ages) | Suggestive but not sufficient |
| Chronic obstructive pulmonary disease | Inadequate and insufficient |
| Allergy | Inadequate and insufficient |
| Other health outcomes | |
| Birth outcomes | Inadequate and insufficient |
| Cancer (not related to occupational exposure to diesel exhaust) | Inadequate and insufficient |
| |
Health Canada conducted human health risk assessments of diesel exhaust (DE) (Health Canada 2016a) and gasoline exhaust (GE) (Health Canada 2017). These risk assessments identified considerable Canadian population health impacts associated with the incremental contribution to ambient criteria air contaminant concentrations resulting from emissions from on-road diesel and gasoline vehicles. In addition, Health Canada evaluated the weight of evidence that the mixture of DE and the mixture of GE are causal in the development of adverse health outcomes. Among the final conclusions of the DE assessment, it was concluded that DE causes acute respiratory effects and lung cancer and is likely to cause chronic respiratory effects, immunological effects, and acute cardiovascular effects. From the GE assessment, it was also determined that the evidence was suggestive of a causal relationship between exposure to the GE mixture and respiratory effects but was inadequate to infer a causal relationship for immunological and other health effects.
Examination of the health effects of DE and GE using epidemiological study designs has been limited by the fact that populations are generally co-exposed to both GE and DE and that unique exposure surrogates for these mixtures have not been identified, complicating the exposure assessment. However, extensive epidemiological research has been conducted to elucidate the health effects of all on-road vehicle emissions (i.e., TRAP), which represent the real-world pollutant mixture that Canadians are exposed to on a daily basis. An estimated 10 million people, which is almost 1/3 of the total population, live within 500 m of highways or 100 m of major urban roads (Brauer et al. 2013). Additionally, urban Canadians spend an estimated 4% to 7% of their daily time in microenvironments influenced by moderate to heavy traffic, including travelling in a vehicle or being engaged in active transportation (Matz et al. 2018).
Building on the fuel-specific human health risk assessments for DE and GE, this risk assessment investigates the association between TRAP exposure and asthma, allergy, and lung function. These focused health endpoints have been evaluated and reported in the scientific literature in association with exposure to air pollution, including TRAP or its components. Asthma is an umbrella diagnosis used to describe several airway diseases that manifest with symptoms of wheezing, shortness of breath, coughing, and chest tightness and are associated with obstructions in airflow (reviewed in Kuruvilla et al. 2019). Two major phenotypes of asthma are atopic (or extrinsic) asthma and non-atopic (or intrinsic) asthma. Atopic asthma is most prevalent as early-onset allergic asthma during childhood and young adulthood, while non-atopic asthma is predominant in older age groups. Early-onset allergic asthma may be mild to severe and is distinguished by the presence of elevated serum-specific immunoglobulin E (IgE). Serum IgE is used as a marker of atopy, since specific IgEs are developed in response to allergen exposure. This process of developing allergen-specific IgEs is referred to as allergic sensitization. After sensitization, subsequent encounters with an allergen induce an allergic response. This hypersensitivity response is mediated through allergen-specific IgE activation of mast cells and basophils, leading to a cascade of cellular responses that manifests as an allergic response (reviewed in Kuruvilla et al. 2019 and Reber et al. 2017). The progression of allergic conditions over the course of infancy and childhood is referred to as the atopic march (reviewed in Hill and Spergel 2018). These conditions, beginning with atopic dermatitis and progressing to food allergy, asthma, and allergic rhinitis, have common genetic and environmental factors for predisposition. Notably, the development of one of the allergic conditions increases the risk of development of the others. Lung function was also considered in this risk assessment, since measures of lung function are key indicators of respiratory health and are used in clinical settings for the diagnosis and monitoring of respiratory diseases, including asthma (reviewed in Liang et al. 2012).
1.2 Approach and objectives
For this risk assessment, an umbrella review approach was taken. Umbrella reviews systematically search, organize, and evaluate existing evidence from multiple systematic reviews,Footnote 1 with or without meta-analysesFootnote 2 (Aromataris et al. 2015). The most characteristic feature of umbrella reviews is that this type of evidence synthesis considers only the highest level of evidence for inclusion. Specifically, published systematic reviews with or without meta-analyses are the unit of analytical review in an umbrella review. This approach allows for a rapid review of the overall evidence base and highlights the consistency or contradictions within it. An umbrella review is ideal for assessing whether systematic reviews addressing similar questions independently make similar observations and reach generally similar conclusions. Importantly, the objective of an umbrella review is not to repeat the process of identifying, evaluating, and synthesizing the primary studies included in the systematic reviews with or without meta-analyses that make up the umbrella review. Rather, the objective is to provide a summary of the existing research syntheses to develop an overall interpretation of a broad topic area.
For this umbrella review–based risk assessment, systematic reviews, systematic review–meta-analyses (SR-MAs), and selected other reviews (i.e., a comprehensive review of the literature) were included. While these selected other reviews were not conducted as systematic reviews, they nonetheless provided a comprehensive overview of the research findings for the purpose of determining the existence of a causal relationship between exposure and health effect and were therefore considered informative for this risk assessment.
The objective of this risk assessment is to use an umbrella review approach to evaluate the associations between exposure to TRAP and asthma, allergies, and lung function based on reviews of the epidemiological literature. From this evaluation, a weight of evidence approach was used to determine the causal role of TRAP in the health outcome endpoints of asthma, allergies, and lung function. Furthermore, mechanistic evidence gathered from a review of existing risk assessment documents for components of TRAP was considered so as to assess the biological plausibility of the associations identified in the umbrella review and to support the determination of causality.
Chapter 2. Methodology
In this chapter, the methodology undertaken for this risk assessment is described in detail. Section 2.1 outlines the scoping review process utilized to identify the relevant epidemiological literature relating to TRAP exposure. Section 2.2 details the process used to appraise the quality of the review articles. Section 2.3 describes how the experimental evidence related to TRAP and the health endpoints of interest was used to assess the biological plausibility and identifies the sources of this evidence. Lastly, Section 2.4 presents the criteria used to determine the level of causality in the weight of evidence approach.
2.1 Scoping review
As a first step, a scoping reviewFootnote 3 of the epidemiological literature on the human health effects of TRAP was conducted (Matz et al. 2019). The primary research question for this scoping review was as follows: What is the current body of scientific literature regarding the association between TRAP exposure and adverse human health endpoints, including effects in various systems: respiratory, cardiovascular, immunological, reproductive/developmental, and nervous, as well as other health endpoints such as cancer and mortality? The scoping review included primary epidemiological research articles and some review types (as described below) that were published in peer-reviewed journals and address the scoping review objectives. The observational study designs that were included were case-control, cohort, cross-sectional, panel, ecological, time-series, and case-crossover designs. Experimental studies were included only if human subjects were involved in the study (i.e., controlled human exposure studies). Review types included in the scoping review were systematic reviews, meta-analyses, scoping reviews, and selected other reviews that included an evaluation of causal association. With respect to TRAP and traffic exposure metrics, the inclusion criteria were adapted from the critical review of TRAP by the HEI Panel on the Health Effects of Traffic-Related Air Pollution (2010). These criteria allowed the reviewers to identify the studies that were TRAP- or traffic-centric from a larger body of general air pollution studies. Exposure metrics meeting the inclusion criteria included distance to roadways; measures of traffic density; modelling (e.g., land-use regression [LUR] and dispersion) that estimated traffic-specific exposure; traffic-based source apportionment; occupations characterized by traffic exposure (e.g., taxi drivers and truckers); subjects in locations characterized by level of traffic exposure (e.g., high- vs. low-exposure sites); and monitoring of TRAP-related pollutants (e.g., NO2 and BC) when the measurements could be reasonably related to traffic sources (e.g., roadway-specific monitoring).
The literature searches were conducted by a Health Canada librarian in two databases, Ovid Embase and Ovid MEDLINE, and covered the period from January 1, 2000 to April 4, 2018. The detailed search strategy and inclusion criteria are described in Matz et al. (2019). The references identified from the literature search were screened independently by two reviewers for eligibility, first by title and abstract and then by full text; disagreements were resolved by a consensus approach. To generate the evidence map, data extraction included study design parameters and human health outcomes. Descriptive summary tables were developed to provide a high-level summary of the number and types of articles evaluating the different types of health effects and cross-tabulations by study design parameters. The entire review process was managed using DistillerSR (Evidence Partners, Ottawa, ON).
From the scoping review, the association between TRAP exposure and asthma was identified as a candidate for an umbrella review–based assessment. Specifically, for asthma, four SR-MAs, seven systematic reviews, and two selected other reviews that included an evaluation of causal association were identified. Allergy and lung function were also included in the umbrella review–based assessment, owing to the related nature of these health endpoints with asthma, and the scoping review identified a literature base to support this approach. Specifically, the scoping review identified one SR-MA and two systematic reviews for allergy and one SR-MA and four systematic reviews for lung function. For the purposes of this assessment, a literature update using a refined search strategy that limited the scope of the studies to asthma, allergies, and lung function was conducted on October 30, 2018; this refined search strategy is provided in Appendix A. No new review articles meeting the inclusion criteria were identified as a result of the updated literature search.
The study selection process is depicted in Figure 2.1.
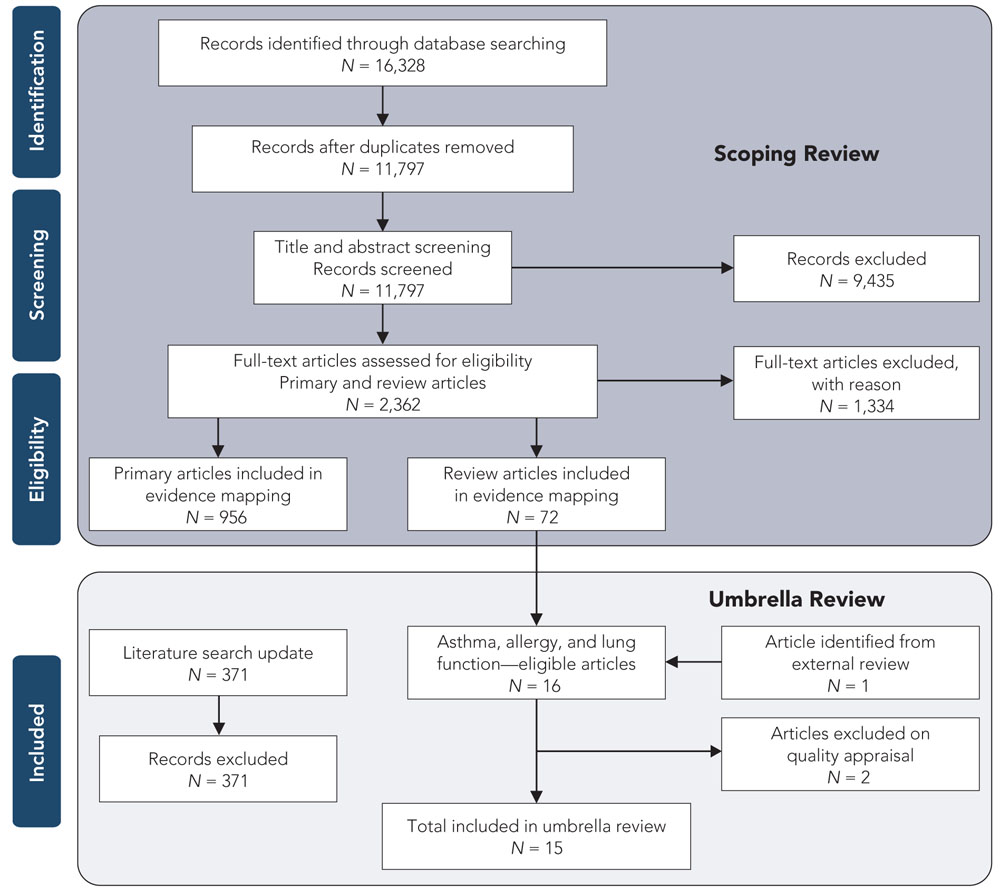
Figure 2.1 Study selection process for the scoping review and the umbrella review
Text description
Figure 2.1 depicts the flow of information through the different phases of a systematic review and maps out the number of records identified, included and excluded, and the reasons for exclusions. For the scoping review: 16,328 records were identified through database searching, of which 11,797 records remained after the duplicates were removed. 11,797 records were then screened for title and abstract screening, at which point 9,435 records were excluded and the full-text of 2,362 primary and review articles were assessed for eligibility. Of these full-text articles, 1,334 were excluded with reason leaving 956 primary articles and 72 review articles in the evidence map. For the umbrella review: 16 of the 72 review articles were eligible for asthma, allergy and lung function, 1 article was identified from external review. Two articles were excluded on quality appraisal leaving 15 articles in the umbrella review. Each of the 371 records identified during the literature search update were excluded.
2.2 Appraisal of review quality
The methodological quality of each of the SR-MAs, systematic reviews, and selected other reviews identified during the scoping review was appraised using the revised A Measurement Tool to Assess Systematic Reviews (AMSTAR 2) rating instrument (Shea et al. 2017). This critical appraisal tool for systematic reviews was developed to enable the appraisal of systematic reviews of randomized and non-randomized studies of health care interventions. Although the tool includes 16 domains for the assessment of reviews, it is not designed to generate an overall score. It is recommended that users of the tool identify critical domains that determine the validity of a review and the confidence that can be placed in it. Using an overall-score approach may disguise flaws and weaknesses in the critical domains.
For this umbrella review–based risk assessment, the AMSTAR 2 tool was evaluated to identify the most relevant and applicable critical domains for environmental epidemiology studies. A total of eight critical domains were identified (see Table 2.1): five domains were applicable to all reviews, and an additional three domains were applicable to quantitative syntheses only. Each review was evaluated with respect to the critical domains, and scoring the critical domains was considered a reasonable means to determine review quality. Each item was given a score of 1 if the specific criterion was met, a partial score of 0.5 if not all aspects of the criterion were met, or a score of 0 if the criterion was not met, was unclear, or was not applicable. Thus, the higher the score, the fewer the critical flaws or weaknesses that are present in the review impacting the validity of the review and the confidence that can be placed in it. The scoring was used to identify reviews with low scores (i.e., critical weaknesses and flaws were noted in a majority of the critical domains, resulting in low confidence in and low validity of the review); these low-quality reviews were then excluded from consideration in the umbrella review. The umbrella review entails a full evaluation of all included reviews. Since three of the eight questions pertained to meta-analyses only, the SR-MAs were evaluated based on a maximum score of eight, while the systematic reviews without meta-analysis and the selected other reviews were evaluated based on a maximum score of five. The included reviews were assessed independently by two evaluators; disagreements were resolved by a consensus approach. Review quality was characterized as low, medium, or high based on the score from the evaluation of the critical domains (see Appendix B for more information).
Table 2.1 Critical domains of the AMSTAR 2 rating instrument adapted for environmental epidemiology studies
AMSTAR 2 critical domains most relevant for environmental epidemiology studies
- Did the review authors use a comprehensive literature search strategy?
- Did the review authors describe the included studies in adequate detail?
- Did the review authors use a satisfactory technique for appraising study quality or assessing the Risk of Bias (RoB) in individual studies included in the review?
- Did the review authors account for study quality or RoB in the individual studies when interpreting/discussing the results of the review?
- Did the review authors provide a satisfactory explanation for, and discussion of, any heterogeneity observed in the results of the review?
- If meta-analysis was performed, did the review authors use appropriate methods for statistical combination of results?
- If meta-analysis was performed, did the review authors assess the potential impact of study quality or RoB in individual studies on the results of the meta-analysis or other evidence synthesis?
- If they performed a quantitative synthesis, did the review authors carry out an adequate investigation of publication bias (small-study bias) and discuss its likely impact on the results of the review?
2.3 Experimental evidence
In order to evaluate the experimental evidence, as well as to assess the biological plausibility of the associations identified as part of the umbrella review, a review of assessments from internationally recognized organizations, including Health Canada, the HEI, and the United States Environmental Protection Agency (US EPA), was conducted. The experimental sections of the assessments, which consist of a review of controlled human exposure studies, experimental animal studies, and in vitro studies, were reviewed for their analysis of the associations between TRAP exposure and asthma, allergy, and lung function. Due to the nature of the study designs in question (e.g., specific exposure concentrations and durations), these experimental studies considered exposures of specific TRAP components (i.e., NO2 and PM) and mixtures known to contribute to TRAP (i.e., DE and GE). Although many of these studies considered short-term exposure periods, the biological responses observed are informative in that they provide mechanistic insight into possible pathways that can lead to the effects observed in the long-term epidemiology studies. Specifically, Health Canada's human health risk assessments of DE (2016a), GE (2017), NO2 (2016b), and PM (2013) were reviewed. Similar to the present assessment, the critical review of TRAP by the HEI (HEI Panel on the Health Effects of Traffic-Related Air Pollution 2010) also considered specific TRAP components and mixtures and was included in this review. From the US EPA, the Integrated Science Assessments (ISAs) of NO2 (2016) and PM (2009) were reviewed; the PM assessment also considered studies of DE as a source of PM.
2.4 Determination of causality
In combination with the quality appraisal of the review articles, the quantitative syntheses from the SR-MAs were considered to provide the highest level of evidence, while the qualitative syntheses from the systematic and selected other reviews provided support in the evidence base for the determination of causality. The experimental evidence was used to support the associations observed in the epidemiological literature as well as to support a determination of causality.
In the weight of evidence approach used in this assessment to determine the causal role of air pollutants in the development of specific health effects, consideration is given to the criteria of causal inference developed by Bradford Hill (1965). The criteria, widely used in reviews of epidemiological literature and considered collectively in the weight of evidence evaluation, are as follows:
- Biological plausibility: there is a plausible mechanism between the exposure and the effect;
- Temporal sequence: the exposure precedes the health outcome;
- Consistency of the association: the association is reported by different researchers, for different study designs, in different populations, etc.;
- Coherence: evidence from toxicological studies, controlled human exposure studies, and epidemiological studies of various types provides support for the effects observed and potential modes of action;
- Biological gradient: there is evidence of an exposure–response relationship;
- Strength of the association: the greater the magnitude of the risk estimate, the less likely that the relationship is due to uncontrolled residual confounding; and
- Robustness of the association: the associations are robust to model specifications and adjustment for potential confounders such as weather, temporal trends, and co-occurring pollutants.
These criteria are used to inform a conclusion as to whether the relationship between TRAP exposure and a health effect is causal, likely to be causal, suggestive of a causal relationship, inadequate to infer a causal relationship, or not likely to be causal. The definitions of each of these determinations of causality are derived from the US EPA (2015) and are provided in Table 2.2. Health Canada has previously used this causality framework in the risk assessments of DE (2016a), NO2 (2016b), and GE (2017), which were based largely on evaluations of the primary literature. For this umbrella review–based assessment, the causality framework was applied while recognizing that each review publication (i.e., the unit of analysis of an umbrella review) represented a synthesis of multiple primary studies.
| Relationship | Description |
|---|---|
| Causal relationship | Evidence is sufficient to conclude that there is a causal relationship with relevant pollutant exposures (e.g., doses or exposures generally within one to two orders of magnitude of recent concentrations). That is, the pollutant has been shown to result in health effects in studies in which chance, confounding, and other biases could be ruled out with reasonable confidence. For example: (1) controlled human exposure studies that demonstrate consistent effects, or (2) observational studies that cannot be explained by plausible alternatives or that are supported by other lines of evidence (e.g., animal studies or mode of action information). Generally, the determination is based on multiple high-quality studies conducted by multiple research groups. |
| Likely to be a causal relationship | Evidence is sufficient to conclude that a causal relationship is likely to exist with relevant pollutant exposures. That is, the pollutant has been shown to result in health effects in studies where results are not explained by chance, confounding, and other biases, but uncertainties remain in the evidence overall. For example: (1) observational studies show association, but co-pollutant exposures are difficult to address and/or other lines of evidence (controlled human exposure, animal, or mode of action information) are limited or inconsistent, or (2) animal toxicological evidence from multiple studies from different laboratories demonstrates effects, but limited or no human data are available. Generally, the determination is based on multiple high-quality studies. |
| Suggestive of, but not sufficient to infer, a causal relationship | Evidence is suggestive of a causal relationship with relevant pollutant exposures but is limited because chance, confounding, and other biases cannot be ruled out. For example: (1) when the body of evidence is relatively small, at least one high-quality epidemiologic study shows an association with a given health outcome and/or at least one high-quality toxicological study shows effects relevant to humans in animal species, or (2) when the body of evidence is relatively large, evidence from studies of varying quality is generally supportive but not entirely consistent, and there may be coherence across lines of evidence (e.g., animal studies or mode of action information) to support the determination. |
| Inadequate to infer a causal relationship | Evidence is inadequate to determine that a causal relationship exists with relevant pollutant exposures. The available studies are of insufficient quantity, quality, consistency, or statistical power to permit a conclusion regarding the presence or absence of an effect. |
| Not likely to be a causal relationship | Evidence indicates there is no causal relationship with relevant pollutant exposures. Several adequate studies, covering the full range of levels of exposure that human beings are known to encounter and considering at-risk populations and life stages, are mutually consistent in not showing an effect at any level of exposure. |
Chapter 3. Umbrella review
3.1 Characteristics of the included reviews
The scoping review process identified 16 relevant reviews. An additional review (Heinrich et al. 2016) was identified in the external review process; this review was from a publication not indexed in the databases used for the scoping review literature search. Of these 17 reviews, only 15 were included in the umbrella review following the quality appraisal using the adapted AMSTAR 2 tool (described in section 2.2). Two reviews (Choudhary and Tarlo 2014; Pollock et al. 2017) were excluded because they were categorized as unacceptable for inclusion in the risk assessment due to low quality (i.e., low validity of and low confidence in the results of the review) after evaluation of the critical domains. Only two reviews (Heinrich et al. 2016; Khreis et al. 2017) were deemed to be of high quality, and the remainder (Boothe and Shendell 2008; Götschi et al. 2008; Salam et al. 2008; Bråbäck and Forsberg 2009; Heinrich 2011; Koppen et al. 2011; Gasana et al. 2012; Jacquemin et al. 2012; Favarato et al. 2014; Barone-Adesi et al. 2015; Bowatte et al. 2015; Khreis and Nieuwenhuijsen 2017; Schultz et al. 2017) were found to be of medium quality. Most reviews did not account for the Risk of Bias (RoB) in the individual studies that were included in them. All studies of high or medium quality were included for evaluation in the umbrella review. Additional details and individual scores are found in the study quality assessment table in Appendix B.
Regarding the general methodology, seven of the studies were systematic reviews and six were systematic reviews that included meta-analysis. An additional two reviews were included, since each conducted a comprehensive review of the literature to support a determination of causality; these additional reviews are referred to as “selected other reviews” in this assessment. Overall, the reviews used were published during the period from 2008 to 2017 and included 157 unique primary studies published between 1989 and 2016. Of these primary studies, 109 pertained to asthma and included cohort/case-control nested in a cohort (62 studies), cross-sectional/case-control nested in a cross-sectional (34 studies), case-control/case-cohort (eight studies), and pooled analysis of cohorts (four studies). The study type was not specified in one study. Of the 157 primary studies, 22 examined allergy as a health endpoint: 18 were cohort studies by design, three were pooled analysis of cohort studies, and one was a case-cohort study. In contrast, 32 of the 52 primary studies that examined lung function as a health endpoint used a cross-sectional study design or reported cross-sectional associations; the remaining 20 studies had a cohort design.
The level of overlap between the reviews, in terms of the primary studies that examined the health endpoints considered in this synthesis, was also determined in order to evaluate the breadth of the primary literature and is depicted in Appendix C. The partial overlap and high variability observed in the citation of primary studies included in the reviews can be attributed to the specific objective of each review, its inclusion and exclusion criteria, and its publication date. The interrelated nature of these health endpoints, namely, between asthma and allergy and between asthma and lung function, has also led some reviews and some cohorts described in the reviews to evaluate more than one of the health endpoints. The reviews considered in this synthesis were also not consistent in their description of the primary studies; some reviews refer to the studies by the cohort name, while others refer to the studies by cohort location only or by the primary study author. Seven primary studies (Brauer et al. 2002, 2007; Gehring et al. 2002, 2010; Morgenstern et al. 2007, 2008; Oftedal et al. 2009) were the most cited (each cited seven to nine times) among the 15 systematic or selected other reviews. A summary table of these 15 review articles is provided in Appendix D.
3.2 Asthma
Four SR-MAs (Gasana et al. 2012; Favarato et al. 2014; Bowatte et al. 2015; Khreis et al. 2017) evaluating the association between exposure to TRAP and asthma were identified during the scoping review, and one SR-MA (Heinrich et al. 2016) was identified during the external review process. Five systematic reviews (Salam et al. 2008; Bråbäck and Forsberg 2009; Koppen et al. 2011; Jacquemin et al. 2012; Khreis and Nieuwenhuijsen 2017) and two selected other reviews (Boothe and Shendell 2008; Heinrich 2011) were also identified from the scoping review process for the potential association between exposure to TRAP and asthma. Most of these reviews were focused on children.
3.2.1 SR-MAs
Khreis et al. (2017) is the most recent review among the SR-MAs identified during the scoping review. The authors conducted an SR-MA of observational epidemiological studies that examined the association between TRAP exposures and the subsequent development of asthma in children from birth to 18 years of age. Unlike previous analyses that also included childhood wheeze, Khreis et al. (2017) focused specifically on TRAP exposures preceding the development of childhood asthma only (e.g., asthma had to be explicitly specified, and childhood wheeze was not included). Forty-one primary studies of various designs—28 cohort studies (21 birth cohort studies), three studies based on pooled data from birth cohorts, six case-control studies, and four cross-sectional studies—were included in the qualitative synthesis, while 21 primary studies were included in the various quantitative analyses. Study quality was assessed using the Critical Appraisal Skills Program checklists, and each primary study was considered to be of good quality and valid for inclusion in the review. The primary studies were conducted in Europe (17 studies), North America (11 studies), and Asia (10 studies); three studies reported pooled analysis from multiple combined cohorts that were conducted mainly in Europe. Of note, 17 primary studies relied exclusively on self- or parental reporting of doctor-diagnosed asthma, and 21 primary studies used more restrictive definitions (e.g., combining doctor diagnosis with symptoms and/or recent asthma medication prescriptions or use, or with symptoms and bronchial hyperreactivity or positive methacholine challenge test). Other definitions of asthma included pediatrician diagnosis; combining recurrent symptoms with response to β-agonist, anti-inflammatories, or both; using disease codes in claim records or doctor billing records from primary care and hospital discharges; and using registry data on dispensations of asthma medication. While a number of exposure assessment techniques (e.g., TRAP surrogates, fixed monitoring stations, LUR models, dispersion models, and individual residential level monitoring) were used in the primary studies, most studies (22) used LUR models. With the exception of five primary studies that used measurements from fixed-site stations near schools or nurseries to assign exposure, TRAP exposures were assigned based on residential address. Eight primary studies also considered children's mobility and assigned time-weighted TRAP exposures at other locations (e.g., daycare centres and schools). While the distribution of traffic-related exposures for each of the pollutants measured was specified for the individual studies, there was no consistency in the reporting between the studies, and no overall range or discussion was provided in Khreis et al. (2017). With respect to potential confounders (e.g., smoking, socioeconomic status [SES], and hereditary factors), the model results adjusting for the greatest number of covariates were chosen for the quantitative analysis where available. Only primary studies that specifically measured or modelled exposure to TRAP pollutants were included in the quantitative analysis; risk estimates from the included studies were standardized to increment increases of 0.5 × 10⁻⁵/m for BC, 4 µg/m3 for NO2, 30 µg/m3 for nitrogen oxides (NOx), 1 µg/m3 for PM2.5, and 2 µg/m3 for PM10.
Random-effects meta-analysis revealed a positive and mostly significant association between each pollutant and asthma development, without regard to age of onset. For each pollutant, pooled odds ratio (OR), 95% confidence interval (CI), percentage of variation across studies that is attributed to heterogeneity (I2), and p-value for the χ2 test of heterogeneity are depicted in Table 3.1. Significant pooled ORs (range 1.03–1.08) were reported for BC, NO2, PM2.5, and PM10, although high heterogeneity was noted for NO2. The pooled OR for NOx was elevated (OR: 1.48) but not significant, and the studies were found to have high heterogeneity. The results from the fixed-effects meta-analysis were comparable to those from the random-effects meta-analysis for BC, NO2, PM2.5, and PM10 but showed a statistically significant increased risk for NOx. Given the high heterogeneity for NO2 and NOx, the random-effects model was considered more appropriate for the quantitative synthesis.
| Pollutant (standardized incremental increase) | Number of primary studies included in the meta-analysis | Pooled OR (95% CI) | Heterogeneity (I2) | p-value | |
|---|---|---|---|---|---|
| Total number | Positive associationsTable 3.1 Footnote a | ||||
| BC (0.5 × 10⁻⁵/m) |
8 | 7 (1) | 1.08 (1.03–1.14) |
0% | 0.87 |
| NO2 (4 µg/m3) |
20 | 16 (9) | 1.05 (1.02–1.07) |
65% | 0.0001 |
| NOx (30 µg/m3) |
7 | 5 (3) | 1.48 (0.89–2.45) |
87% | 0.00001 |
| PM2.5 (1 µg/m3) |
10 | 8 (2) | 1.03 (1.01–1.05) |
28% | 0.18 |
| PM10 (2 µg/m3) |
12 | 10 (1) | 1.05 (1.02–1.08) |
29% | 0.16 |
|
|||||
When age of onset was considered (i.e., ≤6 years old [preschool age] and >6 years old [school age]), the risk estimates were generally higher in the younger age group with the exception of those for NOx, and all associations remained positive but many were no longer significant. This loss of significance is likely attributed to the reduction of power in the statistical analysis. The associations that remained significant include asthma onset in preschoolers and BC, NO2, and PM10, with ORs of 1.17 (95% CI: 1.01–1.36; I2 = 45%, p = 0.12), 1.08 (95% CI: 1.04–1.12; I2 = 26%, p = 0.23), and 1.09 (95% CI: 1.04–1.15; I2 = 12%, p = 0.34), respectively; and asthma onset in school-aged children and PM2.5, with an OR of 1.04 (95% CI: 1.02–1.07; I2 = 3%, p = 0.41). Across the overall and age-specific analyses, BC estimates had the least heterogeneity, PM2.5 and PM10 estimates had some heterogeneity, and NO2 and NOx estimates had the most heterogeneity. The authors attribute the higher heterogeneity levels found in the NO2 analysis, despite the higher number of primary studies (20), to NO2 being a surrogate for another pollutant or mixture responsible for the observed effects, such as BC and PM2.5, since these had lower heterogeneity.
The authors also conducted a number of sensitivity analyses in which they excluded studies contributing to the largest weight, case-control studies, cross-sectional studies, or studies with special characteristics (i.e., high-risk birth cohort). The pooled risk estimates from the random-effects meta-analyses were generally robust to these sensitivity analyses. In particular, ORs for BC and NO2 remained positive and statistically significant in sensitivity analyses by all ages and by the younger age group. Of note, no cross-sectional studies were included in any of the pooled risk estimates for BC, NOx, and PM2.5, and no case-control studies were included in the pooled risk estimate for NOx overall in all ages and for NOx and BC in school-aged children. The overall pooled risk estimates remained largely unchanged when case-control studies or cross-sectional studies were excluded from the analyses, with the exception of BC, where the pooled risk estimate increased to 1.12 (1.01–1.24) when case-control studies were excluded, and PM10, where the positive associations became borderline significant when case-control studies or cross-sectional studies were excluded (pooled ORs: 1.03 [1.00–1.06] and 1.05 [1.00–1.10], respectively). For preschoolers, the pooled risk estimates for BC, NO2, and PM2.5 increased (pooled ORs: 1.27 [1.05–1.54], 1.10 [1.06–1.213], and 1.09 [1.02–1.17], respectively), becoming statistically significant for PM2.5, while the pooled risk estimate for PM10 decreased but remained statistically significant (pooled OR: 1.07 [1.01–1.12]) when case-control studies were excluded. For school-aged children, the pooled risk estimates for NO2, PM2.5, and PM10 remained largely unchanged when case-control or cross-sectional studies were excluded.
Khreis et al. (2017) reported that, overall, the meta-analysis results for NO2 had the highest number of studies, produced the highest heterogeneity, and had a relatively small effect size, while ORs from the PM2.5 meta-analyses were also relatively low in magnitude but had less heterogeneity. In contrast, the meta-analysis results for BC and PM10 produced higher effect sizes and minimal heterogeneity. The meta-analyses for NOx had the least number of studies included, and although the pooled risk estimate was high in magnitude, it was not statistically significant.
In addition, Khreis et al. (2017) examined the effects of TRAP exposures and the subsequent development of asthma by sex and asthma phenotype (i.e., atopic and non-atopic). While seven out of 11 primary studies found sex-specific differences, the effects observed were inconsistent. In the five primary studies that phenotyped asthma as atopic or non-atopic, only the non-atopic asthma phenotype had positive associations or demonstrated increased or higher ORs than atopic asthma did, and those results were observed for all the pollutants studied (i.e., BC, NO2, NOx, PM2.5, PM10, and coarse PM).
Overall, this SR-MA demonstrated a significant association between exposure to TRAP and subsequent childhood asthma development. For the meta-analyses, funnel plots were symmetrical for all pollutants with the exception of NOx, thus indicating that there was limited concern for publication bias except for the NOx analysis. Given the smaller number of studies available for pollutants other than NO2, the power to detect heterogeneity and associations is likely limited. In addition, Khreis et al. (2017) noted variability in asthma definitions that could potentially result in selection bias (21 studies) as well as variability in TRAP exposure assessment methods and confounder adjustment. Most studies (17) also relied exclusively on responses to questionnaires using parental or self-reporting of doctor-diagnosed asthma, potentially resulting in recall bias. Despite these limitations, the authors indicated that there is sufficient evidence to support an association between exposure to TRAP and the development of childhood asthma based on the high degree of consistency in the findings and conclusions of the individual studies, the results of the meta-analysis, and considerable support from the existing literature. However, the authors did not make any conclusions regarding the effects of age of onset, sex, or asthma phenotype on this association.
Heinrich et al. (2016) expanded on an earlier SR-MA of birth cohorts conducted by Bowatte et al. (2015) (described below) to examine the association between early-childhood TRAP exposure and subsequent asthma and allergic health outcomes in childhood and adolescence. Specifically, the review included primary studies that had not been captured by Bowatte et al. (2015), as a result of extending the identical literature search by almost two years and including risk estimates from pooled analyses. Twenty-eight primary studies representing 15 birth cohorts (i.e., eight cohorts from Europe, six from North America, and one from Taiwan) met the inclusion criteria. Study quality was assessed using the Newcastle–Ottawa scale for cohort studies, and each primary study was considered to be of good quality and valid for inclusion in the review. The cohorts were all population-based with the exception of one that only included children with a parental history of allergic diseases. The outcomes of asthma incidence and prevalence of wheeze symptoms were determined mostly by parental-reported doctor diagnoses, and questions about asthma usually pertained only to the year preceding the follow-up. For wheeze, with the exception of one cohort, only data on symptoms occurring in the preceding 12 months were used. For asthma, the follow-up period for the majority of primary studies was approximately 10 years; the longest follow-up was 14 to 16 years in four cohorts that followed the children into adolescence. The follow-up period for wheeze tended to be shorter. Most of the birth cohort studies used LUR models to determine long-term exposure to TRAP pollutants (i.e., NO2 and PM2.5) at the home address of the participants. While there was also no consistent reporting of exposure (e.g., overall range, mean, 5th to 95th percentile, and interquartile range) in the individual studies, Heinrich et al. (2016) observed substantial variability in the average levels of ambient air pollution concentrations across cohorts and indicated that, on average, the vast majority of subjects were exposed to TRAP levels below the World Health Organization's current guidelines (i.e., annual mean exposures of 10 µg/m3 for PM2.5 and 40 µg/m3 for NO2). The effect estimates provided below are for increments of 10 µg/m3 for NO2 and 2 µg/m3 for PM2.5.
Random-effects meta-analyses between the TRAP pollutants and the outcomes of asthma incidence and wheeze prevalence in children and adolescents are depicted in Table 3.2. For asthma incidence, borderline-significantFootnote 4 pooled ORs were reported for both NO2 and PM2.5 (ORs of 1.08 and 1.11, respectively), although moderate to high heterogeneity was noted for both pollutants (p-value not provided). Similarly, for the outcome of prevalence of wheeze symptoms, random-effects meta-analyses revealed borderline-significant positive associations for NO2 and PM2.5, with pooled ORs of 1.08 and 1.13, respectively. No heterogeneity (p-value not provided) was observed for either pollutant.
| Health outcome | Pollutant (standardized incremental increase) | Number of primary studies included in the meta-analysis | Pooled OR (95% CI) | Heterogeneity (I2)Table 3.2 Footnote b | |
|---|---|---|---|---|---|
| Total number | Positive associationsTable 3.2 Footnote a | ||||
| Asthma incidence | NO2 (10 µg/m3) |
10 | 6 (3) | 1.08 (0.96–1.20) |
55% |
| Asthma incidence | PM2.5 (2 µg/m3) |
7 | 5 (1) | 1.11 (0.97–1.26) |
58% |
| Wheeze prevalence | NO2 (10 µg/m3) |
9 | 7 (0) | 1.08 (0.98–1.18) |
0% |
| Wheeze prevalence | PM2.5 (2 µg/m3) |
4 | 4 (0) | 1.13 (1.00–1.28) |
0% |
|
|||||
The results from the fixed-effects meta-analyses were reported to be highly similar to those from the random-effects meta-analyses but were not provided by Heinrich et al. (2016). In sensitivity analyses, where the high-risk cohort was excluded, the effect estimates for asthma incidence remained positive but were attenuated for both NO2 and PM2.5 (1.06 [95% CI: 0.95–1.19] and 1.03 [95% CI: 0.97–1.10], respectively). While similar results were obtained for the prevalence of wheeze symptoms and PM2.5 (1.09 [95% CI: 0.99–1.20]), the effect estimates for the prevalence of wheeze symptoms remained unchanged for NO2 when the high-risk cohort and the cohort with very young children were excluded.
Overall, this SR-MA found positive, borderline-significant associations between key pollutants of TRAP and asthma incidence in children as well as between adolescents and the prevalence of wheeze symptoms in children. Furthermore, Heinrich et al. (2016) concluded that there was insufficient epidemiological evidence to support a causal association between TRAP and asthma. Potential confounders were not addressed in this SR-MA, although the authors did note that unmeasured confounders (e.g., SES, second-hand smoking, and allergic predisposition) in addition to other factors (e.g., variability in the clinical criteria for asthma diagnosis, changes in diagnostic procedures over time, and urban/rural mixture across cohorts) may help explain the moderate to high heterogeneity observed in the meta-analyses. Additionally, Heinrich et al. (2016) reported that the results of a few studies, which included the loss of more than 40% of the initial recruited cohort during long follow-up durations, could be affected by bias due to the non-random nature of this loss.
Bowatte et al. (2015) conducted an SR-MA of birth cohorts to examine the association between early-childhood TRAP exposure and subsequent asthma, allergies, and sensitization. Nineteen primary studies representing 11 birth cohorts met the inclusion criteria: seven of the birth cohorts were European, and four were North American. Eight cohorts were population-based, while three were high-risk cohorts (e.g., those with a family history of asthma or allergies), and the number and length of follow-ups varied across the cohorts. The primary studies used a variety of exposure assessment techniques, including LUR models (seven cohorts), dispersion models (two cohorts), central-site monitoring station (one cohort), and the use of a passive sampler (one cohort). Six cohorts also considered proximity to major roads. However, the review authors do not specify where TRAP exposures were assigned in the individual studies. Mean BC concentrations varied from 0.20 to 1.00 × 10⁻⁵/m across the individual studies. For NO2, the mean concentrations varied from 3.40 to 17.90 µg/m3, and NOx values were scaled by the review authors (not provided). For PM2.5, the mean concentrations varied from 1.00 to 4.10 µg/m3, and PM10 values were scaled by the review authors (not provided). Asthma and wheeze were the most frequently measured clinical outcomes; they were reported in nine and eight cohorts, respectively, and were evaluated separately in Bowatte et al. (2015). These health outcomes were assessed mainly from parental-reported questionnaires (nine cohorts); two cohorts reported outcomes using the diagnosis made by a single-blinded pediatric allergist, physician billing, and hospital discharge records. Although study quality was assessed using the Newcastle–Ottawa scale for cohort studies, Bowatte et al. (2015) did not make any statements concerning the overall quality of the included primary studies. In terms of potential confounders, two cohorts did not adjust for second-hand smoking, two cohorts did not adjust for allergic predisposition (heredity), and one cohort did not adjust for either of these confounders.
Random-effects meta-analysis indicated positive associations between asthma incidence in childhood and longitudinal childhood exposure to NO2 (per increase of 10 µg/m3), PM2.5 (per increase of 2 µg/m3), and BC (per increase of 1 × 10⁻⁵/m). For NO2, four of the five studies included in the meta-analysis had positive associations, two of which were statistically significant; the pooled OR was 1.09 (95% CI: 0.96–1.23). For PM2.5, all four studies included in the meta-analysis had positive associations, two of which were statistically significant; the pooled OR was 1.14 (95% CI: 1.00–1.30). Similarly, for BC, all three studies included in the meta-analysis had positive associations, two of which were statistically significant; the pooled OR was 1.20 (95% CI: 1.05–1.38). Heterogeneity was substantial for NO2 and PM2.5, with I2 values of 75.5% (p = 0.003) and 77.1% (p = 0.004), respectively, but minimal for BC (I2 = 19.3%, p = 0.290).
A generally positive trend was observed when ORs of the age-specific incidence of asthma from birth to childhood and TRAP pollutants were charted in forest plots. In particular, an increased risk for early-childhood exposure to NO2 and asthma incidence was observed until the age of 6 years; however, no clear pattern was discernable in older children. The number of studies considered per age group ranged from one to three, and when age-stratified meta-analysis was done, heterogeneity (I2) ranged from 0% to 62.6% (p = 0.102 to 0.866). Of the five age-specific meta-analyses performed, four indicated a positive association, and the risk estimate was statistically significant for age 4 (OR = 1.14; 95% CI: 1.06–1.23) and age 7 (OR = 1.47; 95% CI: 1.01–2.13) and borderline significant for age 1 (OR = 1.06; 95% CI: 0.90–1.24) and age 8 (OR = 1.25; 95% CI: 0.98–1.60). Minimal heterogeneity (I2 from 0.0% to 1.7%, p = 0.313 to 0.866) was observed for four of the five meta-analyses, including those that were statistically significant. Similarly, an increasing trend in the incidence of asthma, with minimal heterogeneity (I2 from 0% to 23.7%, p = 0.252 to 0.706), was observed for early-childhood exposure to BC up to age 6; these results were reported to be dominated by one cohort (Prevention and Incidence of Asthma and Mite Allergy [PIAMA]). In contrast, early exposure to PM2.5 was associated with a trend of increasing asthma risk from age 3 up to age 12; however, only one or two studies were considered per age group, and the heterogeneity (I2) of the age-stratified meta-analysis ranged from 0% to 52.3% (p = 0.148 to 0.797).
Bowatte et al. (2015) also qualitatively reviewed the outcome of wheeze as well as the influence of road proximity on asthma and wheeze. Associations between wheeze incidence or prevalence and nitrogen oxides (nitrogen oxide [NO], NO2, and NOx) and PM were mostly positive. Of the six cohorts (corresponding to 10 publications) that reported on associations between nitrogen oxides and wheeze prevalence or incidence, only two (the PIAMA cohort and the Copenhagen Prospective Study on Asthma in Childhood [COPSAC] cohort) reported significant associations of an increased risk of wheeze prevalence or incidence following exposure to nitrogen oxides at the ages of 1, 2, 3, 4, and 6 years. For PM, only one cohort (PIAMA) of the five (corresponding to eight publications) showed a significant increase in wheeze prevalence following exposure to PM at the ages of 1, 2, 3, 4, 5, 6, and 8 years. For BC, three cohorts (corresponding to five publications) evaluated the association between wheeze prevalence and BC, and only one (PIAMA) of those three reported a significantly increased risk of wheeze at the ages of 2, 3, 4, and 6 years. Additionally, of the six cohorts that reported on the association between proximity to roads and asthma (incidence and prevalence), only the German Infant Nutrition Intervention Programme and Lifestyle Related Factors on the Human Immune System and Development of Allergies in Children (GINI & LISA) cohorts reported significant associations at the ages of 2 and 6 years. Similarly, of the four cohorts that reported associations between proximity to road and wheeze (incidence and prevalence), only two (the Cincinnati Childhood Allergy and Air Pollution Study [CCAAPS] cohort and the Columbia Center for Children's Environmental Health [CCCEH] cohort) found significant associations at ages 1 and 5 years.
Overall, Bowatte et al. (2015) found that childhood exposure to TRAP was associated with an increased incidence of asthma in children and that the magnitude of this risk increased with age. Specifically, the risks from NO2 and BC increased over the first six years of life, while the magnitude of the risk was not increased at the older ages. In comparison, the magnitude of the risk from PM2.5 increased over the first 12 years of life. However, the number of studies pooled at each age was limited. Additionally, substantial heterogeneity was observed across the studies and was likely attributable to diverse definitions of exposure and outcome as well as unmeasured confounding. While the review authors did not make any overall conclusions regarding wheeze incidence or prevalence, they indicated that proximity to roads did not show a strong association with asthma.
Favarato et al. (2014) conducted an SR-MA that evaluated the association between NO2 and asthma prevalence in within-community population-based studies (i.e., the study population is compared within the same community such that the exposure contrast is attributable to traffic proximity; studies with community-level exposure were excluded). This SR-MA focused specifically on publications with quantitative estimates for NO2 and defined asthma prevalence as the 12-month prevalence of asthma symptoms (wheeze) or asthma diagnosis. The latter was determined from parental-reported questionnaires. Of the 18 individual studies that met the inclusion criteria, the majority were from Europe (12 studies; Asia and the United States each had three studies) and included children between the ages of 5 and 12 years (14 studies; subject age range across all studies was 1 to 17 years). Measurements of NO2 or NOx were taken at the home address (10 studies) or school address (six studies), or an average of the measurements taken at both locations was used (two studies), and the exposure assessment methods included study-specific monitors (six studies), LUR (six studies), dispersion models (four studies), and interpolation from monitors (two studies). Mean NO2 varied from 5.2 to 63 µg/m3 across all the studies. Favarato et al. (2014) reported that all the studies took into account a varying but generally wide range of potential confounding factors (e.g., indoor factors, SES, smoking, and demographics). However, the quality of the primary studies was not formally appraised by Favarato et al. (2014).
Twelve of the 18 study-specific estimates (16 for wheeze symptoms and two for asthma diagnosis) included in the meta-analysis indicated positive associations between NO2 and asthma prevalence; two of these associations were significant. Random-effects meta-analysis based on these study-specific estimates demonstrated a borderline-significant positive association between NO2 and asthma prevalence, with an OR of 1.06 (95% CI: 1.00–1.11 per 10 µg/m3). There was moderate heterogeneity (I2 = 32.8%, p = 0.088) and no evidence of publication (small-study) bias based on the generally symmetrical funnel plots and the Begg's and Egger's tests. As part of sensitivity analyses, random-effects meta-analysis stratified by the method of exposure assessment was also conducted; the ORs ranged from 1.00 (95% CI: 0.93–1.06) to 1.23 (95% CI: 0.89–1.71) for dispersion models and for interpolation from monitors, respectively. For study-specific monitoring, the OR was 1.13 (95% CI: 1.00–1.28); five of the six studies measured NO2 at the school address. There was no evidence of heterogeneity between studies (p = 0.261).
Overall, Favarato et al. (2014) reported an association between NO2 and increased asthma prevalence in children among within-community studies in which the exposure contrast is due to traffic proximity. Considerable heterogeneity was noted by the review authors in the age of the subjects, the method of exposure assignment, and the lack of standardization of the questionnaires among the primary studies. Additionally, the review authors identified serious deficiencies in the use of a period prevalence metric (i.e., subject recall of asthma symptoms over a prior time period) to identify cases; those deficiencies include recall bias; inadequate quantification of the frequency, severity, and duration of asthma episodes; and the inability to distinguish between different asthma phenotypes.
Gasana et al. (2012) conducted an SR-MA to examine potential associations between long-term (specific time period or time minimum not specified) residential exposure to motor vehicle pollutants and wheeze and asthma in children. Nineteen studies met the review authors' inclusion criteria; nine of the studies were cohorts, and 10 had a cross-sectional design. The studies were conducted in Europe (nine studies), North America (five studies), Asia (four studies), and Latin America (one study). The primary studies used a variety of exposure assessment techniques, including fixed monitoring stations (11 studies), LUR (four studies), dispersion models (three studies), and modelling based on traffic counts (one study). The exposure range of the different pollutants measured in the included studies was not provided by Gasana et al. (2012). The outcomes of asthma and wheeze prevalence and incidence were determined based on questionnaires (17 studies) and physician diagnosis (two studies). The quality of study reporting was evaluated using the Strengthening the Reporting of Observational Studies in Epidemiology (STROBE) checklist. With respect to potential confounders (e.g., smoking, SES, hereditary factors, and indoor factors), adjusted model results were chosen for the quantitative analysis where available. Risk estimates were standardized to an increment increase of 10 µg/m3 for each of the pollutants for quantitative synthesis.
Random-effects meta-analyses for asthma and wheeze prevalence and incidence were performed for a variety of pollutants, including, NO2, NOx, PM, PM2.5, PM10, O3, carbon monoxide (CO), and sulphur dioxide (SO2), and each random-effects meta-analysis was based on two to seven study-specific estimates. Fourteen out of the 17 meta-analyses that were conducted indicated a positive association between individual traffic air pollutants and the prevalence or incidence of asthma or wheeze; of those 14, four were statistically significant and an additional two were borderline significant. For NO2, a key indicator of TRAP, five out of the six study-specific estimates included in the meta-analysis had positive associations for asthma prevalence, none of which was statistically significant, and two out of the three study-specific estimates had positive associations for asthma incidence, both of which were statistically significant; pooled ORs were 1.05 (95% CI: 1.00–1.11; I2 = 0.0%, p = 0.518) and 1.14 (95% CI: 1.06–1.24; I2 = 0.0%, p = 0.410) for asthma prevalence and incidence, respectively. Additionally, for NO2, three out of the four study-specific estimates included in the meta-analysis had positive associations for wheeze prevalence, none of which was statistically significant, and three out of the four study-specific estimates included in the meta-analysis had positive associations for wheeze incidence, one of which was statistically significant; meta-analysis ORs were 1.02 (95% CI: 0.98–1.07; I2 = 0.0%, p = 0.816) and 1.12 (95% CI: 0.86–1.45; I2 = 77.4%, p = 0.004) for wheeze prevalence and incidence, respectively. For PM2.5, a borderline-significant association was observed for asthma prevalence (1.06 [95% CI: 0.93–1.21]; I2 = 0.0%, p = 0.366), while a positive non-significant association was determined for asthma incidence (1.40 [95% CI: 0.77–2.50]; I2 = 72.7%, p = 0.056); each of the meta-analyses was based on two positive study-specific estimates, of which only one of the study-specific estimates for asthma incidence was significant. With respect to wheeze outcomes and PM, exposure was limited to PM in general (no specific size fractions presented), and a statistically significant result was observed for wheeze incidence (1.05 [95% CI: 1.04–1.07]; I2 = 0.0%, p = 0.554), while null results were determined for wheeze prevalence (0.99 [95% CI: 0.90–1.08]; I2 = 13.7%, p = 0.314). Three out of the four study-specific estimates used in the meta-analysis for wheeze incidence were positive, of which one was statistically significant, and two out of the three study-specific estimates used in the meta-analysis for wheeze prevalence were positive, of which one was statistically significant. Additionally, pooled estimates indicated that SO2 exposure was significantly associated with a higher prevalence of wheeze in children, while exposure to NOx and CO were associated with a higher prevalence of childhood asthma; the association was borderline significant for NOx and significant for CO.
Gasana et al. (2012) acknowledged several limitations in their meta-analysis, including (1) the use of cross-sectional studies that did not allow for assessment of the temporality of the associations; (2) the studies' use of different exposure assessment methodologies; (3) study outcomes that were based mostly on questionnaires; and (4) differences in the number and types of potential confounders considered, which may have reduced the consistency across studies as well as the precision of the summary estimates. Despite these limitations, the review authors concluded that there was an association between several TRAP pollutants and the incidence and prevalence of asthma and wheeze in children living or attending school in close proximity to areas of high motor vehicle traffic.
3.2.2 Systematic reviews and selected other reviews (without meta-analysis)
Using the same methodology outlined in Khreis et al. (2017), Khreis and Nieuwenhuijsen (2017) systematically reviewed the exposure assessment methods used in the epidemiology of TRAP and childhood asthma (incidence or lifetime prevalence from birth until 18 years old). Among the exposure assessment methods used in the primary studies, studies using proximity to roadways as the TRAP surrogate were the least consistent in identifying an increased asthma risk associated with TRAP. However, some of the primary studies that found no association between roadway proximity and asthma did find increased risks when LUR modelling, a more refined exposure assessment methodology, was used. Primary studies using dispersion modelling were more consistent in finding associations; five out of the eight studies using dispersion models had positive and statistically significant risk estimates. Primary studies that used fixed-site monitoring stations and LUR modelling also generally found an increased asthma risk associated with TRAP; 17 out of the 22 studies using LUR models had positive and statistically significant risk estimates. Statistically significant associations between exposure to TRAP and asthma were also observed in one primary study that measured NO2 exposure at the individual's residence and in one primary study that used remote sensing. The review did not address any potential confounding factors or adjustments included in the primary studies.
Koppen et al. (2011) focused their systematic review on published studies from birth cohorts to evaluate the relationship between TRAP and the development of respiratory and allergic symptoms. The birth cohorts considered were CCCEH, CCAAPS, Czech Early Childhood Health study, GINI & LISA, PIAMA, Barn Allergi Miljö Stockholm Epidemiologi (BAMSE), Oslo birth cohort, COPSAC, and Flemish Environment and Health Survey (FLEHS). The review also considered two ongoing childhood cohorts: Children's Health Study and a cohort from Japan. Each of the 15 primary articles included in the review reported positive associations between measures of TRAP exposure and asthma symptoms, including wheeze, cough, and bronchitis, with one study reporting a significant result. With respect to confounders, the review authors noted that all studies collected information on at least the key factors, including parental history of atopy, SES, environmental tobacco smoke at home, home dampness, visible indoor mould, and keeping of pets. Overall, these studies provided evidence to support a causal association between childhood asthma symptoms and exposure to TRAP. However, the role and timing of TRAP exposure and asthma development were not clear from the studies reviewed. A key limitation of the birth cohort studies was that relatively short follow-up periods were considered, with half the studies having two years or less of follow-up and the longest follow-up duration being six years. Participants in most of the studies could thus have been too young for a reliable diagnosis of asthma. Several of the studies performed cross-sectional analysis of the cohort data, not taking advantage of the longitudinal study design to evaluate incidence. Also, discrepancies in the interpretation of respiratory symptoms and diagnostic evaluations can lead to inconsistent results between studies. In some of the cohorts, TRAP exposure in early life, including in utero, was associated more strongly with an increased risk of subsequent asthma than exposure in later childhood was.
Bråbäck and Forsberg (2009) conducted a systematic review to assess the evidence from prospective studies evaluating long-term TRAP exposure and the development of asthma-like symptoms and allergic sensitization in children. For the evaluation of asthma-like symptoms, the review included 13 articles published based on five birth cohorts from Germany, the Netherlands, Sweden, Norway, and the United States as well as on two prospective cohorts from California and Japan. For the prospective studies, the children were enrolled at or after school entry. The cohorts were diverse in terms of exposure assessment, including traffic proximity, dispersion modelling, pollution measurements, and regression models. The cohorts also varied in terms of the age of the child for outcome measurement and the definition of health outcomes. Despite these differences, an increased risk of asthma-like respiratory symptoms with traffic exposure was demonstrated in all studies. From the five birth cohorts, each of the nine articles reported a positive association, seven of which were statistically significant. The review authors noted that six primary studies had adjustments for important confounding variables (no details provided), while three primary studies had limitations in the level of control for confounding. Taken together, the birth cohort studies identified that exposure to traffic exhaust during infancy was associated with increased risk of coughing, asthmatic bronchitis, upper respiratory infections, or doctor-diagnosed asthma. Proximity to stop-and-go traffic and levels of soot exposure exhibited a dose–response relationship with risk of cough without wheeze during the first year of life. For children aged 4 to 6 years, the Dutch, German, and Swedish cohorts each reported an association for TRAP exposure with doctor-diagnosed asthma or wheeze. However, the outcomes were inconsistent between the cohorts, which may reflect discrepancies in the definition of health outcomes. For the prospective cohorts of schoolchildren, there was some level of association between TRAP or living close to a main road and increased prevalence of asthma, since all four studies indicated a positive association, with two reaching a level of significance. However, these studies were limited as a result of less refined exposure assessments, smaller sample sizes, and the potential for confounding.
While the systematic reviews above focused on children, Jacquemin et al. (2012) conducted a systematic review of adult-onset asthma associated with air pollution exposure. The authors excluded studies dealing with childhood asthma, self-reported traffic exposure, and investigations of symptoms or exacerbation of asthma. Six of the seven articles included in the review had a traffic- or TRAP-based exposure assessment. These six articles were based on four studies conducted in Europe. Each of the articles indicated a positive association between traffic or TRAP exposure and adult-onset asthma, with five articles reaching a level of significance. Most studies observed a stronger association with residential proximity to traffic or major roads, in comparison with modelled concentrations of traffic-related pollutants. However, results were inconsistent between studies. A slightly greater effect in males was noted in two studies, and one study reported no difference between males and females or a greater effect in females depending on the definition of asthma used for analysis. Two studies indicated a greater effect in atopic subjects, while one study reported that non-atopic subjects had a greater susceptibility. Additionally, each of the studies excluded subjects with asthma or asthma-like symptoms at baseline and defined onset as subjects reporting asthma at follow-up. However, for three of the studies, "new cases" could have included individuals with remissions of childhood asthma. Potential confounders, including sex, atopy, physical activity, diet, comorbidities, and smoking, were not consistently addressed in each of the included studies. The review authors also evaluated an additional three primary studies focused on asthma prevalence in adults. In each of the studies, living in close proximity to traffic was associated with an increase in asthma prevalence, but no association was found for modelled concentrations of NOx. Overall, the studies were considered not sufficient by the review authors to conclude on the causal role of air pollutants in adult-onset asthma. The prospective studies indicated a role for TRAP in the development of adult-onset asthma; however, the inconsistent results from the prevalence studies (i.e., effect for traffic density but not for modelled NO2) limited the review authors' ability to make firm conclusions. The review authors did not identify whether occupational exposures were addressed in the primary studies as potential confounders. The results of the adult-onset asthma studies are not expected to be similar to those focused on childhood asthma incidence, since the pathophysiology and underlying mechanisms of the onset of the disease may be different, limiting the ability to generalize the results between the age groups.
Salam et al. (2008) systematically reviewed studies that evaluated the association of asthma and wheeze with traffic or TRAP exposure based on measures of residential proximity to roadways, traffic density around homes, or LUR models. The review authors considered three cohort studies, one case-control study, and eight cross-sectional studies. The primary studies were conducted in Europe, the United States, and Asia. Overall, the studies that were reviewed supported an association between residential exposure to traffic and asthma occurrence or exacerbation (i.e., asthma prevalence) in children and adults. The review authors highlighted the modifying factors for susceptibility identified in a few of the primary studies, including parental asthma and polymorphisms in oxidative stress pathway genes. A stronger association of asthma occurrence in children with no parental asthma was reported in two studies, indicating a greater susceptibility to traffic exposures in children without genetic susceptibility factors. The modifying effects of oxidative pathway genetic polymorphisms indicated a possible association between oxidative stress and asthma risk from TRAP. For adults, asthma occurrence and exacerbation were associated more commonly with measures of traffic proximity and density than with pollutant concentrations. A weak correlation between traffic measures and pollutant concentrations was noted in some of the studies. Some limitations of the review were the inclusion of some primary studies that relied on self- or parent-reported measures of traffic, which could have introduced bias in comparison with objective measures, and limited information regarding adjustment for confounders in the primary studies. Additionally, publication bias could not be ruled out, since most of the primary studies reported significant associations with at least one measure of traffic or TRAP. Correspondingly, the review authors identified a possible reporting bias, since investigators could select from a variety of exposure metrics for TRAP, traffic, or both in order to detect a significant association for publication. The review authors also noted that validated LUR models were better predictors of exposure and that the incorporation of time–activity patterns would also improve the exposure estimates.
Heinrich (2011) conducted a selected other review of asthma onset in childhood associated with indoor environmental factors in westernized countries, including penetration of TRAP into the indoor environment. This review, which included reviews of primary studies and systematic review articles and an evaluation of causality, was termed a strategic review by the author. The review considered 14 articles stemming from several birth cohorts, specifically PIAMA, GINI & LISA, BAMSE, CCAAPS, Oslo birth cohort, East Boston birth cohort, and British Columbia birth cohort. These studies used a variety of exposure assessment methods, including LUR, dispersion modelling, geographic information system (GIS)-based distances to major traffic arteries, and a GIS-based regression model to estimate exposure to NO2 and PM2.5 at residential addresses. All birth cohorts, except the one from Oslo, reported an increased risk of asthma, measured as asthma incidence, asthma prevalence, or persistent wheeze in early life, in association with TRAP. Although not all effect estimates were statistically significant, a positive effect estimate was observed for all the studies except the two based on the Oslo birth cohort. Two additional cohorts of children (recruited at age 4) reported an increased risk of asthma incidence with exposure to TRAP, while a population-based study based in England did not. The review author noted that the majority of the primary studies had adjusted for important confounders (not specified). This review concluded that, regardless of some inconsistencies in the results, exposure to TRAP in early life is a risk factor for the onset of childhood asthma. Additionally, the evidence overall was considered by the review author to be suggestive of a causal relationship between TRAP and the onset of asthma in children.
In a selected other review, Boothe and Shendell (2008) reviewed epidemiological studies that evaluated the adverse health effects associated with residential proximity to traffic, including asthma and wheeze. Significant associations were reported in four of the six studies that evaluated asthma prevalence, asthma-associated medical visits, or asthma incidence with residential proximity within 75, 100, 150, or 300 m of dense traffic. These studies included adults, children or both. The significant associations were observed in primary studies conducted in the United States and France, and a dose–response relationship (based on traffic density) was reported in two of the studies. Ten primary studies evaluated self- or parent-reported symptoms of wheeze, with seven of those studies reporting statistically significant associations with proximity to traffic. Persistent or current wheeze was associated with residential proximity within 50, 75, or 150 m of busy roads for studies conducted in the United Kingdom, the Netherlands, Germany, the United States, and Ethiopia. The majority of the studies on asthma and wheeze that were reviewed by the authors indicated an association with residential proximity to traffic. However, the review authors deemed the epidemiological evidence insufficient to determine causality, due to the lack of individual exposure assessment and the potential for confounding by other unmeasured factors. This review did not specifically identify any adjustments for confounders in any of the primary studies.
3.2.3 Summary/conclusion
The five SR-MAs that evaluated the association between TRAP and asthma differed in their publication year and their specific objective and therefore included different numbers of primary studies and different cohorts. However, there was substantial overlap in the primary studies considered. Khreis et al. (2017) conducted an SR-MA of observational epidemiological studies that examined the association between TRAP exposures and the subsequent development of asthma (incidence or lifetime prevalence) in children from birth to 18 years of age. Heinrich et al. (2016) examined the association between early-childhood TRAP exposure and subsequent asthma and allergic health outcomes in childhood and adolescence by specifically expanding on the SR-MA conducted by Bowatte et al. (2015). Bowatte et al. (2015) focused on birth cohorts to understand the association between early-childhood TRAP exposure and subsequent asthma development, allergies, and sensitization, and the review authors included both population-based and high-risk cohorts. Although Favarato et al. (2014) did not limit their search strategy to any sub-group of the population when they conducted their SR-MA investigating the association between NO2 and asthma prevalence in within-community population-based studies, only studies on children were identified. Gasana et al. (2012) focused on the potential associations between motor vehicle pollutants and the incidence and prevalence of wheeze and asthma in children. Unlike Khreis et al. (2017), who specifically omitted childhood wheeze from their analyses, Heinrich et al. (2016), Bowatte et al. (2015), and Gasana et al. (2012) evaluated wheeze independently from asthma, while Favarato et al. (2014) considered both outcomes together in their analyses. The majority of the primary studies considered in these SR-MAs were conducted in North America and Europe; thus, the results are considered relevant for a Canadian assessment with respect to air pollutant mixture, standard of living, health care, climate, and so on.
Despite identifying several limitations in their meta-analyses, including the use of primary studies that used various definitions of asthma, TRAP exposure assessment methods, and confounder adjustments, as well as primary studies that relied on non-standardized questionnaires, all the SR-MAs reported a positive association between asthma and TRAP. In particular, Khreis et al. (2017), the most recent SR-MA published, found statistically significant positive pooled estimates of the association between exposure to TRAP and subsequent childhood asthma development. Heinrich et al. (2016) also found positive associations between TRAP pollutants and asthma incidence and prevalence of wheeze symptoms, but those associations were not statistically significant; the reviewers therefore concluded that there was insufficient epidemiological evidence to support a causal association between TRAP and asthma in children and adolescents. Bowatte et al. (2015) concluded that childhood exposure to TRAP was associated with an increased incidence of asthma in children and that the magnitude of this risk increased with age. Favarato et al. (2014) reported a small-magnitude pooled estimate of the association between NO2 and increased asthma prevalence in children among within-community studies in which the exposure contrast is due to traffic proximity. Gasana et al. (2012) concluded that there is an association between several TRAP pollutants and the incidence and prevalence of asthma and wheeze in children living or attending school in close proximity to areas of high motor vehicle traffic.
The majority of the systematic reviews and selected other reviews focused on publications from birth and childhood cohorts evaluating the association between TRAP and asthma. From these reviews, the evidence indicates an association between TRAP exposure and asthma symptoms and asthma prevalence. Most of the systematic reviews and selected other reviews focused on the results of cross-sectional studies, precluding the ability to assess asthma incidence. Consistent associations for asthma symptoms and asthma prevalence have been found in the evaluations of birth and childhood cohorts, which have used different exposure assessment methods. The main limitation is a lack of consistency between studies in the definition of health outcomes, which can lead to misclassification. The association between TRAP exposure and asthma in adults is less studied and as a result is less well characterized. The evidence is mixed for the association between TRAP exposure and asthma prevalence in adults, and there is insufficient evidence to evaluate asthma incidence for this age group.
3.3 Allergy
One SR-MA (Bowatte et al. 2015) and two older systematic reviews (Bråbäck and Forsberg 2009; Koppen et al. 2011) evaluating the association between TRAP and allergy were identified during the scoping review. One additional SR-MA (Heinrich et al. 2016) was identified during the external review process. Each review considered effects in children exclusively, and all the primary studies pertaining to allergy were based on birth cohorts. The primary outcomes considered include allergic sensitization (measured as serum IgE or skin prick test), eczema, and hay fever.
3.3.1 SR-MAs
Heinrich et al. (2016) expanded on an earlier SR-MA of birth cohorts conducted by Bowatte et al. (2015) (described below) to examine the association between early-childhood TRAP exposure and subsequent asthma and allergic health outcomes in childhood and adolescence. Specifically, the review included primary studies that had not been captured by Bowatte et al. (2015), as a result of extending the identical literature search by almost two years and including individual estimates from pooled analyses. Relevant details of this SR-MA were captured in section 3.2.1, and only studies and results pertaining to allergic outcomes are discussed in this section. Eight of the 15 birth cohorts that met the inclusion criteria were used in the quantitative syntheses pertaining to allergic outcomes (i.e., sensitization to any allergen, sensitization to aeroallergens, and hay fever); five cohorts were from Europe, and three were from Canada. The cohorts were all population-based with the exception of one that only included children with a parental history of allergic diseases. The follow-up period for allergic sensitization ranged from 1 to 12 years, while that for hay fever ranged from 7 to 16 years. Risk estimates for the TRAP pollutants NO2 and PM2.5 were standardized to increment increases of 10 µg/m3 and 2 µg/m3, respectively. The p-values for the χ2 test of heterogeneity were not provided.
Random-effects meta-analysis revealed no association (1.00 [95% CI: 0.98–1.02]; I2 = 49%) between NO2 and sensitization to any allergen, based on six primary studies, three of which were positive, including one that was statistically significant. When sensitization was restricted to aeroallergens, borderline-significant positive associations were observed for both NO2 (1.02 [95% CI: 0.92–1.13]; I2 = 51%) and PM2.5 (1.05 [95% CI: 1.00–1.11]; I2 = 0%). The pooled estimates were based on eight primary studies, of which five were positive but not statistically significant, for NO2 and on six primary studies, of which five were positive but also not statistically significant, for PM2.5.
Random-effects meta-analysis was also conducted for hay fever and indicated non-statistically significant positive associations for both TRAP pollutants. For NO2, three of the six studies included in the meta-analysis had positive associations, only one of which was statistically significant; the pooled OR was 1.01 (95% CI: 0.85–1.19; I2 = 62%). For PM2.5, two out of the five studies included in the meta-analysis had positive associations, one of which was statistically significant; the pooled OR was 1.02 (95% CI: 0.85–1.21; I2 = 55%).
In sensitivity analyses where the high-risk cohort and, for sensitivity to aeroallergens only, the cohort of very young children were excluded, the associations remained largely unchanged. Due to small reductions in the pooled estimates, however, there was no longer an association between NO2 and sensitization to aeroallergens and hay fever, with pooled estimates of 1.00 (95% CI: 0.89–1.13) and 1.00 (95% CI: 0.82–1.22), respectively.
Potential confounders were not addressed in Heinrich et al. (2016), although the authors did mention unmeasured confounders (e.g., SES, second-hand smoking, and allergic predisposition), in addition to other factors (e.g., urbanization and urban/rural mixture across cohorts), to help explain the moderate to high heterogeneity observed in the meta-analyses.
This SR-MA found positive but non-significant associations between key pollutants of TRAP and allergic outcomes with the exception of NO2 and sensitization to any allergens, where no association was found. No quantitative syntheses of PM2.5 and sensitization to any allergens or of the TRAP pollutants and eczema were conducted due to the limited number of primary studies, to variations in their methodology, or to a combination thereof. Overall, Heinrich et al. (2016) concluded that the evidence supporting an association between TRAP and hay fever and allergic sensitization was weak.
Bowatte et al. (2015) conducted an SR-MA of 11 birth cohort studies to investigate the association between early-childhood TRAP exposure and subsequent development of asthma, wheeze, allergic sensitization, eczema, and hay fever. Five population-based cohorts specifically examined allergic outcomes, namely, allergen sensitization (three cohorts), hay fever (three cohorts), and eczema (three cohorts). For allergen sensitization, IgE levels were measured in response to outdoor aeroallergens (three cohorts), indoor aeroallergens (two cohorts), and food allergens (two cohorts). Only results pertaining to these outcomes are discussed in this section. Four of the cohorts were European and one was North American; only the European cohorts were included in the quantitative analysis. Two cohorts had the longest follow-up of study participants, including measurements at the age of 8 years. The primary studies used a variety of exposure assessment techniques, including LUR (three cohorts), dispersion models (one cohort), and proximity to major roads (three cohorts). However, the review authors do not specify where TRAP exposures were assigned in the individual studies. The exposure range of the different pollutants measured in the included studies was not provided by Bowatte et al. (2015). In terms of potential confounders, each of the cohorts included adjustments for second-hand smoking and allergic predisposition (i.e., heredity).
Random-effects meta-analysis demonstrated mostly positive (three of four estimates) but non-significant associations between early-childhood exposure to NO2 and sensitization to various allergens. Risk estimates were calculated per increase of 10 µg/m3. For outdoor aeroallergens, only one of the three study-specific estimates included in the meta-analysis was positive and statistically significant; the pooled OR was 1.09 (95% CI: 0.88–1.36; I2 = 36.3%, p = 0.208). For indoor aeroallergens, both of the study-specific estimates included in the meta-analysis were negative and resulted in a pooled OR of 0.96 (95% CI: 0.74–1.25; I2 = 0.0%, p = 0.912). For food allergens at the ages of 4 and 8 years, the meta-analyses each included three study-specific estimates with positive associations, of which two from the age of 4 years were statistically significant; the pooled ORs demonstrated borderline-significant associations for food allergens at the age of 4 years (OR: 1.28 [95% CI: 0.98–1.68]; I2 = 44.0%, p = 0.181) or 8 years (OR: 1.19 [95% CI: 1.00–1.42]; I2 = 0.0%, p = 0.779). Similarly, positive associations were observed between early-childhood exposure to PM2.5 (per increase of 2 µg/m3) and sensitization to the same allergens. For outdoor aeroallergens, two of the three study-specific estimates included in the meta-analysis were positive, of which one was statistically significant; the pooled OR was 1.33 (95% CI: 0.94–1.88; I2 = 73.7%, p = 0.022). For indoor aeroallergens, one of the two study-specific estimates included in the meta-analysis was positive but did not reach statistical significance; the pooled OR was 1.00 (95% CI: 0.80–1.24; I2 = 0.0%, p = 0.649). For food allergens at the ages of 4 and 8 years, the meta-analyses each included two study-specific positive estimates, of which one from the age of 4 years was statistically significant; the pooled OR for food allergens at the age of 4 years was 1.26 (95% CI: 1.00–1.60; I2 = 44.0%, p = 0.181) and at the age of 8 years was 1.18 (95% CI: 1.00–1.39; I2 = 0.0%, p = 0.474).
Meta-analysis was not performed on studies reporting hay fever or eczema as outcomes because of differences in the reporting of the outcome measures. Most of the associations between exposure to TRAP and eczema or hay fever were positive (11/13 and 12/13, respectively) for the three cohorts.
Overall, this SR-MA demonstrated a trend of positive associations between allergic sensitization and TRAP exposure, but in most instances, the risk estimates were not statistically significant. The strongest associations were observed for food allergens. There is also some evidence that childhood exposure to TRAP may be associated with an increased risk of eczema and hay fever. While study quality according to the Newcastle–Ottawa scale was considered in Bowatte et al. (2015), no sensitivity analysis, based on study quality, was done, and no RoB was considered in the meta-analysis.
3.3.2 Systematic reviews
Koppen et al. (2011) systematically reviewed cohort studies that examined the relationship between respiratory and allergy symptoms in children and early exposure to TRAP. In addition to the studies described below, this review included a more recent study on the GINI & LISA cohorts and provided the first report on the FLEHS birth cohort; however, most risk estimates were not reported by the review authors. With respect to confounders, the review authors noted that all studies collected information on at least the key factors, including parental history of atopy, SES, environmental tobacco smoke at home, home dampness, visible indoor mould, and keeping of pets. From the GINI & LISA cohorts, several positive associations between TRAP exposure (i.e., distance to nearest main road, PM2.5 absorbance, and NO2) and allergy symptoms and allergic sensitization were observed in children living in metropolitan Munich. Only one positive association (it is unknown whether it was statistically significant) was observed between PM2.5 absorbance and eczema prevalence in 6-year-old children living in a small town with low pollution levels. Preliminary results from the FLEHS birth cohort indicated that a positive skin prick test in 3-year-old children, most of whom reacted to grass pollen or dust mite, was significantly and positively associated with NO2 exposure in the first three months of life. The review authors did not make any conclusions with respect to allergy based on their review of the literature, since the primary focus of the publication was TRAP and respiratory health.
Bråbäck and Forsberg (2009) conducted a systematic review of the evidence from prospective studies in children in order to evaluate the role of long-term exposure to TRAP in the development of asthma and allergic sensitization. Five studies stemming from European birth cohorts, including GINI & LISA, BAMSE, PIAMA, and Oslo, specifically considered allergic sensitization as an outcome, but the nature of the allergens considered differed between the cohorts. These studies used dispersion modelling and regression models to assess exposure to NO2, PM2.5, NOx, traffic PM, and PM10. Similar levels of outdoor air pollution were reported for each of the birth cohorts. The review authors noted that the studies from the GINI & LISA, BAMSE, and PIAMA cohorts included adjustments for important confounding variables (no details provided). Three of the studies were also included in the meta-analysis conducted by Bowatte et al. (2015) (reviewed above in section 3.3.1). While no association between long-term exposure to TRAP and sensitization to any allergen was observed in older schoolchildren (10 to 11 years old) in Oslo, Norway, studies stemming from the GINI & LISA, BAMSE, and PIAMA cohorts found an increased risk of allergic sensitization associated with TRAP in children aged 4 to 6 years. The nature of the allergens differed between cohorts; TRAP was associated with sensitization to outdoor allergens in the GINI & LISA and BAMSE cohorts and with food allergens in the PIAMA cohort. Additionally, a study from the BAMSE cohort found that variants in the glutathione S-transferase P1 (GSTP1) and tumour necrosis factor (TNF) genes modified the association between sensitization and NOx in 4-year-old children, leading Bråbäck and Forsberg (2009) to speculate that traffic-related effects on sensitization could be limited to individuals with a specific genetic polymorphism and would therefore be difficult to detect in a large population. Overall, Bråbäck and Forsberg (2009) concluded that, while a growing body of evidence suggests that TRAP may induce sensitization, few cohort studies have assessed effects on sensitization, and the findings were not consistent.
3.3.3 Summary/conclusion
Two SR-MAs examined the association between early-childhood TRAP exposure and subsequent allergic health outcomes in children. The primary studies considered in these SR-MAs were conducted in North America and Europe; thus, the results are considered relevant for a Canadian assessment with respect to air pollutant mixture, standard of living, health care, climate, and so on. Heinrich et al. (2016) expanded on the earlier SR-MA of birth cohorts conducted by Bowatte et al. (2015) by including additional primary studies and individual estimates from pooled analyses; Heinrich et al. (2016) also included a longer follow-up period, which, for hay fever, continued into adolescence. The two SR-MAs also differed in the scope of their quantitative analyses; Heinrich et al. (2016) considered allergic sensitization to any allergens and sensitization to aeroallergens, while Bowatte et al. (2015) separated allergic sensitization into outdoor aeroallergens, indoor aeroallergens, food allergens at age 4, and food allergens at age 8. While no association was observed between NO2 and sensitization to any allergens, Heinrich et al. (2016) and Bowatte et al. (2015), respectively, identified positive but non-significant pooled estimates of the association between TRAP pollutants (i.e., NO2 and PM2.5) and allergic sensitization to aeroallergens or outdoor aeroallergens. Furthermore, Bowatte et al. (2015) reported positive but non-significant pooled estimates of the association between childhood exposure to TRAP pollutants and sensitization to food allergens; no positive association was identified for indoor aeroallergens and TRAP pollutants. For hay fever, the pooled estimates in Heinrich et al. (2016) indicated non-statistically significant positive associations for both TRAP pollutants, which is consistent with findings from Bowatte et al. (2015) that there is some evidence that childhood exposure to TRAP may be associated with increased risks of hay fever. Overall, these two SR-MAs suggest that exposure to TRAP has some positive associations with the development of allergies in children; however, the evidence to date is weak and limited.
Both SR-MAs are more recent than the qualitative reviews identified during the scoping review process. Bowatte et al. (2015) built on an earlier qualitative review by Bråbäck and Forsberg (2009), which found that, while there is a lack of consistency between exposure–response associations and the nature of allergens considered in a few cohorts, a growing body of evidence indicated a possible link between TRAP or near-roadway exposures and sensitization in children. Koppen et al. (2011) also reviewed the relevant studies but did not make any conclusions with respect to allergy, as it was not the primary focus of the publication.
3.4 Lung function
One SR-MA (Barone-Adesi et al. 2015) and two systematic reviews (Schultz et al. 2017; Götschi et al. 2008) evaluating the association between TRAP and lung function were identified during the scoping review. Measures of lung function that were evaluated include forced expiratory volume in one second (FEV1), forced vital capacity (FVC), peak expiratory flow (PEF), forced expiratory flow between the 25th and 75th percentile of FVC (FEF25–75), and maximal mid-expiratory flow (MMEF).
3.4.1 SR-MAs
Barone-Adesi et al. (2015) conducted an SR-MA of cross-sectional associations between TRAP exposure and lung function in children and adolescents. Outdoor NO2 was selected by the authors as a convenient marker of primary TRAP, and in the included primary studies, the risk estimates were quantified based on increments of NO2. Only primary studies that represented a long-term exposure period (one year or longer) were included in the analysis. The 13 primary studies included in the review were conducted in Europe (eight studies), North America (four studies), and Asia (one study), and the study subjects ranged in age from 4 to 16 years, with most studies including children 8 to 12 years old. All studies except one had some adjustments for passive smoking in the home and SES. Each of the six primary studies that evaluated absolute difference in FEV1 indicated an inverse relationship with NO2 exposure, and two of them reached statistical significance. The primary studies used a variety of exposure assessment techniques, including fixed monitoring stations (two studies), dispersion models (two studies), and LUR models (two studies). Mean NO2 varied from 13 to 50 µg/m3 across all the studies. Random-effects meta-analysis demonstrated a significant effect of NO2 on absolute difference in FEV1, with an effect size of −8 mL (95% CI: −14 to −1 mL) per 10 µg/m3 increase in NO2 (p = 0.016 for the effect estimate; I2 = 32%, p-value not provided for heterogeneity). Sensitivity analysis by exposure assessment method for absolute difference in FEV1 did not indicate heterogeneity between the studies on this basis (p = 0.66). Additionally, the authors identified nine primary studies that evaluated the reduction in FEV1 expressed as a percentage of the predicted value. Of these studies, seven indicated an inverse relationship with NO2 exposure, and one study reached statistical significance. Eight of the primary studies used LUR for exposure assessments, and dispersion modelling was used in one study. Random-effects meta-analysis demonstrated a small but significant effect on FEV1 of −0.7% (95% CI: −1.1% to −0.3%) per 10 µg/m3 increase in NO2 (p = 0.001 for the effect estimate; I2 < 1%, p-value not provided for heterogeneity). Exclusion of the one dispersion modelling study did not appreciably alter the results.
The review authors also conducted a sensitivity analysis considering subjects with and without a diagnosis of asthma. For studies of absolute difference in FEV1, in subjects without a diagnosis of asthma, the pooled effect estimate for NO2 was −14 mL per 10 µg/m3 (95% CI: −26 to −3 mL; p = 0.01 for the effect estimate), while no association was found for subjects with a diagnosis of asthma (pooled effect size of 1 mL [95% CI: −15 to 17 mL]; p = 0.90 for the effect estimate). Similar results were observed when the percentage change in FEV1 was considered. A pooled estimate of −0.9% (95% CI: −1.4% to −0.4%; p = 0.001 for the effect estimate) was found for subjects without a diagnosis of asthma, while for subjects with a diagnosis of asthma, no association was found (−0.5% [95% CI: −1.9% to 1%], p = 0.51 for the effect estimate). These results indicate that the subclinical effects of TRAP exposure are not limited to susceptible populations. Of note, asthma medication use in the study subjects may have limited the ability to detect a difference in measures of lung function in the asthmatic group.
Overall, this SR-MA reported a significant cross-sectional association between long-term exposure to TRAP and reduction in lung function in children and adolescents. Funnel plots were symmetrical, and neither Begg's nor Egger's tests indicated a small-study or publication bias, although the small number of studies would have limited the statistical power to detect this. Of the studies considered in the meta-analyses, all but one had adjusted for passive smoking at home and SES, both of which are key confounders for the association under evaluation.
3.4.2 Systematic reviews
Schultz et al. (2017) conducted a systematic review of epidemiological studies evaluating the effect of TRAP exposure on lung function in children and adolescents. The review identified 32 cross-sectional studies and 12 longitudinal cohort studies. Almost all the primary studies reported a negative association between measures of lung function and TRAP exposure, although not all estimates reached a level of significance. No details on adjustments for confounding were provided by the review authors. Of the 32 studies, only six cross-sectional studies had null findings. The primary studies used a variety of exposure assessment methods, including LUR, dispersion modelling, monitoring, traffic counts, and distance to roadways. Considering the different lung function measurements, a greater effect estimate was observed for FEV1 than for FVC in several studies, although some studies reported the greatest estimates for measures of FVC or FEF25–75. Exposure to TRAP was associated with relatively small lung function deficits, which ranged from 0.5% to 3%. The review authors noted that these deficits would be associated with only minor physiological effects in an individual, but when a population is considered, these deficits would be anticipated to increase the prevalence of people with lung function below clinical thresholds. The longitudinal studies also indicated an association between TRAP exposure and reduced lung function growth; however, many of these studies were focused on school-aged children, and thus the potential impacts of early-life exposures are undetermined. An evaluation of the primary studies by timing of exposure (e.g., early life or childhood) was inconclusive with respect to indicating a period of increased susceptibility. Any exposure to TRAP over the entire age range in childhood may have an impact on lung function. Also, recovery of lung function has been reported when exposure is decreased. The evaluation of effect estimates by sex was inconclusive, with the number of studies reporting greater impacts in boys than in girls almost equal to the number reporting the opposite. There was limited evidence that asthma may be an effect modifier of the association between TRAP and lung function, since several studies indicated a strong association in subjects with asthma. The evidence that allergies or sensitization status may be effect modifiers of the relationship between TRAP and lung function was inconclusive. Overall, the systematic review led to the conclusions that early-life and childhood exposures to TRAP can lead to reduced lung function at least until adolescence and that these effects can be observed with exposure at any time over the age range in childhood. The review authors noted that further evaluations of the cohorts into adulthood are needed to determine whether the lung function deficits persist.
Götschi et al. (2008) conducted a systematic review of studies evaluating the long-term effects of air pollution on lung function. The review included several studies based on traffic-specific exposures. The review authors considered only studies that evaluated four or more communities or had individually assigned exposures, so as to reduce any distortion from errors in exposure measurements or confounding from community-level factors. For cross-sectional studies in children, three of the seven studies that were reviewed indicated a negative association (two studies reached a level of significance) between measures of traffic and lung function, while one study reported a positive association with lung function. In the three studies that did not detect any association with lung function, traffic exposure was associated with an increase in respiratory symptoms. An additional cross-sectional study found reduced improvement in lung function in East German children, who were living within 50 m of a busy street, eight years after reunification. One longitudinal study in children reported significant deficits in lung function growth (FEV1 and MMEF) over an eight-year period for children living within 500 m of a freeway. For cross-sectional studies in adults, both studies reported a significant reduction in FEV1 and FVC with increased traffic density and proximity to traffic. Both studies indicated a greater effect of traffic on lung function in women, with one study also detecting a greater risk of COPD (FEV1/FVC < 0.7) in women. In comparison, one longitudinal study did not detect any differences in or changes in lung function over a three-year period in women in relation to TRAP exposure. Overall, the review concluded that the studies suggested a link between traffic exposure and reduced lung function in children and adults, while noting that most studies included adjustments for personal factors (e.g., smoking), but that not all the studies accounted for SES or other community-level factors in their analysis.
3.4.3 Summary/conclusion
Overall, the evidence indicates that exposure to TRAP has a negative impact on lung function. The SR-MA by Barone-Adesi et al. (2015) quantified a significant reduction in measures of lung function in children and adolescents based on cross-sectional studies. This result is in agreement with the conclusion of the more recent systematic review by Schultz et al. (2017), which identified a negative association between TRAP exposure and measures of lung function in children and adolescents and that the deficits can occur with exposure at any age range of childhood in cross-sectional studies. Schultz et al. (2017) also identified a potential association between reduced lung function growth in children and adolescents and TRAP exposure in cohort studies. An earlier systematic review by Götschi et al. (2008) indicated a link between TRAP or near-roadway exposures and reduced lung function in both children and adults. In addition, since the majority of the primary studies considered in the SR-MA and systematic reviews were conducted in North America and Europe, the results are considered relevant for a Canadian assessment with respect to air pollutant mixture, standard of living, health care, climate, and so on.
Chapter 4. Risk characterization and evaluation of causality
4.1 Asthma
4.1.1 Evidence from the umbrella review
Five SR-MAs evaluating the potential link between exposure to TRAP and asthma were identified in the scoping review or subsequently during the external review process; those SR-MAs were all limited to studies in children and adolescents, because of either the specific objective of the systematic review or the availability of primary studies meeting the eligibility criteria. Primary studies included in the SR-MAs were conducted mainly in Europe and North America, with a smaller number of studies from Asia included in three of the SR-MAs. As such, the results from the SR-MAs were considered relevant to a Canadian assessment, given the similarities in air pollution mixture, standard of living, health care, climate, and so on between Canada, the United States, and European countries. Additionally, the primary articles were based mainly on analyses of birth cohort studies providing a temporal sequence for the observed health effects. For quantitative analysis, each of the SR-MAs was limited to primary studies that had reported measured or modelled concentrations of components of TRAP (e.g., NO2 and PM). A variety of exposure assessment methods were used in the primary studies, including LUR, dispersion modelling, and monitoring.
Overall, the five SR-MAs consistently reported positive pooled estimates of the association of TRAP with asthma incidence and prevalence in childhood. Forest plots of the pooled ORs for asthma incidence and prevalence in childhood were constructed to demonstrate the consistency, strength, and biological gradient of the associations between these health effects and TRAP. The forest plots for NO2, PM2.5, BC, and PM10 are provided in Figures 4.1 through 4.4, respectively. The pooled estimates for a standardized increment of 10 µg/m3 of NO2 ranged from 1.08 to 1.21 for asthma incidence and from 1.05 to 1.06 for asthma prevalence and were all statistically significant or borderline significant. Similarly, the pooled estimates for a standardized increment of 1 µg/m3 of PM2.5 ranged from 1.03 to 1.07 for asthma incidence and were all statistically significant or borderline significant. Only one pooled estimate of PM2.5, at 1.01, was identified for asthma prevalence; that estimate was borderline significant. For BC and PM10, the pooled estimates for asthma incidence ranged from 1.08 to 1.17 (standardized to an increment of 0.5 × 10⁻⁵/m) and 1.04 to 1.09 (standardized to an increment of 2 µg/m3), respectively; each of the standardized pooled estimates for BC and PM10 were statistically significant or borderline significant. For asthma prevalence, no pooled estimate was identified for BC, and one pooled estimate indicating a null association was identified for PM10. Of note, the strongest associations of TRAP with asthma incidence and prevalence in childhood were observed for NO2 and BC. Nitrogen dioxide is considered to be the most direct measure of TRAP, since local traffic sources have been reported to contribute up to 80% of ambient NO2 (reviewed in Khreis and Nieuwenhuijsen 2017), while BC is strongly associated with diesel vehicle traffic (Richmond-Bryant et al. 2009).
Figure 4.1 Forest plot of pooled ORs from SR-MAs for asthma incidence and asthma prevalence in childhood standardized to an increment of 10 µg/m3 of NO2; n represents the number of studies included in the meta-analysis, and I2 represents the heterogeneity.

Text description
Figure 4.1 depicts a forest plot of pooled ORs from SR-MAs for childhood asthma incidence (at the top) and childhood asthma prevalence (at the bottom) that have been standardized to an increment of 10 µg/m3 of NO2. The x-axis representing pooled estimates and 95% CI ranges from 0.95 to 1.35. The following information is depicted in this figure:
| Health endpoint | Data marker | Pooled OR (95% CI) | n | I2 | Reference |
|---|---|---|---|---|---|
| Asthma incidence | A1 (any age) | 1.13 (1.06–1.20) | 20 | 65% | Khreis et al. (2017) |
| Asthma incidence | A2 (≤6 years) | 1.21 (1.10–1.33) | 7 | 26% | Khreis et al. (2017) |
| Asthma incidence | A3 (>6 years) | 1.08 (1.00–1.16) | 14 | 62% | Khreis et al. (2017) |
| Asthma incidence | B | 1.08 (0.96–1.20) | 10 | 50% | Heinrich et al. (2016) |
| Asthma incidence | C | 1.09 (0.96–1.23) | 5 | 75.5% | Bowatte et al. (2016) |
| Asthma incidence | D1 | 1.14 (1.06–1.24) | 3 | 0.0% | Gasana et al. (2012) |
| Asthma prevalence | E | 1.06 (1.00–1.11) | 18 | 32.8% | Favarato et al. (2014) |
| Asthma prevalence | D2 | 1.05 (1.00–1.11) | 6 | 0.0% | Gasana et al. (2012) |
Figure 4.2 Forest plot of pooled ORs from SR-MAs for asthma incidence and asthma prevalence in childhood standardized to an increment of 1 µg/m3 of PM2.5; n represents the number of studies included in the meta-analysis, and I2 represents the heterogeneity.
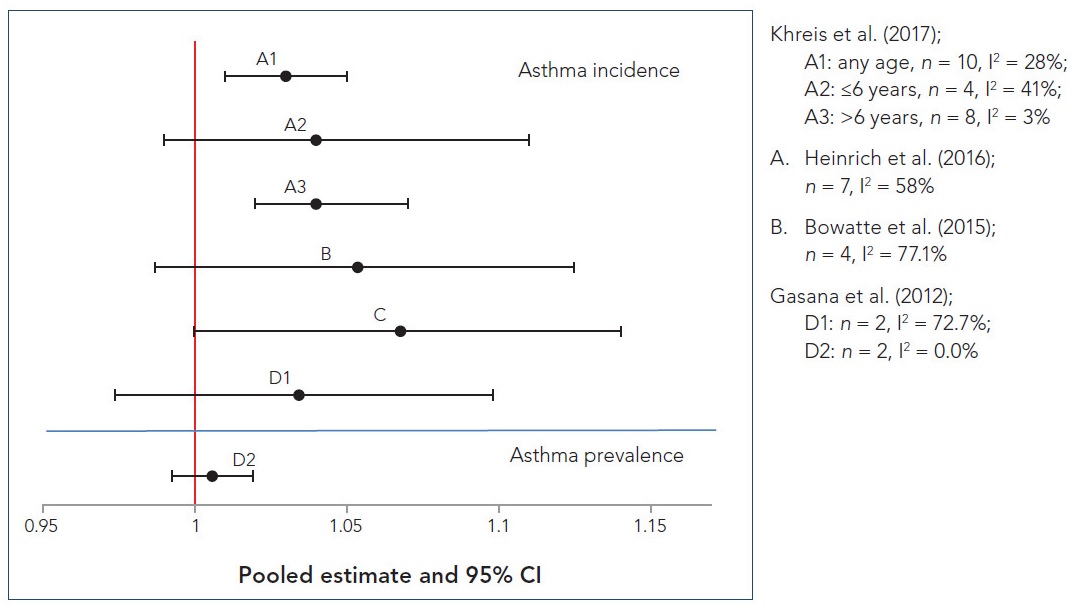
Text description
Figure 4.2 depicts a forest plot of pooled ORs from SR-MAs for childhood asthma incidence (at the top) and childhood asthma prevalence (at the bottom) that have been standardized to an increment of 1 µg/m3 of PM2.5. The x-axis representing pooled estimates and 95% CI ranges from 0.95 to 1.15. The following information is depicted in this figure:
| Health endpoint | Data marker | Pooled OR (95% CI) | n | I2 | Reference |
|---|---|---|---|---|---|
| Asthma incidence | A1 (any age) | 1.03 (1.01–1.05) | 10 | 28% | Khreis et al. (2017) |
| Asthma incidence | A2 (≤6 years) | 1.04 (0.99–1.11) | 4 | 41% | Khreis et al. (2017) |
| Asthma incidence | A3 (>6 years) | 1.04 (1.02–1.07) | 8 | 3% | Khreis et al. (2017) |
| Asthma incidence | B | 1.05 (0.99–1.12) | 7 | 58% | Heinrich et al. (2016) |
| Asthma incidence | C | 1.07 (1.00–1.14) | 4 | 77.1% | Bowatte et al. (2016) |
| Asthma incidence | D1 | 1.03 (0.97–1.10) | 2 | 72.7% | Gasana et al. (2012) |
| Asthma prevalence | D2 | 1.01 (0.99–1.02) | 2 | 0.0% | Gasana et al. (2012) |
Figure 4.3 Forest plot of pooled ORs from SR-MAs for asthma incidence in childhood standardized to an increment of 0.5 × 10⁻⁵/m of BC; n represents the number of studies included in the meta-analysis, and I2 represents the heterogeneity.
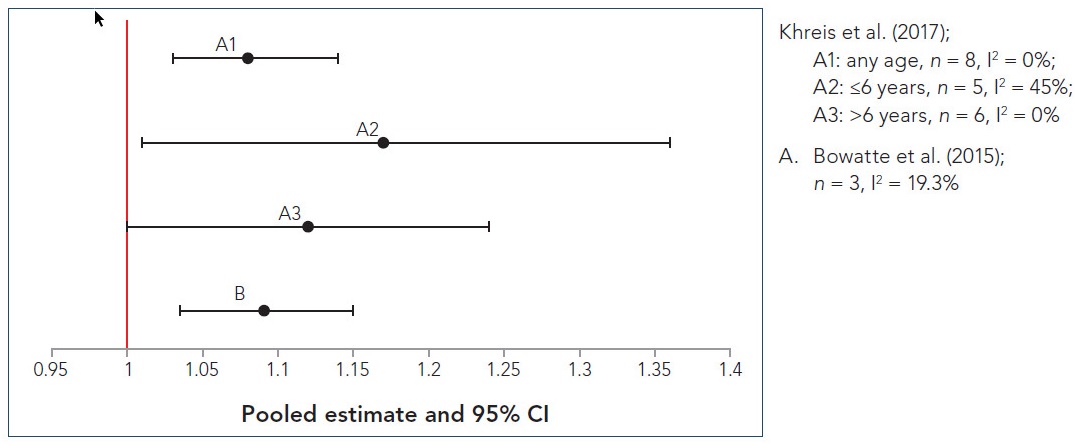
Text description
Figure 4.3 depicts a forest plot of pooled ORs from SR-MAs for childhood asthma incidence that have been standardized to an increment of 0.5 × 10⁻⁵/m of BC. The x-axis representing pooled estimates and 95% CI ranges from 0.95 to 1.4. The following information is depicted in this figure:
| Data marker | Pooled OR (95% CI) | n | I2 | Reference |
|---|---|---|---|---|
| A1 (any age) | 1.08 (1.03–1.14) | 8 | 0% | Khreis et al. (2017) |
| A2 (≤6 years) | 1.17 (1.01–1.36) | 5 | 45% | Khreis et al. (2017) |
| A3 (>6 years) | 1.12 (1.00–1.24) | 6 | 0% | Khreis et al. (2017) |
| B | 1.09 (1.04–1.15) | 3 | 19.3% | Bowatte et al. (2016) |
Figure 4.4 Forest plot of pooled ORs from SR-MAs for asthma incidence and asthma prevalence in childhood standardized to an increment of 2 µg/m3 PM10; n represents the number of studies included in the meta-analysis and I2 represents the heterogeneity.
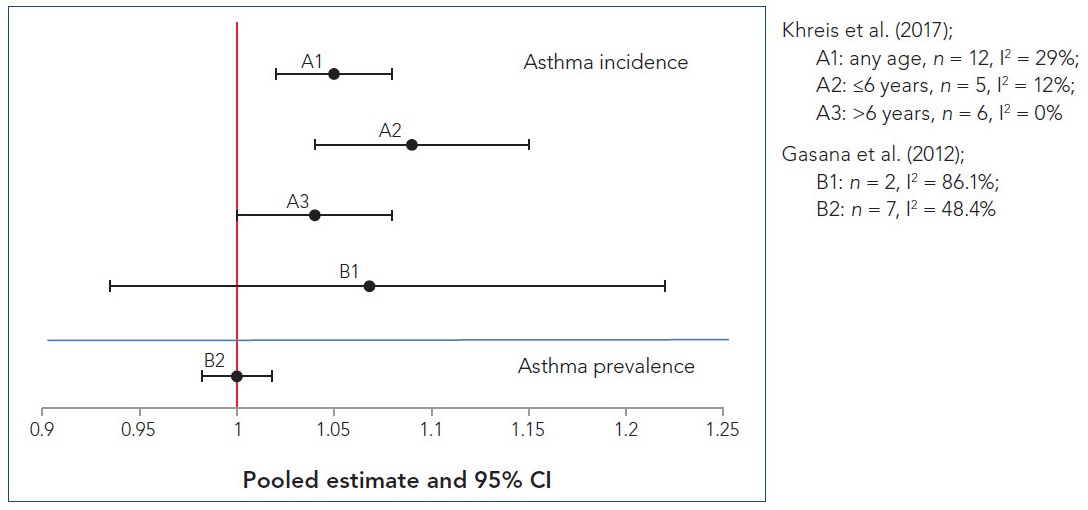
Text description
Figure 4.4 depicts a forest plot of pooled ORs from SR-MAs for childhood asthma incidence (at the top) and childhood asthma prevalence (at the bottom) that have been standardized to an increment of 2 µg/m3 of PM10. The x-axis representing pooled estimates and 95% CI ranges from 0.9 to 1.25. The following information is depicted in this figure:
| Health endpoint | Data marker | Pooled OR (95% CI) | n | I2 | Reference |
|---|---|---|---|---|---|
| Asthma incidence | A1 (any age) | 1.05 (1.02–1.08) | 12 | 29% | Khreis et al. (2017) |
| Asthma incidence | A2 (≤6 years) | 1.09 (1.04–1.15) | 5 | 12% | Khreis et al. (2017) |
| Asthma incidence | A3 (>6 years) | 1.04 (1.00–1.08) | 6 | 0% | Khreis et al. (2017) |
| Asthma incidence | B1 | 1.07 (0.93–1.22) | 2 | 86.1% | Gasana et al. (2012) |
| Asthma prevalence | B2 | 1.00 (0.98–1.02) | 7 | 48.4% | Gasana et al. (2012) |
With respect to potential sensitive sub-populations, there was some evidence of an age-related effect. In the stratified analyses done by Khreis et al. (2017), there was an indication of a potentially greater sensitivity for children 6 years of age or younger following exposure to NO2, BC, and PM10. Bowatte et al. (2015) also noted a trend of increasing risk of asthma incidence from the ages of 1 to 6 years for NO2 and BC, but this age-specific analysis was based on meta-analyses that only included one to three cohorts per age group, and thus limiting the robustness of the results. Other factors resulting in increased susceptibility were not adequately assessed or identified in the analyses.
Moderate to substantial heterogeneity was reported for most of the analyses, especially for NO2 and PM2.5, which may be due to methodological differences among the primary studies, including exposure assessment methodologies, definition of health outcomes, and adjustment for confounders and covariates. To address the moderate to substantial heterogeneity, results from the random-effects meta-analyses were considered most appropriate. Each of the SR-MAs used the risk estimates that accounted for key confounders (e.g., smoking, SES, and hereditary factors) when the adjusted risk estimates were available from the primary studies, and most primary studies had some level of adjustment. Nonetheless, the differences in confounder adjustments between the primary studies are anticipated to reduce the precision of (i.e., result in wider confidence intervals for) the pooled effect estimates. An additional key limitation of the primary studies, noted in the SR-MAs, was reliance on questionnaires and self- or parental reporting of health outcomes.
The systematic reviews and selected other reviews evaluated in the umbrella review provide evidence with respect to TRAP exposure and asthma prevalence. Most of these reviews were similarly focused on studies from birth and childhood cohorts and consistently identified a positive association of TRAP exposure with asthma symptoms and asthma prevalence; significant results were reported in some of the primary studies (Koppen et al. 2011; Bråbäck and Forsberg 2009; Boothe and Shendell 2008; Salam et al. 2008), with Koppen et al. (2011) concluding that there was a causal association between TRAP exposure and childhood asthma symptoms. An increased risk of asthma symptoms and TRAP exposure was noted in studies conducted in numerous countries and using different exposure metrics (e.g., LUR modelling, dispersion modelling, traffic measures, and monitoring). While only studies that quantified pollutant concentrations were included in the SR-MAs, these reviews took into account a larger number of studies due to the inclusion of studies with traffic measures. The systematic reviews and selected other reviews focused on asthma prevalence, since the evidence was insufficient for these reviews to evaluate asthma incidence. Of note, most of these reviews were published before the SR-MAs and evaluated an older literature database consisting of more cross-sectional analyses from the cohorts, rather than analyses with a longitudinal design.
There are a limited number of studies, with mixed results, that have evaluated TRAP and asthma outcomes specifically in adults, with one systematic review focused on adult-onset asthma (Jacquemin et al. 2012) and one systematic review that included asthma prevalence in adults (Salam et al. 2008). For adult-onset asthma, while positive associations were observed, there were some inconsistencies between studies (e.g., sensitivity in males vs. females and atopic vs. non-atopic subjects). Additionally, potential confounding from occupational exposures and the remission of childhood asthma limit the ability to make conclusions regarding asthma incidence in adults. For asthma prevalence, positive associations were observed mainly with measures of traffic proximity and density, and not with pollutant concentrations, limiting the overall strength of the evidence.
4.1.2 Experimental evidence from other assessments
To further examine the relationship between TRAP exposure and asthma identified in the umbrella review, relevant aspects from the assessment of traffic exhaust, the main components of TRAP, or both by Health Canada, the HEI, and the US EPA were reviewed to identify their conclusions regarding this health endpoint based on in vitro studies, animal toxicology studies, and controlled human exposure studies. Although many of these studies consider short-term exposure periods, the biological responses observed are informative in that they provide mechanistic insight into possible pathways that can lead to the effects observed in the long-term epidemiology studies. A summary of the findings providing biological and mechanistic evidence relevant to the associations identified in the epidemiological evidence base is presented below to establish biological plausibility.
In the HEI's assessment of TRAP (HEI Panel on the Health Effects of Traffic-Related Air Pollution 2010), limited information from panel studies indicated that short-term exposure to TRAP increased symptoms of asthma, including inflammation and airway acidification, in asthmatic adults and that the effects were greater following challenge with an allergen. Additionally, a minor inflammatory response was observed in rat alveolar macrophages after exposure to TRAP in vivo and in a lung epithelial cell line.
In Health Canada's assessment of DE (2016a) and GE (2017), several controlled human exposure studies reported increased symptoms of adverse respiratory outcomes, including inflammation, airway resistance, altered lung function, and oxidative response, in both healthy and asthmatic adults following DE exposure. Similar results, including increased inflammation and airway reactivity, were also observed in experimental animal studies. Correspondingly, the review by the HEI Panel on the Health Effects of Traffic-Related Air Pollution (2010) noted that exposure to high concentrations of DE resulted in increases in markers of inflammation (e.g., neutrophils, mast cells, and lymphocytes) in healthy individuals and that short-term DE exposure increased airway hyperresponsiveness (AHR) in asthmatic individuals. In Health Canada's risk assessment of GE (2017), studies in various experimental animals reported increases in markers of oxidative stress and in the inflammatory response (e.g., cytokines, macrophages, and eosinophils) in the respiratory tract following GE exposure. A small number of animal studies also reported that AHR was exacerbated after exposure to gasoline exhaust particles (GEP). Similarly, in vitro studies in lung cell lines found increases in inflammation and oxidative stress following exposure to GE or GEP (Health Canada 2017).
For the specific components of TRAP, both Health Canada's NO2 risk assessment (2016b) and the US EPA's ISA of NO2 (2016) reported increased AHR in asthmatic children and asthmatic adults exposed to ambient levels of NO2. The US EPA (2016) also determined that exposure to NO2 resulted in an increased inflammatory response in controlled human exposure studies. For animal toxicology studies, Health Canada (2016b) noted increased AHR, increased markers of inflammation (e.g., cytokines, eosinophils, and neutrophils), and increased oxidative stress in the respiratory tract of animal models exposed to NO2 at levels greater than ambient. Although the US EPA (2016) similarly reported that NO2 exposure caused increases in inflammatory markers, this assessment noted that the effects of NO2 on oxidative stress were mixed.
Both Health Canada's risk assessment of PM2.5 (2013) and the US EPA's ISA of PM (2009) identified mixed results, from controlled human exposure studies, as to the effect of concentrated ambient particles (CAPs) on respiratory tract inflammation. In addition, the US EPA (2009) determined that there was evidence of an oxidative stress response in respiratory tract tissue after exposure to ambient levels of PM. In animals, Health Canada (2013) reported that PM exposure led to an inflammatory response characterized by increases in cytokines, neutrophils, and macrophages, and, in one study, an increase in AHR. Ambient PM exposure also resulted in an inflammatory response, marked by increases levels of cytokines, in respiratory cell lines. Similarly, the US EPA (2009) noted that the majority of the studies in experimental animals reported increases in markers of inflammation and oxidative stress in the lungs. In the HEI's TRAP assessment (HEI Panel on the Health Effects of Traffic-Related Air Pollution 2010), mixed results were observed in a pair of controlled human exposure studies that analyzed the effects of exposure to CAPs on the inflammatory response in the respiratory tract of healthy adults. The HEI reported that the majority of experimental studies reviewed found that animals exposed to PM exhibited an increased inflammatory response in the respiratory tract tissue.
Overall, there is a large database of experimental studies, including controlled human exposure studies, experimental animal studies, and in vitro studies, that have evaluated the effects of exposure to TRAP or its component pollutants on biomarkers and symptoms of asthma, providing coherence to the epidemiological evidence. A large number of studies reported that exposure to TRAP or its components resulted in an inflammatory response in the respiratory system. Several studies also noted increased AHR and markers of oxidative stress after exposure. The HEI Panel on the Health Effects of Traffic-Related Air Pollution (2010) has proposed a possible mechanism of action: components of TRAP enter the respiratory tract and cause oxidative stress reactions, resulting in the generation of free radicals, including reactive oxygen species (ROS). Subsequently, the ROS elicit an inflammatory response, including the generation of more ROS, eventually leading to damage to the lung tissues.
4.1.3 Determination of causality
Based on the following lines of evidence—(i) the significant associations between TRAP exposure and asthma incidence in children from the SR-MA by Khreis et al. (2017), with support from the SR-MAs by Gasana et al. (2012) and Bowatte et al. (2015) identifying significant or borderline-significant associations between asthma incidence in children and TRAP exposure ; (ii) the fact that the strongest associations were observed for NO2 and BC, given that NO2 is considered to be the most direct measure of TRAP and BC is a marker for diesel vehicle traffic; and (iii) supporting experimental evidence that TRAP or its components can induce airway inflammation and oxidative stress, airway reactivity, and AHR in controlled human exposure studies and in experimental animal studies— it is concluded that there is sufficient evidence of a causal relationship between TRAP exposure and asthma incidence in children.
Based on the following lines of evidence—(i) the significant or borderline-significant associations between TRAP exposure and asthma prevalence in children from the SR-MAs by Favarato et al. (2014)and Gasana et al. (2012) and several systematic reviews (without meta-analysis) consistently identifying positive associations of TRAP exposure with asthma symptoms and asthma prevalence, with significant results reported in some of the primary studies; (ii) the fact that the strongest associations were observed for NO2, given that NO2 is considered to be the most direct measure of TRAP; and (iii) supporting experimental evidence from panel studies, controlled human exposure studies, and experimental animal studies indicating that exposure to TRAP or its components can exacerbate asthma symptoms and induce airway inflammation and oxidative stress, airway reactivity, and AHR— it is concluded that there is sufficient evidence of a causal relationship between TRAP exposure and asthma prevalence in children.
Based on the following lines of evidence—(i) the association between TRAP exposure and asthma incidence in adults, limited by inconsistencies and potential confounding, evaluated in one systematic review (Jacquemin et al. 2012); and (ii) supporting experimental evidence that TRAP or its components can induce airway inflammation and oxidative stress, airway reactivity, and AHR in controlled human exposure studies and in experimental animal studies— it is concluded that there is inadequate evidence to infer a causal association between TRAP exposure and asthma incidence in adults.
Based on the following lines of evidence—(i) the association between asthma prevalence in adults and traffic measures, but not between asthma prevalence and pollutant concentrations, from two systematic reviews (Jacquemin et al. 2012; Salam et al. 2008); and (ii) supporting experimental evidence from panel studies, controlled human exposure studies, and experimental animal studies indicating that exposure to TRAP or its components can exacerbate asthma symptoms and induce airway inflammation and oxidative stress, airway reactivity, and AHR— it is concluded that the evidence is suggestive of, but not sufficient to infer, a causal relationship between TRAP exposure and asthma prevalence in adults.
A plausible mechanism of action for TRAP or its components, leading to asthma incidence and prevalence, is that the effects are mediated through oxidative stress and inflammatory response in the respiratory tract, which induces airway dysfunction.
4.2 Allergy
4.2.1 Evidence from the umbrella review
Two SR-MAs evaluating the potential link between exposure to TRAP and allergic outcomes were identified in the scoping review or subsequently during the external review process; those SR-MAs were limited to studies in children and adolescents. Primary studies included in the SR-MAs were conducted in Europe and North America. As such, the results from the SR-MAs were considered relevant to a Canadian assessment, given the similarities in air pollution mixture, standard of living, health care, climate, and so on. For quantitative analysis, each SR-MA was limited to primary studies that had reported modelled concentrations of components of TRAP (e.g., NO2 and PM2.5). Exposure assessment methods, including LUR and, to a lesser extent, dispersion modelling, were used in the primary studies. Additionally, the primary articles were based mainly on analyses of birth cohort studies providing a temporal sequence for the observed health effects.
Overall, there is some evidence to suggest that exposure to TRAP is positively associated with allergies in children, but the evidence to date is weak and limited with respect to overall consistency and the strength of the association. A tabulation of the pooled ORs, per increment of NO2 or PM2.5, pertaining to allergic outcomes is provided in Table 4.1. No association was observed between NO2 and sensitization to any allergens. However, when sensitization was restricted to specific allergens (e.g., aeroallergens, outdoor aeroallergens, and food allergens at ages 4 and 8), with the exception of indoor aeroallergens, positive associations that were mostly borderline significant were observed between the TRAP pollutants (i.e., NO2 and PM2.5) and the allergens examined. The strongest associations were consistently observed for sensitization to food allergens at both age 4 and age 8. However, the majority of the pooled estimates were based on only two or three cohort studies, and thus the robustness of the results was limited. Additionally, moderate to high heterogeneity was observed with both NO2 and PM2.5 for many of the allergic outcomes; this may be due to methodological differences among the primary studies, including the degree of urbanization, the mixture between urban and rural areas considered for each cohort, and unmeasured confounding by SES, second-hand smoking, and allergic predisposition (heredity). Although random-effects meta-analyses were considered most appropriate to address the moderate to substantial heterogeneity, these differences are anticipated to reduce the precision of (i.e., result in wider confidence intervals for) the pooled effect estimates. An additional key limitation of the primary studies, noted in the SR-MAs, was reliance on questionnaires and self- or parental reporting of health outcomes.
| Allergic outcome | Number of included studies | Pooled OR (95% CI) |
Heterogeneity (I2) |
|---|---|---|---|
| NO2 (per 10 µg/m3) | |||
| Sensitization (any allergens)Table 4.1 Footnote a | 6 | 1.00 (0.98–1.02) | 49% |
| Sensitization (aeroallergens)Table 4.1 Footnote a | 8 | 1.02 (0.92–1.13) | 51% |
| Sensitization (outdoor aeroallergen)Table 4.1 Footnote b | 3 | 1.09 (0.88–1.36) | 36.3% |
| Sensitization (indoor aeroallergen)Table 4.1 Footnote b | 2 | 0.96 (0.74–1.25) | 0.0% |
| Sensitization (food allergen, age 4)Table 4.1 Footnote b | 2 | 1.28 (0.98–1.68) | 44.0% |
| Sensitization (food allergen, age 8)Table 4.1 Footnote b | 2 | 1.19 (1.00–1.42) | 0.0% |
| Hay feverTable 4.1 Footnote a | 6 | 1.01 (0.85–1.19) | 62% |
| PM2.5 (per 2 µg/m3) | |||
| Sensitization (aeroallergens)Table 4.1 Footnote a | 6 | 1.05 (1.00–1.11) | 0% |
| Sensitization (outdoor aeroallergen)Table 4.1 Footnote b | 3 | 1.33 (0.94–1.88) | 73.7% |
| Sensitization (indoor aeroallergen)Table 4.1 Footnote b | 2 | 1.00 (0.80–1.24) | 0.0% |
| Sensitization (food allergen, age 4)Table 4.1 Footnote b | 2 | 1.26 (1.00–1.60) | 44.0% |
| Sensitization (food allergen, age 8)Table 4.1 Footnote b | 2 | 1.18 (1.00–1.39) | 0.0% |
| Hay fevera | 5 | 1.02 (0.85–1.21) | 55% |
|
|||
There is also some evidence, albeit limited, that childhood exposure to TRAP may be associated with increased risks of hay fever and eczema. Pooled estimates in Heinrich et al. (2016) indicated non-statistically significant positive associations for both TRAP pollutants and hay fever, which is consistent with Bowatte et al. (2015), who reported mostly positive associations between exposure to TRAP and hay fever, eczema, or both. No quantitative analysis was done for TRAP pollutants and eczema by either SR-MA because of differences in the reporting of the outcome measures and the limited number of primary studies.
In sensitivity analyses by Heinrich et al. (2016), when the high-risk cohort (parental history of allergic diseases) and the cohort of very young children were excluded, the pooled estimate for sensitization to aeroallergens with NO2 exposure was slightly attenuated, resulting in a null association. A slight reduction, also resulting in a null association, was similarly noted when the high-risk cohort was removed from the analysis of hay fever for exposure to NO2. These results suggest that risks may be higher for children with a parental history of allergic diseases and for very young children.
Both SR-MAs are more recent than the qualitative reviews identified during the scoping review process. Bowatte et al. (2015) built on an earlier qualitative review by Bråbäck and Forsberg (2009), which found that, while there is a lack of consistency between exposure–response associations and the nature of allergens considered in a few cohorts, a growing body of evidence indicated a possible link between TRAP or near-roadway exposures and sensitization in children. Koppen et al. (2011) also reviewed the relevant studies but did not make any conclusions with respect to allergy, since the primary focus of the publication was TRAP and respiratory health.
4.2.2 Experimental evidence from other assessments
To further examine the relationship between TRAP exposure and allergy identified in the umbrella review, relevant aspects from the assessment of traffic exhaust, the main components of TRAP, or both by Health Canada, the HEI, and the US EPA were reviewed to identify their conclusions regarding this health endpoint based on controlled human exposure studies, animal toxicology studies, and in vitro studies. Although many of these studies consider short-term exposure periods, the biological responses observed are informative in that they provide mechanistic insight into possible pathways that can lead to the effects observed in the long-term epidemiology studies. A summary of the findings providing biological and mechanistic evidence relevant to the associations identified in the epidemiological evidence base is presented below to establish biological plausibility.
In the HEI's assessment of TRAP (HEI Panel on the Health Effects of Traffic-Related Air Pollution 2010), a panel study with asthmatic individuals exposed to TRAP reported that post-exposure challenge with an allergen augmented the respiratory effects, including asthma exacerbation and inflammation. Additionally, two animal toxicology studies demonstrated that there was an increased allergic reaction when animals were challenged with an allergen in combination with traffic exhaust, in comparison with the allergen alone. Exposure to TRAP also resulted in the release of pro-inflammatory cytokines in a human lung cell line.
In Health Canada's assessment of DE (2016a), an adjuvant effect of DE exposure combined with an allergen was identified in controlled human exposure studies, indicating a possible role for DE or DE particles (DEP) in allergic airway disease and allergic sensitization and leading to the conclusion that the relationship between DE exposure and immunological effects was likely to be causal. Individual susceptibility to the adjuvant effect was variable and may be influenced by genotype. Health Canada (2016a) noted that the large database of animal studies supported the findings from the controlled human exposure studies that the co-administration of DE with an allergen increased the response to an allergen. Specifically, several animal studies reported that exposure to DE and an allergen resulted in the exacerbation of allergic airway inflammation. Similarly, the HEI Panel on the Health Effects of Traffic-Related Air Pollution (2010) reported that, in allergic humans, exposure to DEP resulted in an increase in markers of allergenicity (e.g., cytokines and histamine) and in an inflammatory response in respiratory cells, which may lead to allergy exacerbation. A large database of animal studies also supported the findings from the human studies that exposure to DE and DEP exacerbated the allergic response (HEI Panel on the Health Effects of Traffic-Related Air Pollution 2010). Likewise, the US EPA (2009) reported that DEP exposure resulted in a significant increase in markers of an allergic response (e.g., immunoglobulins and cytokines) to allergens in controlled human exposure studies. Additionally, in one study, challenge with an antigen followed by exposure to DEP resulted in allergic sensitization.
In contrast to the findings for DE, Health Canada (2017) noted that evidence of an induction of allergenicity by GE was mixed in animal models; only a limited number of animal studies reported that exposure to GE increased markers of an allergic response in sensitized models.
For the specific components of TRAP, the HEI Panel on the Health Effects of Traffic-Related Air Pollution (2010) reported that NO2 did not exacerbate the allergic response in asthmatic individuals in any of the controlled human exposure studies. In contrast, a more recent assessment of NO2 by Health Canada (2016b) determined that the effects of NO2 exposure on markers of inflammation and allergic response in subjects with allergic rhinitis and asthma were mixed. Additionally, Health Canada (2016b) reported that exposure to NO2, both before and after allergen sensitization, led to a reduction in antibody production and eosinophil levels in some animal studies, resulting in modulation of the allergic response. A greater allergic response was observed in allergen sensitization and provocation studies after exposure to NO2. Similarly, the US EPA (2016) reported that exposure to NO2 resulted in the increased presence of markers of an allergic response (e.g., immunoglobulins, eosinophils, and neutrophils) in both controlled human exposure studies and animal toxicology studies.
In Health Canada's assessment of PM2.5 (2013), ambient PM2.5 exposure exacerbated the allergic response (e.g., inflammation, AHR, immunoglobulins, eosinophils, and cytokines) when co-administered with an antigen in animal toxicology studies. These adjuvant effects occurred with different particle species and sizes, but smaller particles (e.g., ultrafine particles [UFPs]) had greater allergic effects. Similarly, the HEI Panel on the Health Effects of Traffic-Related Air Pollution (2010) noted that exposure to PM resulted in the exacerbation of the allergic response (e.g., cytokines, immunoglobulins, and eosinophils) in sensitized animal models. In the US EPA's ISA for PM (2009), exposure to CAPs was associated with an increase in markers of allergic response (e.g., eotaxin) in healthy adults in controlled human exposure studies. Exposure to different PM species also resulted in the exacerbation of existing allergic disease in various animal models. Additionally, the co-administration of an allergen and PM promoted allergic sensitization, characterized by increased levels of immunoglobulins, cytokines, and T-cells, in animal models (US EPA 2009).
Overall, there is a large database of experimental studies (controlled human exposure, animal, and in vitro) that provide mechanistic support for TRAP having a role in the development of allergic sensitization and increased allergic responses, providing coherence within the experimental evidence and support for the limited epidemiological evidence. Exposure to traffic exhaust and some of its individual components, including DE and PM, has been associated with an adjuvant effect, which may be moderated through an increased presence of immune cells (e.g., eosinophils, macrophages, and T-cells) and pro-inflammatory molecules (e.g., immunoglobulins and interleukins), including IgE, which is principally responsible for mediating allergic responses and sensitization.
4.2.3 Determination of causality
Based on the following lines of evidence—(i) the association between TRAP exposure and allergic sensitization from the SR-MAs by Heinrich et al. (2016) and Bowatte et al. (2015) and a small number of other systematic reviews without meta-analysis indicating a trend of a positive association (i.e., positive associations that were mostly borderline significant when sensitization was restricted to specific allergens); and (ii) the supporting experimental evidence of allergic sensitization and exacerbation of allergic responses in human and experimental animal studies— it is concluded that the evidence is suggestive of, but not sufficient to infer, a causal relationship between TRAP exposure and allergic sensitization and allergic responses.
A plausible mechanism for the effects on the immune system, resulting in allergic sensitization and exacerbation of responses, may be attributable to the adjuvant effects of DE and PM, which are moderated through an increase in IgE (the principal mediator of allergic sensitization and responses) as well as increased immune cells and pro-inflammatory molecules.
4.3 Lung function
4.3.1 Evidence from the umbrella review
The SR-MA by Barone-Adesi et al. (2015) considered the association between ambient NO2 exposure and absolute and percentage reduction in measures of lung function in children and adolescents, from studies conducted in Europe, North America, and Asia. Random-effects meta-analysis determined a significant reduction in absolute FEV1 (−8 mL [95% CI: −14 to −1 mL]; p = 0.01) per 10 µg/m3 increase in NO2 with moderate heterogeneity (I2 = 32%) and a percentage reduction in FEV1 (−0.7% [95% CI: −1.1% to −0.3%]; p = 0.001) per 10 µg/m3 increase in NO2 with low heterogeneity (I2 < 1%). Each of the primary studies included in the meta-analysis identified an inverse relationship between NO2 and lung function, demonstrating consistency between the primary studies. However, most did not report a significant effect, indicating that a publication bias is unlikely. In addition, since the majority of the primary studies considered in this SR-MA were conducted in North America and Europe, the results are considered relevant for a Canadian assessment with respect to air pollutant mixture, standard of living, health care, climate, and so on.
The systematic reviews by Schultz et al. (2017) and Götschi et al. (2008) support the findings of the SR-MA by Barone-Adesi et al. (2015). More specifically, the recent systematic review by Schultz et al. (2017) also focused on cross-sectional and longitudinal studies evaluating lung function in children and adolescents and the impact of TRAP exposure. The reviewed studies used a variety of exposure assessment methods, including LUR, dispersion modelling, monitoring, traffic counts, and distance to roadways. Nearly all of the primary studies indicated lung function deficits with TRAP exposure, although only a small number reached statistical significance. Overall, the size of the effect estimates for measures of lung function was small and may not be physiologically relevant in an individual; however, when the variability in a population is taken into account, these deficits could increase the prevalence of individuals below clinically relevant thresholds. The longitudinal studies indicated a possible association between TRAP exposure and reduced lung function growth in school-aged children and adolescents; however, the impact of early-life exposures was not determined. Additionally, exposure to traffic and TRAP is ubiquitous, so the overall public health impact could be important. The systematic review did not identify a period of susceptibility; rather, any exposure from early life stages to adolescence could have impacts on lung function.
4.3.2 Experimental evidence from other assessments
From the assessment of traffic exhaust, the main components of TRAP, or both by the HEI, Health Canada, and the US EPA, the relevant aspects were reviewed to identify the conclusions based on animal toxicology studies and controlled human exposure studies so as to help provide an understanding of the relationship between TRAP exposure and alterations in lung function as well as evidence relevant to the results of the umbrella review. Although many of these studies consider short-term exposure periods, the biological responses observed are informative in that they provide mechanistic insight into possible pathways that can lead to the effects observed in the long-term epidemiology studies. A summary of the findings providing biological and mechanistic evidence is presented below to establish biological plausibility.
In the HEI's assessment of TRAP (HEI Panel on the Health Effects of Traffic-Related Air Pollution 2010), effects on lung function were noted in several panel studies with healthy and asthmatic individuals, including decreases in FEV1 and FVC, with greater impacts in those with more severe forms of asthma.
In Health Canada's assessment of DE (2016a) and GE (2017), controlled human exposure studies demonstrated that exposure to DE caused increases in airway resistance (RAW) and specific airway resistance (sRAW) in healthy and asthmatic individuals; however, all of the reviewed studies were conducted at levels that were greater than ambient. In experimental animal studies, short-term exposure to DE was also demonstrated to alter RAW. Additionally, in the HEI review (HEI Panel on the Health Effects of Traffic-Related Air Pollution 2010), chronic exposure to DE in experimental animals, at levels much greater than ambient, was shown to alter lung structure and function. For exposure to GE, studies in experimental animals indicated alterations in lung function, including tracheal pressure changes and decreases in mean expiratory flow and PEF.
For the specific components of TRAP, in Health Canada's assessment of NO2 (2016b), controlled human exposure studies determined that exposure to ambient levels of NO2 had no effect on lung function, as measured by FEV1, FVC, volume of thoracic gas, or RAW, in healthy adults both with and without bronchial challenge. In individuals with asthma, chronic obstructive pulmonary disease (COPD), or allergies, results were mixed, with small effects on lung function, including decreased FEV1 and FVC, increased sRAW, and decreased PEF, after exposure to ambient levels of NO2 with and without bronchial challenge. In a small number of animal studies, exposure to high levels of NO2 was reported to cause increased RAW and reduced compliance or elasticity in the lungs. In comparison, the US EPA's ISA for NO2 (2016) determined that there was weak evidence from controlled human exposure studies that short-term exposure to NO2 affected lung function in healthy adults. While the majority of studies found no effect, a few studies reported small increases or decreases in FEV1 and FVC after short-term, repeated-dose exposures to higher concentrations of NO2. In experimental animal studies, mixed results were also reported as to the effect of NO2 on lung function.
In Health Canada's assessment of PM2.5 (2013), controlled human exposure studies conducted using healthy adults and adults with pre-existing health conditions, including asthma and COPD, reported that exposure to CAPs had no effect on lung function as characterized by FEV1 and FVC. An increase in tidal volume was reported in a study that analyzed the effect of CAPs in asthmatic versus healthy individuals. Exposure to UFPs was reported to result in decreases in FEF25–75, CO diffusing capacity, and tidal volume in healthy adults. In addition, the review by the HEI Panel on the Health Effects of Traffic-Related Air Pollution (2010) identified that a small number of human toxicology studies reported that exposure to CAPs had a small effect on lung function (MMEF and oxygen saturation) both in healthy adults and, to a lesser extent, in adults with COPD. The US EPA's ISA for PM (2009) found that, in panel studies, ambient PM (PM2.5 and PM10) was associated with a decrease in lung function parameters, including FEV1, in asthmatic children. Panel studies conducted using adults reported that PM was associated with decreases in lung function, although the association was not as strong as it was for children.
Overall, the experimental database reviews indicate a potential association between exposure to TRAP, DE, GE, or PM and alterations in measures of lung function, indicating coherence with the epidemiological evidence, while results were mixed for NO2. One proposed mechanism of action is that components of traffic exhaust cause oxidative stress and inflammation in the respiratory tract, which may subsequently result in tissue damage. The affected tissue may play a part in altering lung structure and function (HEI Panel on the Health Effects of Traffic-Related Air Pollution 2010).
4.3.3 Determination of causality
Based on the following lines of evidence–(i) the significant association between TRAP exposure and lung function from the SR-MA by Barone-Adesi et al. (2015) and a small number of systematic reviews without meta-analysis indicating an inverse relationship between lung function and TRAP exposure; and (ii) the supporting experimental evidence from panel studies, controlled human exposure studies, and experimental animal studies indicating alteration in lung function following exposure to TRAP or its components— it is concluded that there is sufficient evidence that the relationship between TRAP exposure and effects on lung function is likely to be causal.
A plausible mechanism of action for changes in lung function is that the effects are likely mediated via an oxidative stress and inflammatory response in the respiratory tract, which may alter lung function and tissue.
Conclusion
Using an umbrella review approach, this risk assessment evaluated the association between long-term exposure to TRAP and the incidence and prevalence of asthma and allergies as well as changes in lung function. These associations were assessed along with relevant experimental evidence gathered from a review of existing assessment documents for components of TRAP, as part of a weight of evidence approach to determine the causal role of long-term TRAP exposure in the health endpoints of asthma, allergies, and lung function.
Based on the overall weight of evidence, it is concluded that:
- there is sufficient evidence of a causal relationship between TRAP exposure and asthma incidence in children;
- there is sufficient evidence of a causal relationship between TRAP exposure and asthma prevalence in children;
- there is inadequate evidence to infer a causal association between TRAP exposure and asthma incidence in adults;
- the evidence is suggestive of, but not sufficient to infer, a causal relationship between TRAP exposure and asthma prevalence in adults;
- the evidence is suggestive of, but not sufficient to infer, a causal relationship between TRAP exposure and allergic sensitization and allergic responses; and
- there is sufficient evidence that the relationship between TRAP exposure and effects on lung function is likely to be causal.
Key uncertainties and gaps
The conclusions of this risk assessment were formed in consideration of the epidemiological literature evaluating health effects associated with TRAP pollutants. For the health effect endpoints considered by this risk assessment, most of the evidence was based on NO2 and, in some cases, supported by PM2.5 and BC, thus providing a level of confidence that the conclusions are attributable to TRAP, since NO2 is considered to be the most direct measure of TRAP. Although NO2 is largely used as a proxy for quantifying TRAP exposures, NO2 has not been identified as a causative agent for the health effects. Most of the effect estimates included in the meta-analyses were derived from single-pollutant models; while that method is considered appropriate, it limits the ability to identify a causative agent, given the high degree of correlation between the TRAP pollutants. Further studies, including multi-pollutant models, would therefore be required to identify the causative agent or agents within the TRAP mixture responsible for the observed health effects.
Although the scoping review process identified several SR-MAs and numerous systematic or narrative reviews based on a substantial body of primary literature, key areas of uncertainty remain regarding the association between TRAP and asthma, allergy, and lung function; those areas are discussed below.
The body of literature that evaluated the association between exposure to TRAP and asthma was the largest among all the health endpoints considered in this assessment. Specifically, there were sufficient primary studies for the development and publication of five SR-MAs for asthma, while only two SR-MAs were identified for allergy, and only one SR-MA was identified for lung function. The five SR-MAs evaluating asthma were based on 57 primary articles. Despite this relatively well-developed literature database, little is known about the asthma-related health impacts of TRAP exposure on adults, including adult-onset asthma, since most studies have focused on children and youth. For children and youth, further studies are required to identify the susceptible period or periods for asthma development, including consideration of exposure to TRAP in early life stages and in utero. A small number of primary studies have identified possible gene–environment interactions that may play a role in asthma susceptibility. Of note, a prevalent issue in the existing primary studies is the lack of consistency in the definitions of asthma-related health outcomes. Standardization of the definitions would reduce the potential for misclassification bias in future studies. In addition, the use of administrative or health care data for disease status could reduce reliance on questionnaires and self- (or parental) reporting of health outcomes, so as to also reduce the potential for misclassification bias. The SR-MAs incorporated risk estimates that were adjusted for confounders (e.g., smoking, SES, and hereditary factors) from the primary studies where available; however, the confounders taken into consideration varied in number and specification between the studies. Consistency in the inclusion and specification of the key confounders would improve the robustness of the quantitative syntheses. Furthermore, multiple methods were used to estimate TRAP exposure in the primary studies, which likely contributed to the observed heterogeneity in the SR-MAs; however, sensitivity analyses or meta-regressions have not consistently been reported to quantitatively evaluate the level of heterogeneity attributable to differences in exposure assessment methodology.
With respect to allergy, the literature database is less developed, given that only a small number of cohorts (considering children exclusively) evaluating the health effects of TRAP have included allergy-related outcomes. The two SR-MAs identified for this assessment were based on 17 primary articles. As the number of large-scale studies considering allergic sensitization and exacerbation expands, it will be possible to explore the potential linkages between TRAP exposure, atopy, and atopic asthma. There is an indication of a greater risk in very young children and in children with a parental history of allergic diseases; additional studies are needed to better understand the risks for these potential sensitive sub-populations. Additionally, further studies, including studies considering other life stages, will allow the identification of periods of susceptibility and factors that modify the attributable risks.
With respect to lung function, the literature database is focused largely on studies in children and youth. The only SR-MA identified for this assessment was based on nine primary articles. Further studies are necessary to identify the period or periods of susceptibility and the potential long-term impacts of reduced lung function or impaired lung function from childhood into adulthood. Also, additional studies in adults would be beneficial to identify the impacts at this life stage as well as to contribute to the understanding of the risks associated with occupational exposure to TRAP.
The epidemiological evidence was evaluated using an umbrella review approach, which has inherent limitations. Since published reviews were the basis of the analysis, any primary articles published after the most recent review was not captured. For this assessment, the primary articles included in the reviews were published in or before 2016. Additionally, any errors on behalf of the review authors when synthesizing the primary articles would be incorporated into the umbrella review. This potential source of error is limited by including only peer-reviewed articles in the umbrella review and by the fact that there is a certain degree of overlap in the primary studies synthesized in the review articles. While this overlap in primary studies constitutes a strength of umbrella reviews, since it helps determine whether the systematic reviews addressing similar questions independently made similar observations and reached generally similar conclusions, the overlap also introduces a potential for bias from the inclusion of the same primary study in more than one systematic review or SR-MA, leading to an over-representation of some primary studies. This potential for bias is presented in Appendix C, indicating that there is some level of (but not total) overlap between primary studies in the publications considered. However, for any umbrella review, some overlap is expected, since the publications have addressed similar research questions.
For this risk assessment, the biological and mechanistic evidence was derived from risk assessments published from 2009 to 2017, and a detailed review of the mechanistic literature published since the completion of these existing assessments was not conducted; therefore, the mechanistic understanding in the scientific literature may be more developed than described in this assessment. Based on the scientific evidence considered in this assessment, additional experimental studies would be beneficial to further elucidate the mechanisms of action for the role of TRAP in asthma, allergy, and lung function, particularly with respect to the effects of long-term exposure. At present, the majority of the experimental evidence is based on short-term exposures and supports a role for TRAP exposure in the exacerbation of existing disease. However, the role of TRAP exposure in disease onset is not well characterized based on the existing experimental evidence. From the experimental evidence reviewed in this risk assessment, the proposed mechanisms of action have identified the central role of inflammation and oxidative stress, suggesting a possible overlap or one or more shared pathways of effect. In addition, a more thorough understanding of the mechanism would also help identify the component or components of TRAP that are the causative agent or agents of the observed health effects. This information could be used to inform policies or programs that would reduce or mitigate exposure to one or more specific pollutants.
References
- Aromataris E, Fernandez R, Godfrey CM, Holly C, Khalil H, Tungpunkom P. Summarizing systematic reviews: Methodological development, conduct and reporting of an umbrella review approach. Int J Evid Based Healthc 2015;13(3):132–40.
- Barone-Adesi F, Dent JE, Dajnak D, Beevers S, Anderson HR, Kelly FJ, Cook DG, Whincup PH. Long-term exposure to primary traffic pollutants and lung function in children: Cross-sectional study and meta-analysis. PLoS ONE 2015;10(11):e0142565.
- Boothe VL, Shendell DG. Potential health effects associated with residential proximity to freeways and primary roads: Review of scientific literature, 1999-2006. J Environ Health 2008;70(8):33–41,55–6.
- Bowatte G, Lodge C, Lowe AJ, Erbas B, Perret J, Abramson MJ, Matheson M, Dharmage SC. The influence of childhood traffic-related air pollution exposure on asthma, allergy and sensitization: A systematic review and a meta-analysis of birth cohort studies. Allergy 2015;70(3):245–56.
- Bråbäck L, Forsberg B. Does traffic exhaust contribute to the development of asthma and allergic sensitization in children: Findings from recent cohort studies. Environ Health 2009;8:17.
- Bradford Hill A. The environment and disease: Association or causation? Proc R Soc Med 1965;58(5):295–300.
- Brauer M, Hoek G, Van Vliet P, Meliefste K, Fischer PH, Wijga A, Koopman LP, Neijens HJ, Gerritsen J, Kerkhof M, Heinrich J, Bellander T, Brunekreef B. Air pollution from traffic and the development of respiratory infections and asthmatic and allergic symptoms in children. Am J Respir Crit Care Med 2002;166:1092–8.
- Brauer M, Hoek G, Smit HA, de Jongste JC, Gerritsen J, Postma DS, Kerkhof M, Brunekreef B. Air pollution and development of asthma, allergy and infections in a birth cohort. Eur Respir J 2007;29:879–88.
- Brauer M, Reynolds C, Hystad P. Traffic-related air pollution and health in Canada. CMAJ 2013;185(18):1557–8.
- Choudhary H, Tarlo SM. Airway effects of traffic-related air pollution on outdoor workers. Curr Opin Allergy Clin Immunol 2014;14(2):106–12.
- Favarato G, Anderson HR, Atkinson R, Fuller G, Mills I, Walton H. Traffic-related pollution and asthma prevalence in children. Quantification of associations with nitrogen dioxide. Air Qual Atmos Health 2014;7(4):459–66.
- Gasana J, Dillikar D, Mendy A, Forno E, Ramos Vieira E. Motor vehicle air pollution and asthma in children: A meta-analysis. Environ Res 2012;117:36–45.
- GBD 2017 Risk Factor Collaborators. Global, regional, and national comparative risk assessment of 84 behavioural, environmental and occupational, and metabolic risks or clusters of risks for 195 countries and territories, 1990–2017: A systematic analysis for the Global Burden of Disease Study 2017. Lancet 2018;392(10159):1923–94.
- Gehring U, Cyrys J, Sedlmeir G, Brunekreef B, Bellander T, Fischer P, Bauer CP, Reinhardt D, Wichmann HE, Heinrich J. Traffic-related air pollution and respiratory health during the first 2 yrs of life. Eur Respir J 2002;19(4):690–8.
- Gehring U, Wijga AH, Brauer M, Fischer P, de Jongste JC, Kerkhof M, Oldenwening M, Smit HA, Brunekreef B. Traffic-related air pollution and the development of asthma and allergies during the first 8 years of life. Am J Respir Crit Care Med 2010;181(6):596–603.
- Götschi T, Heinrich J, Sunyer J, Künzli N. Long-term effects of ambient air pollution on long function: A review. Epidemiology 2008;19(5):690–701.
- Health Canada. Health impacts of air pollution in Canada: Estimates of morbidity and premature mortality outcomes, 2019 report. Ottawa, ON, Canada: Health Canada; 2019. http://publications.gc.ca/site/eng/9.874080/publication.html .
- Health Canada. Human health risk assessment for gasoline exhaust. Ottawa, ON, Canada: Health Canada; 2017. http://publications.gc.ca/collections/collection_2017/sc-hc/H144-52-2017-eng.pdf .
- Health Canada. Human health risk assessment for diesel exhaust. Ottawa, ON, Canada: Health Canada; 2016a. http://publications.gc.ca/collections/collection_2016/sc-hc/H129-60-2016-eng.pdf .
- Health Canada. Human health risk assessment for ambient nitrogen dioxide. Ottawa, ON, Canada: Health Canada; 2016b. http://publications.gc.ca/collections/collection_2016/sc-hc/H114-31-2016-eng.pdf .
- Health Canada. Canadian smog science assessment, volume 2: Health effects. Ottawa, ON, Canada: Health Canada; 2013. http://publications.gc.ca/collections/collection_2014/sc-hc/En88-5-2-2013-eng.pdf .
- HEI Panel on the Health Effects of Traffic-Related Air Pollution. Traffic-related air pollution: A critical review of the literature on emissions, exposure, and health effects. HEI Special Report 17. Boston, MA: Health Effects Institute; 2010.
- Heinrich J, Guo F, Fuertes E. Traffic-related air pollution exposure and asthma, hayfever, and allergic sensitisation in birth cohorts: a systematic review and meta-analysis. Geoinfor Geostat: An Overview 2016;4:4.
- Heinrich J. influence of indoor factors in dwellings on the development of childhood asthma. Int J Hyg Environ Health 2011;214(1):1–25.
- Hill DA, Spergel JM. The atopic march: Critical evidence and clinical relevance. Ann Allergy Asthma Immunol 2018;120(2):131–7.
- Jacquemin B, Schikowski T, Carsin AE, Hansell A, Krämer U, Sunyer J, Probst-Hensch N, Kauffmann F, Künzli N. The role of air pollution in adult-onset asthma: A review of the current evidence. Semin Respir Crit Care Med 2012;33(6):606–19.
- Khreis H, Nieuwenhuijsen MJ. Traffic-related air pollution and childhood asthma: Recent advances and remaining gaps in the exposure assessment methods. Int J Environ Res Public Health 2017;14(3):312.
- Khreis H, Kelly C, Tate J, Parslow R, Lucas K, Nieuwenhuijsen M. Exposure to traffic-related air pollution and risk of development of childhood asthma: A systematic review and meta-analysis. Environ Int 2017;100:1–31.
- Koppen G, Bloeman K, Colles A, Nelen V, Desager K, Schoeters G. Exposure to traffic-related air pollutants in the perinatal period of life in relation to respiratory health in infancy. Crit Rev Environ Sci Technol 2011;41(22):2003–25.
- Krämer U, Sugiri D, Ranft U, Krutmann J, von Berg A, Berdel D, Behrendt H, Kuhlbusch T, Hochadel M, Wichmann HE, GINIplus and LISAplus study groups. Eczema, respiratory allergies, and traffic-related air pollution in birth cohorts from small-town areas. J Dermatol Sci 2009;56(2):99–105.
- Kuruvilla ME, Lee FE, Lee GB. Understanding asthma phenotypes, endotypes, and mechanisms of disease. Clin Rev Allergy Immunol 2019;56(2):219–33.
- Liang BM, Lam DC, Feng YL. Clinical applications of lung function tests: A revisit. Respirology 2012;17(4):611–9.
- Matz CJ, Stieb DM, Egyed M, Brion O, Johnson M. Evaluation of daily time spent in transportation and traffic-influenced microenvironments by urban Canadians. Air Qual Atmos Health 2018;11(2):209–20.
- Matz CJ, Egyed M, Hocking R, Seenundun S, Charman N, Edmonds N. Human health effects of traffic-related air pollution (TRAP): A scoping review protocol. Syst Rev 2019;8:223.
- Morgenstern V, Zutavern A, Cyrys J, Brockow I, Gehring U, Koletzko S, Bauer CP, Reinhardt D, Wichmann HE, Heinrich J. Respiratory health and individual estimated exposure to traffic-related air pollutants in a cohort of young children. Occup Environ Med 2007;64(1):8–16.
- Morgenstern V, Zutavern A, Cyrys J, Brockow I, Koletzko S, Krämer U, Behrendt H, Herbarth O, von Berg A, Bauer CP, Wichmann HE, Heinrich J, GINI Study Group, LISA Study Group. Atopic diseases, allergic sensitization, and exposure to traffic-related air pollution in children. Am J Respir Crit Care Med 2008;177(12):1331–7.
- Nordling E, Berglind N, Melén E, Emenius G, Hallberg J, Nyberg F, Pershagen G, Svartengren M, Wickman M, Bellander T. Traffic-related air pollution and childhood respiratory symptoms, function and allergies. Epidemiology 2008;19(3):401–8.
- Oftedal B, Nystad W, Brunekreef B, Nafstad P. Long-term traffic-related exposures and asthma onset in schoolchildren in Oslo, Norway. Environ Health Perspect 2009;117(5):839–44.
- Pollock J, Shi L, Gimbel RW. Outdoor environment and pediatric asthma: An update on the evidence from North America. Can Respir J 2017;2017:8921917.
- Reber LL, Hernandez JD, Galli SJ. The pathophysiology of anaphylaxis. J Allergy Clin Immunol 2017;140(2):335–48.
- Richmond-Bryant J, Saganich C, Bukiewicz L, Kalin R. Associations of PM2.5
- and black carbon concentrations with traffic, idling, background pollution, and meteorology during school dismissals. Sci Total Environ 2009;407(10):3357–64.
- Salam MT, Islam T, Gilliland FD. Recent evidence for adverse effects of residential proximity to traffic sources on asthma. Curr Opin Pulm Med 2008;14(1):3–8.
- Schultz ES, Litonjua AA, Melén E. Effects of long-term exposure to traffic-related air pollution on lung function in children. Curr Allergy Asthma Rep 2017;17(6):41.
- Shea BJ, Reeves BC, Wells G, Thuku M, Hamel C, Moran J, Moher D, Tugwell P, Welch V, Kristjansson E, Henry DA. AMSTAR 2: A critical appraisal tool for systematic reviews that include randomised or non-randomised studies of healthcare interventions, or both. BMJ 2017;358:j4008.
- US EPA. Integrated Science Assessment for particulate matter (final report, December 2009). EPA/600/R-08/139F. Washington, DC: United States Environmental Protection Agency; 2009. https://ofmpub.epa.gov/eims/eimscomm.getfile?p_download_id=494959 .
- US EPA. Preamble to the Integrated Science Assessments (ISA). EPA/600/R-15/067. Washington, DC: United States Environmental Protection Agency; 2015.
- US EPA. Integrated Science Assessment for oxides of nitrogen – Health criteria (final report, 2016). EPA/600/R-15/068. Washington, DC: United States Environmental Protection Agency; 2016. http://ofmpub.epa.gov/eims/eimscomm.getfile?p_download_id=526855 .
Appendices
Appendix A. Refined search strategy for literature update
Embase
Database(s): Embase 1974 to October 29, 2018
Search strategy:
| # | Searches | Results |
|---|---|---|
| 1 | exhaust gas/ | 17,550 |
| 2 | exp motor vehicle/ | 36,574 |
| 3 | car driving/ | 13,476 |
| 4 | exp traffic/ | 123,574 |
| 5 | "traffic and transport"/ | 13,276 |
| 6 | nitrogen oxide/ | 9,857 |
| 7 | nitrogen dioxide/ | 10,413 |
| 8 | carbon monoxide/ | 33,146 |
| 9 | carbon dioxide/ | 81,049 |
| 10 | ozone/ | 25,237 |
| 11 | volatile organic compound/ | 15,161 |
| 12 | black carbon/ | 1,979 |
| 13 | particulate matter/ | 36,238 |
| 14 | exp polycyclic aromatic hydrocarbon/ | 69,576 |
| 15 | exp air pollution/ | 138,272 |
| 16 | ((distanc* or proximit* or close*) adj3 (traffic* or road* or highway* or transitway*)).tw,kw. | 2,042 |
| 17 | traffic exposure*.tw,kw. | 325 |
| 18 | fume/ | 1,904 |
| 19 | ((automobile* or automotive* or autocar* or autobus* or motor* or vehic* or taxi* or diesel* or gasoline* or engine? or car or cars or truck* or bus or buses or bussing or highway* or high way* or motorway* or motor way or road* or parkade* or parking* or carpark* or car park* or traffic*) adj4 (exhaust? or emission* or pollut* or vapor* or vapour* or volatile* or effluvia* or smoke* or fume? or haze? or smog* or nitrogen oxide* or NOx or 11104-93-1 or carbon monoxide* or 630-08-0 or carbon dioxide or 124-38-9 or volatile organic compounds or VOC or VOCs or Peroxyacetyl nitrate or 2278-22-0 or polycyclic aromatic hydrocarbon* or arene* or PAH or polyaromatic hydrocarbon* or polynuclear aromatic hydrocarbon*)).tw,kw. | 18,886 |
| 20 | 1 or ((or/2-5) and (or/6-18)) or 19 [TRAP] | 30,534 |
| 21 | exp health/ | 610,569 |
| 22 | public health/ | 153,138 |
| 23 | "physical disease by etiology and pathogenesis"/ or acute disease/ or exp aplasia/ or exp ascites/ or exp atrophy/ or exp bleeding/ or exp calcification/ or exp channelopathy/ or chemically induced disorder/ or exp chronic disease/ or exp complication/ or critical illness/ or exp cyst/ or exp deformity/ or exp degeneration/ or exp diverticulosis/ or exp dysplasia/ or exp dystrophy/ or exp ectopic tissue/ or exp edema/ or exp effusion/ or exp emphysema/ or endemic disease/ or environmental disease/ or epidemic/ or exp fibrosis/ or exp fistula/ or exp "genetic and familial disorders"/ or exp healing impairment/ or exp hernia/ or exp hyperplasia/ or exp hypertrophy/ or exp hypoplasia/ or exp hypotrophy/ or exp iatrogenic disease/ or idiopathic disease/ or exp infection/ or exp inflammation/ or exp ischemia/ or exp "lesions and defects"/ or exp malnutrition/ or exp metaplasia/ or exp necrosis/ or neglected disease/ or neointima/ or exp neoplasm/ or exp "neovascularization (pathology)"/ or non communicable disease/ or exp occupational disease/ or pandemic/ or exp pseudotumor/ or rare disease/ or recurrent disease/ or relapse/ or reversal reaction/ or exp sclerosis/ or exp "stenosis, occlusion and obstruction"/ or exp stone formation/ or exp storage disease/ or exp swelling/ or syndrome/ or systemic disease/ or terminal disease/ or exp thromboembolism/ or exp torsion/ or exp "toxicity and intoxication"/ or exp ulcer/ | 12,680,502 |
| 24 | exp mental disease/ | 1,942,944 |
| 25 | physical disease/ or exp physical disease by anatomical structure/ or exp physical disease by body function/ or exp "physical disease by composition of body fluids, excreta and secretions"/ or exp physical disease by developmental age/ | 15,858,535 |
| 26 | diseases/ | 144,951 |
| 27 | exp mortality/ | 939,107 |
| 28 | mortality risk/ | 9,956 |
| 29 | exp epidemiology/ | 2,970,940 |
| 30 | exp epidemiological monitoring/ | 1,596 |
| 31 | exp epidemiological data/ | 3,001,068 |
| 32 | environmental health/ | 29,077 |
| 33 | genotoxicity/ | 30,263 |
| 34 | genetic damage/ | 2,060 |
| 35 | mutagenic activity/ | 2,443 |
| 36 | mutagenicity/ | 18,332 |
| 37 | exp postnatal development/ | 65,811 |
| 38 | exp toxicity/ | 626,744 |
| 39 | exp biological functions/ | 20,916,936 |
| 40 | environmental health/ | 29,077 |
| 41 | environmental stress/ | 7,975 |
| 42 | "quality of life"/ | 402,513 |
| 43 | hospitalization/ or hospital admission/ | 461,230 |
| 44 | (IQR or interquartile range* or inter quartile range*).tw,kw. | 100,168 |
| 45 | ((population* or human* or citizen* or nation* or public or communit* or individual* or people* or person* or man or men or woman* or women* or child* or infan* or toddler* or newborn* or neonat* or baby or babies or adolecen* or teenage* or preteen* or preadolescen* or premenarch* or pre menarch* or adult* or elderly or seniors) adj3 (health* or disease*)).tw,kw. | 1,230,793 |
| 46 | or/21-45 [Health Effects] | 26,922,678 |
| 47 | limit 46 to ((english or french) and yr="2000 -Current") | 16,566,835 |
| 48 | 20 and 47 [TRAP + Human Health] | 14,701 |
| 49 | limit 48 to human | 7,714 |
| 50 | (human* or person* or people* or man or men? or wom?n or child* or infan* or toddler* or newborn* or neonat* or baby or babies or adolecen* or teenage* or preteen* or preadolescen* or premenarch* or pre menarch* or adult* or elderly or seniors).tw,kw. | 8,485,534 |
| 51 | exp human/ | 18,945,713 |
| 52 | 48 and (50 or 51) | 9,060 |
| 53 | nonhuman/ | 5,579,407 |
| 54 | 48 not 53 | 12,272 |
| 55 | 49 or 52 or 54 | 13,324 |
| 56 | limit 55 to conference abstract status | 1,721 |
| 57 | 55 not 56 | 11,603 |
| 58 | exp lung function/ | 121,599 |
| 59 | exp lung function test/ | 152,815 |
| 60 | exp respiratory tract allergy/ | 268,493 |
| 61 | ((airway* or respir* or pulmon* or lung* or bronch* or alveol* or pneumo* or vascula*) adj4 (hyperresponsiv* or hyper-responsiv* or hypersensitiv* or hyper-sensitiv* or sensitiz* or sensitis* or inflam* or allerg* or obstruct* or spasm* or mast cell* or immunoglobulin E or immunoglobulin epsilon or IgE or eosinophil*)).tw,kw. | 236,826 |
| 62 | ((airway* or respir* or pulmon* or lung* or bronch* or alveol* or pneumo* or vascula*) adj4 (function* or disfunction* or dysfunction* or mechanic?)).tw,kw. | 168,798 |
| 63 | (asthma* or alveolitis* or wheez* or "shortness of breath" or dyspnea* or dyspnoea* or rhinitis or mucociliary clearance*).tw,kw. | 318,766 |
| 64 | ((airway* or respir* or pulmon* or lung* or bronch* or alveol* or pneumo* or vascula*) adj3 (remodel* or resist* or compliance or circulation or clearance* or diffus* or perfus* or eliminat* or ventilat* or absorb* or absorp* or volum* or exchang* or ventialt*)).tw,kw. | 224,598 |
| 65 | (forced expiratory or maximal voluntary ventilation or maxim* expirat* or peak expirat*).tw,kw. | 32,519 |
| 66 | (respir* adj3 (rate* or transport* or dead space* or sound*)).tw,kw. | 35,282 |
| 67 | (total lung capacit* or closing volume* or functional residual capacit* or vital capacit* or valsalva maneuver* or valsalva manoeuver* or ventilation perfusion ratio? or "work of breathing").tw,kw. | 34,082 |
| 68 | (blood-gas analys* or blood-gas monitor* or oximetr* or bronch* provocation* or capnograph* or exercise test* or maxim* respiratory or spirometr* or bronchospiro* or hydrogen breath test* or nitrogen washout* or nitrogen test* or pneumograph* or pneumatotachygraph* or spirograph* or plethysmograph* or bronchodilation test*).tw,kw. | 109,897 |
| 69 | or/58-68 [Lung Function and Hypersensitivity] | 1,000,518 |
| 70 | 20 and 69 [TRAP and Lung Fx] | 3,380 |
| 71 | limit 70 to ((english or french) and yr="2000 -Current") | 2,820 |
| 72 | limit 71 to human | 2,151 |
| 73 | 71 and (50 or 51) | 2,335 |
| 74 | 71 not 53 | 2,186 |
| 75 | 72 or 73 or 74 [Human Limit] | 2,518 |
| 76 | limit 75 to conference abstract status | 657 |
| 77 | 75 not 76 | 1,861 |
| 78 | 57 and (2000* or 2001* or 2002* or 2003* or 2004* or 2005* or 2006* or 2007* or 2008* or 2009* or 2010* or 2011* or 2012* or 2013* or 2014* or 2015* or 2016* or 2017* or "201801" or "201802" or "201803").dd,dc. [Previously Retrieved Results] | 10,771 |
| 79 | 77 not 78 [New Results Only] | 167 |
Medline
Database(s): Ovid MEDLINE® ALL 1946 to October 29, 2018
Search strategy:
| # | Searches | Results |
|---|---|---|
| 1 | Vehicle Emissions/ | 8,973 |
| 2 | exp motor vehicles/ | 19,206 |
| 3 | transportation/ | 9,191 |
| 4 | Automobile Driving/ | 17,575 |
| 5 | Parking Facilities/ | 354 |
| 6 | exp Nitrogen Oxides/ | 106,370 |
| 7 | Carbon Monoxide/ | 17,162 |
| 8 | Carbon Dioxide/ | 83,413 |
| 9 | Ozone/ | 13,376 |
| 10 | Volatile Organic Compounds/ | 7,244 |
| 11 | Soot/ | 1,224 |
| 12 | particulate matter/ or exp dust/ or smog/ | 34,446 |
| 13 | exp Polycyclic Aromatic Hydrocarbons/ | 421,412 |
| 14 | air pollution/ or air pollution, indoor/ | 38,935 |
| 15 | ((distanc* or proximit* or close*) adj3 (traffic* or road* or highway* or transitway*)).tw,kf. | 1,551 |
| 16 | traffic exposure*.tw,kf. | 245 |
| 17 | ((automobile* or automotive* or autocar* or autobus* or motor* or vehic* or taxi* or diesel* or gasoline* or engine? or car or cars or truck* or bus or buses or bussing or highway* or high way* or motorway* or motor way or road* or parkade* or parking* or carpark* or car park* or traffic*) adj4 (exhaust? or emission* or pollut* or vapor* or vapour* or volatile* or effluvia* or smoke* or fume? or haze? or smog* or nitrogen oxide* or NOx or 11104-93-1 or carbon monoxide* or 630-08-0 or carbon dioxide or 124-38-9 or volatile organic compounds or VOC or VOCs or Peroxyacetyl nitrate or 2278-22-0 or polycyclic aromatic hydrocarbon* or arene* or PAH or polyaromatic hydrocarbon* or polynuclear aromatic hydrocarbon*)).tw,kf. | 12,401 |
| 18 | 1 or ((or/2-5) and (or/6-16)) or 17 [TRAP] | 16,709 |
| 19 | exp Health/ | 328,876 |
| 20 | exp "diseases (non mesh)"/ | 13,880,966 |
| 21 | exp Mental Disorders/ | 1,139,305 |
| 22 | exp morbidity/ | 497,580 |
| 23 | exp mortality/ | 349,192 |
| 24 | exp Epidemiology/ | 25,193 |
| 25 | Epidemiological Monitoring/ | 6,160 |
| 26 | exp "growth and development"/ | 1,309,018 |
| 27 | "Quality of Life"/ | 167,995 |
| 28 | exp Hospitalization/ | 212,739 |
| 29 | (IQR or interquartile range* or inter quartile range*).tw,kf. | 49,460 |
| 30 | (health* or disease* or illness* or mortalit* or morbidit* or disorder* or sick*).tw,kf. | 6,579,511 |
| 31 | or/19-30 [Health Effects] | 16,974,109 |
| 32 | limit 31 to ((english or french) and yr="2000 -Current") | 8,572,367 |
| 33 | 18 and 32 [TRAP + Human Health] | 5,937 |
| 34 | limit 33 to human | 4,101 |
| 35 | (human* or person* or people* or man or men? or wom?n or child* or infan* or toddler* or newborn* or neonat* or baby or babies or adolecen* or teenage* or preteen* or preadolescen* or premenarch* or pre menarch* or adult* or elderly or seniors).tw,kf. | 6,930,547 |
| 36 | exp human/ | 17,354,272 |
| 37 | 33 and (34 or 35) | 4,774 |
| 38 | exp models animal/ | 520,311 |
| 39 | exp animal experimentation/ | 8,843 |
| 40 | 33 not (37 or 38) | 1,098 |
| 41 | 34 or 37 or 40 | 5,872 |
| 42 | limit 41 to ed=20170526-20171231 | 300 |
| 43 | limit 41 to ed=20180101-20180405 | 158 |
| 44 | exp asthma/ or exp respiratory hypersensitivity/ | 146,551 |
| 45 | exp Respiratory Function Tests/ | 223,640 |
| 46 | ((airway* or respir* or pulmon* or lung* or bronch* or alveol* or pneumo* or vascula*) adj4 (hyperresponsiv* or hyper- responsiv* or hypersensitiv* or hyper-sensitiv* or sensitiz* or sensitis* or inflam* or allerg* or obstruct* or spasm* or mast cell* or immunoglobulin E or immunoglobulin epsilon or IgE or eosinophil*)).tw,kf. | 166,799 |
| 47 | ((airway* or respir* or pulmon* or lung* or bronch* or alveol* or pneumo* or vascula*) adj4 (function* or disfunction* or dysfunction* or mechanic?)).tw,kf. | 117,476 |
| 48 | (asthma* or alveolitis* or wheez* or "shortness of breath" or dyspnea* or dyspnoea* or rhinitis or mucociliary clearance*).tw,kf. | 217,480 |
| 49 | ((airway* or respir* or pulmon* or lung* or bronch* or alveol* or pneumo* or vascula*) adj3 (remodel* or resist* or compliance or circulation or clearance* or diffus* or perfus* or eliminat* or ventilat* or absorb* or absorp* or volum* or exchang* or ventialt*)).tw,kf. | 168,236 |
| 50 | (forced expiratory or maximal voluntary ventilation or maxim* expirat* or peak expirat*).tw,kf. | 25,456 |
| 51 | (respir* adj3 (rate* or transport* or dead space* or sound*)).tw,kf. | 26,531 |
| 52 | (total lung capacit* or closing volume* or functional residual capacit* or vital capacit* or valsalva maneuver* or valsalva manoeuver* or ventilation perfusion ratio? or "work of breathing").tw,kf. | 24,825 |
| 53 | (blood-gas analys* or blood-gas monitor* or oximetr* or bronch* provocation* or capnograph* or exercise test* or maxim* respiratory or spirometr* or bronchospiro* or hydrogen breath test* or nitrogen washout* or nitrogen test* or pneumograph* or pneumatotachygraph* or spirograph* or plethysmograph* or bronchodilation test*).tw,kf. | 77,792 |
| 54 | or/44-53 [Lung Fx and Hypersensitivity] | 739,366 |
| 55 | 18 and 54 [TRAP and Lung Fx] | 1,975 |
| 56 | limit 55 to ((english or french) and yr="2000 -Current") | 1,570 |
| 57 | limit 56 to human | 1,097 |
| 58 | 56 and (34 or 35) | 1,221 |
| 59 | 56 not (37 or 38) | 380 |
| 60 | 57 or 58 or 59 [Human Limit] | 1,531 |
| 61 | 41 and ((2000* or 2001* or 2002* or 2003* or 2004* or 2005* or 2006* or 2007* or 2008* or 2009* or 2010* or 2011* or 2012* or 2013* or 2014* or 2015* or 2016* or 2017* or "201801" or "201802" or "201803").ed. or (2000* or 2001* or 2002* or 2003* or 2004* or 2005* or 2006* or 2007* or 2008* or 2009* or 2010* or 2011* or 2012* or 2013* or 2014* or 2015* or 2016* or 2017* or "2018 01" or "2018 02" or "2018 03").dt.) [Previously Retrieved Articles] | 5,529 |
| 62 | 60 not 61 [New Results Only] | 204 |
Appendix B. Study quality assessment table using the AMSTAR 2 rating instrument adapted to environmental epidemiology studies
| Khreis et al. 2017Appendix B Footnote a | Heinrich et al. 2016Appendix B Footnote a | Barone-Adesi et al. 2015Appendix B Footnote a | Bowatte et al. 2015Appendix B Footnote a | Favarato et al. 2014Appendix B Footnote a | Gasana et al. 2012Appendix B Footnote a | Khreis and Nieuwenhuijsen 2017 | Pollock et al. 2017 | Schultz et al. 2017 | Choudhary et al. 2014 | Jacquemin et al. 2012 | Heinrich 2011 | Koppen et al. 2011 | Bråbäck and Forsberg 2009 | Boothe and Shendell 2008 | Götschi et al. 2008 | Salam et al. 2008 | |
|---|---|---|---|---|---|---|---|---|---|---|---|---|---|---|---|---|---|
| 1. Did the review authors use a comprehensive literature search strategy? | 1 | 1 | 0 | 0.5 | 0.5 | 1 | 1 | 0 | 0 | 1 | 0 | 0 | 0 | 0.5 | 0 | 0 | 0.5 |
| 2. Did the review authors describe the included studies in adequate detail? | 1 | 1 | 0.5 | 1 | 1 | 1 | 1 | 1 | 1 | 0 | 1 | 1 | 1 | 1 | 1 | 1 | 1 |
| 3. Did the review authors use a satisfactory technique for appraising study quality or assessing the Risk of Bias (RoB) in individual studies included in the review? | 0.5 | 0.5 | 0 | 0.5 | 0 | 0.5 | 0 | 0 | 0 | 0 | 0 | 0.5 | 0 | 0 | 0 | 0 | 0 |
| 4. Did the review authors account for study quality or RoB in the individual studies when interpreting/discussing the results of the review? | 1 | 1 | 0 | 0 | 0 | 0 | 0 | 0 | 0 | 0 | 0 | 1 | 0 | 0 | 0 | 0 | 0 |
| 5. Did the review authors provide a satisfactory explanation for, and discussion of, any heterogeneity observed in the results of the review? | 1 | 1 | 1 | 1 | 1 | 0.5 | 0.5 | 0.5 | 1 | 0 | 1 | 0.5 | 1 | 1 | 1 | 1 | 1 |
| 6. If meta-analysis was performed, did the review authors use appropriate methods for statistical combination of results? | 1 | 1 | 1 | 1 | 1 | 1 | N.A. | N.A. | N.A. | N.A. | N.A. | N.A. | N.A. | N.A. | N.A. | N.A. | N.A. |
| 7. If meta-analysis was performed, did the review authors assess the potential impact of study quality or RoB in individual studies on the results of the meta-analysis or other evidence synthesis? | 1 | 1 | 0 | 0 | 0 | 0 | N.A. | N.A. | N.A. | N.A. | N.A. | N.A. | N.A. | N.A. | N.A. | N.A. | N.A. |
| 8. If they performed a quantitative synthesis, did the review authors carry out an adequate investigation of public bias (small-study bias) and discuss its likely impact on the results of the review? | 1 | 0 | 1 | 0 | 1 | 0 | N.A. | N.A. | N.A. | N.A. | N.A. | N.A. | N.A. | N.A. | N.A. | N.A. | N.A. |
| Total score | 7.5Footnote b | 6.5Footnote b | 3.5Footnote c | 4Footnote c | 4.5Footnote c | 4Footnote c | 2.5Footnote c | 1.5Footnote d | 2Footnote c | 1Footnote d | 2Footnote c | 3Footnote c | 2Footnote c | 2.5Footnote c | 2Footnote c | 2Footnote c | 2.5Footnote c |
|
|||||||||||||||||
Appendix C. List of cited studies across the reviews included in this assessment
| Author(s), year | Journal | Study design | Number of times cited | Systematic reviews that include meta-analysis (SR-MAs) | Systematic reviews with no meta-analysis | Selected other reviews | ||||||||||||
|---|---|---|---|---|---|---|---|---|---|---|---|---|---|---|---|---|---|---|
| Khreis et al. 2017 (AS) | Heinrich et al. 2016 (AS, AL) | Barone-Adesi et al. 2015 (LF) | Bowatte et al. 2015 (AS, AL) | Favarato et al. 2014 (AS) | Gasana et al. 2012 (AS) | Khreis and Nieuwenhuijsen 2017 (AS) | Schultz et al. 2017 (LF) | Jacquemin et al. 2012 (AS) | Koppen et al. 2011 (AS, AL) | Bråbäck and Forsberg 2009 (AS, AL) | Götschi et al. 2008 (LF) | Salam et al. 2008 (AS) | Heinrich 2011 (AS) | Boothe and Shendell 2008 (AS) | ||||
| Deng et al. 2016 | Chemosphere | cross-sectional | 2 | X | - | - | - | - | - | X | - | - | - | - | - | - | - | - |
| Hasunuma et al. 2016 | BMJ Open | case-control nested in a cohort | 2 | X | - | - | - | - | - | X | - | - | - | - | - | - | - | - |
| Kim et al. 2016 | Allergy Asthma Proc | cross-sectional | 2 | X | - | - | - | - | - | X | - | - | - | - | - | - | - | - |
| Liu et al. 2016 | Environ Int | cross-sectional | 2 | X | - | - | - | - | - | X | - | - | - | - | - | - | - | - |
| Tétrault et al. 2016 | Environ Health Perspect | cohort | 2 | X | - | - | - | - | - | X | - | - | - | - | - | - | - | - |
| Wang et al. 2016 | Int J Hyg Environ Health | cohort | 2 | X | - | - | - | - | - | X | - | - | - | - | - | - | - | - |
| Yang et al. 2016 | Occup Environ Med | cohort | 2 | X | - | - | - | - | - | X | - | - | - | - | - | - | - | - |
| Brunst et al. 2015 | Am J Respir Crit Care Med | cohort | 2 | X | - | - | - | - | - | X | - | - | - | - | - | - | - | - |
| Deng et al. 2015 | Environ Res | cross-sectional | 2 | X | - | - | - | - | - | X | - | - | - | - | - | - | - | - |
| Gehring et al. 2015a | Lancet Respir Med | pooled analysis of cohorts | 3 | X | X | - | - | - | - | X | - | - | - | - | - | - | - | - |
| Gehring et al. 2015b | Epidemiology | cohort | 4 | X | X | - | - | - | - | X | X | - | - | - | - | - | - | - |
| LeMasters et al. 2015 | Obesity | cohort | 2 | X | - | - | - | - | - | X | - | - | - | - | - | - | - | - |
| Mölter et al. 2015 | Eur Respir J | pooled analysis of cohorts | 2 | X | - | - | - | - | - | X | - | - | - | - | - | - | - | - |
| Dell et al. 2014 | Environ Int | case-control | 2 | X | - | - | - | - | - | X | - | - | - | - | - | - | - | - |
| MacIntyre et al. 2014 | Environ Health Perspect | pooled analysis of cohorts | 3 | X | X | - | - | - | - | X | - | - | - | - | - | - | - | - |
| Mölter et al. 2014 | J Epidemiol Community Health | cohort | 2 | X | - | - | - | - | - | X | - | - | - | - | - | - | - | - |
| Ranzi et al. 2014 | Occup Environ Med | cohort | 3 | X | X | - | - | - | - | X | - | - | - | - | - | - | - | - |
| Yamazaki et al. 2014 | J Expo Sci Environ Epidemiol | cohort | 2 | X | - | - | - | - | - | X | - | - | - | - | - | - | - | - |
| Fuertes et al. 2013 | PeerJ | cohort | 3 | X | X | - | - | - | - | X | - | - | - | - | - | - | - | - |
| Gruzieva et al. 2013 | Epidemiology | cohort | 5 | X | X | - | X | X | - | X | - | - | - | - | - | - | - | - |
| Lindgren et al. 2013 | Environ Health | cohort | 2 | X | - | - | - | - | - | X | - | - | - | - | - | - | - | - |
| Nishimura et al. 2013 | Am J Respir Crit Care Med | case-control | 2 | X | - | - | - | - | - | X | - | - | - | - | - | - | - | - |
| Carlsten et al. 2011 | Occup Environ Med | cohort | 4 | X | X | - | X | - | - | X | - | - | - | - | - | - | - | - |
| Patel et al. 2011 | Environ Res | cohort | 4 | X | X | - | X | - | - | X | - | - | - | - | - | - | - | - |
| Clark et al. 2010 | Environ Health Perspect | case-control nested in a cohort | 6 | X | X | - | X | - | X | X | - | - | - | - | - | - | X | - |
| Gehring et al. 2010 | Am J Respir Crit Care Med | cohort | 7 | X | X | - | X | X | X | X | - | - | - | - | - | - | X | - |
| Kerkhof et al. 2010 | Thorax | cohort | 2 | X | - | - | - | - | - | X | - | - | - | - | - | - | - | - |
| McConnell et al. 2010 | Environ Health Perspect | cohort | 2 | X | - | - | - | - | - | X | - | - | - | - | - | - | - | - |
| Krämer et al. 2009 | J Dermatol Sci | cohort | 6 | X | X | - | X | X | - | X | - | - | X | - | - | - | - | - |
| Oftedal et al. 2009 | Environ Health Perspect | cohort | 7 | X | X | - | X | X | X | X | - | - | - | - | - | - | X | - |
| Jerrett et al. 2008 | Environ Health Perspect | cohort | 5 | X | - | - | - | - | - | X | - | - | X | X | - | - | X | - |
| Morgenstern et al. 2008 | Am J Respir Crit Care Med | cohort | 8 | X | X | - | X | X | - | X | - | - | X | X | - | - | X | - |
| Brauer et al. 2007 | Eur Respir J | cohort | 8 | X | X | - | X | - | - | X | - | - | X | X | - | X | X | - |
| Morgenstern et al. 2007 | Occup Environ Med | cohort | 9 | X | X | - | X | - | X | X | - | - | X | X | - | X | X | - |
| Zmirou et al. 2004 | J Epidemiol Community Health | case-control | 3 | X | - | - | - | - | - | X | - | - | - | - | - | - | - | X |
| Shima et al. 2003 | Japan J Epidemiol | cohort | 5 | X | - | - | - | - | - | X | - | - | X | X | - | - | X | - |
| Brauer et al. 2002 | Am J Respir Crit Care Med | cohort | 7 | X | X | - | X | - | - | X | - | - | X | X | - | - | X | - |
| Shima et al. 2002 | Arch Environ Health | cohort | 5 | X | - | - | - | - | X | X | - | - | X | X | - | - | - | - |
| Shima and Adachi 2000 | Int J Epidemiol | cohort | 2 | X | - | - | - | - | - | X | - | - | - | - | - | - | - | - |
| English et al. 1999 | Environ Health Perspect | case-control | 3 | X | - | - | - | - | - | X | - | - | - | - | - | - | - | X |
| Huang et al. 2015 | Br J Dermatol | cohort | 1 | - | X | - | - | - | - | - | - | - | - | - | - | - | - | - |
| Sbihi et al. 2015 | Environ Health Perspect | cohort | 1 | - | X | - | - | - | - | - | - | - | - | - | - | - | - | - |
| Gruzieva et al. 2014 | J Allergy Clin Immunol | pooled analysis of cohorts | 1 | - | X | - | - | - | - | - | - | - | - | - | - | - | - | - |
| Fuertes et al. 2013b | J Allergy Clin Immunol | pooled analysis of cohorts | 1 | - | X | - | - | - | - | - | - | - | - | - | - | - | - | - |
| Gruzieva et al. 2012 | J Allergy Clin Immunol | cohort | 2 | - | X | - | X | - | - | - | - | - | - | - | - | - | - | - |
| Esplugues et al. 2011 | Sci Total Environ | cohort | 3 | - | X | - | X | X | - | - | - | - | - | - | - | - | - | - |
| Ryan et al. 2009 | Am J Respir Crit Care Med | cohort | 2 | - | X | - | X | - | - | - | - | - | - | - | - | - | - | - |
| Nordling et al. 2008 | Epidemiology | cohort | 6 | - | X | - | X | - | - | - | X | - | X | X | - | - | X | - |
| Ryan et al. 2005 | J Allergy Clin Immunol | cohort | 6 | - | X | - | X | - | - | - | - | - | - | X | - | X | X | X |
| Gehring et al. 2002 | Eur Respir J | cohort | 7 | - | X | - | X | - | X | X | - | - | X | X | - | - | X | - |
| Morales et al. 2015 | Thorax | cross-sectional associations | 2 | - | - | X | - | - | - | - | X | - | - | - | - | - | - | - |
| Urman et al. 2014 | Thorax | cross-sectional associations | 1 | - | - | X | - | - | - | - | - | - | - | - | - | - | - | - |
| Gehring et al. 2013 | Environ Health Perspect | cohort | 2 | - | - | X | - | - | - | - | X | - | - | - | - | - | - | - |
| Svendsen et al. 2012 | Am J Epidemiol | cohort | 3 | - | - | X | - | X | - | - | X | - | - | - | - | - | - | - |
| Lee et al. 2011 | Int J Hyg Environ Health | cross-sectional associations | 2 | - | - | X | - | - | - | - | X | - | - | - | - | - | - | - |
| Rosenlund et al. 2009 | Thorax | cross-sectional associations | 1 | - | - | X | - | - | - | - | - | - | - | - | - | - | - | - |
| Dales et al. 2008 | Environ Health Perspect | cross-sectional associations | 2 | - | - | X | - | - | - | - | X | - | - | - | - | - | - | - |
| Oftedal et al. 2008 | Epidemiology | cohort | 5 | - | - | X | X | - | - | - | X | - | - | X | - | - | X | - |
| Peters et al. 1999 | Am J Respir Crit Care Med | cohort | 3 | - | - | X | - | - | X | - | X | - | - | - | - | - | - | - |
| Andersen et al. 2008 | Thorax | cohort | 2 | - | - | - | X | - | - | - | - | - | X | - | - | - | - | - |
| Sonnenschein-van der Voort et al. 2012 | Environ Health | cohort | 1 | - | - | - | - | X | - | - | - | - | - | - | - | - | - | - |
| Kim et al. 2011 | J Korean Med Sci | cross-sectional | 1 | - | - | - | - | X | - | - | - | - | - | - | - | - | - | - |
| Pénard-Morand et al. 2010 | Eur Respir J | cross-sectional | 2 | - | - | - | - | X | X | - | - | - | - | - | - | - | - | - |
| Zhao et al. 2008 | Environ Health Perspect | cross-sectional | 1 | - | - | - | - | X | - | - | - | - | - | - | - | - | - | - |
| Mi et al. 2006 | Indoor Air | cross-sectional | 1 | - | - | - | - | X | - | - | - | - | - | - | - | - | - | - |
| Gauderman et al. 2005 | Epidemiology | cross-sectional | 3 | - | - | - | - | X | X | - | - | - | - | - | - | - | - | X |
| Kim et al. 2004 | Am J Respir Crit Care Med | cross-sectional | 2 | - | - | - | - | X | X | - | - | - | - | - | - | - | - | - |
| Janssen et al. 2003 | Environ Health Perspect | cross-sectional | 4 | - | - | - | - | X | - | - | X | - | - | - | X | - | - | X |
| Krämer et al. 2000 | Epidemiology | cross-sectional | 1 | - | - | - | - | X | - | - | - | - | - | - | - | - | - | - |
| Pikhart et al. 2000 | Epidemiology | cross-sectional | 1 | - | - | - | - | X | - | - | - | - | - | - | - | - | - | - |
| Hirsch et al. 1999 | Eur Respir J | cross-sectional | 4 | - | - | - | - | X | X | - | X | - | - | - | X | - | - | - |
| Linares et al. 2010 | BMC Pulm Med | cohort (longitudinal) | 1 | - | - | - | - | - | X | - | - | - | - | - | - | - | - | - |
| Arnedo-Pena et al. 2009 | Arch Bronconeumol | cross-sectional | 1 | - | - | - | - | - | X | - | - | - | - | - | - | - | - | - |
| Sahsuvaroglu et al. 2009 | Environ Health | cohort | 1 | - | - | - | - | - | X | - | - | - | - | - | - | - | - | - |
| Hwang et al. 2005 | Thorax | cross-sectional | 1 | - | - | - | - | - | X | - | - | - | - | - | - | - | - | - |
| Nicolai et al. 2003 | Eur Respir J | cross-sectional | 4 | - | - | - | - | - | X | - | X | - | - | - | X | - | - | X |
| Zhang et al. 2002 | Environ Health Perspect | cross-sectional | 1 | - | - | - | - | - | X | - | - | - | - | - | - | - | - | - |
| Pikhart et al. 2001 | Int Arch Occup Environ Health | cross-sectional | 2 | - | - | - | - | - | X | - | - | - | - | - | - | - | - | - |
| Dockery et al. 1996 | Environ Health Perspect | cross-sectional | 1 | - | - | - | - | - | X | - | - | - | - | - | - | - | - | - |
| Mölter et al. 2015 | Eur Respir J | pooled analysis of cohorts | 1 | - | - | - | - | - | - | X | - | - | - | - | - | - | - | - |
| Rancière et al. 2013 | Environ Health Perspect | cohort | 1 | - | - | - | - | - | - | X | - | - | - | - | - | - | - | - |
| Cakmak et al. 2016 | J Environ Manage | cross-sectional | 1 | - | - | - | - | - | - | - | X | - | - | - | - | - | - | - |
| Neophytou et al. 2016 | Am J Respir Crit Care Med | cross-sectional | 1 | - | - | - | - | - | - | - | X | - | - | - | - | - | - | - |
| Rice et al. 2016 | Am J Respir Crit Care Med | cross-sectional | 1 | - | - | - | - | - | - | - | X | - | - | - | - | - | - | - |
| Schultz et al. 2016a | J Allergy Clin Immunol | cross-sectional | 1 | - | - | - | - | - | - | - | X | - | - | - | - | - | - | - |
| Barone-Adesi et al. 2015 | PLoS One | cross-sectional | 1 | - | - | - | - | - | - | - | X | - | - | - | - | - | - | - |
| Fuertes et al. 2015 | Int J Hyg Environ Health | cross-sectional | 1 | - | - | - | - | - | - | - | X | - | - | - | - | - | - | - |
| Gauderman et al. 2015 | N Engl J Med | cohort (longitudinal) | 1 | - | - | - | - | - | - | - | X | - | - | - | - | - | - | - |
| Wang et al. 2015 | Environ Health Perspect | cross-sectional | 1 | - | - | - | - | - | - | - | X | - | - | - | - | - | - | - |
| Eeftens et al. 2014 | Epidemiology | cross-sectional | 1 | - | - | - | - | - | - | - | X | - | - | - | - | - | - | - |
| Eenhuizen et al. 2013 | Eur Respir J | cross-sectional | 1 | - | - | - | - | - | - | - | X | - | - | - | - | - | - | - |
| Gao et al. 2013 | Arch Dis Child | cross-sectional | 1 | - | - | - | - | - | - | - | X | - | - | - | - | - | - | - |
| Mölter et al. 2013 | Environ Health Perspect | cohort (longitudinal) | 1 | - | - | - | - | - | - | - | X | - | - | - | - | - | - | - |
| Hoek et al. 2012 | Eur Respir J | cross-sectional | 1 | - | - | - | - | - | - | - | X | - | - | - | - | - | - | - |
| Schultz et al. 2012 | Am J Respir Crit Care Med | cross-sectional | 1 | - | - | - | - | - | - | - | X | - | - | - | - | - | - | - |
| Islam et al. 2011 | Am J Respir Crit Care Med | cross-sectional | 1 | - | - | - | - | - | - | - | X | - | - | - | - | - | - | - |
| He et al. 2010 | Respir Med | cohort (longitudinal) | 1 | - | - | - | - | - | - | - | X | - | - | - | - | - | - | - |
| Gauderman et al. 2007 | Lancet | cohort (longitudinal) | 2 | - | - | - | - | - | - | - | X | - | - | - | X | - | - | - |
| Rojas-Martinez et al. 2007 | Am J Respir Crit Care Med | cohort (longitudinal) | 1 | - | - | - | - | - | - | - | X | - | - | - | - | - | - | - |
| Sugiri et al. 2006 | Environ Health Perspect | cross-sectional | 2 | - | - | - | - | - | - | - | X | - | - | - | X | - | - | - |
| Gauderman et al. 2004 | N Engl J Med | cohort (longitudinal) | 1 | - | - | - | - | - | - | - | X | - | - | - | - | - | - | - |
| Frye et al. 2003 | Environ Health Perspect | cross-sectional | 1 | - | - | - | - | - | - | - | X | - | - | - | - | - | - | - |
| Gauderman et al. 2002 | Am J Respir Crit Care Med | cohort (longitudinal) | 1 | - | - | - | - | - | - | - | X | - | - | - | - | - | - | - |
| Horak et al. 2002 | Eur Respir J | cohort (longitudinal) | 1 | - | - | - | - | - | - | - | X | - | - | - | - | - | - | - |
| Neuberger et al. 2002 | Atmos Environ | cohort (longitudinal) | 1 | - | - | - | - | - | - | - | X | - | - | - | - | - | - | - |
| Avol et al. 2001 | Am J Respir Crit Care Med | cohort (longitudinal) | 1 | - | - | - | - | - | - | - | X | - | - | - | - | - | - | - |
| Gauderman et al. 2000 | Am J Respir Crit Care Med | cohort | 1 | - | - | - | - | - | - | - | X | - | - | - | - | - | - | - |
| Brunekreef et al. 1997 | Epidemiology | cross-sectional | 2 | - | - | - | - | - | - | - | X | - | - | - | X | - | - | - |
| Raizenne et al. 1996 | Environ Health Perspect | cross-sectional | 1 | - | - | - | - | - | - | - | X | - | - | - | - | - | - | - |
| Wjst et al. 1993 | BMJ | cross-sectional associations | 2 | - | - | - | - | - | - | - | X | - | - | - | X | - | - | - |
| Dockery et al. 1989 | Am Rev Respir Dis | cross-sectional | 1 | - | - | - | - | - | - | - | X | - | - | - | - | - | - | - |
| Schwartz 1989 | Environ Res | cross-sectional | 2 | - | - | - | - | - | - | - | X | - | - | - | X | - | - | - |
| Schultz et al. 2016b | Am. J. Respir. Crit. Care Med. | cohort (longitudinal) | 1 | - | - | - | - | - | - | - | X | - | - | - | - | - | - | - |
| Lindgren et al. 2010 | BMC Public Health | case-control nested in a cross-sectional | 1 | - | - | - | - | - | - | - | - | X | - | - | - | - | - | - |
| Castro-Giner et al. 2009 | Environ Health Perspect | cohort | 1 | - | - | - | - | - | - | - | - | X | - | - | - | - | - | - |
| Jacquemin et al. 2009 | Eur Respir J | cohort | 1 | - | - | - | - | - | - | - | - | X | - | - | - | - | - | - |
| Künzli et al. 2009 | Thorax | cohort | 1 | - | - | - | - | - | - | - | - | X | - | - | - | - | - | - |
| Lindgren et al. 2009 | Int J Health Geogr | cross-sectional | 1 | - | - | - | - | - | - | - | - | X | - | - | - | - | - | - |
| Modig et al. 2009 | Eur Respir J | cohort | 1 | - | - | - | - | - | - | - | - | X | - | - | - | - | - | - |
| Modig et al. 2006 | Eur Respir J | case-control | 2 | - | - | - | - | - | - | - | - | X | - | - | - | X | - | - |
| Jedrychowski et al. 2009 | Environ Int | cohort | 1 | - | - | - | - | - | - | - | - | - | X | - | - | - | - | - |
| Koppen et al. 2009 | Environ Int | cohort | 1 | - | - | - | - | - | - | - | - | - | X | - | - | - | - | - |
| Schroer et al. 2009 | J Pediatr | cohort | 1 | - | - | - | - | - | - | - | - | - | X | - | - | - | - | - |
| Melén et al. 2008 | Environ Health Perspect | case-cohort | 3 | - | - | - | - | - | - | - | - | - | X | X | - | - | X | - |
| Oftedal et al. 2007 | Clin Exp Allergy | cohort | 2 | - | - | - | - | - | - | - | - | - | X | X | - | - | - | - |
| Ryan et al. 2007 | Environ Health Perspect | cohort | 1 | - | - | - | - | - | - | - | - | - | X | - | - | - | - | - |
| Jedrychowski et al. 2005 | Eur J Epidemiol | cohort | 1 | - | - | - | - | - | - | - | - | - | X | - | - | - | - | - |
| Guilbert et al. 2004 | J Allergy Clin Immunol | cohort | 1 | - | - | - | - | - | - | - | - | - | X | - | - | - | - | - |
| Miller et al. 2004 | Chest | cohort | 1 | - | - | - | - | - | - | - | - | - | X | - | - | - | - | - |
| McConnell et al. 2002 | Lancet | cohort | 1 | - | - | - | - | - | - | - | - | - | X | - | - | - | - | - |
| Clougherty et al. 2007 | Environ Health Perspect | cohort | 2 | - | - | - | - | - | - | - | - | - | - | X | - | - | X | - |
| Islam et al. 2007 | Thorax | cohort | 1 | - | - | - | - | - | - | - | - | - | - | X | - | - | - | - |
| Kan et al. 2007 | Thorax | cross-sectional | 1 | - | - | - | - | - | - | - | - | - | - | - | X | - | - | - |
| Hogervorst et al. 2006 | J Toxicol Environ Health A | cross-sectional | 1 | - | - | - | - | - | - | - | - | - | - | - | X | - | - | - |
| Schikowski et al. 2005 | Respir Res | cross-sectional | 1 | - | - | - | - | - | - | - | - | - | - | - | X | - | - | - |
| Sekine et al. 2004 | Occup Environ Med | cohort (longitudinal) | 1 | - | - | - | - | - | - | - | - | - | - | - | X | - | - | - |
| Fritz and Herbarth 2001 | Int J Hyg Environ Health | cross-sectional | 1 | - | - | - | - | - | - | - | - | - | - | - | X | - | - | - |
| Nakai et al. 1999 | Arch Environ Health | cohort (longitudinal) | 1 | - | - | - | - | - | - | - | - | - | - | - | X | - | - | - |
| Brugge et al. 2007 | Environ Health | cross-sectional | 1 | - | - | - | - | - | - | - | - | - | - | - | - | X | - | - |
| Meng et al. 2007 | Ann Allergy Asthma Immunol | cross-sectional | 1 | - | - | - | - | - | - | - | - | - | - | - | - | X | - | - |
| Salam et al. 2007a | Am J Respir Crit Care Med | cross-sectional | 1 | - | - | - | - | - | - | - | - | - | - | - | - | X | - | - |
| Salam et al. 2007b | Thorax | cross-sectional | 1 | - | - | - | - | - | - | - | - | - | - | - | - | X | - | - |
| Bayer-Oglesby et al. 2006 | Am J Epidemiol | cross-sectional | 1 | - | - | - | - | - | - | - | - | - | - | - | - | X | - | - |
| Gordian et al. 2006 | J Expo Sci Environ Epidemiol | cross-sectional | 2 | - | - | - | - | - | - | - | - | - | - | - | - | X | - | X |
| Kuehni et al. 2006 | Int J Epidemiol | cross-sectional | 1 | - | - | - | - | - | - | - | - | - | - | - | - | X | - | - |
| Meng et al. 2006 | Policy Brief | cross-sectional | 1 | - | - | - | - | - | - | - | - | - | - | - | - | X | - | - |
| Pujades-Rodríguez et al. 2009 | Occup Environ Med | retrospective | 1 | - | - | - | - | - | - | - | - | - | - | - | - | - | X | - |
| Lewis et al. 2004 | no info | no info | 1 | - | - | - | - | - | - | - | - | - | - | - | - | - | - | X |
| Lwebuga-Mukasa et al. 2004 | J Asthma | retrospective | 1 | - | - | - | - | - | - | - | - | - | - | - | - | - | - | X |
| Garshick et al. 2003 | Epidemiology | cross-sectional | 1 | - | - | - | - | - | - | - | - | - | - | - | - | - | - | X |
| Lin et al. 2002 | Environ Res | case-control | 1 | - | - | - | - | - | - | - | - | - | - | - | - | - | - | X |
| Wilkinson et al. 1999 | Thorax | case-control | 1 | - | - | - | - | - | - | - | - | - | - | - | - | - | - | X |
| Abbreviations: AL, allergy; AS, asthma; LF, lung function. | ||||||||||||||||||
Appendix D. Summary table of the primary reviews considered in the umbrella review
| Author | Purpose/objective | Search period | Number of studies | Main results | Conclusions of review article | Confounders/ considerations |
|---|---|---|---|---|---|---|
| Systematic reviews–meta-analyses | ||||||
Khreis et al. 2017 (asthma) |
Systematic review and meta-analysis that examined the association between TRAP exposures and the subsequent development of childhood asthma |
Done on September 8, 2016, with no limits on the initial publication date |
41 studies/ 21 studies (qualitative/ quantitative analysis) (Studies: 17 from Europe, 11 from North America, 5 from Japan, 3 from China, 1 from Korea, 1 from Taiwan, and 3 from multiple combined cohorts; 31 cohorts [24 birth cohorts], 6 case-controls [2 nested in a birth cohort], and 4 cross-sectionals) |
Adjusted ORs for asthma—any age:
D+L: 1.08 (95% CI: 1.03–1.14); I2 = 0%; p = 0.87
D+L: 1.05 (95% CI: 1.02–1.07); I2 = 65%; p = 0.0001
D+L: 1.48 (95% CI: 0.89–2.45); I2 = 87%; p = 0.00001
D+L: 1.03 (95% CI: 1.01–1.05); I2 = 28%; p = 0.18
D+L: 1.05 (95% CI: 1.02–1.08); I2 = 29%; p = 0.16 Adjusted ORs for asthma ≤6 years old:
D+L: 1.17 (95% CI: 1.01–1.36); I2 = 45%; p = 0.12
D+L: 1.08 (95% CI: 1.04–1.12); I2 = 26%; p = 0.23
D+L: 1.02 (95% CI: 0.69–1.49); I2 = 69%; p = 0.007
D+L: 1.04 (95% CI: 0.99–1.11); I2 = 41%; p = 0.16
D+L: 1.09 (95% CI: 1.04–1.15); I2 = 12%; p = 0.34 Adjusted ORs for asthma >6 years old:
D+L: 1.12 (95% CI: 1.00–1.24); I2 = 0%; p = 0.79
D+L: 1.03 (95% CI: 1.00–1.06); I2 = 62%; p = 0.001
D+L: 1.46 (95% CI: 0.77–2.78); I2 = 89%; p = 0.00001
D+L: 1.04 (95% CI: 1.02–1.07); I2 = 3%; p = 0.41
D+L: 1.04 (95% CI: 1.00–1.08); I2 = 5%; p = 0.39 Sensitivity analyses were also done. |
Overall meta-analysis showed positive and statistically significant associations with 4/5 pollutants examined (BC, NO2, PM2.5, and PM10). “There is now sufficient evidence to support an association between the exposure to TRAP and the development of childhood asthma. The high degree of consistency in findings and conclusions of the individual studies, the results of the meta-analysis, and considerable support from the existing literature reinforce the hypothesis that childhood exposure to TRAP contributes to their development of asthma.” |
Significant variability in asthma definitions, TRAP exposure assessment methods, and confounder adjustment. 8 studies considered children’s mobility at older ages. Quality assessment was done; selected studies were found to be of good quality (limitations include non-representative samples, evaluating asthma by questionnaires, and not adjusting for important confounders). Not enough studies to comprehensively examine publication bias, but not much concern except for NOx analysis, where the funnel plot is asymmetrical. Recall bias is a concern in parental reporting of doctor diagnoses. Also possibility of disease misclassification. |
Heinrich et al. 2016 (asthma, allergy) |
Systematic review and meta-analysis of birth cohort studies for causal role of TRAP exposure and asthma and allergic conditions |
1960–March 2014 |
27 studies/ 15 studies (qualitative/ quantitative analysis) (Included studies from 15 birth cohorts: 8 from Europe, 4 from Canada, 2 from the United States, and 1 from Taiwan) |
Asthma incidence:
With high-risk cohort removed:
Wheeze prevalence:
With high-risk cohort removed:
Allergic sensitization:
Aeroallergens:
With high-risk cohort removed for aeroallergens:
Hay fever:
With high-risk cohort removed:
Studies were too heterogeneous (different pollutants, different ages) for meta-analysis of eczema. |
“The epidemiological evidence supporting an association between TRAP with asthma and other allergic health outcomes remains insufficient to confirm a causal association.” Positive associations were determined but were not statistically significant. |
Included studies each scored at least 7/9 on the Newcastle–Ottawa scale for quality. Most studies relied on self-/ parental reporting of diseases and symptoms. Possible bias since some cohorts had substantial loss to follow-up (>40%), especially the ones with the longest follow-up periods. Asthma studies typically had about 10 years of follow-up. The follow-up period for wheeze was shorter. Exposure levels were variable in the studies, although all were below the World Health Organization guideline levels for PM2.5 and NO2. Most studies used LUR methods, although some had dispersion modelling, for exposure assessment. Included more studies and longer follow-up periods than Bowatte et al. (2015) did. Heterogeneity. |
Barone-Adesi et al. 2015 (lung function) |
Systematic review and meta-analysis of cross-sectional associations between NO2 and lung function among children or adolescents |
1990–2015 |
13 studies met the selection criteria |
6/6 studies of absolute difference in FEV1 had a significant decrease (linear models). Meta-analysis: −8 mL FEV1 (95% CI: −14 to −1 mL per 10 µg/m3 NO2; p = 0.016; I2 = 32% Sensitivity analysis did not indicate heterogeneity based on exposure methodology (e.g., LUR, dispersion models, or fixed monitoring stations) (p = 0.66) Sensitivity analysis based on diagnosis of asthma: Asthma: 1 mL FEV1 (95% CI: −15 to 17 mL; p = 0.90 1/9 studies of percentage change in FEV1 had a significant reduction (log-linear models). 7/9 studies had a non-significant inverse association. Sensitivity analysis did not indicate heterogeneity between ESCAPE project and other studies (p = 0.30). Sensitivity analysis based on diagnosis of asthma: Asthma: −0.5% FEV1 (95% CI: −1.9% to 1%; p = 0.51 |
Meta-analyses indicated a significant reduction in absolute FEV1 and percent FEV1 per 10 µg/m3 NO2. |
Funnel plots were symmetrical, and Begg’s and Egger’s tests did not indicate small-study bias. Sensitivity analysis was based on asthma diagnosis. Included studies: 8 from Europe, 1 from Asia, 4 from North America. For meta-analysis, all but one study adjusted for passive smoking at home and SES. |
Bowatte et al. 2015 (asthma, allergy) |
Systematic review and meta-analysis of birth cohort studies to evaluate the influence of early-childhood TRAP exposure on development of asthma and allergies |
1960–March 2014 |
19 articles met the inclusion criteria |
Asthma:
D+L: 1.09 (95% CI: 0.96–1.23); I2 = 75.5%, p = 0.003
D+L: 1.14 (95% CI: 1.00–1.30); I2 = 77.1%, p = 0.004 Age analysis: trend of increasing risk from 3 to 12 years (heterogeneity 0% to 52.3% with p = 0.148 to 0.797).
D+L: 1.20 (1.05–1.38); I2 = 19.3%, p = 0.290 Age analysis: Increasing trend of incidence of asthma up to age 6 (heterogeneity from 0% to 23.7% with p = 0.252 to 0.706)
1/6 cohorts reported significant associations for proximity to roads and risk of asthma at the ages of 2 and 6 years. Childhood exposure and wheeze: NO2: 2/6 cohorts reported significant associations for NOx and risk of wheeze at the ages of 1, 2, 3, 4, and 6 years. PM2.5: 1/4 cohorts had a significantly increased risk of wheeze for childhood exposures to PM at the ages of 1, 2, 3, 4, 5, 6, and 8 years. BC: 1/2 cohorts reported a significant increased risk of wheeze at the ages of 2, 3, 4, and 6 years. Road proximity: 2/4 cohorts reported significant associations with wheeze at the ages of 1 and 5 years. Allergy: Allergic sensitization NO2 (per 10 µg/m3 increase):
D+L: 1.09 (95% CI: 0.88–1.36); I2 = 36.6%, p = 0.208
D+L: 0.96 (95% CI: 0.74–1.25); I2 = 0%, p = 0.912
D+L: 1.28 (95% CI: 0.98–1.68); I2 = 44%, p = 0.181
D+L: 1.19 (95% CI: 1.00–1.42); I2 = 0%, p = 0.779 PM2.5 (per 2 µg/m3 increase):
D+L: 1.33 (95% CI: 0.94–1.88); I2 = 73.7%, p = 0.022
D+L: 1.00 (95% CI: 0.80–1.24); I2 = 0%, p = 0.649
D+L: 1.26 (95% CI: 1.00–1.60); I2 = 44%, p = 0.181
D+L: 1.18 (95% CI: 1.00–1.39); I2 = 0%, p = 0.474 Eczema: No meta-analysis performed (3 cohorts). NO2: 3/4 studies reported a positive association. PM2.5: 2/2 studies reported a neutral risk (risk estimates = 1.00). BC: 4/4 studies reported a positive association, 1 was significant. Distance to nearest road (<50 m): 2/3 studies reported a positive association. Hay fever: No meta-analysis performed (3 cohorts). NO2: 3/4 studies reported a positive association; 1 was neutral risk. PM2.5: 2/2 studies reported a positive association. BC: 4/4 studies reported a positive association, 1 was significant. Distance to nearest road (<50 m): 2/3 studies reported a positive association. |
Asthma: Proximity to roadway did not have a strong association for asthma. Allergy: Proximity to roadway did not have a strong association for asthma or allergic sensitization. |
11 birth cohorts included in studies, 7 from Europe and 4 from North America. 8 cohorts were population-based, 3 cohorts were high risk (family history of asthma or allergies). 2 cohorts recruited from a single hospital. Second-hand smoke was not adjusted for in 3 of the cohorts. Allergic predisposition was not adjusted for in 3 of the cohorts. Studies used different exposure metrics including LUR, dispersion models, passive samples, and central-site monitoring; these may account for some of the heterogeneity. Age analysis had a small number of studies in some age categories, reducing the accuracy of the estimates. |
Favarato et al. 2014 (asthma) |
Systematic review and meta-analysis aimed at the development of a concentration response function for NO2 and the prevalence of asthma symptoms that is appropriate for assessing the health impact of traffic policies |
Up to March 1, 2013 |
20 papers based on 18 studies met the inclusion criteria (12 studies from Europe, 3 from Asia, and 3 from the United States) |
18 study-specific estimates of prevalence (16 for wheeze and 2 for asthma diagnosis) were retained out of the 39 estimates extracted from the studies; ORs ranged from 0.61 (95% CI: 0.36–1.03) to 1.64 (95% CI: 1.06–2.54). Prevalence period of 12 months considered for wheeze and asthma symptoms. 4/18 ORs were < 1.00, 2/18 ORs were 1.00, and 12/18 ORs were > 1.00 (significant associations found for 2 studies). Exposure: NO2 was measured at home (10), at school (6), and at both locations (2) using study-specific monitors (6), LUR (6), dispersion models (4), or interpolation from monitors (2).
Overall:
Stratified by exposure assessment method: LUR:
Study monitor:
Dispersion:
Interpolation:
Moderate heterogeneity overall; no evidence of heterogeneity between groups: p = 0.261 The majority (16) of the estimates were not statistically significant at the 5% level, but the combined estimate was more precise (narrower CI and bordering on statistical significance at the 5% level). |
The meta-analysis results suggest that NO2 “may make a small proportional contribution to asthma prevalence in children.” Stratified analysis by exposure method indicated a larger effect for exposure based on study-specific monitors, located at schools. No evidence of heterogeneity between the groups based on exposure method. |
All studies considered potential confounders; the majority included at least one confounder from each of the following categories: indoor, socioeconomic, smoking, demographic, and other. Considerable heterogeneity in the subject age, the questionnaire, and the method of exposure assignment. No evidence of publication (small-study) bias based on symmetrical funnel plots and Begg’s and Egger’s tests. Sensitivity analyses were done. |
Gasana et al. 2012 (asthma) |
Meta-analysis to clarify potential associations between motor vehicle air pollutants and wheeze and asthma in children |
Up to January 2011 |
19 studies (Studies: 9 from Europe, 5 from North America, 4 from Asia, and 1 from Latin America; 9 cohorts and 10 cross-sectionals) Did not capture associations with SO2 and O3 |
Adjusted ORs using random-effects model for a 10 µg/m3 increase in pollutant levels: Asthma prevalence:
Wheeze prevalence:
Asthma incidence:
Wheeze incidence:
|
“Positive association between higher levels of NO2 exposure and higher prevalence and incidence of asthma in children.” “Positive association between higher levels of NOx exposure and higher prevalence of asthma.” “Increased exposure to PMs was positively associated with increased incidence of wheeze.” “CO exposure was positively associated with higher prevalence of asthma.” “Meta-analysis shows an association between several traffic-related air pollutants and the incidence and prevalence of asthma and wheeze in children living or attending school in close proximity to areas of high motor vehicle traffic.” |
Quality assessment was done. Self-reported symptoms through questionnaires (17/19 studies). Exposure was assessed differently in individual studies (e.g., LUR, dispersion models, monitoring sites). NOx/NO2: 11 studies estimated prevalence of asthma or wheeze; 6 studies estimated incidence of asthma or wheeze. PMs: 7 studies estimated prevalence of asthma or wheeze; 6 studies estimated incidence of asthma or wheeze. CO: 4 studies estimated prevalence of asthma or wheeze. |
| Systematic reviews | ||||||
Khreis and Nieuwen-huijsen 2017 (asthma) |
Systematic review of the exposure assessment methods used in the epidemiology of TRAP and childhood asthma Same methodology as Khreis et al. (2017) except that an additional primary study was included during screening |
1996–August 2016 (1988–August 2016 for Transport database) |
42 studies |
Limited information on risk estimates. The following relevant information is provided:
|
No conclusion on association of TRAP and asthma except that “further refinement of the exposure assessment may improve the risk estimates, and shed light on critical exposure time windows, putative agents, underlying mechanisms and drivers of heterogeneity.” |
Emphasis of the study is on exposure assessment; risk estimates are not provided and are described in limited detail. |
Schultz et al. 2017 (lung function) |
Summary of the epidemiological evidence on TRAP and lung function in children and adolescents |
January 2006–March 2017 |
32 cross-sectional articles and 12 longitudinal articles |
Most studies reported a negative impact of TRAP on measures of lung function. A larger effect estimate is observed for FEV1 than for FVC in many of the studies, although some show the reverse. Some studies had the largest effect for FEF25–75. Most deficits in lung function, associated with TRAP, range from 0.5% to 3%. Small changes would only be minor physiological effects in an individual but across a population would increase the prevalence in a population of subjects with lung function below clinical thresholds. Timing of exposure—early life, childhood, or adolescence—for effect on lung function is inconclusive. Any exposure over the entire age range is important. Also indication of lung function recovery when pollution levels decrease. Studies with stratification by sex were not conclusive, with almost equal numbers indicating a greater effect in boys or in girls. Limited evidence that asthma may be an effect modifier with strong associations seen in several studies. Inconclusive evidence that allergies or sensitization status may have an effect modification on the relationship between TRAP and lung function. |
Early-life and school-age exposures to TRAP can lead to reduced lung function, at least up to adolescence. The relative impact of timing of exposure is not established. Studies to date indicate that effects can be observed with any exposure over the entire early-life to adolescence age range. |
No discussion of confounders. The diversity of the studies, including measurements of lung function and exposure assessment, made direct comparisons of quantitative results difficult and precluded a quantitative summary. |
Jacque-min et al. 2012 (asthma) |
Review of the current evidence of a correlation between adult-onset asthma and air pollution, using objectively measured markers of exposure to ambient air pollution (All but one study used local markers of TRAP to characterize exposure) |
Up to June 2011 |
7 studies (Includes 6 cohorts based on 4 study populations and 1 case-control) |
7/7 studies showed consistent positive associations, not all reaching significance, between some metrics of long-term exposure to ambient air pollution and asthma incidence. 6/7 studies used markers for TRAP:
|
“Role of TRAP in adult-onset asthma is less conclusive than in childhood asthma.” Based on the prospective studies evaluated, results are consistent with a causal role of TRAP in the development of adult-onset asthma (consistent with that seen for asthma in children). However, the authors cannot dismiss the inconsistencies observed in prevalence studies. |
Protocols, definitions of asthma, and exposure assignment were heterogeneous. Lack of independence of estimates (3 analyses based on ECHRS). Reported patterns of effect modification (e.g., by sex, atopy, or smoking) were inconsistent. |
Koppen et al. 2011 (asthma, allergy) |
Review of cohort studies that examined the relationship between respiratory or allergy symptoms in children and early exposure to TRAP |
Not specified 2002–2009 according to references |
Overall: 18 studies from 10 birth cohorts (authors considered 17 studies, but 18 references are in the table) 6 studies from 2 ongoing children’s cohorts (extra reference that reported the same results) (Not focus of review but results summarized) Allergy: 6 studies (and a preliminary report) from 5 birth cohorts |
No risk estimates provided. Asthma: For birth cohorts: All 16 studies reported increased risk of respiratory symptoms in infants or children exposed prenatally to polycyclic aromatic hydrocarbons (PAHs) or postnatally to markers of TRAP; some of the associations were considered strong and positive. A study also assessed pollutants both prenatally and postnatally until age 1. Other cohorts: 4/5 studies reported associations between asthma (and wheeze) and TRAP (distance to roadway, markers of TRAP). Allergy: For birth cohorts:
|
“Suggestive evidence for a causal association between childhood asthma symptoms and exposure to TRAP.” The authors did not make any specific conclusions with respect to allergy based on their review of the literature. “The consistency in the overall conclusions of all reviewed studies indicates that traffic exhausts contribute to the development of respiratory symptoms.” |
Only positive associations were reported. Not all risk estimates were provided. Reliance on questionnaire-reported or self-reported symptoms (most studies). For allergy, the authors considered 6 studies to be positive, including the Oslo cohort, where lifetime exposure to NO2 was associated only with D. farinae. This association was attributed to confounders in Bråbäck and Forsberg (2009). |
Bråbäck and Forsberg 2009 (asthma, allergy) |
Assessment of the evidence from recent prospective studies in children to support a contribution of long-term traffic pollution to the development of asthma-like symptoms and allergic sensitization |
2002–2008 |
15 studies from 10 cohorts (6 birth cohorts and 4 prospective studies for school-aged children) Of which: |
Asthma: Increased risk of respiratory symptoms was demonstrated in all studies but the outcome varied by child’s age. Infants (0 to 2 years old):
4 to 6 years old:
Schoolchildren:
Allergy: Sensitization:
|
“Traffic exhaust contributes to the development of respiratory illness in childhood.” “A growing body of evidence also suggests that traffic related air pollutants may induce sensitization.” |
Reliance on questionnaire-reported or self-reported symptoms (13/15 studies). Use of different types of exposure assessment; some shown to perform better than others through internal validations. For asthma, associations were not consistently reported in the table (e.g., references 28 and 29). Prospective studies had crude exposure assessment, very small study size, or uncontrolled confounding at a community level. |
Götschi et al. 2008 (lung function) |
Review of all studies on long-term effects of air pollution on lung function published in the past 20 years. Subsequently, studies were limited to those comparing lung function across 4 or more communities or those based on individually assigned exposure |
Not specified “Over the past 2 decades” 1989–2007 according to references |
58 publications in total:
|
Focus of the review was on air pollution. TRAP-related results of the review are included here: Cross-sectional studies of children:
Cross-sectional studies of adults:
Longitudinal studies in children and adolescents:
Longitudinal studies in adults:
|
Studies suggest a link between traffic exposure and reduction in lung function for adults and children. |
Most of the review is focused on individual pollutants, not traffic‑/TRAP-specific. For traffic studies, SES and other community-level factors may not be fully adjusted for. |
Salam et al. 2008 (asthma) |
Impact of residential traffic-related exposures on asthma occurrence and severity |
January 2006–August 2007 |
12 studies on asthma occurrence and exacerbations (3 cohort, 1 case-control, and 8 cross-sectional) |
Prospective birth cohort studies:
Nested case-control study:
Cross-sectional studies:
|
“Residential proximity to traffic sources increases asthma occurrence and exacerbations.” Among children, risk from traffic is higher in children with no parental asthma. Genes involved in oxidative stress and inflammation may play a role in mediating the effects of traffic on asthma. |
Not all risk estimates were provided. Inconsistencies in findings could be attributed to the use of different methodologies in assessing local traffic-related exposures, use of self-/parental reporting of traffic intensity, missing data on traffic counts, and moderate to poor correlation between each traffic metric and modelled ambient traffic-related pollutants. Publication bias could not be ruled out. Reporting bias in individual studies. Recall bias for studies of parent-/self-reported health effects and exposures. |
| Selected other reviews | ||||||
Heinrich 2011 (asthma) |
Summary and evaluation of the results of epidemiological studies on a broad spectrum of indoor factors and asthma onset in childhood in “westernized” countries Only the section pertaining to traffic-related pollutants penetrating indoors was reviewed |
“Specific focus of the last decade” TRAP studies referenced: 2002–2010 |
14 studies on 7 birth cohorts |
12/14 studies (all studies except for Oslo birth cohort study) reported increased risk of asthma, asthma incidence, asthma prevalence, or persistent wheezing as a key symptom for asthma in early life. Not all effect estimates reached the level of statistical significance, but all were positive. Risk estimates were not fully reported. Studies used LUR, dispersion modelling, GIS traffic metrics, GIS-based regression model, or traffic-related pollutants to assess exposure. |
“Suggestive evidence that there is a causal relationship between traffic-related pollutants and onset of asthma in childhood.” |
Reliance on questionnaire-reported symptoms (9/14 studies). |
Boothe and Shendell 2008 (asthma) |
Health effects associated with defined residential proximity to traffic |
January 1999–June 2006 |
19 studies of respiratory health effects |
7/10 studies of self- or parent-reported symptoms had significant associations for proximity to traffic and wheeze; persistent and current wheeze was associated with residential proximity within 50, 75, and 150 m of a busy road, but not for greater distances. 3/5 studies of respiratory-related doctor visits and hospitalizations had associations for proximity to traffic. 4/6 studies of asthma prevalence had statistically significant associations for proximity to traffic; residential proximity within 75, 100, 150, and 300 m of dense traffic in the United States and France. |
“Consistent statistically significant associations reported between residential proximity to traffic and: increased prevalence and severity of symptoms of asthma; diminished lung function.” Critical review conclusion: Epidemiological evidence was insufficient to determine causality, due to uncertainties in exposure assessments (lack of individual exposure estimates), and confounding by other unmeasured factors could not be ruled out. |
Recall bias for studies of self-reported effects. Accuracy of reports from children. Varying definitions and understanding of wheeze. Proximity of residence to traffic does not account for time–activity patterns, variability of pollution penetration into residences, or indoor sources of pollutants. |
| Abbreviations: D+L, DerSimonian and Laird random-effects model; I-V, inverse variance fixed-effects model. | ||||||
- Footnote 1
-
A systematic review uses systematic methods to identify, appraise, and qualitatively synthesize the findings of primary research.
- Footnote 2
-
A systematic review–meta-analysis is a systematic review that quantitatively synthesizes the findings of primary research using meta-analysis techniques.
- Footnote 3
-
A scoping review systematically maps the available literature on a broad topic, identifying key concepts, types and sources of information, and gaps in the research.
- Footnote 4
-
Borderline significance: 0.9 ≤ lower 95% confidence limit ≤ 1.0.