
Archived Consumer Product Safety Program Five-Year Surveillance Report: 2013-2017
On this page:
- Executive Summary
- Consumer products
- Cosmetics
- Conclusion
- How to Report an incident involving a consumer product or cosmetic
- Contact us
Executive summary
This report describes the surveillance findings gathered by the Consumer Product Safety Program (CPSP) within Health Canada. The CPSP is responsible for the administration and enforcement of the Canada Consumer Product Safety Act (CCPSA) and its regulations, as well as cosmetic-related provisions of the Food and Drugs Act (FDA) and the Cosmetic Regulations. The purpose of the CCPSA is to protect the public by addressing or preventing dangers to human health or safety that are posed by consumer products in Canada, including those that circulate within Canada as well as those that are imported.
Within Health Canada, the CPSP promotes, monitors, verifies, and enforces compliance with the CCPSA and the FDA. It reviews reports submitted by industry and consumers and regularly monitors the marketplace to identify potentially dangerous products. The CPSP also gathers information domestically and internationally about injuries, emerging issues and new science related to consumer product and cosmetic safety. This information is then used to help conduct routine sampling and testing of products in the marketplace and support partnerships with the Canada Border Services Agency (CBSA) and other domestic and international regulators to verify the compliance of products being imported into Canada.
The CPSP also uses this information to evaluate risks to Canadians posed by consumer products and cosmetics. For example, it conducts assessments to identify issues that are a risk. This allows the strategic assignment of program resources towards products that pose the greatest risk to Canadians. When reviewing incoming incident and injury reports, the CPSP uses a triage-based approach to identify product-related health and safety issues for follow-up risk assessment and possible compliance and enforcement activity. It carefully monitors issues that do not require immediate attention so that it is prepared to take action if the risk changes over time. Finally, the CPSP provides credible information to consumers and provides tools to help guide informed decision-making by the public.
This is the first publicly available Five-Year Surveillance Report. This report presents an aggregate summary of all incident data reported to the CPSP between and that meet the definitions of a consumer product or cosmetic set out in legislation administer by Health Canada:
- A consumer product is a product, including its components, parts or accessories, that may reasonably be expected to be obtained by an individual to be used for non-commercial purposes, including for domestic, recreational and sports purposes, and includes its packaging; and
- A cosmetic includes any substance or mixture of substances manufactured, sold or represented for use in cleansing, improving or altering the complexion, skin, hair or teeth, and includes deodorants and perfumes.
This Five-Year Surveillance Report includes all incident reports for products that are sold within the Canadian marketplace, regardless of whether or not the incidents and injuries described in those reports happened domestically (57%) or internationally (43%).
The data has been divided by incidentsFootnote 1 pertaining to consumer products, regulated under the CCPSA and its regulations, and cosmetics, which are regulated under the FDA and the Cosmetic Regulations. Under the CCPSA, industry must report health or safety incidents involving a consumer product to Health Canada. This mandatory reporting provides Health Canada with a broad understanding of health- or safety-related incidents that occur with consumer products. There are no mandatory incident reporting requirements for cosmetics under the FDA or the Cosmetic Regulations. Finally, each subdivided section provides a table to illustrate the top 10 products reported overall as well as those associated with incident reports of injuries and deaths, with information concerning the hazards and injuries mentioned in the incident reports for those products.
The categorization of consumer products was carried out using the U.S. Consumer Product Safety Commission’s National Electronic Injury Surveillance System (NEISS) coding manual. The categorization of cosmetic products was based on the function of the product using CPSP’s Notification of Cosmetics guidelines.
The information provided in this Five-Year Surveillance Report reflects information as it was described in the incident reports submitted to the CPSP by industry and consumers (including governmental organizations, fire services, police, coroners, etc.) and does not capture all incidents in Canada. Reports submitted to the CPSP express opinions or observations of the individuals who wrote them. They may not always identify a health or safety concern with a particular consumer product or cosmetic or include a thorough description of the incident. CPSP acknowledges that a given event may be due to an underlying condition, product misuse or coincidental factors. The CPSP takes a risk-based approach and does not validate the claims of every report received. Information reported to the CPSP may concern incidents that occurred outside of Canada. The CPSP receives reports on an ongoing basis thus the statistics in this Five-Year Surveillance Report should be considered dynamic and subject to change.
Consumer products
Total reports received between 2013 and 2017 from consumers and industry
9,017 consumer product reports were received between and , of which 141 mentioned a death and 3,030 mentioned a non-fatal injury
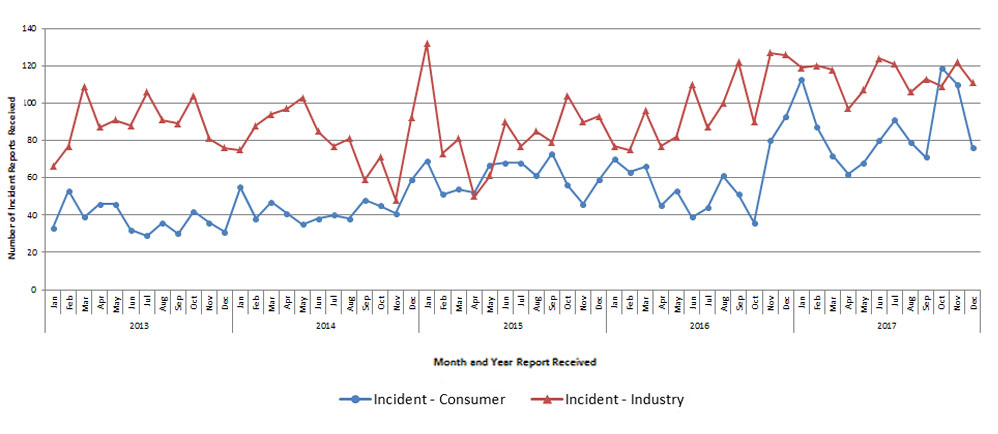
Figure 1. Number of consumer product reports received between 2013 and 2017 from consumers and industry
Text Description
| Month and Year Report Received |
Number of Incident Reports Received | ||
|---|---|---|---|
| Incident - Consumer | Incident - Industry | Grand Total | |
| 2013 | |||
| Jan | 33 | 66 | 99 |
| Feb | 53 | 77 | 130 |
| Mar | 39 | 109 | 148 |
| Apr | 46 | 87 | 133 |
| May | 46 | 91 | 137 |
| Jun | 32 | 88 | 120 |
| Jul | 29 | 106 | 135 |
| Aug | 36 | 91 | 127 |
| Sep | 30 | 89 | 119 |
| Oct | 42 | 104 | 146 |
| Nov | 36 | 81 | 117 |
| Dec | 31 | 76 | 107 |
| 2014 | |||
| Jan | 55 | 75 | 130 |
| Feb | 38 | 88 | 126 |
| Mar | 47 | 94 | 141 |
| Apr | 41 | 97 | 138 |
| May | 35 | 103 | 138 |
| Jun | 38 | 85 | 123 |
| Jul | 40 | 77 | 117 |
| Aug | 38 | 81 | 119 |
| Sep | 48 | 59 | 107 |
| Oct | 45 | 71 | 116 |
| Nov | 41 | 48 | 89 |
| Dec | 59 | 92 | 151 |
| 2015 | |||
| Jan | 69 | 132 | 201 |
| Feb | 51 | 73 | 124 |
| Mar | 54 | 81 | 135 |
| Apr | 52 | 50 | 102 |
| May | 67 | 61 | 128 |
| Jun | 68 | 90 | 158 |
| Jul | 68 | 77 | 145 |
| Aug | 61 | 85 | 146 |
| Sep | 73 | 79 | 152 |
| Oct | 56 | 104 | 160 |
| Nov | 46 | 90 | 136 |
| Dec | 59 | 93 | 152 |
| 2016 | |||
| Jan | 70 | 77 | 147 |
| Feb | 63 | 75 | 138 |
| Mar | 66 | 96 | 162 |
| Apr | 45 | 77 | 122 |
| May | 53 | 82 | 135 |
| Jun | 39 | 110 | 149 |
| Jul | 44 | 87 | 131 |
| Aug | 61 | 100 | 161 |
| Sep | 51 | 122 | 173 |
| Oct | 36 | 90 | 126 |
| Nov | 80 | 127 | 207 |
| Dec | 93 | 126 | 219 |
| 2017 | |||
| Jan | 113 | 119 | 232 |
| Feb | 87 | 120 | 207 |
| Mar | 73 | 118 | 191 |
| Apr | 62 | 97 | 159 |
| May | 68 | 107 | 175 |
| Jun | 80 | 124 | 204 |
| Jul | 91 | 121 | 212 |
| Aug | 79 | 106 | 185 |
| Sep | 71 | 113 | 184 |
| Oct | 119 | 109 | 228 |
| Nov | 110 | 122 | 232 |
| Dec | 76 | 111 | 187 |
| Grand Total | 3432 | 5586 | 9018 |
Oct 2017 saw 67% more consumer reported incidents than Sept 2017 due to an increase in the number of incidents reported pertaining to bassinets, barbecue brushes and dishwashers. Over time the CPSP has noticed fluctuations in reporting; November 2016 was one of those times, in which 122% more consumer reports were received than the previous month. Both cell phone and washing machine recalls influenced the increase during that time. See the embedded hyperlinks for more details on those product categories from that timeframe.
Top 10 consumer products reported
All of the injuries reported are grouped into different levels of severity (unknown, minor, or life threatening for example). These levels correspond to the overall risk that was reported and relies on factors such as: whether medical treatment was sought, whether the injury was sustained by a vulnerable population, and whether that injury was reversible.
Telephones or accessories
Number of reports received between 2013 and 2017
From consumers: 31
From industry: 530
Total: 561
The top hazards reported included:
- 50% (283 of 561) overheating/excessive heat,
- 15% (84 of 561) fire, and
- 10% (56 of 561) combustion.
73% (410 of 561) of the reports did not mention an injury.
The remaining 27% (151 of 561) of the reports mentioned injuries, of which:
- 81% (122 of 151) were minor,
- 12% (18 of 151) were moderate,
- 6% (10 of 151) did not have sufficient detail and were classified as unknown, and
- 1% (1 of 151) was life threatening or disabling.
The most common injuries reported were burns, electric shocks, and irritations or allergic reactions.
Laundry soaps or detergents
Number of reports received between 2013 and 2017
From consumers: 12
From industry: 347
Total: 359
The top hazards reported were toxicologicalFootnote * (99%; 355 of 359).
Only 1% (5 of 354) of the reports did not mention an injury.
99% (354 of 354) mentioned injuries, of which:
- 48% (170 of 354) were moderate,
- 36% (128 of 354) were severe,
- 8% (27 of 354) were life threatening or disabling,
- 3% (12 of 354) were fatal,
- 3% (11 of 354) were minor, and
- 2% (6 of 354) did not have sufficient detail and were classified as unknown.
The most common injuries reported were irritations or allergic reactions, and poisoning.
Ranges or ovens (unknown electric or gas)
Number of reports received between 2013 and 2017
From consumers: 105
From industry: 238
Total: 343
The top hazards reported included:
- 30% (104 of 343) explosion
- 25% (85 of 343) overheating/excessive heat,
- 12% (40 of 343) fire.
87% (299 of 343) of the reports did not mention an injury.
The remaining 13% (44 of 343) of the reports mentioned injuries, of which:
- 68% (30 of 44) were minor,
- 14% (6 of 44) were moderate,
- 9% (4 of 44) were fatal, and
- 9% (4 of 44) did not have sufficient detail and were classified as unknown.
The most common injuries reported were burns and cuts.
Electric ranges or ovens
Number of reports received between 2013 and 2017
From consumers: 151
From industry: 89
Total: 240
The top hazards included:
- 29% (69 of 240) overheating/excessive heat,
- 20% (47 of 240) fire,
- 13% (31 of 240) sharp edge or point.
83% (198 of 240) of the reports did not mention an injury.
The remaining 18% (42 of 240) of the reports mentioned injuries, of which:
- 74% (31 of 42) were minor,
- 12% (5 of 42) were moderate,
- 10% (4 of 42) did not have sufficient detail and were classified as unknown, and
- 5% (2 of 42) were fatal.
The most common injuries reported were burns and cuts.
Chairs (Excl. high chairs, patio chairs, recliners, or rocking chairs)
Number of reports received between 2013 and 2017
From consumers: 111
From industry: 107
Total: 218
The top hazards reported included:
- 50% (109 of 218) broken part,
- 8% (17 of 218) detached part, and
- 7% (15 of 218) instability.
76% (165 of 218) of the reports did not mention an injury.
The remaining 24% (53 of 218) of the reports mentioned injuries, of which:
- 38% (20 of 53) were minor,
- 26% (14 of 53) were moderate,
- 21% (11 of 53) did not have sufficient detail and were classified as unknown,
- 11% (6 of 53) were severe, and
- 4% (2 of 53) were fatal.
The most common injuries reported were bruises and cuts.
Diapers
Number of reports received between 2013 and 2017
From consumers: 14
From industry: 202
Total: 216
The top hazards reported included:
- 95% (206 of 216) toxicologicalFootnote *,
- 1% (2 of 216) broken part,
- 1% (2 of 216) sharp edge or point.
Only 3% (6 of 216) of the reports did not mention an injury.
97% (210 of 216) of the reports mentioned injuries, of which:
- 72% (151 of 210) were moderate,
- 18% (38 of 210) severe,
- 8% (16 of 210) were minor, and
- 2% (5 of 210) did not have sufficient detail and were classified as unknown.
The most common injuries reported were irritations and allergic reactions.
Light bulbs (Excl. Christmas tree light bulbs)
Number of reports received between 2013 and 2017
From consumers: 125
From industry: 73
Total: 198
The top hazards reported included:
- 27% (53 of 198) fire,
- 18% (36 of 198) overheating/excessive heat,
- 8% (15 of 198) explosion, and
- 8% (15 of 198) combustion.
91% (180 of 198) of the reports did not mention an injury.
The remaining 9% (18 of 198) of the reports mentioned injuries, of which:
- 61% (11 of 18) were minor,
- 22% (4 of 18) were unknown severity,
- 11% (2 of 18) did not have sufficient detail and were classified as unknown,
- 6% (1 of 18) were fatal.
The most common injuries were burns from hot bulbs and carbon monoxide poisoning.
Dishwashers
Number of reports received between 2013 and 2017
From consumers: 108
From industry: 62
Total: 170
The top hazards reported included:
- 42% (72 of 170) fire,
- 16% (28 of 170) smoke,
- 15% (26 of 170) excessive heat or overheating, and
- 12% (20 of 170) combustion.
90% (153 of 170) of the reports did not mention an injury.
The remaining 10% (17 of 170) of the reports mentioned injuries, of which:
- 65% (11 of 17) were minor,
- 18% (3 of 17) were moderate,
- 12% (2 of 17) did not have sufficient detail and were classified as unknown, and
- 6% (1 of 17) were fatal.
The most common injuries were cuts, poisoning and burns.
Thermostats
Number of reports received between 2013 and 2017
From consumers: 148
From industry: 15
Total: 163
The top hazards reported included:
- 33% (53 of 163) overheating/excessive heat,
- 32% (52 of 163) fire, and
- 18% (30 of 163) combustion.
99% (161 of 163) of the reports did not mention an injury.
The remaining 1% (2 of 163) mentioned a fatal burn and a minor electric shock.
Computers
Number of reports received between 2013 and 2017
From consumers: 29
From industry: 106
Total: 135
The top hazards reported included:
- 36% (48 of 135) excessive heat or overheating,
- 28% (38 of 135) fire, and
- 15% (20 of 135) smoke.
86% (116 of 135) of the reports did not mention an injury.
The remaining 14% (19 of 135) of the reports mentioned injuries, of which:
- 68% (13 of 19) were minor,
- 16% (3 of 19) did not have sufficient detail and were classified as unknown,
- 11% (2 of 19) were moderate, and
- 5% (1 of 19) were fatal.
The most common injuries reported were burns.
Top consumer products reported that mentioned a death
The products described as being associated with 3 or more deaths between 2013 and 2017 are presented here. Those described as being associated with 1 or 2 deaths were not included as there were over 40 different product types.
Laundry soaps or detergents
Number of reports received between 2013 and 2017 that mentioned a death
From consumers: 3
From industry: 9
Total: 12
Each of the 12 deaths reported over the last 5 years were described as being due to poisonings. Ten of the fatalities were described as being caused by ingesting the product; two were described as being attributed to the inhalation of laundry detergent chemical fumes as expelled via laundry machines.
Desks, dressers, chests, bureaus, or buffets
Number of reports received between 2013 and 2017 that mentioned a death
From consumers: 0
From industry: 9
Total: 9
Each of the 9 deaths reported over the last 5 years were described as being due to asphyxia and head injuries and were described as being caused by entrapment, tip over or instability of the product.
Personal protection devices (medical alert buttons)
Number of reports received between 2013 and 2017 that mentioned a death
From consumers: 1
From industry: 8
Total: 9
Two of the reported deaths over the last 5 years were described as being due to strangulation by the devices’ cords. The remaining 7 reported deaths were described as being due to electrical malfunctions of the devices, which prevented them from sending out emergency alerts when the consumers fell and suffered injuries.
Window shades, venetian blinds or indoor shutters
Number of reports received between 2013 and 2017 that mentioned a death
From consumers: 3
From industry: 3
Total: 6
The 6 deaths reported over the last 5 years were described as being due to asphyxiation and caused by entanglement with the product’s cord(s).
Coal or wood-burning stoves
Number of reports received between 2013 and 2017 that mentioned a death
From consumers: 6
From industry: 0
Total: 6
The 6 deaths reported over the last 5 years were described as being due to carbon monoxide poisoning and burns from fires.
Refrigerators
Number of reports received between 2013 and 2017 that mentioned a death
From consumers: 4
From industry: 1
Total: 5
The 5 deaths reported over the last 5 years were described as being due to carbon monoxide poisoning.
Cigarette or pipe lighters
Number of reports received between 2013 and 2017 that mentioned a death
From consumers: 4
From industry: 0
Total: 4
The 4 deaths reported over the last 5 years were described as being due to burns from fires.
Portable Generators
Number of reports received between 2013 and 2017 that mentioned a death
From consumers: 4
From industry: 0
Total: 4
The 4 deaths reported over the last 5 years were described as being due to carbon monoxide poisoning.
Ranges or ovens (unknown electric or gas)
Number of reports received between 2013 and 2017 that mentioned a death
From consumers: 4
From industry: 0
Total: 4
The 4 deaths reported over the last 5 years were described as being due to asphyxiation and carbon monoxide poisoning from fires.
Bassinets or cradles
Number of reports received between 2013 and 2017 that mentioned a death
From consumers: 2
From industry: 1
Total: 3
One of the reported deaths over the last 5 years was described as being due to asphyxia by entrapment within the product. The remaining 2 fatalities were described as being from unknown causes.
Candles and candle holders
Number of reports received between 2013 and 2017 that mentioned a death
From consumers: 3
From industry: 0
Total: 3
The 3 deaths reported over the last 5 years were described as being due to carbon monoxide poisoning and burns caused by fires.
Car seats (for infants or children)
Number of reports received between 2013 and 2017 that mentioned a death
From consumers: 1
From industry: 2
Total: 3
Two of the reported deaths over the last 5 years were described as being due to the child being ejected from the car seats during motor vehicle accidents. The remaining fatality was described as being from an unknown cause.
Top 10 consumer products reported that mentioned a non-fatal injury
All of the non-fatal injuries reported are grouped into different levels of severity (unknown, minor, or life threatening for example). These levels correspond to the overall risk that was reported and relies on factors such as: whether medical treatment was sought, whether the injury was sustained by a vulnerable population, and whether that injury was reversible.
Laundry soaps or detergents
Number of reports received between 2013 and 2017 that mentioned an injury
From consumers: 5
From industry: 337
Total: 342
60% (204 of 342) of the injuries reported were described as irritations or allergic reactions:
- 58% (119 of 204) were moderate,
- 35% (72 of 204) were severe,
- 4% (8 of 204) were life threatening or disabling,
- 1% (3 of 204) did not have sufficient detail and were classified as unknown, and
- 1% (2 of 204) was minor.
38% (130 of 342) of the injuries reported were described as poisoning from ingestion of laundry packs:
- 42% (55 of 130) were severe,
- 35% (46 of 130) were moderate,
- 14% (18 of 130) were life threatening or disabling,
- 6% (8 of 130) were minor, and
- 2% (3 of 130) did not have sufficient detail and were classified as unknown.
The remaining 2% (8 or 342) of the injuries reported included descriptions of the presence of foreign body, amputation of a limb that was infected, burns, and fractures from falls caused by slipping on leaked detergent.
The top hazard reported was toxicologicalFootnote *.
Diapers
Number of reports received between 2013 and 2017 that mentioned an injury
From consumers: 8
From industry: 202
Total: 210
95% (198 of 210) of the injuries reported were described as irritations or allergic reactions:
- 72% (143 of 198) were moderate,
- 18% (36 of 198) were severe,
- 8% (15 of 198) were minor, and
- 2% (4 of 198) did not have sufficient detail and were classified as unknown.
The remaining 5% (12 of 198) of reported injuries included descriptions of cuts, asphyxia or others that did not have sufficient detail and were classified as unknown.
The top hazard reported was toxicologicalFootnote *.
Telephones or accessories
Number of reports received between 2013 and 2017 that mentioned an injury
From consumers: 10
From industry: 141
Total: 151
77% (117 of 151) of the injuries reported were described as burns:
- 86% (101 of 117) were minor,
- 7% (8 of 117) were moderate, and
- 7% (8 of 117) did not have sufficient detail and were classified as unknown.
7% (10 of 151) of the injuries reported were described as electric shocks:
- 80% (8 of 10) were minor, and
- 20% (2 of 10) were moderate.
Another 7% (10 of 151) of injuries reported were described as irritations or allergic reactions:
- 60% (6 of 10) were moderate, and
- 40% (4 of 10) were minor.
The remaining 9% (14 of 151) of reported injuries included descriptions of bruises, cuts, poisoning or others that did not have sufficient detail and were classified as unknown.
The top hazards reported were excessive heat/overheating, fire, and explosion.
Footwear
Number of reports received between 2013 and 2017 that mentioned an injury
From consumers: 14
From industry: 46
Total: 60
30% (18 of 60) of the injuries reported were described as cuts:
- 56% (10 of 18) were minor,
- 22% (4 of 18) were moderate, and
- 22% (4 of 18) did not have sufficient detail and were classified as unknown.
20% (12 of 60) of the injuries reported were described as irritations or allergic reactions:
- 58% (7 of 12) were moderate,
- 17% (2 of 12) were minor,
- 17% (2 of 12) did not have sufficient detail and were classified as unknown, and
- 8% (1 of 12) were severe.
13% (8 of 60) of the injuries reported were described as fractures or sprain/strain:
- 38% (3 of 8) were moderate,
- 25% (2 of 8) were severe,
- 25% (2 of 8) were minor, and
- 12% (1 of 8) did not have sufficient detail and were classified as unknown.
10% (6 of 60) of the injuries reported were described as bruises:
- 50% (3 of 6) were minor,
- 33% (2 of 6) were moderate, and
- 17% (1 of 6) were severe.
7% (4 of 60) of the injuries reported were described as being due to burns, asphyxia, and the presence of foreign objects.
The remaining 20% (12 of 60) of injuries reported did not have sufficient detail and were classified as unknown.
Almost 40% of the reported injuries were described as being caused by an unknown hazard.
The top reported known hazard was sharp edge or point.
Fabric treatment products (Excl. spot removers, cleaning fluids, bleaches and dyes)
Number of reports received between 2013 and 2017 that mentioned an injury
From consumers: 11
From industry: 43
Total: 54
81% (44 of 54) of the injuries reported were described as irritations or allergic reactions:
- 68% (30 of 44) were moderate,
- 11% (5 of 44) were severe,
- 9% (4 of 44) were minor,
- 7% (3 of 44) were life threatening or disabling, and
- 5% (2 of 44) did not have sufficient detail and were classified as unknown.
15% (8 of 54) of the injuries were described as poisoning from ingesting the product:
- 63% (5 of 8) were moderate,
- 25% (2 of 8) did not have sufficient detail and were classified as unknown, and
- 12% (1 of 8) were severe.
The remaining 4% (2 of 54) of reported injuries were described as being due to severe burns, and sprains or strains from falls after slipping on the product.
The most common hazard reported was toxicologicalFootnote *.
Manual cleaning equipment (incl. barbecue brushes)
Number of reports received between 2013 and 2017 that mentioned an injury
From consumers: 41
From industry: 11
Total: 52
48% (25 of 52) of the injuries reported were described as cuts:
- 60% (15 of 25) were minor,
- 28% (7 of 25) were moderate,
- 4% (1 of 25) were life threatening or disabling,
- 4% (1 of 25) were severe, and
- 4% (1 of 25) did not have sufficient detail and were classified as unknown.
37% (19 of 52) of the injuries reported were described as being due to ingestion of foreign objects: • 68% (13 of 19) were severe,
- 68% (13 of 19) were severe,
- 16% (3 of 19) were life threatening or disabling, and
- 16% (3 of 19) were moderate.
8% (4 of 52) of the injuries reported were described as being due to fractures, and sprains or strains from tripping or slipping on the product:
- 50% (2 of 4) were severe,
- 25% (1 of 4) were minor, and
- 25% (1 of 4) were moderate.
The remaining 8% (4 of 52) of injuries reported did not have sufficient detail and were classified as unknown.
Of note, 79% (41 of 52) of reports were described as involving wire barbeque brushes.
The most common hazard reported was sharp edge or point.
Bicycles or accessories
Number of reports received between 2013 and 2017 that mentioned an injury
From consumers: 7
From industry: 44
Total: 51
27% (14 of 51) of the injuries reported were described as cuts:
- 64% (9 of 14) were minor,
- 21% (3 of 14) were moderate,
- 7% (1 of 14) were severe, and
- 7% (1 of 14) did not have sufficient detail and were classified as unknown.
22% (11 of 51) of the injuries reported were described as bruises:
- 91% (10 of 11) were minor, and
- 9% (1 of 11) were moderate.
25% (13 of 51) of the injuries reported were described as fractures or sprains/strains:
- 92% (12 of 13) were moderate, and
- 8% (1 of 14) were severe.
The remaining 25% (13 of 51) were described as being due to asphyxiation or others that did not have sufficient detail and were classified as unknown.
The top hazard reported was broken or detached part.
Chairs (excl. high chairs, patio chairs, recliners, or rocking chairs)
Number of reports received between 2013 and 2017 that mentioned an injury
From consumers: 11
From industry: 40
Total: 51
29% (15 of 51) of the injuries reported were described as bruises:
- 86% (13 of 15) were minor,
- 7% (1 of 15) were moderate, and
- 7% (1 of 15) did not have sufficient detail and were classified as unknown.
20% (10 of 51) of the injuries were described as cuts:
- 70% (7 of 10) were moderate,
- 20% (2 of 10) were minor, and
- 10% (1 of 10) did not have sufficient detail and were classified as unknown.
16% (8 of 51) of the injuries were described as fractures or sprains/strains:
- 50% (4 of 8) were severe,
- 38% (3 of 8) were moderate, and
- 12% (1 of 8) were minor.
Another 4% (2 of 51) of the injuries were described as severe amputations.
Of the remaining 31% (16 of 51) of injuries, 14 did not have sufficient detail and were classified as unknown, 1 was described as electric shock, and 1 was described as an irritation or allergic reaction.
The top hazards reported were sharp edge or point, broken part, detached part, collapse, tip over, and instability of the product.
Pressure cookers or canners
Number of reports received between 2013 and 2017 that mentioned an injury
From consumers: 0
From industry: 51
Total: 51
80% (41 of 51) of the injuries reported were described as burns:
- 46% (19 of 41) were minor,
- 39% (16 of 41) were moderate,
- 12% (5 of 41) were severe, and
- 2% (1 of 41) did not have sufficient detail and were classified as unknown.
12% (6 of 51) of the injuries reported were described as electric shock:
- 83% (5 of 6) minor, and
- 17% (1 of 6) did not have sufficient detail and were classified as unknown.
The remaining 8% (4 of 51) were described as being due to bruises, cuts or others that did not have sufficient detail and were classified as unknown.
The top hazard reported was explosion.
Tableware and accessories (excl. Drinking glasses)
Number of reports received between 2013 and 2017 that mentioned an injury
From consumers: 6
From industry: 38
Total: 44
50% (22 of 44) of the injuries were described as burns:
- 55% (12 of 22) were minor,
- 32% (7 of 22) were moderate, and
- 14% (3 of 22) were unknown severity.
36% (16 of 44) of the injuries were described as cuts:
- 64% (10 of 16) were moderate,
- 12% (2 of 16) were severe,
- 12% (2 of 16) were minor, and
- 12% (2 of 16) did not have sufficient detail and were classified as unknown.
The remaining 14% (6 of 44) of injuries were described as being due to poisoning, asphyxia or the presence of foreign objects.
The most common hazards reported were broken part, sharp edge or point, and explosion.
Find out more about consumer products.
Cosmetics
Total reports received between 2013 and 2017 by consumers and industry
468 cosmetic reports were received between January 1, 2013 and December 31, 2017, of which 1 mentioned a death and 293 mentioned a non-fatal injury
Cosmetics do not have any mandatory incident reporting requirements for industry under either the Food and Drugs Act or the Cosmetics Regulations. All reports received by industry are voluntary.
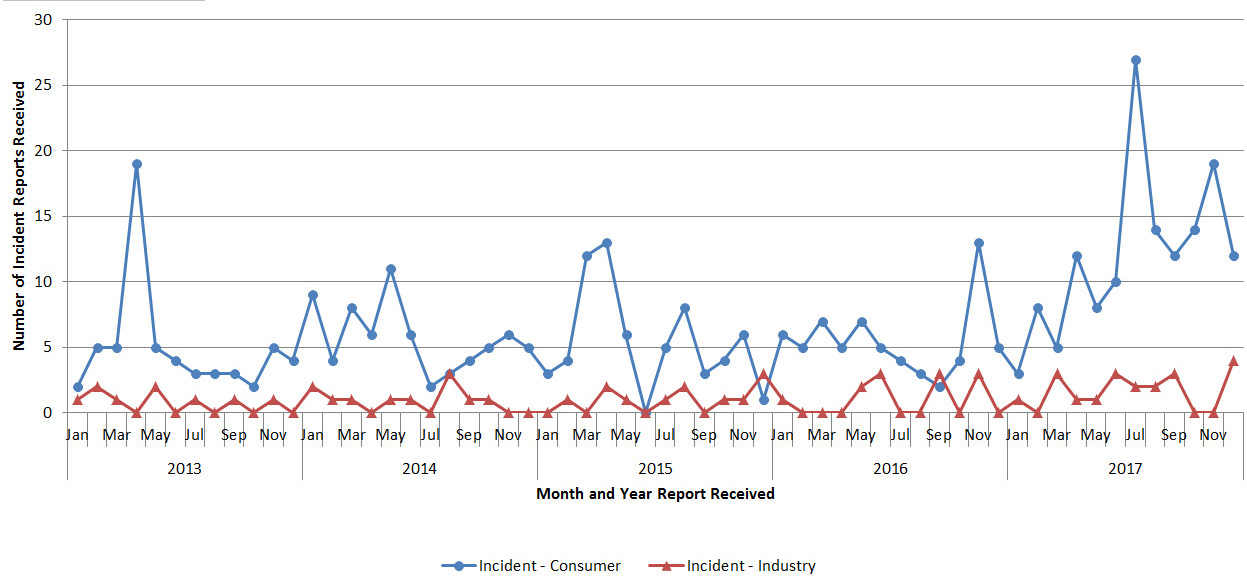
Figure 2. Number of cosmetic reports received between 2013 and 2017 from consumers and industry
Text Description
| Month and Year Report Received |
Number of Incident Reports Received | ||
|---|---|---|---|
| Incident - Consumer | Incident - Industry | Grand Total | |
| 2013 | |||
| Jan | 2 | 1 | 3 |
| Feb | 5 | 2 | 7 |
| Mar | 5 | 1 | 6 |
| Apr | 19 | - | 19 |
| May | 5 | 2 | 7 |
| Jun | 4 | - | 4 |
| Jul | 3 | 1 | 4 |
| Aug | 3 | - | 3 |
| Sep | 3 | 1 | 4 |
| Oct | 2 | - | 2 |
| Nov | 5 | 1 | 6 |
| Dec | 4 | - | 4 |
| 2014 | |||
| Jan | 9 | 2 | 11 |
| Feb | 4 | 1 | 5 |
| Mar | 8 | 1 | 9 |
| Apr | 6 | - | 6 |
| May | 11 | 1 | 12 |
| Jun | 6 | 1 | 7 |
| Jul | 2 | - | 2 |
| Aug | 3 | 3 | 6 |
| Sep | 4 | 1 | 5 |
| Oct | 5 | 1 | 6 |
| Nov | 6 | - | 6 |
| Dec | 5 | - | 5 |
| 2015 | |||
| Jan | 3 | - | 3 |
| Feb | 4 | 1 | 5 |
| Mar | 12 | - | 12 |
| Apr | 13 | 2 | 15 |
| May | 6 | 1 | 7 |
| Jun | - | - | - |
| Jul | 5 | 1 | 6 |
| Aug | 8 | 2 | 10 |
| Sep | 3 | - | 3 |
| Oct | 4 | 1 | 5 |
| Nov | 6 | 1 | 7 |
| Dec | 1 | 3 | 4 |
| 2016 | |||
| Jan | 6 | 1 | 7 |
| Feb | 5 | - | 5 |
| Mar | 7 | - | 7 |
| Apr | 5 | - | 5 |
| May | 7 | 2 | 9 |
| Jun | 5 | 3 | 8 |
| Jul | 4 | - | 4 |
| Aug | 3 | - | 3 |
| Sep | 2 | 3 | 5 |
| Oct | 4 | - | 4 |
| Nov | 13 | 3 | 16 |
| Dec | 5 | - | 5 |
| 2017 | |||
| Jan | 3 | 1 | 4 |
| Feb | 8 | - | 8 |
| Mar | 5 | 3 | 8 |
| Apr | 12 | 1 | 13 |
| May | 8 | 1 | 9 |
| June | 10 | 3 | 13 |
| Jul | 27 | 2 | 29 |
| Aug | 14 | 2 | 16 |
| Sep | 12 | 3 | 15 |
| Oct | 14 | - | 14 |
| Nov | 19 | - | 19 |
| Dec | 12 | 4 | 16 |
| Grand Total | 404 | 64 | 468 |
Top 10 cosmetic products reported
63% of the cosmetic reports received between January 2013 and December 2017 mentioned injuries. The top 10 products reported are also the top 10 products associated with the description of an injury. As with consumer products, all of the injuries reported are grouped into different levels of severity (unknown, minor, or life threatening for example). These levels correspond to the overall risk that was reported and relies on factors such as: whether medical treatment was sought, whether the injury was sustained by a vulnerable population, and whether the injury was reversible.
The single death reported between January 2013 and December 2017 was due to poisoning associated with a hairspray product.
Moisturizers
Number of reports received between 2013 and 2017
From consumers: 77
From industry: 12
Total: 89
Of the 89 reports, 61% (54 of 89) mentioned an injury.
Of the 54 injuries reported:
- 96% (52 of 54) mentioned irritations or allergic reactions,
- 2% (1 of 54) mentioned a poisoning, and
- 2% (1 of 54) did not have sufficient detail and were classified as unknown.
Injury severity:
- 54% (29 of 54) were minor,
- 41% (22 of 54) were moderate,
- 4% (2 of 54) were serious, and
- 2% (1 of 54) did not have sufficient detail and were classified as unknown.
The moisturizing products included:
- 40% (36 of 89) body moisturizers,
- 36% (29 of 89) face moisturizers, and
- 18% (16 of 89) eye moisturizers.
Cleansers
Number of reports received between 2013 and 2017
From consumers: 71
From industry: 17
Total: 88
Of the 88 reports, 63% (55 of 88) mentioned an injury
Of the 55 injuries reported:
- 89% (49 of 55) mentioned irritations or allergic reactions,
- 5% (3 of 55) mentioned poisoning, and
- 7% (4 of 55) did not have sufficient detail and were classified as unknown.
Injury severity:
- 51% (28 of 55) were moderate,
- 33% (18 of 55) were minor,
- 9% (5 of 55) were serious,
- 5% (3 of 55) did not have sufficient detail and were classified as unknown, and
- 2% (1 of 55) were life threatening or disabling.
The cleanser products included:
- 74% (65 of 88) body cleansers,
- 15% (13 of 88) face cleansers, and
- 7% (6 of 88) genital cleansers.
Makeup (non-permanent)
Number of reports received between 2013 and 2017
From consumers: 36
From industry: 4
Total: 40
Of the 40 reports, 45% (18 of 40) mentioned an injury.
All of the 18 injuries reported mentioned irritations or allergic reactions.
Injury severity:
- 33% (6 of 18) were moderate,
- 55% (10 of 18) were minor, and
- 12% (2 of 18) did not have sufficient detail and were classified as unknown.
The non-permanent makeup products included:
- 33% (13 of 40) eye makeup,
- 28% (11 of 40) face makeup,
- 20% (8 of 40) body makeup (includes henna and non-permanent tattoos), and
- 15% (6 of 40) lip makeup.
Bath Products
Number of reports received between 2013 and 2017 2017
From consumers: 29
From industry: 3
Total: 32
Of the 32 reports, 56% (18 of 32) mentioned an injury.
All of the 18 injuries reported mentioned irritations or allergic reactions.
Injury severity:
- 56% (10 of 18) were minor,
- 11% (2 of 18) were moderate,
- 11% (2 of 18) were severe,
- 11% (2 of 18) were life threatening or disabling, and
- 11% (2 of 18) did not have sufficient detail and were classified as unknown.
The bath products included:
- 47% (15 of 32) soaps, and
- 19% (6 of 32) bath bombs.
Cosmetic adhesives
Number of reports received between 2013 and 2017
From consumers: 24
From industry: 3
Total: 27
Of the 27 reports, 41% (11 of 27) mentioned an injury.
Of the 11 injuries:
- 82% (9 of 11) mentioned irritations or allergic reactions, and
- 18% (2 of 11) did not have sufficient detail and were classified as unknown.
Injury severity:
- 64% (7 of 11) were moderate,
- 18% (2 of 11) were minor,
- 9% (1 of 11) were severe, and
- 9% (1 of 11) did not have sufficient detail and were classified as unknown.
The adhesive products were:
- 74% (20 of 27) eyelash adhesives,
- 11% (3 of 27) body adhesives,
- 11% (3 of 27) nail adhesives, and
- 4% (1 of 27) other facial adhesives.
Shampoo
Number of reports received between 2013 and 2017
From consumers: 21
From industry: 5
Total: 26
Of the 26 reports, 85% (22 of 26) mentioned an injury.
All of the 22 injuries mentioned irritations or allergic reactions.
Injury severity:
- 64% (14 of 22) were moderate,
- 27% (6 of 22) were minor, and
- 9% (2 of 22) were severe.
Antiperspirants/Deodorants
Number of reports received between 2013 and 2017
From consumers: 22
From industry: 1
Total: 23
Of the 23 reports, 87% (20 of 23) mentioned an injury.
All of the 20 injuries mentioned irritations or allergic reactions.
Injury severity:
- 55% (11 of 20) were minor,
- 40% (8 of 20) were moderate, and
- 5% (1 of 20) were severe.
Fragrance Products
Number of reports received between 2013 and 2017
From consumers: 19
From industry: 0
Total: 19
Of the 19 reports, 21% (4 of 19) mentioned an injury.
All of the 4 injuries mentioned irritations or allergic reactions.
Injury severity:
- 75% (3 of 4) were minor, and
- 25% (1 of 4) were moderate.
Hair Colour – Permanent
Number of reports received between 2013 and 2017
From consumers: 18
From industry: 0
Total: 18
Of the 18 reports, 89% (16 of 18) mentioned an injury.
All of the 16 injuries mentioned irritations or allergic reactions.
Injury severity:
- 50% (8 of 16) were moderate,
- 38% (6 of 16) were minor, and
- 12% (2 of 16) were serious.
Conditioners
Number of reports received between 2013 and 2017
From consumers: 12
From industry: 2
Total: 14
Of the 14 reports, 71% (10 of 14) mentioned an injury.
Of the 10 injuries:
- 70% (7 of 10) mentioned irritations or allergic reactions,
- 20% (2 of 10) did not have sufficient detail and were classified as unknown, and
- 10% (1 of 10) mentioned cuts.
Injury severity:
- 50% (5 of 10) were minor,
- 40% (4 of 10) were moderate, and
- 10% (1 of 10) were severe.
Find out more about cosmetics.
Conclusion
The CPSP monitors reports received and takes appropriate action on unsafe consumer products and cosmetics. When the CPSP receives reports of products that pose a risk, it will triage and evaluate whether those risks require further action to be taken. Those could include activities such as conducting consumer outreach campaigns, compliance and enforcement projects, or standards development activities.
Over the last 5 years, the CPSP has seen an increase in the number of reports received for both consumer and cosmetic products. Since 2013, the overall number of consumer product and cosmetic reports has almost doubled, going from 1,500 to almost 2,600. We expect this number to continuously rise as more and more Canadians become aware of this program.
Among the most frequently reported products were laundry soaps and detergents. These products are ranked within the highest number of reports that mentioned death and injury as well. Despite this finding, there has been a decrease in the number of reports received pertaining to laundry detergent packets since 2015, which may be due to:
- increased consumer awareness,
- compliance promotion with industry on regulatory requirements, and
- the development of an industry standard designed to protect Canadian’s health and safety.
Additionally, as previously stated, the Program will carry out compliance and enforcement projects in relation to incidents and injuries that indicate a risk to Canadians. For example, in light of reports of incidents and deaths concerning window shades and blinds, the Program carried out an enforcement project during 2017 aimed at increasing compliance with the Corded Window Covering Products Regulations that resulted in several enforcement actions including some voluntary product recalls due risks that CPSP identified with those products. That finding and others can be seen in the Program’s Annual Compliance and Enforcement Report.
How to Report an incident involving a consumer product or cosmetic
Industry must report health or safety concerns involving a consumer product and are encouraged to voluntarily report health or safety issues involving a cosmetic.
Consumers are encouraged to report any health or safety issues directly to the CPSP involving either a consumer product or cosmetic, and can also send a report to the manufacturer, importer or retailer of the consumer product or cosmetic.
Report an incidentContact us
Any questions or comments on this report should be directed to cps-spc@hc-sc.gc.ca.