
Cancer in Young People in Canada: A Report from the Enhanced Childhood Cancer Surveillance System
Download the alternative format
(PDF format, 2,493 KB, 58 pages)
Organization: Health Canada
Type: [Publication Type]
Published: 2017-10-23
For the latest childhood cancer data from Cancer in Young People in Canada surveillance system, please visit the Cancer in Young People in Canada Data Tool
Table of Contents
- Acknowledgements
- Report highlights
- Introduction
- Program objectives and rationale
- Report scope
- Data sources
- Methods
- Results
- Conclusion
- References
- Appendix A: Data access
- Appendix B: Data integration
- Appendix C: Related publications
Acknowledgments
First and foremost, we thank patients and their families for providing information for the Cancer in Young People in Canada (CYP-C) program. The valuable information gained from their experiences contributes towards reducing the burden of childhood cancer in Canada.
We would like to acknowledge the support of the participating pediatric oncology centres and agencies: Alberta Children's Hospital, Allan Blair Cancer Centre, British Columbia Children's Hospital, CancerCare Manitoba, Centre hospitalier universitaire de Sherbrooke, Children's Hospital of Eastern Ontario, Children's Hospital - London Health Sciences Centre, Centre hospitalier universitaire de Québec - Université Laval, Centre hospitalier universitaire Sainte-Justine, The Hospital for Sick Children, Izaak Walton Killam (IWK) Health Centre, Janeway Children's Health and Rehabilitation Centre, Kingston General Hospital, McMaster Children's Hospital, Montreal Children's Hospital, Saskatoon Cancer Centre, Stollery Children's Hospital and the Pediatric Oncology Group of Ontario (POGO).
We are particularly grateful to the many clinical research associates who diligently worked on abstracting CYP-C data, ensuring its quality and providing constructive comments during the data cleaning process.
The Public Health Agency of Canada's staff have made critical contributions to the program. We are thankful to Kimberley Hutchings for her many years of dedicated work to establish the CYP-C database. We thank Maggie Stewart, Yong Jun Gao and Shiyi Chen, who helped with the mapping of data elements from the POGONIS surveillance system to CYP-C. We thank Jocelyn Rouleau for preparing the CYP-C data. We also thank Robert Semenciw, formerly of the Public Health Agency of Canada, for providing statistical advice.
The CYP-C surveillance system, fully funded by the Public Health Agency of Canada (PHAC), is a partnership between PHAC and the C17 Council, a network of all the seventeen pediatric cancer centres across Canada.
We sincerely acknowledge the collaboration between the provincial and territorial cancer registries and the Health Statistics Division of Statistics Canada for providing the Canadian Cancer Registry data.
Analytic and Writing Team
Debjani Mitra, Public Health Agency of Canada, Ottawa, Ontario
Lin Xie, Public Health Agency of Canada, Ottawa, Ontario
Jay Onysko, Public Health Agency of Canada, Ottawa, Ontario
CYP-C Steering Committee Members
Jay Onysko (Co-Chair), Public Health Agency of Canada, Ottawa, Ontario
Dr. James A. Whitlock (Co-Chair), C17 Council and The Hospital for Sick Children, Toronto, Ontario
Kathy Brodeur-Robb, C17 Council, Edmonton, Alberta
Jonathan Ellison, Statistics Canada, Ottawa, Ontario
Dr. Mark Greenberg, Paediatric Oncology Group of Ontario (POGO), Toronto, Ontario
Dr. Nada Jabado, C17 Research Network and McGill University, Montréal, Quebec
Dr. Melanie Keats, Dalhousie University, Halifax, Nova Scotia
Maureen MacIntyre, Canadian Council of Cancer Registries (CCCR) and Cancer Care Nova Scotia, Halifax, Nova Scotia
Antonia Palmer, Neuroblastoma Canada, Ontario
Rami Rahal, Canadian Partnership Against Cancer (CPAC), Toronto, Ontario
Dr. Lillian Sung, The Hospital for Sick Children, Toronto, Ontario
CYP-C Management Committee
Dr. Lillian Sung (Present Chair), The Hospital for Sick Children, Toronto, Ontario
Dr. Mark Bernstein (Previous Chair), IWK Health Centre, Halifax, Nova Scotia
Randy Barber, C17 Council, Edmonton, Alberta
Rose-Émilie Bergeron, McGill University Health Centre, Montréal, Quebec
Samuel Ileka-Priouzeau, Public Health Agency of Canada, Ottawa, Ontario
Émilie Martineau, Centre de recherche du CHU de Québec, Université Laval, Québec, Quebec
Debjani Mitra, Public Health Agency of Canada, Ottawa, Ontario
Jay Onysko, Public Health Agency of Canada, Ottawa, Ontario
Dr. Jason Pole, Pediatric Oncology Group of Ontario (POGO), Toronto, Ontario
Alicia Randall, IWK Health Centre, Halifax, Nova Scotia
Dr. David Stammers, Saskatoon Cancer Centre, Saskatoon, Saskatchewan
Dr. Caron Strahlendorf, British Columbia Children's Hospital, Vancouver, British Columbia
Dr. Tony Truong, Alberta Children's Hospital, Calgary, Alberta
Lin Xie, Public Health Agency of Canada, Ottawa, Ontario
CYP-C Principal Investigators
Riaz Alvi, Saskatoon Cancer Centre, Saskatoon, Saskatchewan
Dr. Mark Bernstein, IWK Health Centre, Halifax, Nova Scotia
Dr. Lynette Bowes, Janeway Child Health Centre, St. John's, Newfoundland
Dr. Josée Brossard, Centre hospitalier universitaire de Sherbrooke, Sherbrooke, Quebec
Dr. Henrique Bittencourt, Centre hospitalier universitaire Sainte-Justine, Montréal, Quebec
Dr. David Eisenstat, Stollery Children's Hospital, Edmonton, Alberta
Dr. Sara Israels, CancerCare Manitoba, Winnipeg, Manitoba
Dr. Ketan Kulkarni, IWK Health Centre, Halifax, Nova Scotia
Dr. Victor Lewis, Alberta Children's Hospital, Calgary, Alberta
Dr. Bruno Michon, CHU de Québec, Québec, Quebec
Dr. Caron Strahlendorf, British Columbia Children's Hospital, Vancouver, British Columbia
Dr. Blair Whittemore, Montreal Children's Hospital, Montréal, Quebec
We would also like to recognize the contributions of past members of the CYP-C Management and Steering committees for their vision, guidance, and support: Victor Barbaros, Rose-Émilie Bergeron, Dr. Anne-Sophie Carret, Val Figliuzzi, Dr. Paul Grundy, Rebekah Hiebert, Kathy Hjalmarsson, Kimberley Hutchings, Heather Logan, Dr. David Malkin, Dr. Mary McBride, Les Mery, Dr. Louise Parker, Amanda Shaw, and Dr. Donna Turner.
More information regarding this report is available from:
Cancer in Young People in Canada
Centre for Surveillance and Applied Research
Public Health Agency of Canada
785 Carling Avenue, Ottawa, Ontario K1A 0K9
E-mail: cypc-ccjc@phac-aspc.gc.ca
Website: www.phac-aspc.gc.ca/cd-mc/cancer/childhood_cancer-cancer_enfants-eng.php
Report highlights
Cancer in childhood is relatively rare but contributes disproportionately to disease-related mortality and can cause life-long morbidity with late effects among survivors.Footnote 1,Footnote 2 Childhood cancers are comprised of a heterogeneous group of malignancies that typically differ in distribution from adult cancer. For most pediatric cancers, little is known regarding the etiology of childhood tumours, limiting the potential for primary prevention. In development since 2009, the Cancer in Young People in Canada (CYP-C) surveillance system now offers an opportunity to study rare conditions like childhood cancer and provide a foundation for planning cancer control programs and policies.Footnote 3 The CYP-C surveillance system collects in-depth diagnostic, treatment, and outcome data on nearly all children under the age of 15 years diagnosed with cancer in Canada. CYP-C represents an extensive collaboration involving all 17 pediatric oncology centres in Canada, the C17 Council, provincial and territorial cancer registries, Statistics Canada, and non-governmental organizations working on childhood cancers in Canada. Researchers external to PHAC can also apply for access to CYP-C data. This inaugural report offers a range of basic surveillance measures using CYP-C and other relevant data sources in order to give an impression of the program's potential. For the latest surveillance information regarding childhood cancer and other chronic conditions, visit the Public Health Agency of Canada's online Public Health Infobase (https://health-infobase.canada.ca).
Childhood cancer incidence
- In this report, information is given for 5,125 children diagnosed with cancer in Canada between January 1, 2001, and December 31, 2006 and then followed for up to five years. During this period, childhood cancer was diagnosed at a rate of 152 new cases per million children, an average of approximately 855 cases per year.
- Cancer incidence rates for children aged 0 to 4 years (240 and 222 per million for the less than 1 year and 1 to 4 year age groups, respectively) were almost twice those of children aged 5 to 14 years (118 and 112 per million for the 5 to 9 and 10 to 14 age groups, respectively).
- Patterns of diagnoses varied greatly between age groups. In infants under the age of one, neuroblastoma accounted for nearly one third of all cases (28.2%), followed by leukemias (17.5%) and central nervous system (CNS) tumours (16.0%). Among 1 to 4 year olds, leukemias accounted for 41.7% of all diagnoses, while among 5 to 9 year olds and 10 to 14 year olds lymphomas and bone tumours became increasingly common.
- More males were diagnosed with cancer than females for a majority of the cancer types. However, retinoblastoma, renal tumours, germ cell tumours, and carcinomas were diagnosed more frequently in females compared to males.
- A trend toward increasing incidence of childhood cancer observed in CYP-C data is consistent with the trends identified in the Canadian Cancer Registry.
Time to diagnosis and treatment
- On average, children with cancer are diagnosed and treated in a relatively short time. Outside of Ontario:
- The median time interval from first health care contact to the initiation of anti-cancer treatment is 12 days, with some variation by age and diagnosis.
- Children between the ages of one and four years experienced a shorter first health care contact-to-treatment interval (9 days) compared to older children between the ages of 10 and 14 years (17 days).
- The median time interval between first health care contact and the initiation of anti-cancer treatment varied by diagnosis, with leukemia having the shortest interval (5 days) in contrast to less common cancers such as carcinomas and other neoplasms (68 and 43 days, respectively).
Patterns in initial treatment plans
- Twenty-six percent of all children in Canada were enrolled in a clinical trial that was approved by a research ethics board and that registration varied by diagnosis.
- Forty-four percent of children diagnosed with cancer were following a clinical trial protocol but not enrolled in a trial.
Survival of children diagnosed with cancer
- For children diagnosed with cancer between January 1, 2001, and December 31, 2006, overall five-year survival was 81.5%.
- Survival appeared to differ with age and diagnosis. Infants diagnosed under the age of one year had the lowest five-year survival among all age groups (77.4%).
- The largest diagnosis-related five-year survival proportions were seen for retinoblastoma (97.0%), carcinomas (91.3%) and lymphomas (91.3%), and the poorest five-year survival was seen for malignant bone tumours (62.0%) and soft tissue sarcomas (71.0%).
Metastatic disease at diagnosis
- The presence of metastatic disease at diagnosis, an indication of the extent to which the cancer has spread, has an impact on prognosis and determines the treatment plan. One quarter of children diagnosed with cancer were found to have metastatic disease.
- Children diagnosed with neuroblastoma, lymphoma, carcinomas and renal tumours had more metastatic disease at diagnosis.
Relapse after diagnosis
- As more children diagnosed with cancer survive, emphasis on survivorship care and long-term functioning become increasingly important. CYP-C results demonstrated that approximately 14.6% of children experienced a relapse within five years of diagnosis.
- Among all childhood cancer patients, those diagnosed with malignant bone tumours and soft tissue sarcomas experienced relapse within the first five years of their diagnosis more frequently than those with other diagnoses (24.9% and 20.4%, respectively).
Introduction
Although childhood cancer is rare and accounts for less than one percent of all cancers diagnosed in Canada, it has a profound impact on the health of children and their families. Despite gains in survival achieved over the last three decades, childhood cancer in Canada remains the leading cause of disease-related mortality in children over the age of one month.Footnote 3,Footnote 4 Childhood cancer can also lead to a high burden of serious and chronic disability caused by cancer treatments. The lifelong health, psychosocial, and financial impact of childhood cancer is well documented, showing diverse late effects that include cognitive impairments, damage to major organs such as the heart, kidneys, lungs and central nervous system, infertility, and the risk of developing second cancers due to treatment.Footnote 1 It is estimated that more than 60% of childhood cancer survivors suffer from at least one chronic condition and almost 30% have severe or life-threatening conditions.Footnote 2
Cancers in children tend to differ from those that develop in adults. Children develop a high proportion of embryonal or hematopoietic cancers (cancers of blood and lymphatic cells and tissues).Footnote 1 The main types of cancers in children are leukemias, cancers of the brain and nervous systems and lymphomas. Cancers that originate from embryonic cells are also relatively common among children and include cancers such as nephroblastoma, neuroblastoma, medulloblastoma, rhabdomyosarcoma, and retinoblastoma. These cancers generally have shorter latency periods, may exhibit rapid and aggressive growth, but are generally more responsive to chemotherapy as a result.
Compared to adult cancers, only a small proportion of childhood cancers have known causes, limiting the potential for primary and secondary prevention.Footnote 1 The rarity of the disease, its lifelong consequences, and largely unknown risk factors points to the potential value of a national system of surveillance specifically designed to provide an opportunity to study rare conditions like childhood cancer and provide a foundation for planning cancer control programs and policies.
In order to complement and build upon the foundational information provided by the Canadian Cancer Registry, in 2009, the Public Health Agency of Canada launched a specialized pan-Canadian childhood cancer surveillance system that actively follows children who were diagnosed before the age of 15 years and treated at one of the 17 pediatric oncology centres across the country.Footnote 3 The program is the renewal of the federal government's Canadian Childhood Cancer Surveillance and Control Program (CCCSCP).Footnote 5 Established under the Brighter Futures initiative in 1992, the CCCSCP included comprehensive data on a child's cancer diagnosis, treatments, outcomes, and health care utilization. CYP-C started collecting national surveillance data in 2009 and covers cancer cases newly diagnosed in 2001 or later. The surveillance system includes data on demographics (date of birth, ethnicity, province, and postal code of residence at diagnosis), diagnostic details (date of diagnosis, type of diagnosis, site, stage, and metastases at diagnosis), treatments (enrollment on clinical trial, treatment plan details), location and timing of care, and outcomes (hospitalizations, surgeries, complications, relapse, survival).Footnote 3 These data are available for research related to childhood cancer (see APPENDIX A for details). This inaugural report offers a range of basic surveillance measures using CYP-C and other relevant data sources in order to give an impression of the program's potential.
| Centre | Location |
|---|---|
| B.C. Children's Hospital | Vancouver, British Columbia |
| Alberta Children's Hospital | Calgary, Alberta |
| Stollery Children's Hospital | Edmonton, Alberta |
| Saskatoon Cancer Centre | Saskatoon, Saskatchewan |
| Allan Blair Cancer Centre | Regina, Saskatchewan |
| CancerCare Manitoba | Winnipeg, Manitoba |
| Children's Hospital, London Health Sciences Centre | London, OntarioFootnote * |
| McMaster Children's Hospital | Hamilton, OntarioFootnote * |
| The Hospital for Sick Children | Toronto, OntarioFootnote * |
| Kingston General Hospital | Kingston, OntarioFootnote * |
| Children's Hospital of Eastern Ontario | Ottawa, OntarioFootnote * |
| Centre hospitalier universitaire Sainte-Justine | Montréal, Quebec |
| The Montreal Children's Hospital | Montréal, Quebec |
| Centre hospitalier universitaire de Sherbrooke | Sherbrooke, Quebec |
| Centre hospitalier universitaire de Québec - Université Laval | Québec, Quebec |
| Izaak Walton Killam Health Centre | Halifax, Nova Scotia |
| Janeway Children's Health and Rehabilitation Centre | St. John's, Newfoundland |
|
|
Program objectives and rationale
The CYP-C surveillance system was designed to fill gaps in knowledge about cancer control by collecting data on diagnosis, treatment, and short- to medium-term outcomes on children in Canada diagnosed with cancer. It allows for an examination of the variation in diagnostic and treatment patterns and outcomes across the country and provides a foundation for examining long-term health and functioning and etiologic investigations. The surveillance system has several objectives, namely to:
- provide national and regional population-based childhood cancer data on incidence, mortality and survival;
- describe patterns and trends of incidence, mortality and survival of childhood cancer by sex, age at diagnosis, year of diagnosis, place of diagnosis, cancer type, stage, risk category and extent of disease;
- assess short- and medium-term outcomes such as relapses, toxicities and complications related to treatment;
- provide data on the timing, location and utilization of health care for evaluation and planning; and
- function as a resource for generating hypotheses and research into pediatric cancer.
Report scope
The aim of this report is to provide clinicians, researchers and policy makers with relevant surveillance information on childhood cancer in Canada and provide information that will form the basis for new research questions and etiologic investigations. This is the first report from the CYP-C surveillance system. It covers the analysis of surveillance data on children aged 0 to 14 years who were diagnosed with cancer in Canada between January 1, 2001, and December 31, 2006, with follow-up of outcomes through to December 31, 2011, a period for which all data have been verified.
Data sources
CYP-C data collection and inclusion criteria
CYP-C aims to include all children diagnosed under the age of 15 years who were treated at a pediatric oncology centre in Canada with a diagnosis listed in the International Classification of Childhood Cancer, 3rd Edition (ICCC-3).Footnote 6 Only those diagnosed in 2001 or later residing in Canada for at least one month prior to diagnosis are included. Comparisons of incidence cases in CYP-C to the Canadian Cancer Registry (CCR)Footnote 7 have shown that very few childhood cancer cases (0 to 14 years) are treated outside these centres.Footnote 3 For each child, data are collected for a maximum of five years after diagnosis (or until death). If a child is diagnosed with a subsequent malignancy meeting CYP-C eligibility criteria, data are collected for another five-year period after the diagnosis.
There are two broad methods of data collection, which differ for Ontario centres compared to centres outside of Ontario. In Ontario, the Pediatric Oncology Group of Ontario (POGO) has maintained a population-based registry of incident cancer cases since 1985, diagnosed or treated in one of the five pediatric oncology centres in the province. Information is then shared with the Public Health Agency of Canada through a data sharing agreement. In all other Canadian jurisdictions, data are abstracted directly from patient medical charts by clinical research associates and entered into a secure electronic data entry and management tool. Data are then collated at the Public Health Agency of Canada in Ottawa, Ontario (see APPENDIX B for a detailed explanation of data integration).
Research ethics boards at the Public Health Agency of Canada and all pediatric oncology centres outside of Ontario participating in direct data collection have permitted CYP-C to collect detailed data on every eligible child, creating a truly population-based surveillance system.Footnote 3 Researchers outside the 17 participating pediatric oncology centres can also apply for access to CYP-C data (see APPENDIX A).
Canadian Cancer Registry (CCR) database for cancer incidence trends
Long-term cancer incidence trends were also examined using the Canadian Cancer Registry databaseFootnote 7 (1992 to 2010). Quebec data from 2008 to 2010 were incomplete in the CCR, consequently data for these years were obtained in a summary format from the Institut national de santé publique du Québec. Incidence data are collected by the provincial and territorial cancer registries, which report data annually to CCR at Statistics Canada. The CCR is a dynamic, person-oriented, population-based database with cases newly diagnosed from 1992 onward.
Canadian Vital Statistics Death Database (CVSD) for cancer mortality trends
The long-term cancer mortality trends were examined using the Canadian Vital Statistics Death Database (CVSD, 1992 to 2010).Footnote 8,Footnote 9 Death records originate with the provincial and territorial registrars of vital statistics and are provided regularly to Statistics Canada for inclusion in the CVSD. Cancer deaths are those for which some form of cancer, as certified by a physician, is the underlying cause of death.
Population data for calculating cancer incidence rates
Population estimates for Canada and the provinces/territories were based on quinquennial censuses conducted from 1991 to 2011. We used intercensal estimates prepared by Statistics Canada for the years between these censuses.Footnote 10
Data validation and completeness
The number of incident cases captured in CYP-C combined with the Pediatric Oncology Group of Ontario's Networked Information System (POGONIS) approaches 95% of malignant cases captured in the Canadian Cancer Registry (CCR). In addition to malignant cases, CYP-C and POGONIS capture benign or borderline (non-malignant) cases that the CCR does not routinely capture in all jurisdictions or for all years.Footnote 4 Non-malignant cases comprise approximately 8% of all cases held by CYP-C and POGONIS from 2001 to 2006. See Table A1 (in APPENDIX B) for an annual comparison of CCR and CYP-C/POGONIS case capture.
While POGONIS has captured data routinely since 1985, the CYP-C surveillance system is being populated through a process of historical data capture which began in 2009. It remains possible that additional historical cases will be added in the future. All figures and tables in this report are subject to future revision.
Methods
Data for all CYP-C analyses were extracted from the system on December 1, 2016. Age-standardized incidence rates (ASIRs), sex ratios of all cancers combined and by cancer type, and observed survival proportions (OSPs) were calculated for children under 15 years of age at diagnosis who were diagnosed with a cancer listed in the ICCC-3 (Langerhans cell histiocytosis and other histiocytosis are included) between January 1, 2001, and December 31, 2006 (N = 5125). Each case registered in CYP-C was followed up to five years from the date of diagnosis.
Demographic and clinical characteristics used for this report included date of diagnosis, date of birth, age at diagnosis, sex, ethnicity, province and/or region at diagnosis, type of diagnosis, whether or not the cancer was a first malignancy, whether or not there was metastasis at the time of diagnosis, treatment plan used, time to diagnosis and treatment, date of death and vital status during the last follow-up period, which lasts five years from the date of diagnosis (relapse or death and associated dates).
It is important to note that death clearance has not been conducted on the cohort and therefore deaths may be slightly underestimated. Custom tabulations from the Canadian Cancer Registry show that death certificate only (DCO) cases among children diagnosed with cancer under the age of 15 are very rare and less than 0.25 % of all childhood cases are DCO cases.Footnote 11 Age at the time of diagnosis was used to categorize cases into the following age groups: less than 1 year, 1 to 4 years, 5 to 9 years, and 10 to 14 years. The regions used in this report were based on the most accurate residential information available for cases at the time of diagnosis. The following regional categories were used: Atlantic (Nova Scotia, New Brunswick, Prince Edward Island, Newfoundland and Labrador); Prairies (Manitoba, Saskatchewan, Alberta); Territories (Yukon, Northwest Territories, Nunavut); and the provinces of British Columbia, Ontario, and Quebec.
ASIRs were calculated as the average annual number of cases per million children using the direct method,Footnote 12 which employs weighted age-specific incidence rates for four childhood age groups (less than 1, 1 to 4, 5 to 9, and 10 to 14 years) according to the 1991 Canadian standard population. Incidence rates were calculated based on the number of primary neoplasms, more than one of which may occur in a single patient.
Joinpoint regression was used to identify changes in the trends of annual age-standardized rates of selected cancers over the period from 2001 to 2010 for both incidence and mortality.Footnote 13 The annual percent change (APC) in cancer incidence and mortality rates was calculated by fitting a piecewise linear regression model, assuming a constant rate of change in the logarithm of the annual ASIR and ASMR in each segment.Footnote 14 The estimated slope from this model was then transformed back to represent an annual percentage increase or decrease in the rate. The models incorporated estimated standard errors of the ASIR and ASMR. To reduce the likelihood of reporting spurious changes in trends, we used a minimum of five observations from a joinpoint to either end of the data and minimum of four observations between joinpoints. Statistical significance was determined using Monte Carlo permutation tests with the Bonferroni adjustment and an overall significance level of 0.05. The APC was considered statistically significant if its 95% confidence interval (CI) did not include zero (p < 0.05).
Diagnostic and treatment time intervals were examined for cancers diagnosed from 2001 to 2006, including: 1) time between initial health care contact and the date of definitive diagnosis; 2) time between the date of definitive diagnosis and the start date of anti-cancer therapy; and 3) time from initial health care contact to the initiation of anti-cancer treatment. Cases in Ontario were excluded from analysis due to differences in definitions in dates used to calculate time intervals.Footnote 15 The median and interquartile ranges (25 to 75th percentile) for the time intervals were calculated by sex, age at diagnosis, region of residence at diagnosis and cancer type. The Wilcoxon rank sum test16 was performed to test differences in medians. Two-sided test of significance (p < 0.05) was used to assess statistical significance.
The actuarial method was used to calculate one-, three- and five- year observed survival proportions (OSPs). This method of analysis was used as cases were diagnosed within a defined calendar period (between 2001 and 2006) and followed up for vital status over the full period of interest (five years). Asymmetric 95% CIs were derived using log (-log) transformation.
To ensure confidentiality and limit the possibility of residual disclosure, all counts have been randomly rounded either up or down to a multiple of 5. As a result, if these counts are totalled, they may not match the totals and percentages presented in the tables. Age-specific incidence rate was derived using the random-rounded numerator, while the age-standardized rate was derived using the actual count. The age-specific or age-standardized incidence rates are not presented when the actual count is less than three.
Exclusions
Children who were not residents of Canada but were diagnosed or temporarily treated in Canada were excluded from the analyses. Further, cases of true disease evolution (12 cases), where the disease initially diagnosed later evolved to have different morphology or a higher grade of tumour, were also excluded as were cases with missing ICCC information (80 cases). Cases from Ontario which did not receive both diagnostic work-up and subsequent treatment at a POGO program site, or children who were cared for in a POGO program site but who were not Ontario residents (240 cases), were excluded as well.
Limitations
The descriptive analyses presented in this report do not control for potential confounders other than as described. Rates were calculated regardless of the number of aggregated cases unless otherwise specified. Given the relative rarity of some cancers, the rates presented in this report should be interpreted with caution as it can be difficult to distinguish differences based on random fluctuation from true differences in the underlying rate when the number of cases is small (e.g., fewer than 20 cases).
Results
Childhood cancer incidence
A total of 5125 new childhood cancer cases (0 to 14 years of age) were included in the CYP-C surveillance system between 2001 and 2006. An average of 855 children were diagnosed with cancer each year. The majority of children were diagnosed only with a first malignancy (99.6%). CYP-C collects data on initial diagnoses that have been changed due to new clinical, pathological or radiological findings. A revised diagnosis was assigned to 51 children (approximately 1.7 % of cases) diagnosed between 2001 and 2006.
A description of the cohort presented in this report can be found in Table 1. Children under the age of five years were more frequently diagnosed (45.5%) than those in the 5 to 9 year or 10 to 14 year age groups, and just over half were male (54.8%). The majority of children resided in either Ontario (41.1%) or Quebec (23.0%) at the time of diagnosis. Very few were residents of the Northwest Territories, the Yukon, or Nunavut (less than 0.5%), consequently all results concerning the territories must be interpreted with caution. The predominant ethnicity captured was White/Caucasian (71.8%), followed by Asian (10.3%). Approximately 7.7% of cases were identified as being of Black, Arab/West Asian, or mixed ethnicities, and 2.4% and 1.1 % were identified as being of Aboriginal and Latin American descent, respectively (Table 1). These proportions reflect the diversity in children in Canada for most ethnic groups, with exception of Aboriginal children from First Nations, Inuit, and Métis backgrounds, who according to the 2006 census made up 6.3%Footnote 17 of the total Canadian population in the 0 to 14 age group, and Black children, who according to the 2006 Census made up 4.0% of the total Canadian pediatric population of the same age.Footnote 18 The under-representation of these ethno-cultural groups may reflect the limitations of using medical charts to identify ethnic and cultural constructs, as per CYP-C data collection procedures, relative to census data collection which relies on self-identification. Though is also underscores the importance of exploring differences in childhood cancer incidence by ethnicity in Canada as geographical and ethnic patterns in childhood incidence have been observed worldwide.Footnote 19
| Number of Diagnoses | Percent (%) | |
|---|---|---|
| Total diagnoses | 5125 | |
| Age at diagnosis (in years) | ||
| <1 | 490 | 9.5% |
| 1-4 | 1845 | 36.0% |
| 5-9 | 1365 | 26.7% |
| 10-14 | 1420 | 27.8% |
| Sex | ||
| Male | 2810 | 54.8% |
| Female | 2315 | 45.2% |
| Ethnicity | ||
| Aboriginal | 125 | 2.4% |
| Arab/West Asian | 95 | 1.9% |
| Asian | 530 | 10.3% |
| Black | 145 | 2.8% |
| Latin American | 60 | 1.1% |
| White | 3675 | 71.8% |
| Other/Mixed Ethnicity | 150 | 3.0% |
| Unknown/Missing | 345 | 6.7% |
| Year of diagnosis | ||
| 2001 | 840 | 16.4% |
| 2002 | 855 | 16.6% |
| 2003 | 860 | 16.8% |
| 2004 | 820 | 16.0% |
| 2005 | 885 | 17.3% |
| 2006 | 865 | 16.9% |
| Region | ||
| Atlantic | 360 | 7.0% |
| Québec | 1180 | 23.0% |
| Ontario | 2105 | 41.1% |
| Prairies | 865 | 16.9% |
| British Columbia | 590 | 11.6% |
| Territories | 15 | 0.3% |
| Primary malignancies | ||
| Single malignancy | 5105 | 99.6% |
| Two or more malignancies | 20 | 0.4% |
Data source: The Cancer in Young People in Canada Program / The Pediatric Oncology Group of Ontario Network Information System
Notes:
- To ensure confidentiality, case counts were randomly rounded either up or down to a multiple of 5. Counts, totals, and percentages may not add up due to rounding.
- Percentages were calculated on actual data.
Most common cancers
Overall, leukemias (31.4%), tumours of the central nervous system (CNS) [23.7%], and lymphomas (13.4%) represented the most common ICCC-3 diagnostic groups (Figure 1). Unlike adults, where carcinomas dominate, carcinomas are very rare and represented 2.9% of all malignancies in children. In children, embryonal tumours were more common and made up about one quarter of all diagnoses (Table 2).
| Cancer Type | New cases | ASIR (per 1,000,000) | |||||
|---|---|---|---|---|---|---|---|
| Males | Females | Total | M/FFootnote * | Males | Females | Total | |
| All cancers combined | 2810 | 2320 | 5125 | 1.2 | 163 | 141.2 | 152.4 |
| I Leukemias, myeloproliferative diseases, and myelodysplastic diseases | 895 | 710 | 1610 | 1.3 | 53 | 43.9 | 48.6 |
| I(a) Lymphoid leukemias | 750 | 550 | 1300 | 1.4 | 44.2 | 34.3 | 39.4 |
| I(b) Acute myeloid leukemias | 105 | 100 | 205 | 1.0 | 5.9 | 6.2 | 6 |
| I(c) Chronic myeloproliferative diseases | 10 | 20 | 30 | 0.7 | 0.6 | 0.9 | 0.8 |
| I(d) Myelodysplastic syndrome and other myeloproliferative diseases | 25 | 30 | 55 | 0.9 | 1.6 | 1.9 | 1.8 |
| I(e) Unspecified and other specified leukemias | 10 | 10 | 20 | 1.1 | 0.6 | 0.6 | 0.6 |
| II Lymphomas and reticuloendothelial neoplasms | 440 | 245 | 685 | 1.8 | 24.5 | 14.2 | 19.5 |
| II(a) Hodgkin lymphomas | 125 | 95 | 220 | 1.3 | 6.5 | 5 | 5.8 |
| II(b) Non-Hodgkin lymphomas (except Burkitt lymphoma) | 130 | 65 | 195 | 2.0 | 7.1 | 3.7 | 5.5 |
| II(c) Burkitt lymphoma | 80 | 15 | 95 | 5.3 | 4.4 | 0.9 | 2.7 |
| II(d) Miscellaneous lymphoreticular neoplasms | 105 | 75 | 175 | 1.5 | 6.4 | 4.5 | 5.5 |
| II(e) Unspecified lymphomas) | <5 | <5 | <5 | 3.0 | 0.2 | ‒ | 0.1 |
| III CNS and miscellaneous intracranial and intraspinal neoplasms | 660 | 555 | 1210 | 1.2 | 38 | 33.3 | 35.7 |
| III(a) Ependymomas and choroid plexus tumour | 70 | 50 | 120 | 1.4 | 4 | 3.1 | 3.6 |
| III(b) Astrocytomas | 265 | 255 | 525 | 1.1 | 15.5 | 15.4 | 15.4 |
| III(c) Intracranial and intraspinal embryonal tumours | 160 | 95 | 255 | 1.7 | 9.3 | 5.9 | 7.6 |
| III(d) Other gliomas | 70 | 55 | 120 | 1.2 | 3.8 | 3.2 | 3.5 |
| III(e) Other specified intracranial and intraspinal neoplasms | 95 | 90 | 185 | 1.0 | 5.1 | 5.3 | 5.2 |
| III(f) Unspecified intracranial and intraspinal neoplasms | <5 | 5 | 10 | 0.6 | 0.2 | 0.4 | 0.3 |
| IV Neuroblastoma and other peripheral nervous cell tumours | 205 | 165 | 375 | 1.3 | 13.2 | 10.9 | 12.1 |
| IV(a) Neuroblastoma and ganglioneuroblastoma | 210 | 165 | 370 | 1.3 | 13.1 | 10.8 | 12 |
| IV(b) Other peripheral nervous cell tumours | <5 | <5 | <5 | 2.0 | ‒ | ‒ | 0.1 |
| V Retinoblastoma | 40 | 55 | 100 | 0.7 | 2.7 | 3.9 | 3.3 |
| VI Renal tumours | 115 | 130 | 245 | 0.9 | 7.1 | 8.2 | 7.6 |
| VI(a) Nephroblastoma and other nonepithelial renal tumours | 110 | 120 | 235 | 0.9 | 6.8 | 7.8 | 7.3 |
| VI(b) Renal carcinomas | 5 | 5 | 10 | 1.0 | 0.3 | 0.3 | 0.3 |
| VII Hepatic tumours | 45 | 35 | 80 | 1.2 | 2.6 | 2.3 | 2.5 |
| VII(a) Hepatoblastoma | 35 | 35 | 65 | 1.2 | 2.3 | 2.1 | 2.2 |
| VII(b) Hepatic carcinomas | 5 | <5 | 10 | 1.7 | 0.3 | 0.2 | 0.2 |
| VII(c) Unspecified malignant hepatic tumours | <5 | 0 | <5 | ‒ | ‒ | ‒ | |
| VIII Malignant bone tumours | 105 | 105 | 210 | 1.0 | 5.6 | 5.7 | 5.7 |
| VIII(a) Osteosarcomas | 55 | 50 | 105 | 1.1 | 2.9 | 2.8 | 2.8 |
| VIII(b) Chondrosarcomas | 0 | <5 | <5 | 0.0 | ‒ | ‒ | ‒ |
| VIII(c) Ewing tumour and related sarcomas of bone | 45 | 45 | 85 | 1.0 | 2.4 | 2.4 | 2.4 |
| VIII(d) Other specified malignant bone tumours | <5 | 10 | 10 | 0.4 | 0.2 | 0.4 | 0.3 |
| VIII(e) Unspecified malignant bone tumours | <5 | <5 | <5 | 3.0 | 0.2 | ‒ | 0.1 |
| IX Soft tissue and other extraosseous sarcomas | 150 | 135 | 290 | 1.1 | 8.6 | 8.3 | 8.5 |
| IX(a) Rhabdomyosarcomas | 75 | 65 | 140 | 1.2 | 4.3 | 3.7 | 4 |
| IX(b) Fibrosarcomas, peripheral nerve sheath tumours, and other fibrous neoplasms | 10 | 25 | 35 | 0.4 | 0.7 | 1.6 | 1.1 |
| IX(d) Other specified soft tissue sarcomas | 50 | 45 | 100 | 1.2 | 2.9 | 2.7 | 2.8 |
| IX(e) Unspecified soft tissue sarcomas | 15 | 10 | 20 | 1.9 | 0.7 | 0.4 | 0.6 |
| X Germ cell tumours, trophoblastic tumours, and neoplasms of gonads | 70 | 85 | 150 | 0.8 | 3.9 | 4.9 | 4.4 |
| X(a) Intracranial and intraspinal germ cell tumours | 30 | 15 | 45 | 2.1 | 1.6 | 0.8 | 1.2 |
| X(b) Malignant extracranial and extragonadal germ cell tumours | 15 | 25 | 40 | 0.6 | 0.8 | 1.5 | 1.2 |
| X(c) Malignant gonadal germ cell tumours | 20 | 45 | 60 | 0.4 | 1.1 | 2.4 | 1.7 |
| X(d) Gonadal carcinomas | 0 | <5 | <5 | 0.0 | ‒ | ‒ | ‒ |
| X(e) Other and unspecified malignant gonadal tumours | 5 | <5 | 10 | 1.7 | 0.3 | 0.2 | 0.2 |
| XI Other malignant epithelial neoplasms and malignant melanomas | 60 | 90 | 150 | 0.7 | 3.2 | 5 | 4.1 |
| XI(a) Adrenocortical carcinomas | <5 | 10 | 15 | 0.5 | 0.3 | 0.5 | 0.4 |
| XI(b) Thyroid carcinomas | 10 | 40 | 55 | 0.4 | 0.8 | 2.2 | 1.5 |
| XI(c) Nasopharyngeal carcinomas | <5 | <5 | 5 | 0.8 | 0.2 | 0.2 | 0.2 |
| XI(d) Malignant melanomas | 10 | 10 | 25 | 0.9 | 0.6 | 0.7 | 0.6 |
| XI(e) Skin carcinomas | <5 | <5 | <5 | 1.0 | ‒ | ‒ | 0.1 |
| XI(f) Other and unspecified carcinomas | 25 | 20 | 50 | 1.0 | 1.3 | 1.3 | 1.3 |
| XII Other and unspecified malignant neoplasms | 10 | 10 | 20 | 1.1 | 0.6 | 0.5 | 0.6 |
| XII(a) Other specified malignant tumours | <5 | <5 | 10 | 2.0 | 0.2 | ‒ | 0.2 |
| XII(b) Other unspecified malignant tumours | 10 | 10 | 10 | 0.9 | 0.3 | 0.4 | 0.4 |
Notes:
Data source: The Cancer in Young People in Canada Program / The Pediatric Oncology Group of Ontario Network Information System
|
|||||||
Patterns of diagnoses varied considerably by age group.In infants aged less than 1 year, neuroblastoma accounted for more than one quarter of all cases (28.2%), followed by leukemias (17.5%) and CNS tumours (16.0%) while embryonal tumours (neuroblastoma, retinoblastoma, and nephroblastoma) combined accounted for 42.0% of all diagnoses. Leukemias predominated among 1 to 4 year olds, accounting for 41.7% of all diagnoses, while in 5 to 9 year olds and 10 to 14 year olds lymphomas and bone tumours became increasingly common (lymphomas in 5 to 9 year olds and 10 to 14 year olds, respectively: 12.9% and 23.6%; bone tumours in 5 to 9 year olds and 10 to 14 year olds, respectively: 4.2% and 9.3%). Embryonal tumours like retinoblastoma, nephroblastoma, neuroblastoma, intracranial and intraspinal embryonal tumours, rhabdomyosarcoma, and germ cell tumours were exceedingly rare in children 10 years and older. In this age group, CNS tumours (24.3%) and lymphomas (23.6%) predominated (Figure 1).
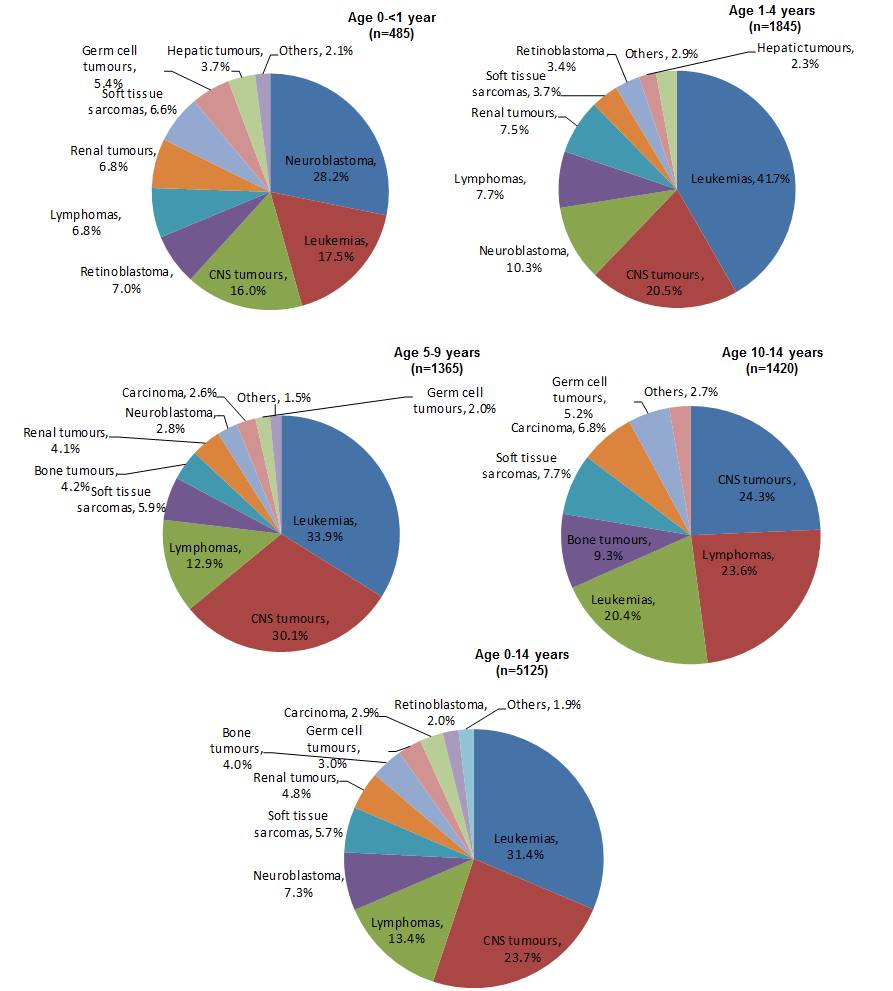
Figure 1 - Text Description
Figure 1 presents a series of five pie charts, with each chart representing children in one of five age groups. Each pie chart shows the proportion of the incident cancer cases diagnosed from 2001 through 2006 by type as a percentage of the total of all cancer diagnoses during that period among children in that age group. The age groups include 0 to 14 years, less than one year, 1 to 4 years, 5 to 9 years, and 10 to 14 years. The cancer types in each chart include the major diagnostic categories summarized as leukemias, central nervous system (CNS) tumours, lymphomas, neuroblastomas, soft tissue sarcomas, renal tumours, bone tumours, germ cell tumours, carcinoma, retinoblastoma, and other cancers. Only those categories representing at least two percent of all diagnoses for each age group were included in each pie chart.
The Figure 1 table below contain the percentages represented in the pie charts. For each age group, the three most commonly diagnosed cancers are most notable as accounted for at least two-thirds of all diagnoses. The three most commonly diagnosed cancers differed by type across age groups. Neuroblastomas (28.2%) followed by leukemias (17.5%), and CNS tumours (16.0%) were the most common among children aged less than one year. Among children 1 to 4 years old, leukemias (41.7%) were more common than CNS tumours (20.5%) and neuroblastomas (10.3%), where for children 5 to 9 years old leukemias (33.9%) were most common, followed by CNS tumours (30.1%) and lymphomas (12.9%). Collectively, children aged 0 to 14 years were most frequently diagnosed with leukemias (31.4%), CNS tumours (23.7%), and lymphomas (13.4%).
| Cancer Type | Children 0 to 14 years old | Children less than 1 year old | Children 1 to 4 years old | Children 5 to 9 years old | Children 10 to 14 years old |
|---|---|---|---|---|---|
| Leukemias | 31.4% | 17.5% | 41.7% | 33.9% | 20.4% |
| CNS tumours | 23.7% | 16.0% | 20.5% | 30.1% | 24.3% |
| Lymphomas | 13.4% | 6.8% | 7.7% | 12.9% | 23.6% |
| Neuroblastomas | 7.3% | 28.2% | 10.3% | 2.8% | |
| Soft tissue sarcomas | 5.7% | 6.6% | 3.7% | 5.9% | 7.7% |
| Renal tumours | 4.8% | 6.8% | 7.5% | 4.1% | |
| Bone tumours | 4.0% | 4.2% | 9.3% | ||
| Germ cell tumours | 3.0% | 5.4% | 2.0% | 5.2% | |
| Carcinoma | 2.9% | 2.6% | 6.8% | ||
| Retinoblastoma | 2.0% | 7.0% | 3.4% | ||
| Others | 1.9% | 2.1% | 2.9% | 1.50% | 2.7% |
| Hepatic tumours | 3.7% | 2.3% |
Data sources include the Cancer in Young People in Canada (CYP-C) Program and the Pediatric Oncology Group of Ontario Network Information System.
Data sources: Cancer in Young People in Canada (CYP-C) Program / The Pediatric Oncology Group of Ontario Network Information System
Overall, the observed frequencies of the more common cancers and age-specific patterns were consistent with incidence patterns reported in other industrialized countries.Footnote 20
Number of new cancers and rates by sex
The overall male to female ratio in incidence was observed to be 1.2:1. The sex difference in the incidence of pediatric cancer is well established and consistent worldwide. The male to female ratio for all cancers is around 1.2:1.Footnote 21,Footnote 22 Sex ratios of new cases varied by diagnosis but with a few exceptions, males were more frequently diagnosed with cancer than females (Table 2).
The age-standardized incidence rate showed that there were 163 new cancer cases for every million males aged 0 to 14 and 141 for every million females aged 0 to 14. Considering specific cancers, the ASIR was 73% higher for lymphoma in males than females. The rate was 21% higher among males for leukemia, 14% higher for CNS tumours, and 21% higher for neuroblastoma. Sex-specific ASIRs were similar for soft tissue sarcomas. While cancers were generally diagnosed more often in males than females, there was a higher incidence of retinoblastomas, renal tumours, germ cell tumours, and carcinomas (especially, thyroid carcinoma) in females compared to males.
Several factors may contribute to sex differences in incidence, including sex hormones, genetic differences, and environmental factors; however, the exact cause or causes remain poorly understood.Footnote 21,Footnote 23,Footnote 24,Footnote 25
Cancer incidence by age and region
Table 3 provides the number of new cases and age-specific rates by cancer type and age group. Between 2001 and 2006, cancer incidence rates for children aged 0 to 4 (240 and 222 per million for the less than 1 and 1 to 4 age groups, respectively) were about twice those of children aged 5 to 14 (118 and 112 per million for the 5 to 9 and 10 to 14 age groups, respectively). This pattern varied greatly by tumour type.
| Cancer Type | Age group (in years) | |||||||
|---|---|---|---|---|---|---|---|---|
| <1 | 1-4 | 5-9 | 10-14 | |||||
| New cases | Rates | New cases | Rates | New cases | Rates | New cases | Rates | |
| All cancers combined | 485 | 240.4 | 1845 | 221.6 | 1365 | 118.2 | 1420 | 111.8 |
| I Leukemias, myeloproliferative diseases, and myelodysplastic diseases | 85 | 42.1 | 770 | 92.5 | 460 | 39.8 | 290 | 22.8 |
| I(a) Lymphoid leukemias | 35 | 17.3 | 680 | 81.7 | 390 | 33.8 | 195 | 15.4 |
| I(b) Acute myeloid leukemias | 25 | 12.4 | 70 | 8.4 | 45 | 3.9 | 65 | 5.1 |
| I(c) Chronic myeloproliferative diseases | 0 | ‒ | <5 | ‒ | 10 | 0.9 | 20 | 1.6 |
| I(d) Myelodysplastic syndrome and other myeloproliferative diseases | 20 | 9.9 | 20 | 2.4 | 15 | 1.3 | <5 | ‒ |
| I(e) Unspecified and other specified leukemias | <5 | 0 | <5 | ‒ | 5 | 0.4 | 10 | 0.8 |
| II Lymphomas and reticuloendothelial neoplasms | 35 | 17.3 | 145 | 17.4 | 175 | 15.2 | 335 | 26.4 |
| II(a) Hodgkin lymphomas | 0 | ‒ | 5 | 0.6 | 35 | 3 | 175 | 13.8 |
| II(b) Non-Hodgkin lymphomas (except Burkitt lymphoma) | <5 | 2.5 | 35 | 4.2 | 60 | 5.2 | 90 | 7.1 |
| II(c) Burkitt lymphoma | 0 | ‒ | 15 | 1.8 | 35 | 3 | 40 | 3.2 |
| II(d) Miscellaneous lymphoreticular neoplasms | 30 | 14.9 | 80 | 9.6 | 45 | 3.9 | 25 | 2 |
| II(e) Unspecified lymphomas | 0 | ‒ | 0 | ‒ | <5 | ‒ | <5 | 0 |
| III CNS and miscellaneous intracranial and intraspinal neoplasms | 75 | 37.2 | 380 | 45.6 | 410 | 35.5 | 345 | 27.2 |
| III(a) Ependymomas and choroid plexus tumour | 10 | 5 | 55 | 6.6 | 15 | 1.3 | 35 | 2.8 |
| III(b) Astrocytomas | 35 | 17.3 | 160 | 19.2 | 180 | 15.6 | 155 | 12.2 |
| III(c) Intracranial and intraspinal embryonal tumours | 25 | 12.4 | 85 | 10.2 | 95 | 8.2 | 55 | 4.3 |
| III(d) Other gliomas | <5 | 2.5 | 40 | 4.8 | 50 | 4.3 | 30 | 2.4 |
| III(e) Other specified intracranial and intraspinal neoplasms | 5 | 2.5 | 35 | 4.2 | 75 | 6.5 | 70 | 5.5 |
| III(f) Unspecified intracranial and intraspinal neoplasms | <5 | ‒ | <5 | 0.6 | <5 | ‒ | 5 | 0.4 |
| IV Neuroblastoma and other peripheral nervous cell tumours | 140 | 69.4 | 190 | 22.8 | 35 | 3 | 5 | 0.4 |
| IV(a) Neuroblastoma and ganglioneuroblastoma | 140 | 69.4 | 190 | 22.8 | 35 | 3 | 10 | 0.8 |
| IV(b) Other peripheral nervous cell tumours | <5 | ‒ | <5 | ‒ | <5 | ‒ | 0 | ‒ |
| V Retinoblastoma | 35 | 17.3 | 60 | 7.2 | <5 | 0.4 | 0 | ‒ |
| VI Renal tumours | 35 | 17.3 | 140 | 16.8 | 60 | 5.2 | 20 | 1.6 |
| VI(a) Nephroblastoma and other nonepithelial renal tumours | 30 | 14.9 | 140 | 16.8 | 55 | 4.8 | 10 | 0.8 |
| VI(b) Renal carcinomas | 0 | ‒ | <5 | ‒ | <5 | 0 | 10 | 0.8 |
| VII Hepatic tumours | 15 | 7.4 | 45 | 5.4 | 10 | 0.9 | 10 | 0.8 |
| VII(a) Hepatoblastoma | 20 | 9.9 | 40 | 4.8 | 10 | 0.9 | <5 | 0.4 |
| VII(b) Hepatic carcinomas | <5 | ‒ | <5 | ‒ | <5 | ‒ | 5 | 0.4 |
| VII(c) Unspecified malignant hepatic tumours | 0 | ‒ | <5 | ‒ | 0 | ‒ | 0 | ‒ |
| VIII Malignant bone tumours | <5 | 2.5 | 15 | 1.8 | 55 | 4.8 | 130 | 10.2 |
| VIII(a) Osteosarcomas | <5 | ‒ | 5 | 0.6 | 30 | 2.6 | 70 | 5.5 |
| VIII(b) Chondrosarcomas | 0 | ‒ | 0 | ‒ | 0 | ‒ | <5 | ‒ |
| VIII(c) Ewing tumour and related sarcomas of bone | <5 | 2.5 | 5 | 0.6 | 25 | 2.2 | 55 | 4.3 |
| VIII(d) Other specified malignant bone tumours | 0 | ‒ | <5 | ‒ | 5 | 0.4 | <5 | 0.4 |
| VIII(e) Unspecified malignant bone tumours | 0 | ‒ | 0 | ‒ | 0 | ‒ | <5 | 0.4 |
| IX Soft tissue and other extraosseous sarcomas | 35 | 17.3 | 70 | 8.4 | 80 | 6.9 | 105 | 8.3 |
| IX(a) Rhabdomyosarcomas | <5 | 2.5 | 45 | 5.4 | 50 | 4.3 | 30 | 2.4 |
| IX(b) Fibrosarcomas, peripheral nerve sheath tumours, and other fibrous neoplasms | 15 | 7.4 | <5 | 0.6 | <5 | 0.4 | 15 | 1.2 |
| IX(d) Other specified soft tissue sarcomas | 10 | 5 | 15 | 1.8 | 20 | 1.7 | 45 | 3.5 |
| IX(e) Unspecified soft tissue sarcomas | <5 | ‒ | <5 | 0 | <5 | ‒ | 15 | 1.2 |
| X Germ cell tumours, trophoblastic tumours, and neoplasms of gonads | 25 | 12.4 | 25 | 3 | 25 | 2.2 | 75 | 5.9 |
| X(a) Intracranial and intraspinal germ cell tumours | <5 | 2.5 | <5 | 0.6 | 15 | 1.3 | 25 | 2 |
| X(b) Malignant extracranial and extragonadal germ cell tumours | 15 | 7.4 | 10 | 1.2 | 0 | ‒ | 10 | 0.8 |
| X(c) Malignant gonadal germ cell tumours | 5 | 2.5 | 5 | 0.6 | 15 | 1.3 | 35 | 2.8 |
| X(d) Gonadal carcinomas | 0 | ‒ | 0 | ‒ | 0 | ‒ | <5 | ‒ |
| X(e) Other and unspecified malignant gonadal tumours | <5 | ‒ | <5 | ‒ | <5 | ‒ | <5 | ‒ |
| XI Other malignant epithelial neoplasms and malignant melanomas | <5 | 2.5 | 10 | 1.2 | 35 | 3 | 95 | 7.5 |
| XI(a) Adrenocortical carcinomas | <5 | 0 | <5 | 0.6 | <5 | ‒ | <5 | 0.4 |
| XI(b) Thyroid carcinomas | 0 | ‒ | <5 | ‒ | 20 | 1.7 | 35 | 2.8 |
| XI(c) Nasopharyngeal carcinomas | 0 | ‒ | 0 | ‒ | 0 | ‒ | 10 | 0.8 |
| XI(d) Malignant melanomas | 0 | ‒ | <5 | 0.6 | 10 | 0.9 | 10 | 0.8 |
| XI(e) Skin carcinomas | 0 | ‒ | 0 | ‒ | <5 | ‒ | <5 | ‒ |
| XI(f) Other and unspecified carcinomas | 0 | ‒ | <5 | 0 | 10 | 0.9 | 40 | 3.2 |
| XII Other and unspecified malignant neoplasms | <5 | ‒ | <5 | 0 | 10 | 0.9 | 5 | 0.4 |
| XII(a) Other specified malignant tumours | 0 | ‒ | <5 | ‒ | <5 | ‒ | <5 | 0.4 |
| XII(b) Other unspecified malignant tumours | <5 | ‒ | <5 | ‒ | 10 | 0.9 | <5 | 0.4 |
Notes:
Data source: The Cancer in Young People in Canada Program / The Pediatric Oncology Group of Ontario Network Information System
|
||||||||
The age-standardized incidence rates for all cancers combined were generally lower in Western Canada than in the East (Table 4) with small geographic variations by cancer type.
| Cancer type | New cases | ASIR (per 1,000,000) | ||||||||||||
|---|---|---|---|---|---|---|---|---|---|---|---|---|---|---|
| Canada | BC | Prairies | Ontario | Quebec | Atlantic | Territories | Canada | BC | Prairies | Ontario | Quebec | Atlantic | Territories | |
| All cancers combined | 5125 | 590 | 870 | 2110 | 1180 | 365 | 15 | 152.4 | 144.7 | 138 | 157.1 | 159.4 | 159.8 | 107.7 |
| I Leukemias, myeloproliferative diseases, and myelodysplastic diseases | 1605 | 200 | 310 | 615 | 370 | 115 | 5 | 48.6 | 49.8 | 50.1 | 46.1 | 50.4 | 51.6 | 32.4 |
| II Lymphomas and reticuloendothelial neoplasms | 690 | 85 | 105 | 300 | 145 | 50 | 0 | 19.5 | 20 | 16.1 | 21.5 | 18.8 | 19.6 | ‒ |
| III CNS and miscellaneous intracranial and intraspinal neoplasms | 1215 | 140 | 190 | 510 | 280 | 90 | <5 | 35.7 | 33.7 | 30 | 37.9 | 37.2 | 38.2 | 24.5 |
| IV Neuroblastoma and other peripheral nervous cell tumours | 370 | 40 | 65 | 145 | 105 | 15 | 0 | 12.1 | 10.3 | 10.5 | 12.1 | 15.7 | 9.1 | ‒ |
| V Retinoblastoma | 100 | 15 | 5 | 55 | 15 | 5 | 0 | 3.3 | 3.5 | 1.3 | 4.7 | 2.7 | 2.6 | ‒ |
| VI Renal tumours | 245 | 25 | 45 | 90 | 55 | 15 | <5 | 7.6 | 6.4 | 7.8 | 7.2 | 8.3 | 9.1 | 19 |
| VII Hepatic tumours | 80 | 10 | 20 | 35 | 15 | 5 | <5 | 2.5 | 2.3 | 2.8 | 2.6 | 1.7 | 3.3 | ‒ |
| VIII Malignant bone tumours | 210 | 25 | 35 | 70 | 45 | 20 | 0 | 5.7 | 6.2 | 5.4 | 5 | 5.7 | 9.5 | ‒ |
| IX Soft tissue and other extraosseous sarcomas | 295 | 30 | 50 | 125 | 65 | 20 | <5 | 8.5 | 7.2 | 7.5 | 9.2 | 8.5 | 9 | ‒ |
| X Germ cell tumours, trophoblastic tumours, and neoplasms of gonads | 150 | 15 | 25 | 65 | 35 | 15 | <5 | 4.4 | 3.7 | 3.6 | 4.8 | 4.5 | 4.8 | ‒ |
| XI Other malignant epithelial neoplasms and malignant melanomas | 150 | 5 | 15 | 75 | 40 | 10 | <5 | 4.1 | 1.4 | 2.7 | 5.2 | 5.1 | 2.4 | ‒ |
| XII Other and unspecified malignant neoplasms | 15 | <5 | <5 | 10 | 5 | <5 | 0 | 0.6 | ‒ | ‒ | 0.8 | 0.7 | ‒ | ‒ |
Notes:
Data source: The Cancer in Young People in Canada Program / The Pediatric Oncology Group of Ontario Network Information System |
||||||||||||||
Trends in cancer incidence
Historically, the CCR has been the only source of data available for examining national trends in childhood cancer incidence. With the establishment of CYP-C, an independent source is now available for analysis. While there are differences between these surveillance programs and their data, from 2001 to 2006 (and later) their respective trends in incidence rates appear highly comparable (Figures 2 and 3). Incidence rates were similar between the two data sources for all cancers combined, leukemias, neuroblastoma, and soft tissue sarcomas. The higher incidence rates of lymphomas reflected in the CYP-C data may be explained by CYP-C's inclusion of non-malignant Non-Hodgkin lymphoma cases (ICD-O-3 histology type 9970), and borderline and in situ miscellaneous lymphomas (ICD-O-3 histology types 9751-9753). The slightly higher incidence rates of leukemias and all cancers combined reflected in the CCR data may indicate that some older children were treated outside pediatric oncology centres.

Figure 2 - Text Equivalent
Figure 2 presents a line chart of annual age-standardized incidence rates (ASIR) for all cancers combined, by sex for children ages 0 to 14 years. Data sources are compared with incidence rates per 1,000,000 calculated from the Canadian Cancer Registry (CCR) are presented from 1992 to 2010 along with 95% confidence intervals (CI), while incidence rates calculated from the Cancer in Young People in Canada (CYP‑C) program are presented from 2001 to 2012, though CYP-C data from 2007 to 2012 are noted as not yet having been validated. Figure 2 shows that CCR and CYP-C data are generally comparable with respect to variations in incidence over time, though CCR rates are slightly higher than CYP-C’s for most years. Over time, rates appear to be relatively stable, fluctuating between 153.2 in 1992 and 183.2 in 1999 for males, and between 135.8 in 2002 and 172.3 in 2008 for females.
The Figure 2 table below contains each of the data points represented in Figure 2
Data sources include the Cancer in Young People in Canada Program and the Pediatric Oncology Group of Ontario Network Information System (together presented as CYP-C), and the Canadian Cancer Registry (CCR) database.
| Year | Males | Females | ||||||
|---|---|---|---|---|---|---|---|---|
| CCR | CYP-C ASIR |
CCR | CYP-C ASIR |
|||||
| ASIR | Lower CI | Upper CI | ASIR | Lower CI | Upper CI | |||
| 1992 | 153.2 | 139.9 | 167.9 | 160.7 | 146.7 | 176.0 | ||
| 1993 | 161.6 | 147.9 | 176.6 | 145.8 | 132.6 | 160.4 | ||
| 1994 | 160.4 | 146.8 | 175.2 | 139.4 | 126.5 | 153.7 | ||
| 1995 | 166.4 | 152.5 | 181.5 | 154.5 | 140.8 | 169.4 | ||
| 1996 | 159.5 | 145.9 | 174.3 | 146.2 | 132.9 | 160.8 | ||
| 1997 | 162.4 | 148.6 | 177.4 | 144.4 | 131.2 | 159.0 | ||
| 1998 | 174.3 | 160.0 | 189.9 | 156.0 | 142.1 | 171.3 | ||
| 1999 | 183.2 | 168.4 | 199.3 | 145.6 | 132.1 | 160.4 | ||
| 2000 | 166.6 | 152.5 | 182.1 | 159.9 | 145.8 | 175.4 | ||
| 2001 | 167.6 | 153.3 | 183.2 | 158.5 | 144.2 | 130.7 | 159.0 | 135.0 |
| 2002 | 170.5 | 156.1 | 186.2 | 167.3 | 135.8 | 122.7 | 150.4 | 133.4 |
| 2003 | 169.0 | 154.6 | 184.8 | 162.6 | 142.0 | 128.5 | 156.8 | 143.1 |
| 2004 | 162.7 | 148.5 | 178.2 | 158.1 | 143.5 | 129.8 | 158.6 | 137.3 |
| 2005 | 163.3 | 149.1 | 178.9 | 165.8 | 154.0 | 139.9 | 169.5 | 153.9 |
| 2006 | 170.9 | 156.4 | 186.8 | 166.1 | 139.2 | 125.8 | 154.1 | 145.1 |
| 2007 | 179.8 | 164.8 | 196.2 | 175.7 | 147.8 | 134.0 | 163.1 | 136.1 |
| 2008 | 179.2 | 164.4 | 195.5 | 164.2 | 172.3 | 157.3 | 188.7 | 171.9 |
| 2009 | 164.2 | 150.0 | 179.7 | 158.0 | 157.6 | 143.4 | 173.3 | 151.6 |
| 2010 | 174.7 | 160.1 | 190.7 | 172.7 | 168.7 | 154.0 | 184.8 | 149.8 |
| 2011 | 166.2 | 150.5 | ||||||
| 2012 | 168.1 | 151.5 | ||||||
Note:
- Rates are age-standardized to the 1991 Canadian population.
- Shaded area: CYP-C data for 2007-2012 have not been validated and are likely incomplete.
Data sources: Canadian Cancer Registry (CCR) database at Statistics Canada and Quebec Cancer Registry (2008-2010), and the Cancer in Young People in Canada (CYP-C) Program / The Pediatric Oncology Group of Ontario Network Information System
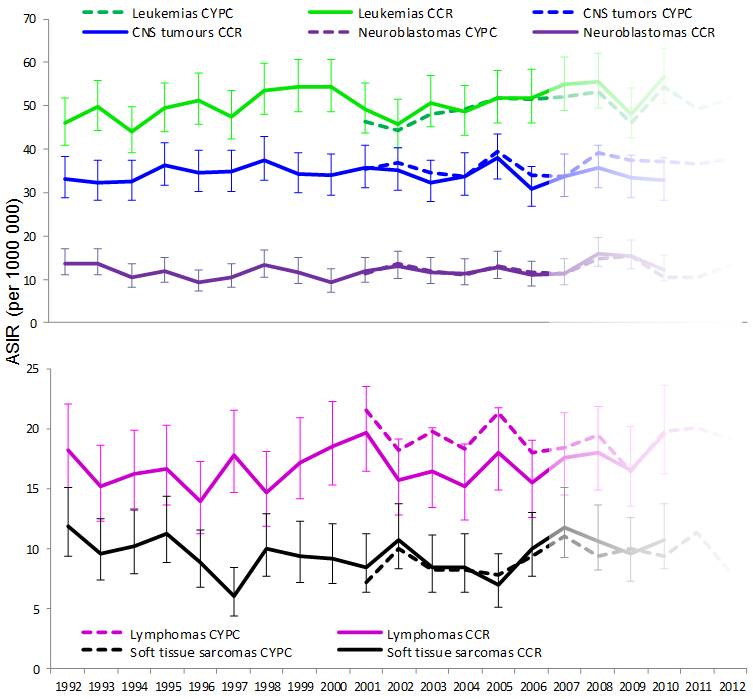
Figure 3 - Text Equivalent
Figure 3 presents line charts of annual age-standardized incidence rates for the five most common cancers (leukemias, central nervous system (CNS) tumours, lymphomas, neuroblastomas, and soft tissue sarcomas) for children ages 0 to 14 years. Data sources are compared with incidence rates per 1,000,000 calculated from the Canadian Cancer Registry (CCR) are presented from 1992 to 2010 along with 95% confidence intervals, while incidence rates calculated from the Cancer in Young People in Canada (CYP-C) program are presented from 2001 to 2012, though CYP-C data from 2007 to 2012 are noted as not yet having been validated. The leukemia incidence trend shows an increase over time with rates ranging from a low 44.1 in 1994 to high of 56.7 in 2010. Incidence rates for the other conditions are variable over time, but do not show overall increasing or decreasing trends.
The Figure 3 table below contains each of the data points represented in Figure 3.
Data sources include the Cancer in Young People in Canada Program and the Pediatric Oncology Group of Ontario Network Information System (together presented as CYP-C), and the Canadian Cancer Registry (CCR).
| Year | Leukemias | Lymphomas | CNS tumors | Neuroblastomas | Soft tissue sarcomas | |||||||||||||||
|---|---|---|---|---|---|---|---|---|---|---|---|---|---|---|---|---|---|---|---|---|
| CCR | CYP-C ASIR |
CCR | CYP-C ASIR |
CCR | CYP-C ASIR |
CCR | CYP-C ASIR |
CCR | CYP-C ASIR |
|||||||||||
| ASIR | Lower CI | Upper CI | ASIR | Lower CI | Upper CI | ASIR | Lower CI | Upper CI | ASIR | Lower CI | Upper CI | ASIR | Lower CI | Upper CI | ||||||
| 1992 | 46.1 | 40.9 | 51.9 | 18.3 | 15.1 | 22.1 | 33.2 | 28.9 | 38.2 | 13.6 | 10.9 | 17.0 | 11.9 | 9.4 | 15.1 | |||||
| 1993 | 49.7 | 44.3 | 55.7 | 15.2 | 12.3 | 18.6 | 32.4 | 28.1 | 37.3 | 13.6 | 10.9 | 16.9 | 9.6 | 7.4 | 12.5 | |||||
| 1994 | 44.1 | 39.1 | 49.8 | 16.3 | 13.3 | 19.8 | 32.4 | 28.2 | 37.4 | 10.5 | 8.2 | 13.5 | 10.3 | 8.0 | 13.2 | |||||
| 1995 | 49.4 | 44.1 | 55.4 | 16.7 | 13.7 | 20.3 | 36.3 | 31.7 | 41.4 | 11.8 | 9.3 | 15.0 | 11.3 | 8.9 | 14.3 | |||||
| 1996 | 51.4 | 45.9 | 57.4 | 13.9 | 11.2 | 17.2 | 34.7 | 30.3 | 39.7 | 9.4 | 7.2 | 12.2 | 8.9 | 6.8 | 11.6 | |||||
| 1997 | 47.6 | 42.3 | 53.4 | 17.8 | 14.7 | 21.5 | 34.8 | 30.4 | 39.9 | 10.5 | 8.2 | 13.6 | 6.1 | 4.4 | 8.4 | |||||
| 1998 | 53.7 | 48.0 | 59.9 | 14.7 | 11.9 | 18.1 | 37.6 | 33.0 | 42.9 | 13.3 | 10.6 | 16.7 | 10.0 | 7.7 | 12.9 | |||||
| 1999 | 54.4 | 48.7 | 60.8 | 17.2 | 14.2 | 20.9 | 34.3 | 29.9 | 39.3 | 11.7 | 9.2 | 15.0 | 9.4 | 7.2 | 12.3 | |||||
| 2000 | 54.4 | 48.7 | 60.8 | 18.5 | 15.3 | 22.3 | 33.9 | 29.5 | 39.0 | 9.4 | 7.2 | 12.4 | 9.2 | 7.1 | 12.1 | |||||
| 2001 | 49.2 | 43.7 | 55.3 | 46.4 | 19.7 | 16.4 | 23.5 | 21.5 | 35.6 | 31.1 | 40.9 | 35.4 | 11.8 | 9.2 | 15.2 | 11.3 | 8.5 | 6.4 | 11.2 | 7.2 |
| 2002 | 45.7 | 40.4 | 51.7 | 44.5 | 15.7 | 12.8 | 19.2 | 18.2 | 35.2 | 30.7 | 40.4 | 36.8 | 12.9 | 10.2 | 16.5 | 13.7 | 10.7 | 8.4 | 13.7 | 10.0 |
| 2003 | 50.7 | 45.1 | 57.0 | 48.1 | 16.4 | 13.5 | 20.1 | 19.8 | 32.4 | 28.1 | 37.4 | 34.6 | 11.6 | 9.0 | 15.0 | 11.9 | 8.4 | 6.3 | 11.2 | 8.3 |
| 2004 | 48.6 | 43.1 | 54.8 | 49.3 | 15.2 | 12.4 | 18.7 | 18.3 | 33.9 | 29.4 | 39.1 | 33.7 | 11.4 | 8.8 | 14.7 | 11.0 | 8.5 | 6.4 | 11.2 | 8.2 |
| 2005 | 51.7 | 46.0 | 58.1 | 51.9 | 18.0 | 14.9 | 21.8 | 21.3 | 38.0 | 33.2 | 43.5 | 39.6 | 12.9 | 10.1 | 16.4 | 12.9 | 7.0 | 5.1 | 9.5 | 7.8 |
| 2006 | 51.9 | 46.2 | 58.4 | 51.5 | 15.5 | 12.6 | 19.0 | 18.0 | 31.0 | 26.7 | 35.9 | 34.0 | 10.9 | 8.4 | 14.1 | 11.7 | 10.0 | 7.7 | 13.0 | 9.4 |
| 2007 | 54.8 | 48.9 | 61.4 | 52.1 | 17.6 | 14.4 | 21.4 | 18.4 | 33.8 | 29.3 | 39.0 | 33.8 | 11.4 | 8.8 | 14.6 | 11.4 | 11.8 | 9.3 | 15.1 | 11.1 |
| 2008 | 55.5 | 49.6 | 62.1 | 53.1 | 18.0 | 14.9 | 21.8 | 19.4 | 35.6 | 31.0 | 41.0 | 39.3 | 16.0 | 12.9 | 19.7 | 14.7 | 10.6 | 8.2 | 13.6 | 9.4 |
| 2009 | 48.0 | 42.6 | 54.2 | 46.1 | 16.5 | 13.5 | 20.2 | 16.4 | 33.4 | 28.9 | 38.6 | 37.5 | 15.4 | 12.4 | 19.0 | 15.4 | 9.6 | 7.3 | 12.6 | 10.0 |
| 2010 | 56.7 | 50.8 | 63.3 | 54.4 | 19.6 | 16.2 | 23.6 | 19.8 | 32.8 | 28.4 | 37.9 | 37.3 | 12.3 | 9.7 | 15.6 | 10.5 | 10.7 | 8.3 | 13.8 | 9.4 |
| 2011 | 49.4 | 20.1 | 36.6 | 10.5 | 11.3 | |||||||||||||||
| 2012 | 51.8 | 19.1 | 37.7 | 13.2 | 8.0 | |||||||||||||||
Note:
- Rates are age-standardized to the 1991 Canadian population.
- Shaded area: CYP-C data for 2007-2012 have not been validated are likely incomplete.
Data sources: Canadian Cancer Registry (CCR) database at Statistics Canada and Quebec Cancer Registry (2008-2010), and the Cancer in Young People in Canada (CYP-C) Program / The Pediatric Oncology Group of Ontario Network Information System
CYP-C data suggest that the age-standardized incidence rate for all cancers combined is increasing. Although CYP-C data beyond 2006 are believed to be incomplete, an average increase of 1.0% per year from 2001 to 2010 (p = 0.02) can already be observed (Figure 2). This is comparable to an increase of 1.2% per year observed in the CCR over the same period, as reported by Statistics Canada.Footnote 26 Type-specific trend comparisons between CYP-C and CCR will become possible as CYP-C data holdings beyond 2006 are validated.
Increasing trends in childhood cancer incidence have been reported in the United States,Footnote 27,Footnote 28,Footnote 29 Australia,Footnote 30 and Europe.Footnote 20,Footnote 22 This change is difficult to explain since only a small proportion of childhood cancers have well-established causes.Footnote 1 It is possible that increasing incidence trends may be due to underlying changes in genetic and environmental risk factors.Footnote 20,Footnote 24 Improved diagnosis, enhanced registration and case ascertainment, and increasing access to medical care may also explain the trends.
Time to diagnosis and treatment
These diagnostic and treatment intervals analyses are presented to illustrate the potential future value of CYP-C for health care system performance assessment as available data become more up to date. Table 5 shows: median time elapsed (in days) between first health care contact and the date of definitive diagnosis (the diagnostic interval); median time elapsed (in days) between the date of definitive diagnosis and the start date of anti-cancer therapy (the treatment interval); and, median time interval from initial health care contact to the initiation of anti-cancer treatment (the diagnostic and treatment interval). Cases in Ontario were excluded from analysis due to differences in definitions of events and dates used to calculate time intervals.Footnote 15| Diagnostic interval: number of days elapsed from date of first health care contact to date of definitive diagnosis | Treatment interval: number of days elapsed from date of definitive diagnosis to the start date of anti-cancer therapy | Diagnostic and treatment interval: number of days elapsed from date of first health care contact to start date of anti-cancer therapy | |||||||
|---|---|---|---|---|---|---|---|---|---|
| Median | 25-75% Percentiles | P-valueFootnote ** | Median | 25-75% Percentiles | P-valueFootnote ** | Median | 25-75% Percentiles | P-valueFootnote ** | |
| Overall | 8.0 | 3.0-27.0 | 1.0 | 0.0-4.0 | 12.0 | 4.0-34.0 | |||
| Sex | |||||||||
| Male | 7.0 | 2.0-25.0 | 0.09 | 1.0 | 0.0-4.0 | 0.69 | 10.0 | 4.0-32.0 | 0.04 |
| Female | 8.0 | 3.0-29.0 | 1.0 | 0.0-4.0 | 13.0 | 5.0-35.0 | |||
| Age at diagnosis (in years) | |||||||||
| <1 | 8.0 | 3.0‒19.0 | <0.01 | 0.0 | 0.0‒4.0 | <0.01 | 10.0 | 4.0‒26.0 | <0.01 |
| 1-4 | 7.0 | 2.0‒22.0 | 1.0 | 0.0‒3.0 | 9.0 | 4.0‒26.5 | |||
| 5-9 | 7.0 | 2.0‒25.0 | 0.0 | 0.0‒4.0 | 10.0 | 4.0‒35.0 | |||
| 10-14 | 10.0 | 3.0‒38.0 | 1.0 | 0.0‒8.0 | 17.0 | 6.0‒48.0 | |||
| Region of ResidenceFootnote * | |||||||||
| Atlantic | 9.0 | 3.0‒ 36.0 | 0.23 | 1.0 | 0.0‒ 4.0 | 0.78 | 14.0 | 5.0‒ 41.0 | 0.07 |
| Quebec | 8.0 | 3.0‒ 27.0 | 1.0 | 0.0‒ 4.0 | 11.0 | 5.0‒ 33.0 | |||
| Prairies | 7.0 | 3.0‒ 22.0 | 1.0 | 0.0‒ 4.0 | 10.0 | 4.0‒ 30.0 | |||
| British Columbia | 8.0 | 2.0‒ 31.0 | 0.0 | 0.0‒ 5.0 | 13.0 | 4.0‒ 36.0 | |||
| TerritoriesFootnote *** | 10.0 | 4.0‒ 19.0 | 0.0 | 0.0‒ 7.0 | 17.0 | 8.0‒ 46.0 | |||
| Diagnosis | |||||||||
| I Leukemias, myeloproliferative diseases, and myelodysplastic diseases | 3.0 | 1.0‒11.0 | <0.01 | 1.0 | 0.0‒3.0 | <0.01 | 5.0 | 3.0‒14.0 | <0.01 |
| II Lymphomas and reticuloendothelial neoplasms | 14.0 | 5.0‒42.5 | 4.0 | 0.0‒13.0 | 22.0 | 9.0‒53.5 | |||
| III CNS and miscellaneous intracranial and intraspinal neoplasms | 10.0 | 3.0‒37.0 | 0.0 | 0.0‒0.0 | 12.0 | 4.0‒42.0 | |||
| IV Neuroblastoma and other peripheral nervous cell tumours | 14.0 | 6.0‒32.0 | 0.0 | 0.0‒6.0 | 18.0 | 10.0‒36.0 | |||
| V Renal tumours | 9.0 | 5.0‒23.0 | 0.0 | 0.0‒1.0 | 10.0 | 5.0‒24.0 | |||
| VI Retinoblastoma | 7.0 | 4.0‒13.0 | 0.0 | 0.0‒2.0 | 8.0 | 5.0‒14.0 | |||
| VII Hepatic tumours | 7.0 | 3.0‒11.0 | 4.0 | 0.0‒7.0 | 12.0 | 8.0‒24.0 | |||
| VIII Malignant bone tumours | 21.0 | 8.0‒51.0 | 8.0 | 4.0‒14.0 | 33.0 | 16.0‒59.0 | |||
| IX Soft tissue and other extraosseous sarcomas | 17.0 | 5.0‒43.0 | 4.0 | 0.0‒11.0 | 23.0 | 10.0‒49.0 | |||
| X Germ cell tumours, trophoblastic tumours, and neoplasms of gonads | 13.5 | 5.0‒38.5 | 0.0 | 0.0‒2.5 | 15.0 | 6.0‒38.5 | |||
| XI Other malignant epithelial neoplasms and malignant melanomas | 54.5 | 12.0‒133.0 | 0.0 | 0.0‒8.0 | 68.0 | 21.0‒138.0 | |||
| XII Other and unspecified malignant neoplasms | 41.0 | 13.5‒77.0 | 0.5 | 0.0‒8.0 | 43.0 | 20.5‒102.0 | |||
Notes:
Source: The Cancer in Young People in Canada Program
|
|||||||||
The median diagnostic interval was 8 days. Statistically significant variations in diagnostic interval were observed by age and type of diagnosis (p < 0.01 for both) but not sex or region of residence. By age, the shortest median diagnostic interval was observed in children ages 1 to 4 years and ages 5 to 9 years (7 days for both), followed by children aged less than 1 year (8 days). The longest median diagnostic interval was observed in children age 10 to 14 years (10 days). By cancer type, leukemia patients had the shortest median diagnostic and treatment interval at 3 days, followed by retinoblastoma and hepatic tumour patients (7 days for both). The longest median diagnostic was seen in patients diagnosed with carcinomas (54.5 days) and other neoplasms (41 days).
While statistically significant variations in treatment intervals were also observed by age and diagnosis (p < 0.01 for both) the general tendency was for treatment to begin immediately after diagnosis. The longest median treatment interval was observed in children with malignant bone tumours (8 days), followed by lymphomas, hepatic tumours, and sarcomas (4 days each).
Statistically significant variations by sex and age were observed in the median diagnostic and treatment interval overall, with females and children aged 10 to 14 years experiencing slightly longer intervals. The fact that these differences are mainly established during the diagnostic interval is perhaps consistent with the observations that childhood cancer is rarer among females and older children. Significant differences in the median diagnostic and treatment interval overall by cancer type were largely reflective of the differences observed in diagnostic intervals. In interpreting the differences in diagnostic intervals observed on the basis of sex, age and type of cancer consideration should be given to how rare (or common) the cancer type is for males or females or within a given age range (see Tables 2 and 3). Rarely diagnosed cancers may not readily be suspected at first health care contact and may take longer to diagnose consequently.
There were no statistically significant differences observed in diagnostic or treatment intervals by region.
Patterns in initial treatment plans
Clinical trials are designed to improve treatment, and some trials allow children diagnosed with cancer to access new treatments that may not be routinely available.Footnote 31,Footnote 32 Children enrolled in clinical trial protocols in specialized centres may experience a survival advantage in the short term; however, the reason for this may be due to selection bias that may favor the exclusion of sicker children or children with more comorbidities into the treatment arm, or the Hawthorne effect, which gives rise to altered perspectives and behaviors in patients who are aware of the type of treatment they are receiving.Footnote 33 Furthermore, due to ethical and practical considerations, many studies that explore the impact of clinical trial enrollment on survival are observational in nature and subject to methodological issues that limit the generalizability of findings.Footnote 33 At the same time, some clinical trials focus on outcomes other than survival such as improved quality of life.
Data on initial treatment plan by type of diagnosis and region of diagnosis are presented with respect to enrollment in clinical trials and the use of trial protocols. Nationally for all cancers, 26% of children were registered in a clinical trial that was approved by a research ethics board (REB) [Table 6]. There are numerous reasons for non-registration, including not only whether a trial is available for a particular diagnosis but the eligibility of the child for an existing trial.
| Cancer Type | Registered on a clinical trial that is research ethics board (REB) approved | Following a trial protocol but not registered on a clinical trial | Other | Total | |||
|---|---|---|---|---|---|---|---|
| Number of cases | Percent (%) | Number of cases | Percent (%) | Number of cases | Percent (%) | ||
| Leukemias | 765 | 48.5 | 740 | 46.7 | 75 | 4.8 | 1580 |
| Lymphomas | 105 | 15.6 | 415 | 62.9 | 145 | 21.5 | 660 |
| CNS tumours | 110 | 9.4 | 280 | 24 | 775 | 66.5 | 1165 |
| Neuroblastomas | 100 | 27.7 | 170 | 47 | 95 | 25.3 | 370 |
| Retinoblastoma | 5 | 3 | 30 | 26 | 75 | 71 | 100 |
| Renal tumours | 45 | 19.5 | 170 | 69.7 | 25 | 10.8 | 240 |
| Hepatic tumours | 15 | 18.2 | 45 | 61 | 15 | 20.8 | 80 |
| Malignant bone tumours | 50 | 24 | 130 | 64.7 | 20 | 11.3 | 205 |
| Soft tissue sarcomas | 70 | 24.2 | 130 | 47 | 80 | 28.8 | 280 |
| Germ cell tumours | 15 | 8.7 | 70 | 47.3 | 65 | 44 | 150 |
| Other malignant epithelial neoplasms | <5 | 0.7 | 15 | 11.3 | 125 | 88 | 140 |
| Other and unspecified malignant neoplasms | 0 | 0 | 5 | 26.3 | 15 | 73.7 | 20 |
| All Cancers | 1275 | 25.6 | 2200 | 44.2 | 1510 | 30.3 | 4985 |
Notes:
Source: The Cancer in Young People in Canada Program / The Pediatric Oncology Group of Ontario Network Information System |
|||||||
Children diagnosed with leukemia were most often registered in a clinical trial (48.5%), followed by children diagnosed with neuroblastoma (27.7%), malignant bone tumours (24.0%), and soft tissue sarcomas (24.2%). On the other hand, children diagnosed with retinoblastomas (3.0%), CNS cancers (9.4%), and carcinomas (0.7%) were registered least often (Table 6).
By age, clinical trial enrollment was most frequent for children aged 1 to 4 years of age (32.3%) and least frequent for children aged 10 to 14 years (25.3%) [Table 7]. No significant sex differences by cancer type were observed apart from renal tumours for which more than twice as many females were enrolled in a trail (p=0.03). However, the total number of children with renal tumours enrolled in a trial was small with fewer than 50 cases (data not presented). There were some differences in clinical trial enrollment by region of diagnosis. Across regions, more than 25% of children diagnosed with cancer were registered in a clinical trial that was REB approved, with higher proportions in Quebec (34.7%) and British Columbia (26.9%), and lower proportions in the Atlantic region and Ontario (22.5% and 20.4% respectively) [Table 8].
| Age group (in years) | Registered on a clinical trial that is research ethics board (REB) approved | Following a trial protocol but not registered on a clinical trial | Other | Total | |||
|---|---|---|---|---|---|---|---|
| Number of cases | Percent (%) | Number of cases | Percent (%) | Number of cases | Percent (%) | ||
| <1 | 100 | 20.3 | 200 | 42.4 | 175 | 37.3 | 475 |
| 1-4 | 585 | 32.3 | 805 | 44.5 | 420 | 23.2 | 1805 |
| 5-9 | 335 | 25.3 | 580 | 43.7 | 410 | 31 | 1325 |
| 10-14 | 255 | 18.8 | 615 | 44.7 | 505 | 36.5 | 1375 |
| All children | 1275 | 25.6 | 2200 | 44.2 | 1505 | 30.3 | 4985 |
Notes: Children with missing information on initial treatment plan start date or treatment plan description, or with non-matched identification numbers were excluded from the analysis (N = 119) .
Source: The Cancer in Young People in Canada Program / The Pediatric Oncology Group of Ontario Network Information System |
|||||||
| Region of Diagnosis | Registered on a clinical trial that is research ethics board (REB) approved | Following a trial protocol but not registered on a clinical trial | Other | Total | |||
|---|---|---|---|---|---|---|---|
| Number of cases | Percent (%) | Number of cases | Percent (%) | Number of cases | Percent (%) | ||
| British Columbia | 160 | 26.9 | 285 | 49 | 145 | 24.1 | 590 |
| Prairies | 220 | 25.9 | 375 | 44.3 | 250 | 29.8 | 855 |
| Ontario | 410 | 20.4 | 910 | 45.5 | 685 | 34.1 | 2005 |
| Quebec | 405 | 34.7 | 430 | 37.1 | 330 | 28.3 | 1160 |
| Atlantic | 80 | 22.5 | 185 | 50.8 | 95 | 26.7 | 360 |
| Territories | 5 | 12.5 | 5 | 56.3 | 5 | 31.3 | 15 |
| Canada | 1275 | 25.6 | 2200 | 44.2 | 1505 | 30.3 | 4985 |
Notes:
Source: The Cancer in Young People in Canada Program / The Pediatric Oncology Group of Ontario Network Information System |
|||||||
Survival of Children Diagnosed with Cancer
One-, three-, and five-year observed survival proportions (OSPs) estimated for children (0 to 14 years) diagnosed with cancer from January 1, 2001, to December 31, 2006 are presented in Tables 9 to 11. For all childhood cancers combined, five-year OSPs were 81.5%. The corresponding one- and three-year OSPs were 91.8% and 85.1% respectively (Table 9). Infants under the age of one year had the lowest five-year OSP among all age groups (77.4%) and significantly lower survival duration after one year of diagnosis compared to other age groups. Children diagnosed between the ages of one and four years had the best five-year survival of all age groups (82.1% in males, and 85.0% in females), followed by children diagnosed between the ages of 5 and 9 years (80.8% in males, and 82.3% in females).
| Age group (in years) | Time (in months) | Both sexes | Males | Females | ||||||
| OSP | Lower CI | Upper CI | OSP | Lower CI | Upper CI | OSP | Lower CI | Upper CI | ||
| <1 | 12 | 82.9% | 79.3% | 86.0% | 85.4% | 80.4% | 89.3% | 80.3% | 74.7% | 84.8% |
| 36 | 79.0% | 75.1% | 82.4% | 81.4% | 75.9% | 85.7% | 76.6% | 70.7% | 81.4% | |
| 60 | 77.4% | 73.3% | 80.9% | 79.4% | 73.6% | 84.0% | 75.3% | 69.2% | 80.4% | |
| 1-4 | 12 | 92.8% | 91.5% | 93.9% | 92.3% | 90.5% | 93.8% | 93.4% | 91.5% | 94.9% |
| 36 | 86.9% | 85.3% | 88.4% | 86.8% | 84.6% | 88.7% | 87.0% | 84.5% | 89.1% | |
| 60 | 83.4% | 81.5% | 85.1% | 82.1% | 79.4% | 84.6% | 85.0% | 82.2% | 87.3% | |
| 5-9 | 12 | 92.7% | 91.2% | 94.0% | 93.1% | 91.0% | 94.6% | 92.2% | 89.7% | 94.1% |
| 36 | 85.5% | 83.5% | 87.2% | 85.3% | 82.7% | 87.6% | 85.6% | 82.5% | 88.2% | |
| 60 | 81.4% | 79.1% | 83.5% | 80.8% | 77.7% | 83.6% | 82.3% | 78.7% | 85.3% | |
| 10-14 | 12 | 92.6% | 91.1% | 93.8% | 92.3% | 90.1% | 94.0% | 92.8% | 90.6% | 94.6% |
| 36 | 84.5% | 82.6% | 86.3% | 84.4% | 81.6% | 86.8% | 84.7% | 81.7% | 87.2% | |
| 60 | 80.6% | 78.3% | 82.7% | 80.5% | 77.3% | 83.3% | 80.7% | 77.3% | 83.6% | |
| All ages (0-14 years) | 12 | 91.8% | 91.0% | 92.5% | 91.9% | 90.8% | 92.9% | 91.6% | 90.4% | 92.6% |
| 36 | 85.1% | 84.1% | 86.1% | 85.3% | 83.9% | 86.5% | 84.9% | 83.4% | 86.3% | |
| 60 | 81.5% | 80.4% | 82.6% | 81.1% | 79.5% | 82.6% | 82.0% | 80.3% | 83.6% | |
Notes: Actuarial estimates presented Source: The Cancer in Young People in Canada Program / The Pediatric Oncology Group of Ontario Network Information System |
||||||||||
Within the main ICCC-3 diagnostic groups, the highest five-year OSPs were observed for retinoblastoma (97.0%), followed by carcinomas (91.3%) and lymphomas (91.3%). The lowest five-year survival was seen for malignant bone tumours (62.0%) and soft tissue sarcomas (71.0%). Five-year survival for children diagnosed with acute myeloid leukemias (69.2%) was substantially lower than those diagnosed with lymphoid leukemia (90.2%) [Table 10]. Survival for children diagnosed with Hodgkin's lymphomas (five-year survival, 96.3%) was also better than those diagnosed with Non-Hodgkin's lymphomas (five-year survival, 83.5%) and Burkitt lymphoma (five-year survival, 91.5%). For CNS tumours, the five-year prognosis for those diagnosed with astrocytoma (83.6%) was higher than those diagnosed with ependymomas and choroid pleuxus tumours (70.4%), and considerably higher than those diagnosed with intracranial and intraspinal tumours (52.8%). Five-year OSP for neuroblastoma was 75.3%. For renal tumours, five-year survival for nephroblastomas was 89.7%. For malignant bone tumours, five-year survival was better for osteosarcomas (66.1%) than for Ewing tumours (59.5%). Five-year survival for rhabdomyosarcomas was 73.9%.
| ICCC-3 Diagnostic Groups and Sub-Group | OSP | Lower CI | Upper CI |
|---|---|---|---|
| All cancers combined | 81.5% | 80.4% | 82.6% |
| I Leukemias, myeloproliferative diseases, and myelodysplastic diseases | 85.7% | 83.8% | 87.4% |
| I(a) Lymphoid leukemias | 90.2% | 88.3% | 91.8% |
| I(b) Acute myeloid leukemias | 69.2% | 62.0% | 75.4% |
| I(c) Chronic myeloproliferative diseases | 86.5% | 61.4% | 95.7% |
| I(d) Myelodysplastic syndrome and other myeloproliferative diseases | 54.5% | 40.6% | 66.6% |
| I(e) Unspecified and other specified leukemias | 52.4% | 29.7% | 70.9% |
| II Lymphomas and reticuloendothelial neoplasms | 91.3% | 88.8% | 93.2% |
| II(a) Hodgkin lymphomas | 96.3% | 92.8% | 98.1% |
| II(b) Non-Hodgkin lymphomas (except Burkitt lymphoma) | 83.5% | 77.1% | 88.3% |
| II(c) Burkitt lymphoma | 91.5% | 83.7% | 95.7% |
| II(d) Miscellaneous lymphoreticular neoplasms | 93.2% | 87.9% | 96.3% |
| III CNS and miscellaneous intracranial and intraspinal neoplasms | 73.3% | 70.6% | 75.8% |
| III(a) Ependymomas and choroid plexus tumour | 70.4% | 60.3% | 78.4% |
| III(b) Astrocytomas | 83.6% | 80.0% | 86.6% |
| III(c) Intracranial and intraspinal embryonal tumours | 52.8% | 46.0% | 59.1% |
| III(d) Other gliomas | 43.0% | 34.1% | 51.6% |
| III(e) Other specified intracranial and intraspinal neoplasms | 94.5% | 90.0% | 97.0% |
| IV Neuroblastoma and other peripheral nervous cell tumours | 75.3% | 70.1% | 79.7% |
| IV(a) Neuroblastoma and ganglioneuroblastoma | 75.9% | 70.7% | 80.3% |
| V Retinoblastoma | 97.0% | 87.9% | 99.3% |
| VI Renal tumours | 88.9% | 84.3% | 92.3% |
| VI(a) Nephroblastoma and other nonepithelial renal tumours | 89.7% | 85.0% | 92.9% |
| VII Hepatic tumours | 77.0% | 65.1% | 85.2% |
| VII(a) Hepatoblastoma | 81.2% | 68.7% | 89.1% |
| VIII Malignant bone tumours | 62.0% | 54.2% | 68.8% |
| VIII(a) Osteosarcomas | 66.1% | 55.0% | 75.1% |
| VIII(c) Ewing tumour and related sarcomas of bone | 59.5% | 47.4% | 69.8% |
| IX Soft tissue and other extraosseous sarcomas | 71.0% | 65.0% | 76.1% |
| IX(a) Rhabdomyosarcomas | 73.9% | 65.1% | 80.8% |
| IX(b) Fibrosarcomas, peripheral nerve sheath tumours, and other fibrous neoplasms | 91.7% | 76.3% | 97.2% |
| IX(d) Other specified soft tissue sarcomas | 65.5% | 54.8% | 74.2% |
| IX(e) Unspecified soft tissue sarcomas | 42.9% | 18.3% | 65.5% |
| X Germ cell tumours, trophoblastic tumours, and neoplasms of gonads | 90.8% | 84.9% | 94.4% |
| X(a) Intracranial and intraspinal germ cell tumours | 88.4% | 74.3% | 95.0% |
| X(b) Malignant extracranial and extragonadal germ cell tumours | 91.9% | 76.9% | 97.3% |
| X(c) Malignant gonadal germ cell tumours | 95.2% | 85.7% | 98.4% |
| XI Other malignant epithelial neoplasms and malignant melanomas | 91.3% | 85.0% | 95.1% |
| XI(b) Thyroid carcinomas | 100.0% | . | . |
| XI(d) Malignant melanomas | 95.7% | 72.9% | 99.4% |
| XI(f) Other and unspecified carcinomas | 79.8% | 63.9% | 89.2% |
| XII Other and unspecified malignant neoplasms | 89.5% | 64.1% | 97.3% |
Notes:
|
|||
While there was some variation in five-year survival by region of diagnosis, none of these differences were statistically significant (Table 11). The five-year survival proportions were similar among initial treatment plans, though children enrolled in an REB approved clinical trial did experience a small but statistically significant improvement in survival (Table 12).
| Region | Time (in months) | OSP | Lower CI | Upper CI |
|---|---|---|---|---|
| Canada | 12 | 91.8% | 91.0% | 92.5% |
| 36 | 85.1% | 84.1% | 86.1% | |
| 60 | 81.5% | 80.4% | 82.6% | |
| British Columbia | 12 | 94.1% | 91.9% | 95.7% |
| 36 | 87.5% | 84.6% | 89.9% | |
| 60 | 83.3% | 79.8% | 86.3% | |
| Prairies | 12 | 91.3% | 89.3% | 93.0% |
| 36 | 83.9% | 81.2% | 86.1% | |
| 60 | 81.3% | 78.5% | 83.9% | |
| Ontario | 12 | 91.5% | 90.2% | 92.6% |
| 36 | 85.3% | 83.7% | 86.7% | |
| 60 | 81.1% | 79.2% | 82.8% | |
| Quebec | 12 | 92.0% | 90.3% | 93.4% |
| 36 | 84.9% | 82.7% | 86.8% | |
| 60 | 82.7% | 80.3% | 84.8% | |
| Atlatic | 12 | 90.3% | 86.8% | 92.9% |
| 36 | 84.5% | 80.3% | 87.8% | |
| 60 | 78.8% | 73.8% | 83.0% | |
| Territories | 12 | 82.4% | 54.7% | 93.9% |
| 36 | 70.6% | 43.1% | 86.6% | |
| 60 | 64.7% | 37.7% | 82.3% | |
Notes:
Source: The Cancer in Young People in Canada Program / The Pediatric Oncology Group of Ontario Network Information System |
||||
| Type of initial treatment plan | Time (in months) | OSP | Lower CI | Upper CI |
|---|---|---|---|---|
| Registered on a clinical trial that is REB Approved | 12 | 94.9% | 93.6% | 96.0% |
| 36 | 88.9% | 87.1% | 90.5% | |
| 60 | 85.8% | 83.6% | 87.7% | |
| Following a clinical trial that is REB approved but not enrolled in a clinical trial | 12 | 92.1% | 90.9% | 93.2% |
| 36 | 84.0% | 82.4% | 85.4% | |
| 60 | 79.5% | 77.6% | 81.2% | |
| Other | 12 | 89.8% | 88.2% | 91.2% |
| 36 | 84.7% | 82.8% | 86.4% | |
| 60 | 82.1% | 80.0% | 84.1% | |
Notes:
Source: The Cancer in Young People in Canada Program / The Pediatric Oncology Group of Ontario Network Information System |
||||
In absolute terms, overall childhood cancer survival is improving in Canada. Figure 4 shows that the age-standardized mortality rates (ASMR) for all cancers combined have decreased over time. The ASMR decreased by 2.0% per year from 1992 to 2010 (p < 0.01).
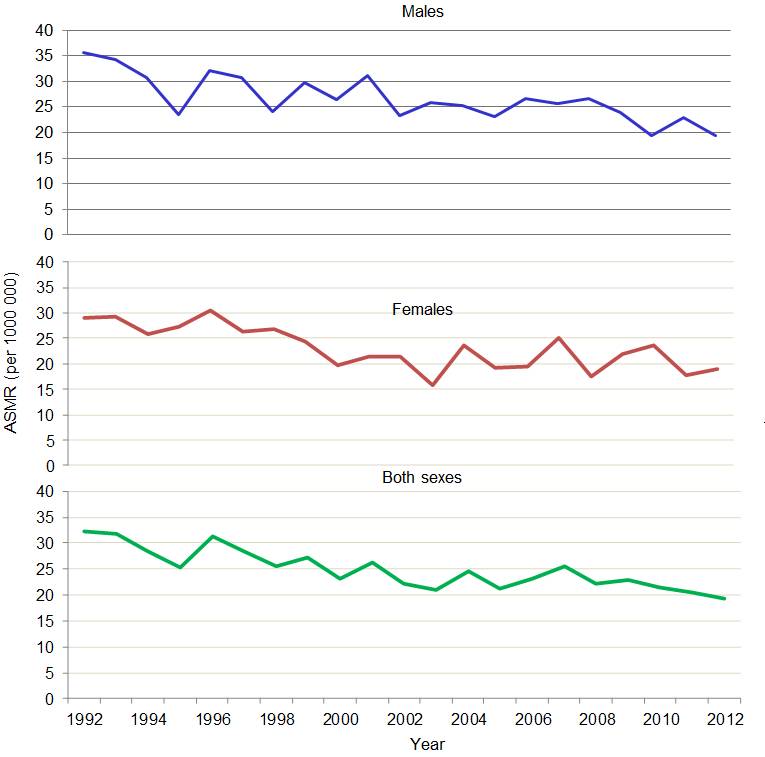
Figure 4 - Text Equivalent
Figure 4 presents line charts of annual age-standardized mortality rates per 1,000,000 for all cancers combined by sex and for both sexes combine for children ages 0 to 14 years from 1992 to 2012. For males and females, the trends show some variability though mortality declines overall from a high of 32.4 per million in 1992 to a low of 19.2 per million in 2012 for both sexes combined. The rates presented are based on data from the Canadian Vital Statistics Death Database, and only mortality from malignancies is included.
The Figure 4 table below contains each of the data points represented in Figure 4.
| Year | |||||||||||||||||||||
|---|---|---|---|---|---|---|---|---|---|---|---|---|---|---|---|---|---|---|---|---|---|
| 1992 | 1993 | 1994 | 1995 | 1996 | 1997 | 1998 | 1999 | 2000 | 2001 | 2002 | 2003 | 2004 | 2005 | 2006 | 2007 | 2008 | 2009 | 2010 | 2011 | 2012 | |
| Males | 35.5 | 34.2 | 30.8 | 23.5 | 32.2 | 30.7 | 24.1 | 29.8 | 26.4 | 31.1 | 23.2 | 25.9 | 25.3 | 23.2 | 26.7 | 25.7 | 26.6 | 24.0 | 19.5 | 22.9 | 19.4 |
| Females | 29.0 | 29.2 | 25.8 | 27.3 | 30.6 | 26.2 | 26.9 | 24.4 | 19.8 | 21.3 | 21.3 | 15.8 | 23.7 | 19.1 | 19.4 | 25.1 | 17.4 | 22.0 | 23.6 | 17.9 | 19.0 |
| Both | 32.4 | 31.7 | 28.3 | 25.4 | 31.4 | 28.5 | 25.5 | 27.2 | 23.2 | 26.3 | 22.3 | 21.0 | 24.6 | 21.2 | 23.1 | 25.4 | 22.1 | 23.0 | 21.5 | 20.5 | 19.2 |
Note:
- Rates are age-standardized to the 1991 Canadian population.
- * Includes mortality from malignancies only.
Data source: Canadian Vital Statistics Death Database
Metastatic disease at diagnosis
Metastatic disease occurs when cancer spreads from its original location (primary tumour) to a new part of the body. It is an important indicator used to define extent of disease. Among children for whom extent of disease information at diagnosis was available (approximately 61% of cases), the presence of metastatic cancer at diagnosis was observed in about a quarter of cases. Approximately 27% of males and 25% of females diagnosed with cancer had metastatic disease at diagnosis. In both sexes, older children ages 10 to 14 years had metastatic disease at diagnosis most frequently (27.2% for both) [Table 13].
| Sex and Age (in years) | Number of cases with metastases present at diagnosis | Number of cases with information on metastasis | Percent with metastasis (%) |
|---|---|---|---|
| Males | |||
| <1 | 35 | 185 | 18.9 |
| 1-4 | 155 | 540 | 29.4 |
| 5-9 | 130 | 450 | 29.2 |
| 10-14 | 140 | 515 | 27.2 |
| Females | |||
| <1 | 45 | 180 | 23.2 |
| 1-4 | 110 | 445 | 24.5 |
| 5-9 | 75 | 345 | 21.7 |
| 10-14 | 130 | 470 | 27.2 |
| Both Sexes | |||
| <1 | 80 | 365 | 21.0 |
| 1-4 | 270 | 980 | 27.2 |
| 5-9 | 205 | 795 | 26.0 |
| 10-14 | 265 | 985 | 27.2 |
Notes:
Source: The Cancer in Young People in Canada Program / The Pediatric Oncology Group of Ontario Network Information System |
|||
Table 14 shows the percent of cases with metastasis at diagnosis by cancer type. Children diagnosed with neuroblastoma (51.2%), renal tumours (29.9%), carcinomas (38.3%) had metastasis at diagnosis more often than those with other diagnoses. In contrast, children diagnosed with either retinoblastoma or CNS neoplasms were least often diagnosed with metastatic disease. The proportion of children who were diagnosed with metastatic disease at diagnosis was similar between regions, varying from 21.5% to 32.0% for all regions except the Territories (Table 15). The proportion of cases from the Territories with metastasis at diagnosis have to be interpreted with caution because of the very small number of children with available information on metastasis (N = 10).
| Number of cases with metastases present at diagnosis | Percent with metastasis (%) | |
|---|---|---|
| II Lymphomas | 250 | 36.4 |
| III CNS | 90 | 9 |
| IV Neuroblastoma | 190 | 51.2 |
| V Retinoblastoma | <5 | 1 |
| VI Renal tumours | 70 | 29.9 |
| VII Hepatic tumours | 10 | 16.7 |
| VIII Bone tumours | 50 | 23.7 |
| IX Soft tissue sarcomas | 60 | 21.3 |
| X Germ cell tumours | 30 | 19.7 |
| XI Carcinoma | 60 | 38.3 |
| XII Others | <5 | 15.8 |
| All above cancers combined | 820 | 24.9 |
Notes:
Source: The Cancer in Young People in Canada Program / The Pediatric Oncology Group of Ontario Network Information System |
||
| Number of cases with metastases present at diagnosis | Number of cases with information on metastasis | Percent with metastasis (%) | |
|---|---|---|---|
| Canada | 820 | 3130 | 26.2 |
| British Columbia | 75 | 360 | 21.5 |
| Prairies | 155 | 520 | 29.5 |
| Ontario | 315 | 1255 | 25.1 |
| Quebec | 190 | 750 | 25.7 |
| Atlantic | 70 | 225 | 32.0 |
| Territories | 5 | 10 | 50 |
Notes:
*The proportion of cases from the Territories with metastasis at diagnosis have to be interpreted with caution because of very small cell counts. Source: The Cancer in Young People in Canada Program / The Pediatric Oncology Group of Ontario Network Information System |
|||
Relapse after diagnosis
Risk of relapse within five years of diagnosis was examined by age, sex and cancer type. Relapse refers to a primary tumour that has recurred either at the original site (local relapse/recurrence) or at distant sites (metastases). Relapse is associated with poorer outcomes for the patient, especially for those assessed as being at high risk for relapse.Footnote 34,Footnote 35 There are several predictors for death after relapse and these include timing of relapse (poorer prognosis with earlier relapse), bone marrow involvement, age (less than 1 year or greater than 10 years at primary diagnosis), T-cell immunophenotype with hyperleukocytosis, genetic risk factors, and Down syndrome.Footnote 32,Footnote 34,Footnote 35
Among children diagnosed with cancer between 2001 and 2006, 14.6 % experienced a relapse within five years of their first diagnosis (Table 16). On the basis of sex and age, the risk of relapse within five years of diagnosis was especially high for males between 5 and 9 years of age at diagnosis (16.8 %). Among female children, those between the ages of 5 and 9 years and 10 and 14 years experienced relapse most frequently (15.4% and 15.5% respectively). On the basis of diagnosis, children with malignant bone tumours (24.9%) and soft tissue sarcomas (20.4%) experienced a relapse more frequently overall (Table 17). There was some variation in risk of relapse within five years of diagnosis by region, with lower proportions in Quebec (12.4%) and higher proportions in the Prairies (17.9%) (Table 18); however, the analyses producing these results did not control for confounders.
| Sex and Age (in years) | Number of children with a relapse | Number of children with cancers | Percent (%) |
|---|---|---|---|
| Males | |||
| <1 | 40 | 250 | 15.0 |
| 1-4 | 140 | 1025 | 13.7 |
| 5-9 | 130 | 775 | 16.8 |
| 10-14 | 110 | 745 | 14.7 |
| Females | |||
| <1 | 30 | 240 | 13.1 |
| 1-4 | 105 | 815 | 12.5 |
| 5-9 | 90 | 590 | 15.4 |
| 10-14 | 100 | 665 | 15.5 |
| Both | |||
| <1 | 65 | 480 | 14.0 |
| 1-4 | 240 | 1840 | 13.2 |
| 5-9 | 220 | 1365 | 16.2 |
| 10-14 | 215 | 1410 | 15.1 |
| All ages | 745 | 5100 | 14.6 |
Notes:
Source: The Cancer in Young People in Canada Program / The Pediatric Oncology Group of Ontario Network Information System |
|||
| Number of children with a relapse | Number of children with cancers | Percent (%) | |
|---|---|---|---|
| I Leukemias | 255 | 1605 | 15.6 |
| II Lymphomas | 80 | 680 | 12.3 |
| III CNS | 165 | 1210 | 13.6 |
| IV Neuroblastoma | 60 | 375 | 16.4 |
| V Retinoblastoma | 5 | 100 | 5.0 |
| VI Renal tumours | 35 | 240 | 13.1 |
| VII Hepatic tumours | 10 | 75 | 12.8 |
| VIII Bone tumours | 50 | 205 | 24.9 |
| IX Soft tissue sarcomas | 55 | 290 | 20.4 |
| X Germ cell tumours | 10 | 150 | 7.9 |
| XI Carcinoma | 15 | 150 | 8.7 |
| XII Others | 5 | 20 | 5.3 |
| All cancers combined | 745 | 5100 | 14.6 |
Notes:
Source: The Cancer in Young People in Canada Program / The Pediatric Oncology Group of Ontario Network Information System |
|||
| Number of children with a relapse | Number of children with cancers | Percent (%) | |
|---|---|---|---|
| Canada | 745 | 5105 | 14.6 |
| British Columbia | 90 | 590 | 15.9 |
| Prairies | 155 | 860 | 17.9 |
| Ontario | 300 | 2100 | 14.3 |
| Quebec | 145 | 1180 | 12.4 |
| Atlantic | 45 | 360 | 13.3 |
| Territories | <5 | 15 | 5.9 |
Notes:
Source: The Cancer in Young People in Canada Program / The Pediatric Oncology Group of Ontario Network Information System |
|||
Conclusion
The CYP-C program was created with the vision of providing pan-Canadian, population-based surveillance data on childhood cancer to create opportunities to study childhood cancer and provide a foundation for planning cancer control programs and policies. CYP-C provides the opportunity to evaluate a wide range of public health and health system performance issues in pediatric cancer care, such as the relationship between demographics, enrollment in clinical trials, and time intervals before and between treatments on clinical outcomes. Going forward, opportunities are being explored for the routine release of CYP-C results from a public health surveillance perspective. For the latest surveillance information regarding childhood cancer and other chronic conditions, visit the Public Health Agency of Canada's online Public Health Infobase (https://health-infobase.canada.ca).
To extend CYP-C's potential impact, a process has been established to allow researchers external to the program to apply for access to CYP-C data (see APPENDIX A). To further encourage the use of CYP-C data and foster collaboration within the broader research community, a CYP-C Research Champions program has been created. Over 40 champions from a range of professional backgrounds are participating across the country, and more are welcome. A webinar training series has been launched to support the development of CYP-C Research Champions. It covers such topics as the development of applicable research questions, the data access application process, and the basics of CYP-C data analysis.
Beyond generating basic statistics, the benefits of pooling childhood cancer data at a national level are beginning to be realized as researchers within and across pediatric oncology centres make use of CYP-C data (see APPENDIX C). Further information concerning data access, previously approved CYP-C data access applications, and the CYP-C Research Champions program can be obtained by contacting cypc-ccjc@phac-aspc.gc.ca or by visiting the C17 Council website (http://www.c17.ca/).
References
- Footnote 1
-
Pizzo PA, Poplack DG, editors. Principles and practice of pediatric oncology, 6th ed. Philadelphia (PA): Lippincott Williams & Wilkins; 2010.
- Footnote 2
-
Oeffinger KC, Mertens AC, Sklar CA, et al. Chronic health conditions in adult survivors of childhood cancer. N Engl J Med. 2006; 355(15):1572-82.
- Footnote 3
-
Mitra D, Hutchings K, Shaw A, Barber R, Sung L, Bernstein M, Carret AS, Barbaros V, McBride M, Parker L, Stewart M, Strahlendorf C. Status report: the Cancer in Young People in Canada surveillance system. Health Promot Chronic Dis Prev Can. 2015 Jun;35(4):73-6.
- Footnote 4
-
Canadian Cancer Society's Advisory Committee on Cancer Statistics. Canadian Cancer Statistics 2015. Toronto, ON: Canadian Cancer Society; 2015.
- Footnote 5
-
Barr RD, Greenberg ML, Shaw AK, Mery L. The Canadian Childhood Cancer Surveillance and Control Program (CCCSCP): A status report. Pediatr Blood Cancer. 2008;50:518-9.
- Footnote 6
-
Steliarova-Foucher E, Stiller C, Lacour B, Kaatsch P. International Classification of Childhood Cancer, third edition. Cancer. 2005;103(7):1457-67.
- Footnote 7
-
Statistics Canada. Canadian Cancer Registry. Available at: http://www23.statcan.gc.ca/imdb/p2SV.pl?Function=getSurvey&SDDS=3207 (accessed May 15, 2016).
- Footnote 8
-
Statistics Canada. Table 102-0522 - Deaths, by cause, Chapter II: Neoplasms (C00 to D48), age group and sex, Canada, annual (number), CANSIM (database). Available at: http://www5.statcan.gc.ca/cansim/a26?lang=eng&id=1020522 (accessed May 15, 2016).
- Footnote 9
-
Statistics Canada. Table 102-0552 - Deaths and mortality rate, by selected grouped causes and sex, Canada, provinces and territories, annual, CANSIM (database). Available at: http://www5.statcan.gc.ca/cansim/a26?lang=eng&id=1020552 (accessed May 15, 2016).
- Footnote 10
-
Statistics Canada. Annual Demographic Estimates: Canada, Provinces and Territories, 2016 (Catalogue no. 91-215-X). Ottawa: Minister of Industry; 2016. CANSIM Table 051-0001 released in September 2016. Available at: http://www.statcan.gc.ca/pub/91-215-x/91-215-x2016000-eng.pdf (accessed February 6, 2017).
- Footnote 11
-
Custom tabulation of DCO Cases, Canadian Cancer Registry, 2001-2006.
- Footnote 12
-
Breslow N, Day N. Statistical methods in cancer research. Volume 2: The design and analysis of cohort studies. Lyon (FR): IARC Scientific Publications no. 82; 1987.
- Footnote 13
-
Joinpoint Regression Program, Version 4.3.1.0 - April 2016; Statistical Methodology and Applications Branch, Surveillance Research Program, National Cancer Institute.
- Footnote 14
-
Kim HJ, Fay MP, Feuer EJ, Midthune DN. Permutation tests for joinpoint regression with applications to cancer rates. Statistics in Medicine. 2000;19:335-51: (correction: 2001;20:655).
- Footnote 15
-
Gupta S, Gibson P, Pole JD, Sutradhar R, Sung L, Guttmann A. Predictors of diagnostic interval and associations with outcome in acute lymphoblastic leukemia. Pediatr Blood Cancer. 2015;62(6):957-63.
- Footnote 16
-
Pagano M, Gauvreau K. Principles of Biostatistics. Second Edition. Pacific Grove, CA: Duxbury Press. 2000 ISBN-10: 0534229026.
- Footnote 17
-
Statistics Canada. 2006 Census of Population - Aboriginal Peoples. Ottawa (ON): Statistics Canada. Available at: http://www12.statcan.gc.ca/census-recensement/index-eng.cfm?HPA=1.
- Footnote 18
-
Statistics Canada. 2006 Census of Population - Ethnic Origin and visible minorities. Ottawa (ON): Statistics Canada. Available at: http://www12.statcan.gc.ca/census-recensement/index-eng.cfm?HPA=1.
- Footnote 19
-
Parkin DM, Stiller CA, Draper GJ, Bieber CA. The international incidence of childhood cancer. Int J Cancer. 1988 Oct 15;42(4):511-20.
- Footnote 20
-
Kaatsch P. Epidemiology of childhood cancer. Cancer Treat Rev. 2010;36(4):277-85.
- Footnote 21
-
Dorak MT, Karpuzoglu E. Gender differences in cancer susceptibility: an inadequately addressed issue. Front Genet. 2012 Nov 28;3:268.
- Footnote 22
-
Cancer Research in UK. Children's cancers incidence statistics. Available at: http://www.cancerresearchuk.org/health-professional/cancer-statistics/childrens-cancers/incidence#heading-Fifteen.
- Footnote 23
-
World Health Organization. Children and Cancer. http://www.who.int/ceh.
- Footnote 24
-
Linet MS, Wacholder S, Zahm SH. Interpreting epidemiologic research: lessons from studies of childhood cancer. Pediatrics. 2003 Jul;112(1 Pt 2):218-32.
- Footnote 25
-
Ries LAG, Smith MA, Gurney JG, et al. Cancer Incidence and Survival among Children and Adolescents: United States SEER Program 1975-1995, National Cancer Institute, SEER Program. NIH Pub. No. 99-4649. Bethesda, MD, 1999.
- Footnote 26
-
Lawrence Ellison, Teresa Janz. Childhood cancer incidence and mortality in Canada. Statistics Canada Catalogue no. 82-624-X. Available at: http://www.statcan.gc.ca/pub/82-624-x/2015001/article/14213-eng.htm (accessed May 27, 2016).
- Footnote 27
-
Gittleman HR, Ostrom QT, Rouse CD, Dowling JA, de Blank PM, Kruchko CA, Elder JB, Rosenfeld SS, Selman WR, Sloan AE, Barnholtz-Sloan JS. Trends in central nervous system tumour incidence relative to other common cancers in adults, adolescents, and children in the United States, 2000 to 2010. Cancer. 2015 Jan 1;121(1):102-12.
- Footnote 28
-
Siegel DA, King J, Tai E, Buchanan N, Ajani UA, Li J. Cancer incidence rates and trends among children and adolescents in the United States, 2001-2009. Pediatrics. 2014 Oct;134(4):e945-55.
- Footnote 29
-
Linabery AM, Ross JA. Trends in childhood cancer incidence in the U.S. (19922004). Cancer. 2008 Jan 15;112(2):416-32.
- Footnote 30
-
Baade PD, Youlden DR, Valery PC, et al. Trends in incidence of childhood cancer in Australia, 1983-2006. Br J Cancer. 2010;102:620-6.
- Footnote 31
-
Bleyer WA, Tejeda H, Murphy SB, Robison LL, Ross JA, Pollock BH, Severson RK, Brawley OW, Smith MA, Ungerleider RS. National cancer clinical trials: children have equal access; adolescents do not. J Adolesc Health. 1997;(6):366-73.
- Footnote 32
-
Wasilewski-Masker K, Liu Q, Yasui Y, et al. Late recurrence in pediatric cancer: a report from the childhood cancer survivor study. JNCI J Natl Cancer Inst. 2009;101(24):1709-20.
- Footnote 33
-
Unger JM, Barlow WE, Martin DP, et al. Comparison of survival outcomes among cancer patients treated in and out of clinical trials. J Natl Cancer Inst. 2014;106(3):1-13.
- Footnote 34
-
Teachey DT, Hunger SP. Predicting relapse risk in childhood acute lymphoblastic leukaemia. Br J Haematol. 2013;162(5):606-620.
- Footnote 35
-
Oskarsson T, Söderhäll S, Arvidson J, Forestier E, et al. Relapsed childhood acute lymphoblastic leukemia in the nordic countries: prognostic factors, treatment and outcome. Haematologica 2016;101:68-76.
APPENDIX A: Data access
Researchers can now request access to CYP-C data. In order to obtain access, a researcher or research team must:
- Submit an application including a research proposal describing their objectives and rationale, methods, justifications for each data element requested, knowledge translation plan, and timelines for completion and data retention;
- Obtain institutional research ethics approval(s);
- Receive the approval of the CYP-C Data Use and Publication Committee;
- Receive the approval of the Public Health Agency of Canada's program and privacy authorities; and
- Enter into a CYP-C Data Confidentiality Agreement.
Applications are assessed on the basis of scientific merit (including alignment of study methodology with research objectives), feasibility, relevance to childhood cancer, timelines, and specific privacy safeguards proposed. Data access can only occur within Canada; however, applications from researchers with international affiliations will be considered if they do not involve removal of data from Canada.
Detailed instructions for the data access process can be obtained by contacting cypc-ccjc@phac-aspc.gc.ca or visiting the C17 Council website: http://www.c17.ca/.
APPENDIX B: Data integration
The Pediatric Oncology Group of Ontario (POGO) is a provincial pediatric cancer registry that has captured data on new cancer cases in Ontario since 1985. It comprises five pediatric oncology centres in Ontario: The Hospital for Sick Children in Toronto, McMaster Children's Hospital in Hamilton, the Children's Hospital of Western Ontario in London, the Kingston General Hospital in Kingston, and the Children's Hospital of Eastern Ontario in Ottawa. Since 1985, every child who is a resident of Ontario and who is diagnosed with cancer at one of these five centres has been registered in the POGO database, POGONIS. The objectives of POGO are to monitor (1) the incidence and prevalence of childhood cancer in Ontario; (2) the demand for cancer care in Ontario; (3) the nature and specifics of cancer treatment; (4) patient outcomes; and (5) long-term effects of childhood cancer and cancer treatment.
POGO has a unique schema for classifying childhood cancers. Cancers entered into POGONIS are classified according to the POGO Pediatric Cancer Diagnostic Nomenclature and Classification System, which approximates the International Classification of Childhood Cancer and incorporates, for further specificity, the World Health Organization's Classification of Brain Tumours. Initially, POGONIS adopted the informal classification and nomenclature system developed internally by the former Childhood Cancer Study Group. The schema has 10 diagnostic groups and assigns a four-digit diagnosis code to each specific diagnosis. This classification system was then mapped onto other diagnostic schema, such as the one adopted by the International Agency for Research on Cancer and the subsequently-developed International Classification of Childhood Cancer, third edition (ICCC-3). For the cohort of children included in this report (diagnosed between January 1, 2001, and December 31, 2006), the four-digit diagnosis code for patients in the POGONIS database were mapped to the ICCC-3. Since POGO and CYP-C were created with different objectives, not all the data elements in these databases are comparable. Based on a critical review of data definitions and completeness, only a subset of data elements in the POGO dataset could be mapped to the CYP-C database. Data elements that were mapped for the purpose of this report are listed below.
| Section | Data Element |
|---|---|
| Registration | Sex |
| Birth date | |
| Age at diagnosis | |
| Province of residence at time of diagnosis | |
| Postal code of residence at diagnosis | |
| Ethnicity | |
| Reporting centre | |
| Time to Treatment | Which health care professional was contacted on that date |
| Diagnostic Record | Ordinal primary |
| Date of definitive diagnostic procedure | |
| Method of definitive diagnosis | |
| ICD-O Morphology code | |
| ICD-O Topography code | |
| Behaviour code | |
| Was there metastasis at diagnosis | |
| Protocol/Treatment Plan Information | Treatment plan used |
| Relapse Details | Date of relapse |
| Death | Date of death |
| Cause of death |
| Year | Ages 0-14 | Age <1 | Ages 1-4 | Ages 5-9 | Ages 10-14 | ||||||||||
|---|---|---|---|---|---|---|---|---|---|---|---|---|---|---|---|
| CCR | CYP-C | CYP-C as a percentage of CCR | CCR | CYP-C | CYP-C as a percentage of CCR | CCR | CYP-C | CYP-C as a percentage of CCR | CCR | CYP-C | CYP-C as a percentage of CCR | CCR | CYP-C | CYP-C as a percentage of CCR | |
Malignancies & |
|||||||||||||||
| 2001 | 895 | 840 | 94.06 | 75 | 70 | 90.67 | 320 | 310 | 96.30 | 230 | 220 | 96.52 | 265 | 235 | 90.15 |
| 2002 | 870 | 855 | 97.60 | 70 | 80 | 111.59 | 310 | 310 | 100.98 | 235 | 225 | 95.73 | 265 | 240 | 91.67 |
| 2003 | 880 | 860 | 98.07 | 80 | 85 | 105.00 | 300 | 290 | 97.98 | 240 | 235 | 97.50 | 260 | 250 | 96.56 |
| 2004 | 855 | 820 | 96.13 | 90 | 80 | 94.38 | 300 | 305 | 100.33 | 240 | 235 | 98.75 | 220 | 195 | 88.34 |
| 2005 | 885 | 885 | 99.89 | 75 | 90 | 117.33 | 305 | 315 | 104.26 | 235 | 240 | 103.43 | 275 | 240 | 87.18 |
| 2006 | 865 | 865 | 99.77 | 75 | 85 | 111.84 | 300 | 310 | 103.63 | 210 | 210 | 99.06 | 275 | 255 | 92.73 |
| 2007 | 910 | 865 | 95.15 | 100 | 95 | 95.00 | 335 | 315 | 93.75 | 215 | 220 | 100.46 | 255 | 235 | 92.52 |
| 2008 | 980 | 930 | 95.11 | 110 | 100 | 90.18 | 350 | 355 | 100.00 | 220 | 225 | 102.29 | 300 | 260 | 85.95 |
| 2009 | 900 | 860 | 96.00 | 100 | 105 | 100.00 | 310 | 315 | 100.64 | 230 | 220 | 95.69 | 255 | 225 | 88.98 |
| 2010 | 965 | 905 | 93.99 | 90 | 75 | 86.21 | 395 | 380 | 96.45 | 230 | 220 | 97.36 | 255 | 230 | 89.88 |
Malignancies |
|||||||||||||||
| 2001 | 865 | 785 | 91.20 | 75 | 65 | 83.78 | 320 | 300 | 93.44 | 220 | 205 | 94.09 | 250 | 220 | 88.00 |
| 2002 | 850 | 795 | 93.29 | 70 | 75 | 104.35 | 300 | 285 | 95.67 | 225 | 200 | 91.48 | 255 | 230 | 89.11 |
| 2003 | 855 | 805 | 93.80 | 80 | 75 | 96.20 | 295 | 275 | 94.18 | 235 | 220 | 93.59 | 250 | 235 | 92.80 |
| 2004 | 810 | 750 | 92.14 | 85 | 75 | 89.41 | 295 | 280 | 95.25 | 225 | 220 | 95.58 | 210 | 175 | 85.10 |
| 2005 | 860 | 810 | 94.19 | 75 | 80 | 105.41 | 300 | 300 | 98.68 | 225 | 215 | 94.64 | 260 | 225 | 85.38 |
| 2006 | 850 | 800 | 94.92 | 75 | 80 | 108.00 | 300 | 300 | 100.00 | 205 | 195 | 92.75 | 270 | 235 | 87.22 |
| 2007 | 885 | 795 | 89.54 | 95 | 85 | 84.69 | 335 | 300 | 89.79 | 210 | 200 | 94.86 | 245 | 210 | 86.48 |
| 2008 | 965 | 870 | 90.37 | 110 | 95 | 82.73 | 345 | 335 | 96.81 | 220 | 205 | 94.04 | 290 | 245 | 82.94 |
| 2009 | 895 | 810 | 90.51 | 100 | 95 | 95.10 | 310 | 295 | 94.87 | 230 | 210 | 91.30 | 250 | 210 | 82.54 |
| 2010 | 955 | 840 | 88.54 | 85 | 70 | 81.18 | 390 | 360 | 92.09 | 220 | 200 | 89.24 | 255 | 215 | 84.86 |
Note: CCR data presented include non-malignancies for CNS tumors only. Data sources:
|
|||||||||||||||
APPENDIX C: Related publications
Recently published and planned publications using CYP-C data are as follows.
Publications in peer-reviewed journals
Stammers DM, Israels SJ, Lambert PJ, Cuvelier GD. Cancer incidence, morbidity, and survival in Canadian First Nation children: a Manitoba population-based study from the Cancer in Young People in Canada (CYP-C) registry. Pediatr Blood Cancer. 2014;61(12):2164-9.
Mitra D, Hutchings K, Shaw A, Barber R, Sung L, Bernstein M, Carret AS, Barbaros V, McBride M, Parker L, Stewart M, Strahlendorf C. Status Report - The Cancer in Young People in Canada surveillance system. Health Promot Chronic Dis Prev Can. 2015 Jun;35(4):73-6.
Pole JD, Barber R, Bergeron R-E, Carret AS, Dix D, Kulkarni K, Martineau E, Randall A, Stammers D, Strahlendorf C, Strother D, Truoung TH, Sung L. Most children with cancer are not enrolled on a clinical trial in Canada: a population-based study. BMC Cancer (in press).
Non-peer-reviewed publications
The Public Health Agency of Canada. Cancer in Children in Canada (0-14 years). Available online at http://www.phac-aspc.gc.ca/cd-mc/cancer/fs-fi/cancer-child-enfant/index-eng.php.
The Public Health Agency of Canada. Cancer in Adolescents in Canada (15-19 years). Available online at http://www.phac-aspc.gc.ca/cd-mc/cancer/fs-fi/cancer-adol/index-eng.php.
Upcoming publication in a peer-reviewed journal
Mitra D, Xie L, Hutchings K. The incidence and survival of childhood cancer in Canada: results from the Cancer in Young People in Canada (CYP-C) surveillance system.