
The Use of Dietary Intake Data in Dietary Exposure Assessments within Health Canada: Current Practices, Challenges and Perspectives
Download the alternative format
Organization: Health Canada
Published: 2019-01-08
Cat.: H129-93/2018E-PDF
ISBN: 978-0-660-27382-2
Prepared by the Task Force on Scientific Risk Assessment's Dietary Intake Working Group
- Danielle Brulé, Bureau of Food Surveillance and Science Integration, Food Directorate, HPFB
- Constance Nana, Bureau of Food Surveillance and Science Integration, Food Directorate, HPFB
- Julie Ennis, Bureau of Food Surveillance and Science Integration, Food Directorate, HPFB
- Belinda Lo, Existing Substances Risk Assessment Bureau, Safe Environments Directorate, HECSB
- Eric Lévêque, Health Evaluation Directorate, PMRA
- Pierre Brassard, Health Evaluation Directorate, PMRA
Reviewers
- Tara Bower, Office of Science Policy, Liaison and Coordination, Environmental and Radiation Health Sciences Directorate, HECSB
- Song Gao, Health Evaluation Directorate, PMRA Trevor Satchwill, Health Evaluation Directorate, PMRA
Table of Contents
- Acronyms
- Summary
- 1. Background
- 2. General Overview on Use of Dietary Intake Data in Risk Assessments
- 3. Methodology
- 4. Results and Discussion
- 5. Conclusion
- 6. Moving Forward
- 7. Postscript
- 8. References
- Appendix A—Survey Questionnaire
- Appendix B—List of Respondents' Organizations and Roles
Acronyms
- BFSSI
- Bureau of Food Surveillance and Science Integration
- CCHS
- Canadian Community Health Survey
- CFIA
- Canadian Food Inspection Agency
- CSFII
- Continuous Survey of Food Intakes by Individuals
- DAIS
- Data Analysis and Information System (maintained by Strategic Policy Branch of Health Canada)
- FCT
- Food Consumption Table
- FD
- Food Directorate
- FFQ
- Food Frequency Questionnaire
- HC
- Health Canada
- HECSB
- Healthy Environments and Consumer Safety Branch
- HPFB
- Health Products and Food Branch
- NHANES
- National Health and Nutrition Examination Survey
- NCP
- Northern Contaminants Program
- PMRA
- Pest Management Regulatory Agency
- R
- Application for statistical analyses (command-line based)
- S-PLUS
- Application for statistical analyses (GUI-oriented language)
- SAS
- Statistical Analysis System
- SED
- Safe Environments Directorate
- SIDE
- Software for Intake Distribution Estimation
- SPSS
- Statistical Package for the Social Sciences
- SRA
- Scientific Risk Assessment
- TDS
- Total Diet Study
- TFSRA
- Task Force on Scientific Risk Assessment
- USDA
- United States—Department of Agriculture
- US-FDA
- United States—Food and Drug Administration
Summary
Food is recognized as an important pathway for biological, chemical and physical hazards to human health; thus, dietary intake data are required for a wide range of risk/safety assessment activities conducted throughout Health Canada. The Task Force on Scientific Risk Assessment's Dietary Intake Project was initiated to summarize intradepartmental use of dietary intake data in exposure assessments and to provide suggestions for best practices. Dietary exposure assessment is relevant to and applied by several organizations within the department. Considering the substances/commodities/food products being assessed, the population of interest and the type of exposure assessments needed, each organization has different requirements for food intake databases. A number of Canadian and international databases were identified as being used; however, there is no existing national database on food consumption that meets the specific requirements for conducting evaluations/assessments across all organizations. Consequently, risk assessors are often required to link with or integrate multiple databases to complete their risk assessments. In addition, several barriers exist to accessing the necessary information, computer software/tools/applications and capacity for effective selection and integration of dietary intake data in exposure assessments. In light of the survey findings, the use of different dietary intake datasets across the Department is acceptable to meet organizational requirements. The Dietary Intake Working Group suggests several short, medium and long-term steps to improve current practices focused on increasing users' knowledge and awareness of available data sources, influencing the development of future food consumption surveys and enhancing the usability of existing comprehensive, national dietary intake data (e.g. 2004 Canadian Community Health Survey cycle 2.2) in hopes of establishing a more harmonized approach.
1. Background
Health Canada (HC) is the federal department responsible for helping the people of Canada maintain and improve their health. In support of this mandate and to protect the health of Canadians, an essential activity within the department is the assessment of risks to human health. Food is recognized as an important pathway for biological, chemical and physical hazards to human health; thus, dietary intake data are required for a wide range of risk/safety assessment activities conducted throughout the department.
The Task Force on Scientific Risk Assessment (TFSRA) is an intradepartmental working group tasked with improving information sharing and enhancing coordination and coherence of scientific risk assessments (SRA) within HC. The main objectives of the TFSRA are: to address broader, cross- cutting issues on SRA; foster a departmental community of risk assessors; and address divergence issues on SRA. This project is one of the priority projects of the TFSRA.
The TFSRA initiated this project to summarize intradepartmental use of dietary intake or consumption data in dietary exposure assessments, and provide suggestions for best practices to further contribute to the TFSRA's overall objectives. The project was implemented under the leadership of the Bureau of Food Surveillance and Science Integration (BFSSI) of the Food Directorate (FD) with active participation from other team members (Pest Management Regulatory Agency (PMRA) and Existing Substances Risk Assessment Bureau of Healthy Environments and Consumer Safety Branch (HECSB)).
1.1 Purpose
The primary targeted audience for this document includes HC risk assessment programs that use food consumption data in their risk assessments. To increase knowledge and awareness of available dietary intake data sources, the present project documented strengths and limitations of dietary consumption data as indicated by users, and reported on the statistical tools and methods used. This report also highlights a number of key limitations HC risk assessors/ evaluators are faced with when assessing exposure to these hazards through food and which help to explain the challenges of a harmonized approach for the use of dietary intake data. The working group has provided suggestions to improve current practices.
1.2 Specific Objectives
The specific objectives were to:
- identify and describe potential and available Canadian and/or International dietary intake data useful for dietary exposure to human health hazards;
- analyze and document differences in the user-indicated strengths and limitations of the dietary intake data as well as different approaches in conducting dietary exposure assessment across HC groups;
- explore linkages to other data sources and/or approaches from other countries; and,
- identify opportunities for harmonization on the use of dietary intake data in dietary exposure assessments across HC.
2. General Overview on Use of Dietary Intake Data in Risk Assessments
SRA involves hazard identification and characterization, assessment of the extent of exposure to the hazard (magnitude, frequency, duration, and route) and characterization of the risk.Footnote 1 Dietary exposure assessments depend on estimates of the foods consumed in a population, generally obtained using self-reported instruments including 24-hour recalls, food frequency questionnaires or food records (e.g. food diaries). It is recognized that self-reported food intake data are prone to measurement error. Great strides have been made in minimizing error during data collection and statistical analysis;Footnote 2 however, at present there is no dietary assessment tool for use in national food consumption surveys that completely eliminates bias. Reported foods consumed can be classified at various levels (e.g. food groups, subgroups, ingredients, commodities, processing level, etc.) for analysis. Beyond consumption patterns, it is crucial to have information on individuals' behaviours which depend on social/cultural and economic status, among other things.
The existence of large scale food consumption surveys, for example, Statistics Canada's Canadian Community Health Survey (CCHS), Nutrition Focus (2004),Footnote 3 enables risk assessors to develop more complete and comprehensive dietary exposure assessments. Depending on the substance of interest, these large and complex national population-based surveys on food consumption may have limitations with respect to some key elements of a health risk assessment. Consequently, risk assessors may be required to link with or integrate other databases to complete their risk assessments. In addition, risk assessors and biostatisticians may need to use different sources and/or types of dietary intake data (e.g. food consumption surveys, targeted monitoring studies, specific intakes of food commodities at various processing levels—wheat grain versus bread) and different statistical analyses depending on the exposure scenarios.
3. Methodology
The working group designed a survey questionnaire (Appendix A) to obtain information from HC users of dietary intake data on the following main topics:
- Sources of dietary intake data used in exposure assessment: this section provided information on the primary users of dietary intake data for exposure assessment within the department, the main sources of dietary information (survey/study, year of collection, type of data, frequency of usage and data format), and the users' feedback regarding strengths and limitations of their sources of data;
- Use of Dietary Intake Data in Exposure Assessment: this section investigated the programs responsible for conducting exposure assessments including: whether food is the main source considered in the exposure assessments for their organization, the tools used in conducting exposure assessments, the applicability of dietary intake data in risk/safety assessments, and, any challenges or concerns in performing dietary exposure assessments.
The survey questionnaire contained a total of 13 questions that ranged from check boxes to more elaborate responses. The final question in the survey requested an example of a dietary assessment report from the respondents. Data were gathered by distributing the questionnaire to members of the TFSRA who could, in turn, re-direct the questionnaire to the appropriate risk assessors and/or those directly involved in conducting exposure assessments. A total of 14 questionnaires were completed by programs of which 11 were considered relevant and compiled for analysis. Two separate questionnaires were submitted from a single group and these responses were combined to avoid over-representation from a single division, so the final number of respondents was 10 for the analysis of results. A list of respondents' roles and their organizations can be found in Appendix B.
4. Results and Discussion
4.1 Sources of Dietary Data Used in Exposure Assessment
Results from the survey conducted in July 2011 showed that risk assessors use a wide range of dietary data sources in the context of exposure assessment within HC (Figure 1). Respondents were asked to rank their 1st, 2nd, 3rd and 4th choice of information sources. Table 1 lists information on the 1st and 2nd choice dietary intake data sources as indicated by the ten (10) respondents.
Figure 1: Food and nutrition consumption survey/study used for dietary exposure assessment
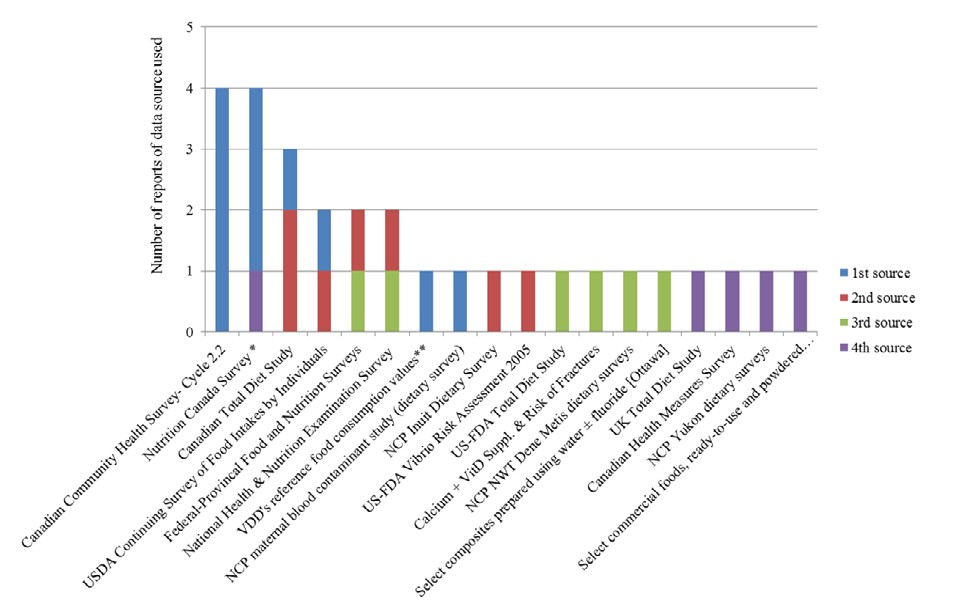
Abbreviations: NCP= Northern Contaminants Program; NWT= Northwest Territories; US-FDA= United States Food and Drug Administration; VDD= Veterinary Drugs Directorate
* Includes one response for “Compendium of Canadian Human Exposure Factors for Risk Assessment (Richardson, 1997)” which presents results of the Nutrition Canada Survey.
** VDD uses relatively high reference food consumption values
(Veterinary Drugs Directorate. Guidance for Industry Preparation of Veterinary New Drug Submissions. 2007.)
Text Description
Figure 1 is a graphical representation of survey results noted in section 4.1, Sources of Dietary Data Used in Exposure Assessment. First, second, third and fourth-choice data sources are ranked. The most commonly used primary data source was the Canadian Community Health Survey – Cycle 2.2. There were four reports of this data source being used as a first choice. The Nutrition Canada Survey was the second most commonly used primary data source. There were three reports of it being used as a primary data source, and one report of it being used as a quaternary data source. In descending order, other commonly used data sources include: Canadian Total Diet Survey, USDA Continuing Survey of Food Intakes by Individuals, Federal-Provincial Food and Nutrition Surveys, National Health & Nutrition Examination Survey, VDD's reference food consumption values, NCP maternal blood contaminant study (dietary survey),NCP Inuit Dietary Survey, US-FDA Vibrio Risk Assessment 2005, US-FDA Total Diet Study, Calcium + Vitamin D Supplements & Risk of Fractures, NCP-NWT Dene Metis dietary surveys, Select composites prepared using water plus or minus fluoride (Ottawa), UK Total Diet Study, Canadian Health Measures Survey, NCP Yukon dietary surveys, and select commercial foods. There was one report of the Canadian Total Diet Study being chosen as a primary data source, and two reports of it being chosen as a secondary data source. There was one report of the USDA Continuing Survey of Food Intakes by Individuals as a primary data source, and one report of it being used as a secondary data source. There was one report of the Federal-Provincial Food and Nutrition Surveys being used as a secondary data source, and one report of it being used as a tertiary data source. There was one report of the National health and Nutrition Examination Survey being used as a secondary data source, and one report of it being used as a tertiary data source. There was one report of VDD's reference food consumption values being used as a primary data source. There was one report of NCP maternal blood contaminant study (dietary survey) being used as a primary data source. There was one report of NCP Inuit Dietary Survey being used as a secondary data source. There was one report of US-FDA Vibrio Risk Assessment 2005 being used as a secondary data source. There was one report of US-FDA Total Diet Study being used as a tertiary data source. There was one report of Calcium + Vitamin D Supplements & Risk of Fractures being used as a tertiary data source.There was one report of NCP-NWT Dene Metis dietary surveys being used as a tertiary data source. There was one report of Select composites prepared using water plus or minus fluoride (Ottawa) being used as a tertiary data source. There was one report of UK Total Diet Study being used as a quaternary data source. There was one report of Canadian Health Measures Survey being used as a quaternary data source. There was one report of NCP Yukon dietary surveys being used as a quaternary data source. There was one report of select commercial foods being used as a quaternary data source.
| Name of the Survey/Study | Year/ Period Conducted | Access | Tools | Target Population | Relevance to Exposure Assessment |
|---|---|---|---|---|---|
| Canadian Community Health Survey- Cycle 2.2 | 2004 | Through HC-DAIS | 24-Hr Recall | 0 to 65y and over | Food and nutrient intakes; dietary supplements |
| Nutrition Canada Survey | 1970–72 | Restricted | 24-Hr Recall | 0 to 65y and over | Food and nutrient intakes; use of nutritional supplements |
| Canadian Total Diet Study | Ongoing since 1969 | Available on HC website | Monitoring program measuring chemicals in foods | 0 to 65 y and over | Concentration of contaminant in foods and estimates of dietary intakes of contaminants |
| USDA Continuing Survey of Food Intakes by Individuals | 1990's | Available on the web | 2 to 3 diet records and/or recalls | 0 to 80 y and over | Food and nutrient intakes, vitamin and mineral supplements |
| Federal-Provincial Food and Nutrition Surveys | 1992–1999 | Restricted | 24-Hr Recall, FFQs | 18 years and over | Food and nutrient intakes, FFQ and use of dietary supplements |
| National Health & Nutrition Examination Survey | Ongoing | Available on the web | 24-Hr Recall, FFQ | All ages | Food and nutrient intakes; use of nutritional supplements; concentration of some nutrients in blood/ urine |
| VDD's reference food consumption values | NA | Available on the web | Data on contaminant levels in food and food intakes from several countries | NA | Concentration of contaminant in foods and food consumption intake estimates |
| NCP maternal blood contaminant study (dietary survey) | 2005–2007 | Restricted | Consumer survey | NA | NA |
| NCP Inuit Dietary Survey | 1998–2000 | Restricted | 24-Hr Recall | NA | NA |
Abbreviations: DAIS= Data Access and Information Services; FFQ= Food Frequency Questionnaire; HC= Health Canada; NA= Not available; NCP= Northern Contaminants Program; USDA= United States Department of Agriculture; VDD= Veterinary Drugs Directorate |
|||||
Key Findings
- 2004 CCHS cycle 2.2 was most frequently cited by respondents (4/10) as the 1st choice for dietary data.
- About half of respondents (5/10) relied on their 1st choice of dietary data for all dietary exposure assessments.
- More than one source of dietary data was generally used by risk assessors (9/10).
- Data from Canadian sources were the most frequently cited, followed by data from U.S. surveys.
- Data from different countries were identified including Canada, the U.S., the European Union, Austria, Western Europe, New Zealand, Japan and the circumpolar region.
- Some of the identified data sources do not directly measure dietary intake data (e.g. Canadian Total Diet Study (TDS)). Instead, these data sources are used in combination with dietary intake data to assess dietary exposure to hazards or nutrients.
- At the time of this survey (summer 2011), the Canadian Health Measures Survey (2007–2009) and the U.S. National Health and Nutrition Examination Surveys (2003–2006) were cited as the most recently available sources of information, while the Nutrition Canada Survey (1970–72) was still cited and used as a source of information.
- Quantitative data (e.g. food intake data from 24-hour recall or food frequency questionnaires) as opposed to qualitative data (e.g. public opinion research data) was most commonly reported as used to conduct exposure assessments.
- Information collected from a 24-hour recall method was the most frequently cited source of data, although data collected with other dietary assessment tools were sometimes used.
- Depending on the substance of interest and the scope of the dietary assessment, data on other elements such as nutrient, contaminant or residue concentrations in food or blood and/or qualitative data (such as demographic or clinical examination data) can be used to complement quantitative data on dietary intakes.
4.1.1 Strengths and Limitations of Most Commonly Used Sources of Food Consumption Data
Risk assessors and evaluators require a solid knowledge of food and nutrition databases, including their associated strengths and limitations, to inform exposure assessment and subsequently, risk management decision-making. The survey investigated respondents' ratings of the quality of their top two sources of data through four main attributes including index-searchability, completeness, consistency and updatability. Users' feedback on limitations of their top two sources of dietary data were further investigated with a special focus on sampling, data updating and access, and adequacy of information in food commodities. Table 2 presents the quantitative ratings of sources.
| Data SourceTable 2 Footnote c | StrengthsTable 2 Footnote a average Score (Range) | LimitationsTable 2 Footnote b | Respondent Branch & Directorate | HED | ||||||||||||||
|---|---|---|---|---|---|---|---|---|---|---|---|---|---|---|---|---|---|---|
| Proportion of Respondents Identifying Limitation | HPFB | HECSB | ||||||||||||||||
| Indexed/ searchable | Complete | Consistent | Updatable | Not representative of Canadians | Missing age/ vulnerable groups | Outdated | Limited access | Missing level of information on food | Missing details on food | FD | NNHPD | SED | SED/RAPBTable 2 Footnote d | |||||
| CCHS 2.2 | 4.1 (2.5–5) |
3.5 (3–5) |
4.1 (3–5) |
2.3 (1–4) |
0/4 | 4/4 | 2/4 | 4/4 | 2/4 | 1/4 | ||||||||
| Nutrition Canada Survey | 2.3 (1.5–3) |
3.5 (3–4) |
3 — |
3 (1–5) |
0/3 | 0/3 | 2/3 | 2/3 | 1/3 | 1/3 | ||||||||
| Canadian TDS | 2 (1–3) |
3.3 (2–5) |
2.3 (1–3) |
2.7 (1–5) |
2/3 | 2/3 | 1/3 | 2/3 | 1/3 | 2/3 | ||||||||
| USDA Continuing Survey of Food Intakes by Individuals |
4 — |
4 — |
4 — |
3 — |
2/2 | 0/2 | 0/2 | 0/2 | 0/2 | 0/2 | ||||||||
Abbreviations: CCHS= Canadian Community Health Survey; FD= Food Directorate; HECSB= Healthy Environments and Consumer Safety Branch; |
||||||||||||||||||
Scores for strengths and identified limitations varied according to the attribute and data source under consideration. For some data sources, respondents provided variable scores for the same attribute, e.g., different scoring on the attribute “updatability” was given to both the Nutrition Canada Survey and the Canadian TDS. This variability may be explained by the role of the respondent (e.g., being that of a statistician, risk assessor or risk manager) and their knowledge and experience using the given data source.
Key Findings:
2004 Canadian Community Health Survey—cycle 2.2 data
The majority of respondents from the Health Products and Food Branch (HPFB) (4/5) identified 2004 CCHS cycle 2.2 data as their top source. Users of this data source rated it as highly indexed/ searchable (4.1/5), consistent (4.1/5) and relatively complete (3.5/5). Respondents were in agreement that it was not representative of vulnerable population groups (excludes people living in the Territories) and that access to the data is a major common concern. Some reported that the data do not provide enough details or the right level of information on the food commodities of interest (e.g. brand names, packaging, cooking methods) and that it is outdated. Noted limitations included poor ease of use, training requirements and small sample size along with missing body weight data for infants and young children. Finally, additional limitations reported by PMRA included a lack of suitability for use as a result of: a) difficulty in accurately converting the foods as eaten to the Raw Agricultural Commodities level, b) lack of compatibility in data structure with the software program used to conduct pesticide risk assessments and c) disclosure control placed on the data by Statistics Canada.
Nutrition Canada Survey
Respondents from HECSB commonly use the Nutrition Canada Survey for dietary exposure assessment. On average, respondents rated the Nutrition Canada Survey as relatively complete (3.5/5), consistent (3/5) and updatable (3/5), although as mentioned above the scores for updatable ranged from 1 to 5. The most frequently identified limitations for the Nutrition Canada Survey were that it is outdated, access is limited, it is not possible to differentiate raw, processed or cooked foods and there is insufficient representation of subsistence and Aboriginal population (remote sites).
Canadian Total Diet Study
Respondents from HECSB also commonly use the Canadian TDS for dietary exposure assessment. The Canadian TDS was rated as relatively complete (3.3/5). Limitations identified by at least half of respondents included: limited access, may not be representative of Canadians and certain age/vulnerable groups which limits generalizability and missing details on foods. Finally, an additional limitation that was raised by a respondent was the inability to convert concentration in food products to daily intake estimates, particularly for vulnerable populations.
United States—Department of Agriculture Continuing Survey of Food Intakes by Individuals
The United States—Department of Agriculture (USDA) Continuing Survey of Food Intakes by Individuals (CSFII) was one of the top choices of users from HPFB (1/5) and PMRA (1/1) who rated it as highly indexed/ searchable, complete and consistent (all 4/5). Additional strengths identified were that it contains information at the level of ingredients and the sample size is large enough to allow probabilistic assessment of acute dietary exposure to pesticides. The main limitation identified was that since it is an American study and that there are small sample sizes for specific sub-populations, it may not be representative of Canadian intakes. Moreover, PMRA highlighted that the consumption data does not address the “Pick Your Own” scenario, a limitation common to all existing dietary intake databases.
Specific Program Needs
Respondents also highlighted important needs that are unique to conducting risk assessment within certain HC organizations and which guide the selection of dietary intake data.
- The internationally recommended approach to risk assessment for Veterinary Drugs, for instance, is the use of relatively high fixed consumption data.
- Feedback from the Population Biomonitoring Section of HESCB reported the use of various dietary intake surveys which have been conducted as part of the Federal Northern Contaminants Program (NCP) (e.g. Maternal Blood Contaminant Study- Dietary Survey, Inuit Dietary Survey, NWT Dene Métis Dietary Surveys, and Yukon Dietary Surveys). These studies have helped to serve an important requirement of dietary assessment in northern and Indigenous communities whereby traditional food consumption varies with community and region.
Summary of findings on sources of dietary intake data:
Considering the substances/commodities/food products being assessed, the population of interest and the type of exposure assessments needed, each organization has different requirements for food intake databases. As the survey was not designed to directly assess or compare the quality of different dietary intake data sources, and information on the strengths and limitations was collected only from those using the data sources, additional work may be needed to better understand the specific purpose and requirements of the different risk assessment groups using dietary intake data in risk assessment.
4.2 Use of Dietary Intake Data in Exposure Assessment
4.2.1 Relevance and Current Practices
Embedded in the decision making framework, a health risk assessment includes several steps that are interconnected and defined as health hazard evaluation (hazard identification and characterization), exposure assessment, risk characterization, and risk classification.Footnote 4 Since this project focused on the use of dietary intake data in exposure assessments, the survey questionnaire also intended to explore current practices with respect to dietary exposure assessments within HC and resulted in a number of key findings.
Dietary exposure assessment is relevant to several organizations within the department.
- Three branches through six (6) directorates and ten (10) bureaus are using food consumption data in the context of their exposure assessment.
- Three (3) directorates are not using food consumption data for their exposure assessment, likely due to the fact that their organizations' mandates are not food-related.
- Food is the main source in exposure assessment for 50% of the bureaus using food consumption data.
- The meaning of dietary exposure may vary depending on the mandate of the organization and the nature of the SRA. For example, it may refer to food only, food and drinking water, and/or supplements.
Food consumption data are applied in different types of dietary exposure assessments.
- Respondents reported using either a combination of usual/chronic and acute intake data (6/10 respondents) or only usual/chronic intake data (4/10 respondents).
- Human health exposure/risk assessment to specific substances such as pesticides, chemical or microbial contamination always relies on dietary intake data (10/10 respondents).
- Other usages of food consumption data include pre and post- market risk/safety assessments (5/10 respondents) and health risk assessments in response to the Canadian Food Inspection Agency (CFIA) requests (6/10 respondents).
- Dietary intake data is applied in quantitative microbial risk assessment and used to support the development of risk management strategies or national guidelines as in the case of the development of soil quality guidelines for the Canadian Council of Ministers of the Environment and the development of drugs residues from the use of veterinary drugs in food producing animals.
The approach for performing dietary exposure assessments within Health Canada varies depending on the substance of interest.
- In general, dietary exposure assessment is performed internally in each organization, or in collaboration with another organization like the BFSSI in the FD.
- In the case of challenged substances in the Chemical Management Plan, Existing Substances Risk Assessment Bureau (Safe Environments Directorate (SED), HECSB) and Bureau of Chemical Safety (FD, HPFB) collaborate with statisticians from BFSSI.
- For some exposure assessments, external resources such as consultants or university researchers are requested.
- Depending on the scope of the exposure assessment or the extent of the database, respondents reported the use of probabilistic method, deterministic method or a combination of both methods.
Dietary exposure assessment requires access to electronic dietary intake databases and computer programs for analysis.
- Dietary intake data sources are available/accessible in electronic versions (SAS files accessible from HC's Data Analysis and Information System (DAIS), or websites held by various institutions such as the USDA, the US-FDA and universities).
- A few respondents still cited the use of paper format documents to lend additional information to their assessments e.g., the Institute of Medicine Report 2011 or a publication by Jackson et al. (2006) in the New England Journal of Medicine.
- Numerous computer programs, tools or applications are available to conduct dietary exposure analysis including SAS, S-PLUS, R, Analytica, SIDE, Excel, and SPSS. The most commonly used applications are Excel and SAS.
4.2.2 Limitations in Conducting Dietary Exposure Assessment Within Health Canada
The survey highlighted a number of key limitations HC risk assessors/evaluators are faced with when assessing exposure to these hazards through food and which help to explain the challenges of a harmonized approach for the use of dietary intake data. These limitations are outlined below and proposed solutions and suggested best practices follow in Section 5.
There is no existing national database on food consumption that meets the specific requirements for conducting evaluation/assessment across all HC organizations.
- Only CCHS cycle 2.2 (2004) contained up to date and comprehensive Canadian dietary intake data, although several limitations of the database were noted by respondents.
- Risk assessors/evaluators may have a variety of reasons for not using the same national data source, such as a lack or limited access to the data, or that the databases do not meet specific or mandatory requirements for the dietary exposure assessment.
- Some HC risk assessors/evaluators use international food and nutrition databases when needed, for example, as required by the conditions set by international regulatory organizations. This was also seen in the body weight discussion paper with U.S. Environmental Protection Agency and PMRA.Footnote 5
- U.S. dietary intake databases are the most common source of international data used in risk assessments across HC. It was noted that the U.S. government-funded dietary surveys are more readily available than the Canadian equivalents. Questions remain regarding the compatibility and potential for linkages between all databases.
Several barriers exist to accessing the necessary information, tools and capacity for effective selection and integration of dietary intake data in exposure assessments.
- The methodology used in population-based food and nutrition surveys is complex; thus the analysis of these survey data requires sophisticated statistical programs and tools.
- Not all risk assessors/evaluators have similar interest or time to review food and nutrition surveys.
- Respondents identified a lack of transparency on technical issues such as analytical methods, data processing and quality assurance/control procedures, which restricted users' knowledge about dietary databases and ability to compare databases.
- Barriers to accessing powerful statistical packages, including learning the new software and running it efficiently on a continuous basis, were identified. For example, one respondent mentioned that initially the SAS program was used for data analysis, but was later discontinued due to logistic reasons (resources/capability). In addition, some computations can take considerable time to run.
5. Conclusion
This project highlighted available national and international data on food and nutrition intake used by HC in conducting dietary exposure assessments. The survey also confirmed that dietary exposure assessment is relevant to several organizations within HC. Constraints related to differing dietary intake data requirements, access to databases, and availability of computer software/tools/applications across HC risk assessment groups were the major issues identified by this project. Harmonization of approaches in the use of dietary intake data remains a challenge as requirements vary depending on the substance of interest, route of exposure, the mandate of the branch or directorate, and existing agreements to harmonize exposure assessments with other international regulatory organizations. In light of the findings of this project, the use of different dietary intake datasets across the Department is acceptable in order to meet organizational requirements; however, there are several key areas where the Department can focus efforts to move toward greater harmonization.
6. Moving Forward
Despite the mentioned issues and challenges, the working group suggested several short, medium, and long-term steps to improve current practices. Getting to know ‘who is doing what’ and ‘how’ within the department and increasing users’ knowledge and awareness of available data sources on food and nutrition constitute a starting point in improving best practices in the conduct of exposure assessment. Furthermore, the working group suggested steps to influence the development of food consumption surveys and to enhance the usability of existing national datasets in hopes of establishing a more harmonized approach.
Short Term
- Increasing awareness and knowledge of food and nutrition surveys
- Raising awareness of this TFSRA project and disseminating this report would be a first step towards increased awareness among users on the different food consumption data used to conduct dietary exposure assessments across HC and requirements of the different branches/directorates.
- Encouraging risk assessors to use the Food and Nutrition Data Sources InventoryFootnote 6 to explore the various types of data available to them and sources of quantitative data on Canadians’ food and nutrition intake which may be of interest in dietary exposure assessment. The Office of Nutrition Policy and Promotion, HPFB took the initiative to develop this detailed inventory of Canadian food and nutrition data sources which was released in 2010 and updated in 2013.
- Understanding the specific requirements of risk assessors/evaluators in performing their exposure assessment tasks.
- Creating an inventory of the dietary intake data requirements and conditions such as international standards that must be met by the various risk assessment groups across HC would help to improve the methodology of food and nutrition surveys. This inventory can be shared with the methodologists and analysts of the food and nutrition surveys to assist with designing the survey methodology, the development of survey questionnaires and the accompanied documentation of any national survey in the future.
Medium Term
- Reinforcing users’ knowledge and capacity
- Presenting a common case study from various organizations at a future TFSRA meeting or at the HC Science Forum would be an excellent approach to showcase similarities and differences in dietary exposure assessments.
- Strengthening the knowledge and capacities of risk assessors/evaluators in different groups within HC through formal and informal networking, mentoring, workshop and webinar would be beneficial to junior staff for growth and an opportunity for senior evaluators to mentor/coach. This may ultimately lead to a gain in efficiency and consistency in dietary assessment approaches and enhanced understanding of key methodological issues related to food and nutrition databases in risk assessment.
- Consistent use of Canadian food consumption database whenever possible
- Agreeing to strive for the use of the same food consumption database among HC risk assessors would be a good practice. In fact, with the collaboration of the Existing Substances Risk Assessment Bureau of the SED of HECSB, the FD developed a set of food intake tables using the 2004 CCHS Nutrition data. After a short hands-on training, this standardized set of tables was made available to FD and SED risk assessors, evaluators, analysts and statisticians and has become a strong element in the risk assessors’ toolbox.
- Documenting the reasons why this common food consumption database cannot be used for risk assessment within certain HC organizations. Armed with this information,
it will be possible to assess the feasibility of and/or set priorities for solutions to overcome these issues.
Long-term
- Developing a more transparent and unified approach for the use of dietary intake data in exposure assessments across HC through:
- Working with Statistics Canada methodologists and HC nutrition analysts to improve food consumption surveys and dietary intake databases such as Statistics Canada’s CCHS to better meet the needs of risk assessors in HC;
- Providing tables, tools or computer applications to risk assessors/evaluators to efficiently and effectively integrate dietary intake data into the exposure assessment;
- Facilitating access to full databases on food consumption to those interested including methodology, data proceedings and quality assurance/quality control procedure;
- Mapping of foods reported in the surveys to other food classification categories (e.g. agricultural commodities) to better meet the needs of risk assessors across the department;
- Exploring potential linkages or compatibility between Canadian and international food consumption databases. Initiating discussion between risk assessors within the department and designers/implementers of food consumption surveys from both Canada and the U.S. (major source of international data), to examine opportunities for a standardized approach in food descriptions, coding of foods, equivalencies in agricultural commodities and reporting of food consumption intakes can be a starting point toward using respective countries’ databases and reaching a certain degree of harmonization.
7. Postscript
In the time since this survey was undertaken, a number of noteworthy activities have occurred including:
- Statistics Canada has conducted a second CCHS Nutrition focus survey in 2015. The data files were released in June 2017 and can be access in HC-DAIS by HC users.
- The Food Consumption Table (FCT) was developed which provides estimates of daily intakes of foods (means and percentiles) obtained using data from the 2004 CCHS cycle 2.2 data. Estimates were generated at three different food grouping levels based on the food group list from the FD’s Bureau of Nutritional Sciences. These estimates are presented for two consumption populations: “all persons” and “eaters only”. Each estimate is further broken down by various age-sex categories. For both consumption populations, estimates are available in two different units: 1) grams per person per day and 2) grams per kilogram of body weight per day. The FCT has been made available to many risk assessors across HC organizations and is now posted on the Government of Canada Open Data Portal. Similar tables are planned using the 2015 CCHS Nutrition data.
- PMRA has transitioned from the CSFII and now uses the National Health and Nutrition Examination Survey (NHANES) 2005–2010 dietary intake data.Footnote 7 In 2002, dietary intake data collection by USDA for CSFII was integrated with the US Department of Health and Human Service’s NHANES. NHANES is linked with the United States Environmental Protection Agency’s Dietary Exposure Evaluation Model—Food Consumption Intake Database. This integration allows for the translation of foods-as-eaten data reported by 24HR surveys on 2 non-consecutive days into raw agricultural commodities. Although continuing to rely on American data which may not be representative of the Canadian population, PMRA’s transition to using NHANES data allows for more current food intake data and meets the organizational requirement for commodity-level intake data.
- Data from NHANES 2013–2014 are available publicly in SAS format from the Centers for Disease Control and Prevention. Nutrient intake data from NHANES 2013–2014 are available on the USDA What We Eat in America web site.
8. References
- Health Canada, “Canadian Community Health Survey, Cycle 2.2, Nutrition (2004): A Guide to Accessing and Interpreting the Data, 2006.” www.canada.ca/en/health-canada/services/food-nutrition/food-nutrition-surveillance/ health-nutrition-surveys/canadian-community-health-survey-cchs/canadian-community-health-survey-cycle-2-2-nutrition-2004-guide-accessing-interpreting-data-health-canada-2006.html
- Health Canada, Health Canada Decision-Making Framework for Identifying, Assessing and Managing Health Risk, 2000
- Health Canada’s Task Force on Scientific Risk Assessment, Working Group on Body Weights. Selection of Body Weights for Use in Human Health Risk Assessment (HHRA) Conducted by Health Canada, December 2016
- Health Products and Food Branch’s Health Risk Assessment Working Group, Health Products and Food Branch’s guide for conducting Health Risk Assessment, January 2011
- Labonté et al., Dietary assessment is a critical element of health research—Perspective from the Partnership for Advancing Nutritional and Dietary Assessment in Canada. Applied Physiology, Nutrition, and Metabolism, 2016, 41(10): 1096–1099, https://doi.org/10.1139/apnm-2016-0146
- Office of Nutrition Policy and Promotion, Food and Nutrition Data Source Inventory, 2010
- Pest Management Regulatory Agency, Science Policy Note SPN2014-01, General Exposure Factor Inputs for Dietary, Occupational, and Residential Exposure Assessments. 2014. Available from: www.canada.ca/en/health-canada/services/ consumer-product-safety/reports-publications/pesticides-pest-management/policies-guidelines/science-policy-notes/ 2014/general-exposure-factor-inputs-dietary-occupational-residential-exposure-assessments-spn2014-01.html
- Veterinary Drugs Directorate, Guidance for Industry Preparation of New Drug Submissions. 2007. Available from: www.canada.ca/en/health-canada/services/drugs-health-products/veterinary-drugs/legislation-guidelines/ guidance-documents/guidance-industry-preparation-veterinary-new-drug-submissions-health-canada-2007.html
Appendix A—Survey Questionnaire
Dietary exposure assessment — a survey of current practices
Task Force on Scientific Risk Assessment
June 2011
Preamble:
Food consumption is an exposure pathway for a wide variety of chemical and microbiological hazards to human health. Large food consumption surveys (such as Statistics Canada's CCHS 2004) provide an opportunity for risk assessors to develop more comprehensive exposure assessments.
One of the tasks of this project is to identify the users, the scope and limitations of usage, including the type of dietary data used in exposure assessment. The outcome is to support the TFSRA users in making better use of the data sources and analysis techniques.
Name of the person filling this questionnaire:
Organization: Branch/Directorate/Bureau/Division:
Sources of Dietary Data
1. Does your Bureau/Division use dietary data in the context of exposure assessment to human health hazards?
- No, please explain then go to Q4
- Yes, please fill out this table for your main sources of information (up to 4 sources)
| 1st SOURCE | 2nd SOURCE | 3rd SOURCE | 4th SOURCE | |
|---|---|---|---|---|
| Name of the survey or study | - | - | - | - |
| Year (period) it was conducted | - | - | - | - |
| Type of data | ||||
| A) Quantitative, (specify if it is: 24 hr recall, food records, food frequency questionnaire or other) | - | - | - | - |
| B) Qualitative (such public opinions, interviews or focus group discussions) please describe | - | - | - | - |
| C) Equal use of quantitative and qualitative data | - | - | - | - |
| Format received: | ||||
| A) Electronic (Excel, Access, Oracle, text, other) | - | - | - | - |
| B) Paper (publications, tables) Provide references | - | - | - | - |
2. Indicate the strength of your top two sources of data for risk assessment by giving a score (1 being the lowest and 5 the highest score) to the following attributes:
| Primary Source | Secondary Source | |
|---|---|---|
| Indexed/searchable | - | - |
| Complete | - | - |
| Consistent | - | - |
| Updatable | - | - |
Other possible attributes for the primary source, please specify:
Other possible attributes for the secondary source, please specify:
3. What are the limitations of your top two sources of data for risk assessment? Please check all that apply.
Primary | Secondary |
|
|---|---|---|
| Sampling is not representative of Canadians | - | - |
| No representation of some specific age groups vulnerable groups (eg babies and toddlers, people living in the Territories) | - | - |
| The dataset is out-dated | - | - |
| Limited or restricted data access | - | - |
| Not the right level of information on the food commodities of interest | - | - |
| Not enough details on the food and/or amount consumed (e.g. brand names, packaging, cooking methods) | - | - |
Any other limitation besides those indicated above for your primary source:
Any other limitation besides those indicated above for your secondary source:
4. Are you using Canadian, American or other countries' data and how frequently?
- Canadian:
- all the time
- most of the time
- rarely
- never
- American:
- all the time
- most of the time
- rarely
- never
- Other countries:
- all the time
- most of the time
- rarely
- never
please identify the countries
5. Do you rely on your primary source of dietary data for all exposure assessments?
- Always
- Sometimes (indicate how frequently):
- It depends on the substance of interest, please provide an example:
6. Do you use usual/chronic intake, acute intake or a combination of them in your analyses?
- Usual/chronic intake
- Acute intake
- or a combination of them, specify:
Dietary exposure assessment
7. Who conducts the dietary exposure assessment in your Bureau/Division?
8. Is food the main exposure source used in your exposure assessments?
- Yes
- No, specify other exposure sources
- Do not know
9. Check the types of assessments in which the dietary data is applied.
More than one response can be checked.
- Pre-market risk/safety assessments
- Post-market risk/safety assessments
- Health risk assessments in response to CFIA requests
- Human health exposure/risk assessment to specific substances (e.g. pesticides, chemical residues, nutrients)
- Other:
10. What types of computer programs, tools or applications are used? What types of deterministic/probabilistic calculations are done?
11. Were there challenges (e.g. software, hardware, capability, resources) others than those related to data issues, mentioned in question #3, in conducting a dietary exposure assessment?
12. Any additional comments:
13. Can you provide an example of a dietary exposure assessment report? Please provide the pdf, the web link or citation of publications.
THANK YOU / MERCI
Please return the completed questionnaire to:
Danielle Brulé, Food Directorate, P.L. 2203C, Banting building Email: Danielle.brule@hc-sc.gc.ca
Appendix B—List of Respondents' Organizations and Roles
| Branch | Directorate | Bureau | Roles |
|---|---|---|---|
| HECSB | Environmental and Radiation Health Sciences Directorate | Chemicals Surveillance Bureau | Section Head |
| HECSB | Safe Environments Directorate | Existing Substances Risk Assessment Bureau—Assessment Division 3 | Scientific Evaluators |
| HECSB | Safe Environments Directorate | Water and Air Quality Bureau—Water Quality Science Division | Scientific Evaluators |
| HESCB | Safe Environments Directorate | Environmental Health BureauAppendix B Footnote * | Risk Assessors |
| RAPB | Vancouver and Quebec regions | Environment Health ProgramAppendix B Footnote * | Risk Assessors |
| HPFB | Food Directorate | Bureau of Food Surveillance and Science Integration | Statistician |
| HPFB | Food Directorate | Bureau of Microbial Hazards | Scientific Evaluator |
| HPFB | Food Directorate | Bureau of Chemical Safety | Scientific Evaluator |
| PMRA | Health Evaluation Directorate | Scientific Evaluator | |
| HPFB | Natural and Non-Prescription Health Products Directorate | Bureau of Product Review and Assessment/ Product Assessment Division | Scientific Evaluator |
| HPFB | Veterinary Drugs Directorate | Human Safety Division | Scientific Evaluators |
|
|||
Nil responses from BGTD, MHPD, HECSB-Consumer Product Safety Directorate
Footnotes
- Footnote 1
-
Health Canada, Health Canada Decision-Making Framework for Identifying, Assessing and Managing Health Risk, 2000
- Footnote 2
-
Labonté et al., Dietary assessment is a critical element of health research—Perspective from the Partnership for Advancing Nutritional and Dietary Assessment in Canada. Applied Physiology, Nutrition, and Metabolism, 2016, 41(10): 1096–1099, https://doi.org/10.1139/apnm-2016-0146
- Footnote 3
-
Health Canada, “Canadian Community Health Survey, Cycle 2.2, Nutrition (2004): A Guide to Accessing and Interpreting the Data, 2006.” www.canada.ca/en/health-canada/services/food-nutrition/food-nutrition-surveillance/health-nutrition-surveys/ canadian-community-health-survey-cchs/canadian-community-health-survey-cycle-2-2-nutrition-2004-guide-accessing- interpreting-data-health-canada-2006.html
- Footnote 4
-
Health Products and Food Branch's Health Risk Assessment Working Group, Health Products and Food Branch's guide for conducting Health Risk Assessment, January 2011
- Footnote 5
-
Health Canada's Task Force on Scientific Risk Assessment, Working Group on Body Weights. Selection of Body Weights for Use in Human Health Risk Assessment (HHRA) Conducted by Health Canada, December 2016
- Footnote 6
-
Office of Nutrition Policy and Promotion, Food and Nutrition Data Source Inventory, 2010.
- Footnote 7
-
Pest Management Regulatory Agency, Science Policy Note SPN2014-01, General Exposure Factor Inputs for Dietary, Occupational, and Residential Exposure Assessments. 2014.