Collections Management in Canadian Museums: 2016 Results
Table of Contents
Overview
In the spring of 2016, the Public Opinion Research (POR) unit of the Department of Canadian Heritage launched a Collections Management System (CMS) Survey on behalf of the Canadian Heritage Information Network (CHIN) to gain a better understanding of the current realities in collections documentation and digitization in Canadian museums. This report provides an overview of the data as well as an analysis of the results.
Survey methodology and results
POR sent an initial email introducing the CMS survey to 1411 client organizations for whom CHIN had a valid email address. This was followed by an invitation from POR to respond to the survey. The survey was available from May 25 to June 29, 2016. CHIN received 236 responses for a participation rate of 17%, which is slightly higher than the average response rate of 10–15% for external surveys. The responses yield information which will be very useful in planning CHIN’s resources.
The survey contained 18 questions of a general nature about the responding museum and its collections, the state of its documentation and digitization, and standards used in documenting the collections. Key results reveal that:
- 82% of respondents use an automated system to document their collections;
- 74% of those systems have been in place for three or more years;
- 26% of respondents plan to purchase a new CMS in the next three years; and
- the most widely used object classification system is Nomenclature and/or the Parks Canada Visual Dictionary.
The survey questions are included in Appendix A. Please note that because some questions were broken down into multiple potential responses, there are more than 18 questions listed in the results. For several questions, respondents could choose to write in a response under an “Other” option. These responses were then grouped into categories for ease of reporting.
Collections
Size of collections
Respondents were asked to indicate the size of their collections, ranging from less than 1000 to more than 3,000,000 objects.
Figure 1. Number of items in collections
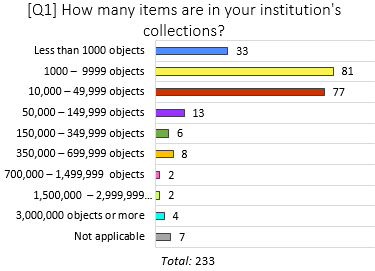
Figure 1: Number of items in collections – text version
| Response | Count | Percentage |
|---|---|---|
Not applicable |
7 |
3% |
3,000,000 objects or more |
4 |
2% |
1,500,000 – 2,999,999 objects |
2 |
1% |
700,000 – 1,499,999 objects |
2 |
1% |
350,000 – 699,999 objects |
8 |
3% |
150,000 – 349,999 objects |
6 |
3% |
50,000 – 149,999 objects |
13 |
6% |
10,000 – 49,999 objects |
77 |
33% |
1000 – 9999 objects |
81 |
35% |
Less than 1000 objects |
33 |
14% |
| Total | 233 | 100% |
The majority of respondents were from smaller institutions. In fact, the three smallest institution categories combined make up 82% of the 233 respondents:
- 1000–9999 objects (34%);
- 10,000–49,999 objects (33%); and
- Fewer than 1000 objects (14%)
Digitized collections
The next series of questions related to electronic documentation of museum collections.
Figure 2. Institutions with digital collection records in an automated system
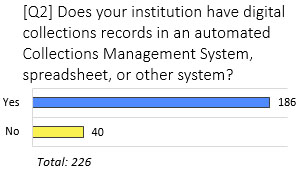
Figure 2. Institutions with digital collection records in an automated system – text version
| Response | Count | Percentage |
|---|---|---|
Yes |
186 |
82% |
No |
40 |
18% |
| Total | 226 | 100% |
While 82% of respondents responded that they use some sort of electronic system for recording their collections, the remainder have no electronic system.
Figure 3. Software used to manage collections
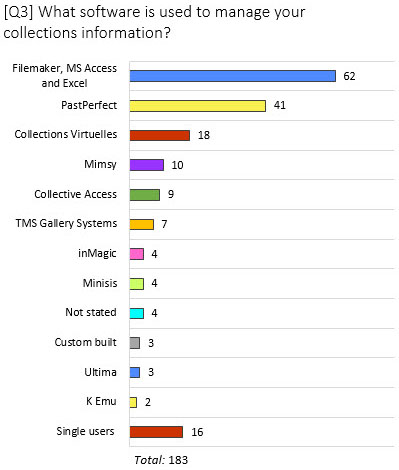
Figure 3. Software used to manage collections – text version
| Response | Count | Percentage |
|---|---|---|
FileMaker, MS Access or Excel |
62 |
34% |
PastPerfect |
41 |
22% |
Collections Virtuelles |
18 |
10% |
Mimsy |
10 |
5% |
Collective Access |
9 |
5% |
TMS Gallery Systems |
7 |
4% |
inMagic |
4 |
2% |
Minisis |
4 |
2% |
Not stated |
4 |
2% |
Custom built |
3 |
2% |
Ultima |
3 |
2% |
K Emu |
2 |
1% |
Single users |
16 |
9% |
| Total | 183 | 100% |
The most commonly used systems were:
- FileMaker, MS Access or Excel (34%);
- PastPerfect (22%); and
- Collections Virtuelles (10%)
A number of software products were used by only one respondent each (totalling 16 of the responses). They include Adlib, Alpha, Argus, Canadian Forces Artefact Management System, Drupal, EmbARK, Info-Muse, MIMS, Mobydoc, Nomenclature, SNBase, TRIM, ResourceMate, Yukon Museums DB and Zoological Information Management System. Although there is a wide range of software in use, 66% of respondents are users of the three largest categories.
Figure 4. Length of time the software has been in use
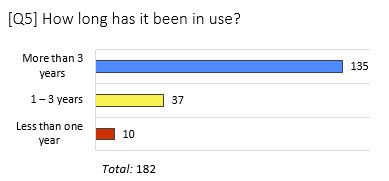
Figure 4. Length of time the software has been in use – text version
| Response | Count | Percentage |
|---|---|---|
Less than one year |
10 |
6% |
1 – 3 years |
37 |
20% |
More than 3 years |
135 |
74% |
| Total | 182 | 100% |
Anecdotally, it is known that software in museums tends to be used for several years and is not always kept up to the current version. The survey results confirm this fact:
- 74% of respondents reported that their software had been in use for more than three years;
- 20% had been using their software for one to three years; and
- Only 7% of were using a system for less than a year.
Software that is older and has not been updated can pose a risk for museums.
Figure 5. Plans to acquire a new collections management system
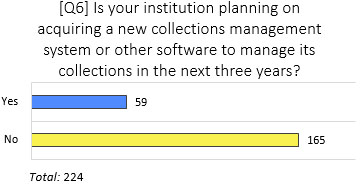
Figure 5. Plans to acquire a new collections management system – text version
| Response | Count | Percentage |
|---|---|---|
Yes |
59 |
26% |
No |
165 |
74% |
| Total | 224 | 100% |
Slightly more than one-quarter of respondents are planning to purchase a new collections management system in the next three years.
In a cross-tabulation looking at the use of a system (Q4) compared to plans to purchase a system (Q6), 25% of respondents with an electronic software system (46 out of 186) plan to acquire a new one while 33% respondents without any software for managing their collections (13 out of 40) plan to acquire one.
Figure 6: Importance of specific aspects of collections management
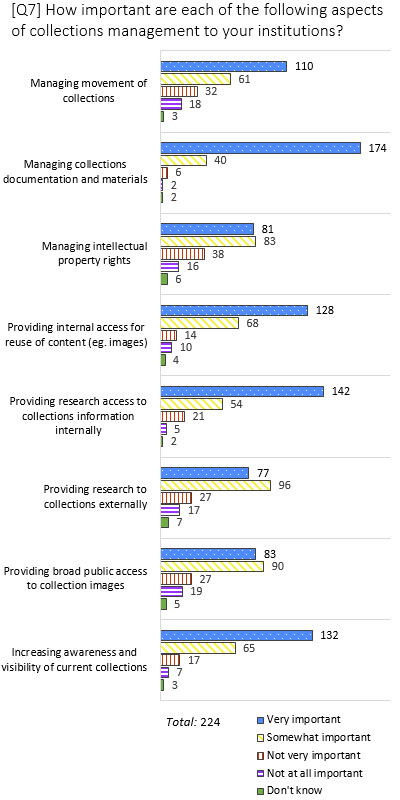
Figure 6: Importance of specific aspects of collections management – text version
| Collection management | Very important | Somewhat important | Not very important | Not at all important | Don't know | Total |
|---|---|---|---|---|---|---|
Managing movement of collections |
110 |
61 |
32 |
18 |
3 |
224 |
Managing collections documentation and materials |
174 |
40 |
6 |
2 |
2 |
224 |
Managing intellectual property rights |
81 |
83 |
38 |
16 |
6 |
224 |
Providing internal access for reuse of content (eg. images) |
128 |
68 |
14 |
10 |
4 |
224 |
Providing research access to collections information internally |
142 |
54 |
21 |
5 |
2 |
224 |
Providing research to collections externally |
77 |
96 |
27 |
17 |
7 |
224 |
Providing broad public access to collection images |
83 |
90 |
27 |
19 |
5 |
224 |
Increasing awareness and visibility of current collections |
132 |
65 |
17 |
7 |
3 |
224 |
In terms of important aspects of collections management:
- 96% of respondents said that managing collections documentation and materials was either very important or somewhat important;
- 88% said that increasing awareness and visibility of collections was either very important or somewhat important;
- 88% said that providing research to collections information internally and providing internal access for reuse of content were either very or somewhat important; and
- 88% responded that providing research access to collections externally and providing broad access to collection images were either very or somewhat important.
The next highest areas of concern were managing movement of collections (77%) and managing intellectual property rights (73%).
For this question, respondents could choose an “Other” category and write in a response. Additional responses included: managing conservation information, public and educational online content, and looking for public comments for additional information. Some institutions also noted the lack of resources to properly document their collections electronically.
| Size of collection | < 1000 | 1000–9999 | 10,000–49,999 | 50,000–149,999 | 150,000–349,999 | 350,000–699,999 | 700,000–1.5 million | 1.5 million+ |
|---|---|---|---|---|---|---|---|---|
| Institutions with records for internal use only | 12 | 59 | 49 | 10 | 5 | 4 | 1 | 5 |
| Institutions with images for internal use only | 13 | 57 | 54 | 11 | 5 | 5 | 1 | 5 |
| Institutions with future plans to add more images | 11 | 46 | 49 | 11 | 4 | 4 | 1 | 5 |
| Total number of respondents by category | 33 | 81 | 75 | 12 | 6 | 8 | 2 | 7 |
In a cross-tabulation of Q1 and Q8a, the largest percentage of institutions that have records available for internal use only are those with between 50,000–149,999 (10 out of 12 or 83%) and 150,000–349,999 records (5 out of 6 or 83%). Images for internal use also are highest in these groups. The 50,000–149,999 category is also the highest percentage of respondents that have future plans to add more images (11 out of 12 or 92%). However, the categories with the bigger collection sizes have fewer respondents than those of smaller institutions. A good proportion of the categories with smaller collection sizes also have records available internally: 72% of respondents in the 1000–9999 objects category (59 out of 81) and 65% of respondents in the 10,000 – 49,999 object category (49 out of 75).
| Size of collection | < 1000 | 1000–9999 | 10,000–49,999 | 50,000–149,999 | 150,000–349,999 | 350,000–699,999 | 700,000–1.5 million | 1.5 million+ |
|---|---|---|---|---|---|---|---|---|
| Institutions with records on their institutional website | 1 | 15 | 28 | 6 | 1 | 1 | 0 | 3 |
| Institutions with images on their institutional website | 2 | 22 | 21 | 6 | 1 | 1 | 0 | 3 |
| Institutions with future plans to add more images | 3 | 13 | 16 | 6 | 1 | 2 | 0 | 2 |
| Total number of respondents by category | 33 | 81 | 75 | 12 | 6 | 8 | 2 | 7 |
Few institutions responded that they have records and images available on their websites. However, of the 12 institutions in the 50,000–149,000 objects category, 50% reported having records and images on their sites with the same percentage reporting they have plans to add more images.
| Size of collection | < 1000 | 1000–9999 | 10,000–49,999 | 50,000–149,999 | 150,000–349,999 | 350,000–699,999 | 700,000–1.5 million | 1.5 million+ |
|---|---|---|---|---|---|---|---|---|
| Institutions with social media records | 0 | 7 | 11 | 1 | 0 | 2 | 0 | 0 |
| Institutions with social media images | 1 | 7 | 9 | 1 | 0 | 2 | 0 | 0 |
| Institutions with future plans to add more images | 1 | 0 | 0 | 0 | 1 | 0 | 0 | 0 |
| Total number of respondents | 33 | 81 | 75 | 12 | 6 | 8 | 2 | 7 |
Very few institutions make their images available on social media sites.
There was an open-ended option to this series of questions that allowed institutions to list other channels on which they posted collections records and images. Several responses to the question on other channels included information about posting images to specific social media channels, which may be because there was some confusion about the wording of the social media question. Other responses in the “Other access channels” category included Google Art, blogs and provincial collections as well as specialized networks.
Figure 7. Contribution to Artefacts Canada
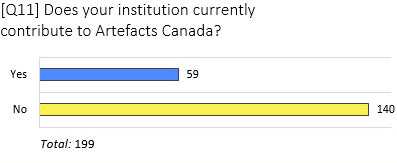
Figure 7. Contribution to Artefacts Canada – text version
| Response | Count | Percentage |
|---|---|---|
Yes |
59 |
30% |
No |
140 |
70% |
| Total | 199 | 100% |
More than two-thirds of respondents (70%) are not contributing to Artefacts Canada. Reasons in the survey are indicated below, with the highest proportion of the standard responses saying that they are waiting until digital images are available to share, followed by difficulty exporting data from a CMS.
Figure 8. Reasons for not contributing to Artefacts Canada
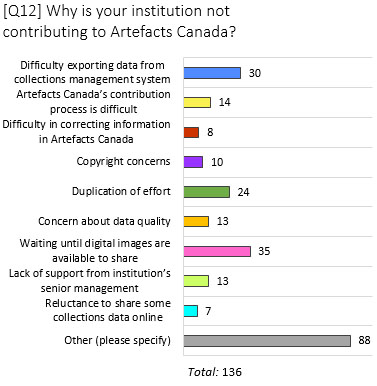
Figure 8. Reasons for not contributing to Artefacts Canada – text version
| Response | Count | Percentage |
|---|---|---|
Other (please specify) |
88 |
65% |
Reluctance to share some collections data online |
7 |
5% |
Lack of support from institution’s senior management |
13 |
10% |
Waiting until digital images are available to share |
35 |
26% |
Concern about data quality |
13 |
10% |
Duplication of effort |
24 |
18% |
Copyright concerns |
10 |
7% |
Difficulty in correcting information in Artefacts Canada |
8 |
6% |
Artefacts Canada’s contribution process is difficult |
14 |
10% |
Difficulty exporting data from collections management system |
30 |
22% |
| Total | 136 | 100% |
Data can be contributed to Artefacts Canada without images, as these records still have value for museum professionals carrying out research on Canadian collections, so this need not be a deterrent to contribution. Difficulty in exporting data from a collections management system is of concern, particularly as data export for migration is a key component in digital preservation.
Breaking down the “Other” category provides additional information. Responses were grouped by similarity of responses such as “lack of time” or “not aware of the possibility.” Almost two thirds of the respondents cited time and/or money issues. The next highest grouping was for those who were unaware of the possibility of contributing (20%).
Figure 9. Other reasons for not contributing to Artefacts Canada
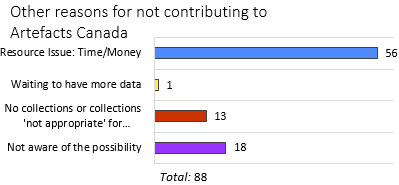
Figure 9. Other reasons for not contributing to Artefacts Canada – text version
| Other reasons for not contributing | Count | Percentage |
|---|---|---|
Not aware of the possibility |
18 |
20% |
No collections or collections "not appropriate" for contribution |
13 |
15% |
Waiting to have more data |
1 |
1% |
Resource Issue: Time/Money |
56 |
64% |
| Total | 88 | 100% |
Digital preservation
Figure 10. Digital preservation policies and plans
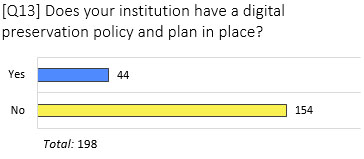
Figure 10. Digital preservation policies and plans – text version
| Response | Count | Percentage |
|---|---|---|
Yes |
44 |
22% |
No |
154 |
78% |
| Total | 198 | 100% |
Less than one quarter of the respondents (22%) have a digital preservation policy and plan in place. Those who responded that they had a digital preservation policy and plan were presented with an open-ended question about what resources were used to guide the policy or plan.
For those who responded to this follow-up question, the most frequent resource (10 of 33 responses) used for policy guidance was provincial museum or archival associations. This was followed by institutions responding that their plan was for technical backup of the systems (9 of 33).
Institutions requiring guidance in setting up digital preservation plans can refer to CHIN’s Digital Preservation resources.
Standards
Object classification
The following figures illustrate the responses to the questions on object classifications used and how they are used. Figures 11, 12 and 13 provide the responses for those institutions that are using Parks Canada’s Descriptive and Visual Dictionary of Objects, Chenhall Revised Nomenclature or Nomenclature 3.0 or 4.0. These are the most widely used systems for object classification in responding institutions. For these questions, it was possible to choose more than option, as the classification systems could be used with different types of modifications, as specified in the question.
Figure 11. Managing collections with the Parks Canada object classification system
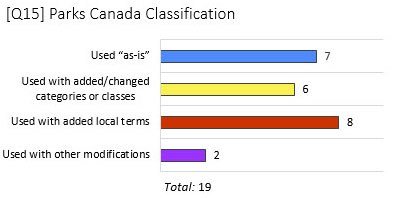
Figure 11. Managing collections with the Parks Canada object classification system – text version
| Response | Count | Percentage |
|---|---|---|
Use “as-is” |
7 |
37% |
Used with added/changed categories or classes |
6 |
32% |
Used with added local terms |
8 |
42% |
Used with other modifications |
2 |
11% |
| Total | 19 | 100% |
Figure 12. Managing collections with the Chenhall Revised Nomenclature object classification system
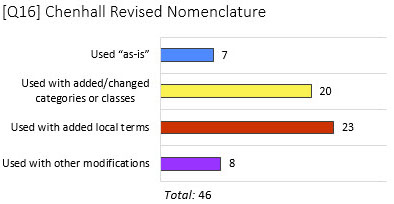
Figure 12. Managing collections with the Chenhall Revised Nomenclature object classification system – text version
| Response | Count | Percentage |
|---|---|---|
Use “as-is” |
7 |
15% |
Used with added/changed categories or classes |
20 |
44% |
Used with added local terms |
23 |
50% |
Used with other modifications |
8 |
17% |
| Total | 46 | 100% |
Figure 13. Managing collections with the Nomenclature 3.0 or 4.0 object classification system
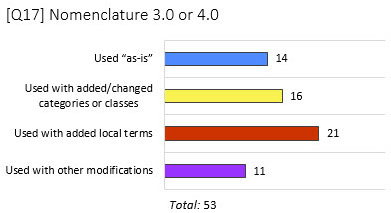
Figure 13. Managing collections with the Nomenclature 3.0 or 4.0 object classification system – text version
| Response | Count | Percentage |
|---|---|---|
Use “as-is” |
14 |
26% |
Used with added/changed categories or classes |
16 |
30% |
Used with added local terms |
21 |
40% |
Used with other modifications |
11 |
21% |
| Total | 53 | 100% |
Figure 14. Managing collections with the Info-Muse object classification system
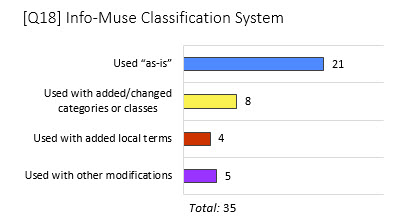
Figure 14. Managing collections with the Info-Muse object classification system – text version
| Response | Count | Percentage |
|---|---|---|
Use “as-is” |
21 |
60% |
Used with added/changed categories or classes |
8 |
23% |
Used with added local terms |
4 |
11% |
Used with other modifications |
5 |
14% |
| Total | 35 | 100% |
Over three quarters of the respondents to questions 16 through 18 are using a version of Nomenclature or Parks Canada classification systems, either as is or in combination with modifications or added local terms, while 23% are using Info-Muse.
Figure 15. Managing collections with an internally developed object classification system
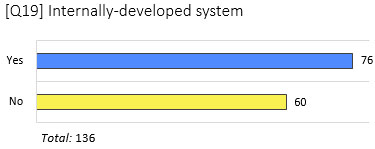
Figure 15. Managing collections with an internally developed object classification system – text version
| Response | Count | Percentage |
|---|---|---|
Yes |
76 |
56% |
No |
60 |
44% |
| Total | 136 | 100% |
Over half of the respondents to this question are using internally developed systems, while 44% responded that they do not have an internally developed system. It was possible for respondents to answer that they used one of the classification systems in questions 16 through 18 and also that they used an internally developed system.
Additional classification systems mentioned in “Other” responses included Library of Congress, Rules for Archival Description and a number of specialized terminologies (e.g. Natural History, Maritime History).
Terminology standardization
The following questions indicate the level of standardization for various types of information in collections management systems.
Figure 16. Method of standardizing terminology for object naming
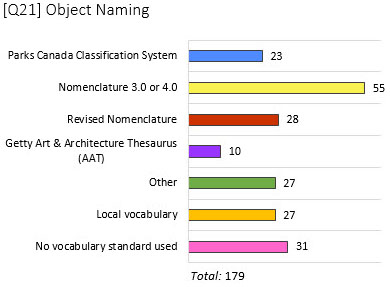
Figure 16. Method of standardizing terminology for object naming – text version
| Response | Count | Percentage |
|---|---|---|
No vocabulary standard used |
31 |
17% |
Local vocabulary |
27 |
15% |
Other |
27 |
15% |
Getty Art & Architecture Thesaurus (AAT) |
10 |
6% |
Revised Nomenclature |
28 |
16% |
Nomenclature 3.0 or 4.0 |
55 |
31% |
Parks Canada Classification System |
23 |
13% |
| Total | 179 | 100% |
Figure 17. Method of standardizing terminology for geographic names
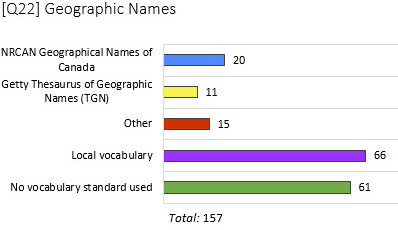
Figure 17. Method of standardizing terminology for geographic names – text version
| Response | Count | Percentage |
|---|---|---|
No vocabulary standard used |
61 |
39% |
Local vocabulary |
66 |
42% |
Other |
15 |
10% |
Getty Thesaurus of Geographic Names (TGN) |
11 |
7% |
NRCAN Geographical Names of Canada |
20 |
13% |
| Total | 157 | 100% |
As seen in the responses to the previous questions regarding classification systems, Parks Canada Classification System and Nomenclature are widely used in object naming, making up 59% of responses for this category. Only 18% of respondents did not use a vocabulary standard for object naming.
For geographic names, on the other hand, 42% use a local vocabulary, while 39% use no vocabulary standard.
Figure 18. Method of standardizing terminology for artist/creator names
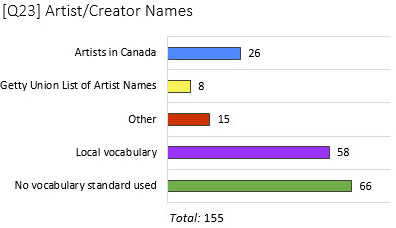
Figure 18. Method of standardizing terminology for artist/creator names – text version
| Response | Count | Percentage |
|---|---|---|
Artists in Canada |
26 |
17% |
Getty Union List of Artist Names |
8 |
5% |
Other |
15 |
10% |
Local vocabulary |
58 |
37% |
No vocabulary standard used |
66 |
43% |
| Total | 155 | 100% |
Figure 19. Method of standardizing terminology for materials/medium/support/technique
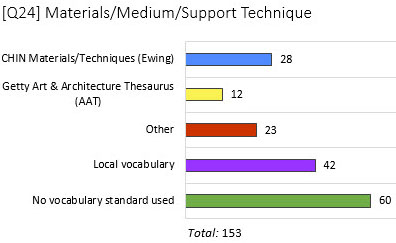
Figure 19. Method of standardizing terminology for materials/medium/support/technique – text version
| Response | Count | Percentage |
|---|---|---|
CHIN Materials/Techniques (Ewing) |
28 |
18% |
Getty Art & Architecture Thesaurus (AAT) |
12 |
8% |
Other |
23 |
15% |
Local vocabulary |
42 |
28% |
No vocabulary standard used |
60 |
39% |
| Total | 153 | 100% |
Figure 20. Method of standardizing terminology for culture
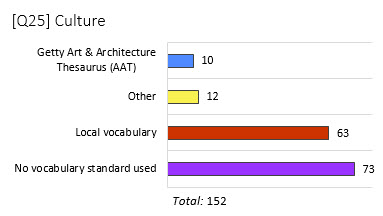
Figure 20. Method of standardizing terminology for culture – text version
| Response | Count | Percentage |
|---|---|---|
Getty Art & Architecture Thesaurus (AAT) |
10 |
7% |
Other |
12 |
8% |
Local vocabulary |
63 |
41% |
No vocabulary standard used |
73 |
48% |
| Total | 152 | 100% |
For artist names, the option of “No vocabulary standard used” was the most widely chosen response at 43%, followed by use of a local vocabulary at 37%. For materials/medium/support/techniques, the “No vocabulary standard” response (39%) was followed by a local vocabulary (28%). For culture, almost half did not use a standard (48%), while over four in ten applied a local vocabulary.
Figure 21. Method of standardizing terminology for time periods
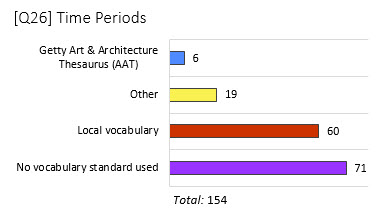
Figure 21. Method of standardizing terminology for time periods – text version
| Response | Count | Percentage |
|---|---|---|
No vocabulary standard used |
71 |
46% |
Local vocabulary |
60 |
39% |
Other |
19 |
12% |
Getty Art & Architecture Thesaurus (AAT) |
6 |
4% |
| Total | 154 | 100% |
For time periods, 46% of respondents do not use a vocabulary standard, while 39% use a local vocabulary. These results indicate that the most standardized type of information is for object name. For other data types, only in geographic standards did a local vocabulary outnumber no vocabulary standard used in responses, perhaps not surprisingly, as local vocabularies may include regionally specific terms.
In Q27 respondents were provided with an open space to list other vocabularies used. There were several responses mentioning additional specialized vocabularies such as for coins or stamps. Also, some mentioned that they have standards incorporated into their CMS. Some respondents in the “Other” responses pointed out that natural history standards were not part of the potential responses as the options were more relevant to humanities collections.
An additional open question asked respondents for input on the anticipated future needs for controlled vocabularies. The most frequent responses to Q28 related to the need for guidance and/or developing internal guidelines, as well as overall work on collections documentation (38%). This was followed by 28% of respondents who identified no anticipated need or no change from current practices. There were some specialized needs identified, including terminology related to new technologies and born-digital art. Most responses focused on the time and resources required in order to standardize the vocabulary in their collections.
Data entry rules
Figure 22. Use of CHIN Data Dictionary for data entry rules
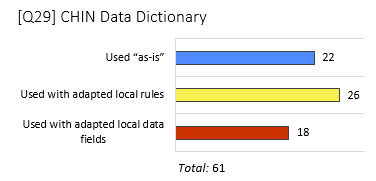
Figure 22. Use of CHIN Data Dictionary for data entry rules – text version
| Response | Count | Percentage |
|---|---|---|
Used with adapted local data fields |
18 |
30% |
Used with adapted local rules |
26 |
43% |
Used “as-is” |
22 |
36% |
| Total | 61 | 100% |
Figure 23. Use of Cataloguing Cultural Objects (CCO) for data entry rules
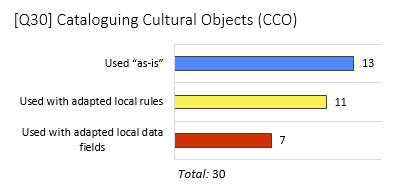
Figure 23. Use of Cataloguing Cultural Objects (CCO) for data entry rules – text version
| Response | Count | Percentage |
|---|---|---|
Used 'as-is' |
13 |
43% |
Used with adapted local rules |
11 |
37% |
Used with adapted local data fields |
7 |
23% |
| Total | 30 | 100% |
Figure 24. Use of Info-Muse Network Documentation Guide for data entry rules
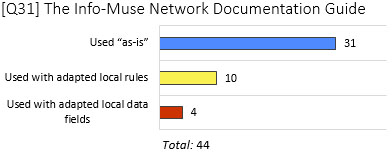
Figure 24. Use of Info-Muse Network Documentation Guide for data entry rules – text version
| Response | Count | Percentage |
|---|---|---|
Used “as-is” |
31 |
71% |
Used with adapted local rules |
10 |
23% |
Used with adapted local data fields |
4 |
9% |
| Total | 44 | 100% |
Figure 25. Use of data entry rules dictated by Collections Management System
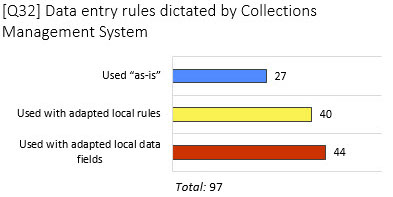
Figure 25. Use of data entry rules dictated by Collections Management System – text version
| Response | Count | Percentage |
|---|---|---|
Used “as-is” |
27 |
28% |
Used with adapted local rules |
40 |
41% |
Used with adapted local data fields |
44 |
45% |
| Total | 97 | 100% |
Figure 26. Use of local data entry rules
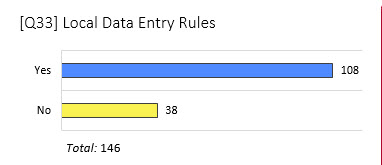
Figure 26. Use of local data entry rules – text version
| Response | Count | Percentage |
|---|---|---|
Yes |
108 |
74% |
No |
38 |
26% |
| Total | 146 | 100% |
In response to the question regarding data entry rules
- the highest number of responses was for local data entry rules (108 of 338 total responses to these questions or 32%);
- the next highest response was for data entry rules dictated by the collections management system (97 of 338 total responses or 29%), mostly with adapted local data fields (44 of the 97 respondents citing data entry rules dictated by collections management system or 45%);
- the CHIN data dictionary was the third most frequent response with 61 respondents or 18%.
The total number of responses for this series of questions (338) is higher than the total number of survey respondents, indicating that respondents may be using different data entry rules in different situations.
Institutional information
Figure 27. Provincial Participation
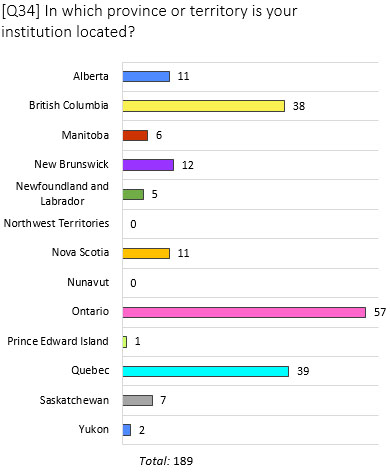
Figure 27. Provincial Participation – text version
| Response | Count | Percentage |
|---|---|---|
Alberta |
11 |
6% |
British Columbia |
38 |
20% |
Manitoba |
6 |
3% |
New Brunswick |
12 |
6% |
Newfoundland and Labrador |
5 |
3% |
Northwest Territories |
0 |
0% |
Nova Scotia |
11 |
6% |
Nunavut |
0 |
0% |
Ontario |
57 |
30% |
Prince Edward Island |
1 |
1% |
Quebec |
39 |
21% |
Saskatchewan |
7 |
4% |
Yukon |
2 |
1% |
| Total | 189 | 100% |
The largest number of responses came from the three largest provinces.
Figure 28. Type of internet access
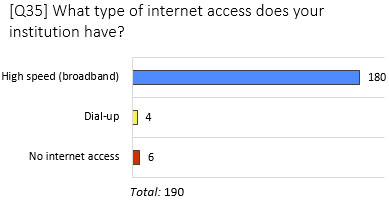
Figure 28. Type of internet access – text version
| Response | Count | Percentage |
|---|---|---|
No internet access |
6 |
3% |
Dial-up |
4 |
2% |
High speed (broadband) |
180 |
95% |
| Total | 190 | 100% |
The majority of institutions have high speed internet access (95%). Less than 3% have dial-up access, while just over 3% have no internet access. A 2016 report by the Canadian Radio and Telecommunication Commission (CRTC) found that over 80% of Canadian households had access to speeds of at least 50 Mbps. Responses to this question show high speed access to be even more prevalent in Canadian museums.
Figure 29. Institution types
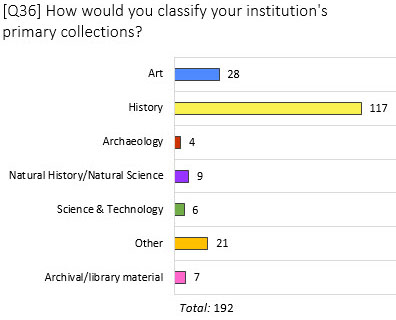
Figure 29. Institution types – text version
| Response | Count | Percentage |
|---|---|---|
Art |
28 |
15% |
History |
117 |
61% |
Archaeology |
4 |
2% |
Natural History/Natural Science |
9 |
5% |
Science & Technology |
6 |
3% |
Other |
21 |
11% |
Archival/library material |
7 |
4% |
| Total | 192 | 100% |
Institutions were asked to classify their institutions according to their primary collection type, including: art, history, archaeology, natural history/natural science, science and technology, archival/library material and other.
Almost two-thirds of respondents identified their primary collections as historical. This was followed by art (15%) and then other (11%). This profile can impact some of the results, particularly in standards used.
Figure 30. Budget ranges
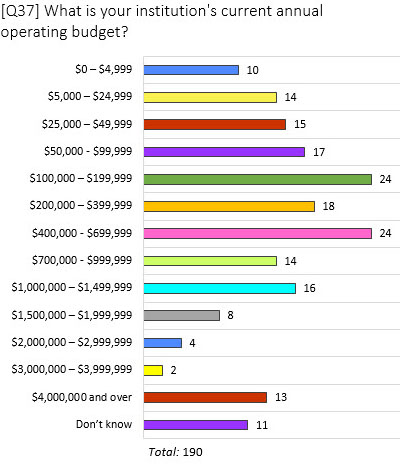
Figure 30. Budget ranges – text version
| Response | Count | Percentage |
|---|---|---|
$0 – $4,999 |
10 |
5% |
$5,000 – $24,999 |
14 |
7% |
$25,000 – $49,999 |
15 |
8% |
$50,000 - $99,999 |
17 |
9% |
$100,000 – $199,999 |
24 |
13% |
$200,000 – $399,999 |
18 |
10% |
$400,000 - $699,999 |
24 |
13% |
$700,000 - $999,999 |
14 |
7% |
$1,000,000 – $1,499,999 |
16 |
8% |
$1,500,000 – $1,999,999 |
8 |
4% |
$2,000,000 – $2,999,999 |
4 |
2% |
$3,000,000 – $3,999,999 |
2 |
1% |
$4,000,000 and over |
13 |
7% |
Don’t know |
11 |
6% |
| Total | 190 | 100% |
Respondents were asked to indicate their organizational budget within a series of 16 budget categories, ranging from a low of $0 to $4999 per year to a high of over $4,000,000 per year. The largest proportions represented were in the $100,000 to $199,000 and $400,000 to $699,000 ranges, with 13% of respondents in each category.
Respondents in the survey represented institutions from every budget category.
Conclusions
Although a high percentage of respondents are using electronic systems to document their collections, there is a lot of room for improvement in terms of standards followed, as well as in digital preservation planning. Systems are older, and roughly one quarter plan on purchasing new systems. Some of the outdated systems that are in use are no longer supported, presenting potential areas of danger for institutions who may have difficulty migrating their data to a new system. Museums using proprietary software should be sure to have a backup of their collections data in a non-proprietary application-independent format.
The findings of this survey will help CHIN establish priorities in developing resources to assist museums in upgrading and improving electronic documentation of their collections.
Appendix A
This is a copy of the survey for reference only.
Collections
1. How many items are in your institution’s collections?
- Less than 1000 objects
- 1000 – 9999 objects
- 10,000 – 49,999 objects
- 50,000 – 149,999 objects
- 150,000 – 349,999 objects
- 350,000 – 699,999 objects
- 700,000 – 1,4999,999 objects
- 1,500,000 – 2,999,999 objects
- 3,000,000 objects or more
- Not applicable
2. Does your institution have digital collection records in an automated collections management system, spreadsheet or other system?
- Yes
- No
If no skip to Question 6
3. What software does your institution use for managing collections?
Product Name:
4. What version of the software does your institution currently use?
5. How long has it been in use? (Check one)
- Less than one year
- 1 – 3 years
- More than 3 years
6. Is your institution planning on acquiring a new collections management system or other software to manage its collections in the next three years?
- Yes
- No
7. How important are each of the following aspects of collections management to your institutions?
| Very important | Somewhat important | Not very important | Not at all important | |
|---|---|---|---|---|
| Managing movement of collections | ||||
| Managing collections documentation and materials | ||||
| Managing intellectual property rights | ||||
| Providing internal access for reuse of content (e.g. images) | ||||
| Providing research access to collections information internally | ||||
| Providing research to collections externally | ||||
| Providing broad public access to collection images | ||||
| Increasing awareness and visibility of current collections |
Others
Please specify:
8a. How many of your institution’s objects have digital records in the following channels?
| Access channel | Number of digital records currently available | Number of objects for which you have one or more digital images | Number of additional objects for which you plan to have digital images made available in the next 2 years |
|---|---|---|---|
| Internal access only | |||
| Institutional website | |||
| Online access through collections management vendor’s site | |||
| Provincial aggregator | |||
| Artefacts Canada | |||
| Social media platforms like Flickr, Wikimedia or Pinterest | |||
| Institutional API (application program interface) |
8b. Please provide any other access channels that are not listed above.
9a. Does your institution currently contribute to Artefacts Canada?
- Yes
- No (Go to Q9b)
9b. Why is your institution not contributing to Artefacts Canada?
- Difficulty exporting data from collections management system
- Artefacts Canada’s contribution process is difficult
- Difficulty in correcting information in Artefacts Canada
- Copyright concerns
- Duplication of effort
- Concern about data quality
- Waiting until digital images are available to share
- Lack of support from institution’s senior management
- Reluctance to share some collections data online
- Other (please specify)
10a. Does your institution have a digital preservation policy and plan in place?
- Yes
- No
10b. What digital preservation resources have guided the policy or plan? (please specify)
Standards
11a. What object classification system does your institution use to manage its collections? Select all that apply.
| Used “as-is” | Used with added/ changed categories or classes | Used with added local terms | Used with other modifications | |
|---|---|---|---|---|
| Parks Canada Classification | ||||
| Chenhall Revised Nomenclature | ||||
| Nomenclature 3.0 or 4.0 | ||||
| Info-Muse Classification System | ||||
| Internally-developed system |
11b. Please provide any additional classification systems that your institution uses to manage its collections that are not listed above.
12. Howdoes your organization standardize the terminology in its object records (e.g. controlled vocabulary or authority lists)?
Note: A controlled vocabulary is an organized arrangement of words and phrases used to index content and/or to retrieve content through browsing or searching.
Authority lists (also called authority files) are lists of terms that can be used by a museum to control the terms or variants that are used in their collections documentation.
| Data Type | Vocabulary Standard (select all that apply) |
|---|---|
| Object Naming (object name, object type) | Parks Canada Classification System Nomenclature 3.0 or 4.0 Revised Nomenclature Getty Art & Architecture Thesaurus (AAT) Other Local vocabulary No vocabulary standard used |
| Geographic Names | NRCAN Geographical Names of Canada Getty Thesaurus of Geographic Names (TGN) Other Local vocabulary No vocabulary standard used |
| Artist/Creator Names | Artists in Canada Getty Union List of Artist Names Other Local vocabulary No vocabulary standard used |
| Materials/Medium/Support Technique |
CHIN Materials/Techniques (Ewing) Getty Art & Architecture Thesaurus (AAT) Other Local vocabulary No vocabulary standard used |
| Culture | Getty Art & Architecture Thesaurus (AAT) Other Local vocabulary No vocabulary standard used |
| Time Periods | Getty Art & Architecture Thesaurus (AAT) Other Local vocabulary No vocabulary standard used |
| Please list any other data types used that are regulated with a controlled vocabulary |
|
13. What are your institution’s anticipated future needs for controlled vocabularies?
14. Data Entry Rules
What content standards (data entry rules) are in use at your institution? (Select all that apply)
| Data Entry Rules | Used “as-is” | Used with adapted local rules | Used with adapted local data fields |
|---|---|---|---|
| CHIN Data Dictionary | |||
| Cataloguing Cultural Objects (CCO) | |||
| Le guide de documentation du Réseau Info-Muse (available in French only) | |||
| Data entry rules dictated by collections management system | |||
| Local data entry rules: Rules to determine how data are entered in fields which dictate the order, syntax and format the museum uses to record data. |
Basic profile information
15. In which province or territory is your institution located?
- Alberta
- British Columbia
- Manitoba
- New Brunswick
- Newfoundland and Labrador
- Northwest Territories
- Nova Scotia
- Nunavut
- Ontario
- Prince Edward Island
- Quebec
- Saskatchewan
- Yukon
16. What type of internet access does your institution have? (Check one)
- No internet access
- Dial-up
- High speed (broadband)
17. How would you classify your institution’s primary collections? (Please check the one phrase that best describes your collections)
- Art
- History
- Archaeology
- Natural History/Natural Science
- Science & Technology
- Other (please specify)
Do you have archival/library material?
18. What is your institution’s current annual operating budget? Please provide your best estimate. (Check one)
- 0 – 4,999
- 5,000 – 24,999
- 25,000 – 49,999
- 50,000 – 99,999
- 100,000 – 199,999
- 200,000 – 399,999
- 400,000 - 699,999
- 700,000 – 999,999
- 1,000,000 – 1,499,999
- 1,500,000 – 1,999,999
- 2,000,000 – 2,999,999
- 3,000,000 – 3,999,999
- 4,000,000 and over
- Don’t know