
Effects on Dynamic Range: An Evaluation of Multi-Exposure Features and Related Variables in Two-Dimensional Image Scanning
Ern Bieman
Disclaimer
The information in this document is based on the current understanding of the issues presented. It does not necessarily apply in all situations, nor do any represented activities ensure complete protection as described. Although reasonable efforts have been made to ensure that the information is accurate and up to date, the publisher, Canadian Heritage Information Network (CHIN), does not provide any guarantee with respect to this information, nor does it assume any liability for any loss, claim or demand arising directly or indirectly from any use of or reliance upon the information. CHIN does not endorse or make any representations about any products, services or materials detailed in this document or on external websites referenced in this document; these products, services or materials are, therefore, used at your own risk.
Table of contents
- List of abbreviations
- Introduction
- Methodology
- Observations
- Conclusion
- Acknowledgements
- Glossary
- Bibliography
- Further reading
List of abbreviations
- CIE
- International Commission on Illumination
- Dmax
- maximum optical density
- Dmin
- minimum optical density
- FADGI
- Federal Agencies Digital Guidelines
Initiative - GIMP
- GNU Image Manipulation Program
- HDR
- high dynamic range
- ISO
- International Standards Organization
- OECF
- opto-electronic conversion function
- ppi
- pixels per inch
- RGB
- red, green, blue
Introduction
The term “dynamic range” refers to the ratio between the darkly shaded (high optical density) and the lightly shaded (low optical density) areas of a transparency. In an image scanner, it refers to the degree to which the device is able to capture and reproduce nuances in transparencies of varying optical densities, such as film, slides or negatives. In its Technical Guidelines for Digitizing Cultural Heritage Materials (PDF format), the Federal Agencies Digital Guidelines Initiative (FADGI) specifies minimum dynamic ranges for the varying levels of image quality, which range from 3.5 for a basic (one star) level of quality to 4.0 for the highest (four star) level of quality. Dynamic ranges approaching 4.0 are often difficult to achieve in many scanners, and thus it is important to understand what techniques can improve dynamic range and to what degree these techniques are successful.
Some image scanners have a multi-exposure feature that, when used with the appropriate software, increases the exposure range when scanning transparencies. This is done by making passes at lower exposure levels to capture nuances in the brighter, near-transparent sections. The scanner then makes additional passes at higher exposure levels to capture nuances in the darker sections. These details are combined to produce a single high dynamic range (HDR) image. This technique is similar to the HDR or “bracketing” function found on modern digital cameras and smartphones. To learn more about this function, consult What is HDR?
Unlike a smartphone, the multi-exposure feature on a scanner takes a significant amount of time to complete subsequent passes, which can slow down workflow.
This publication focusses on how scanning techniques and other variables affect dynamic range. The research involved testing various features, using two types of transparency scanners and two of the most common scanning software applications capable of using the multi-exposure feature. The following questions were asked:
- To what degree does the multi-exposure feature on a scanner improve dynamic range?
- How is dynamic range affected by other common scanning settings?
- Is the additional investment in equipment, software and workflow time worth the effort?
Methodology
The ISO 21550:2004 protocol was followed to measure the dynamic range of two different scanners, using two different image scanning software applications for two different parameters: multi-exposure and infrared dust and scratch removal. In all cases, the dynamic range test target ST-53-1 (a 35 mm film test target consisting of greyscale patches) was used.
The following scanners were tested:
- A flatbed scanner with a backlit lid (hereafter referred to as “the flatbed scanner”)
- A slide and film scanner (hereafter referred to as “the slide scanner”)
The following scanning settings were tested:
- A multi-exposure feature with a “yes” or “no” setting
- An infrared dust and scratch feature with a “yes” or “no” setting
Combined with two commercially available third-party image scanning software applications (hereafter referred to as “scanning software 1” and “scanning software 2”), the above combinations yielded a total of 16 tests, with each test comprising 10 trial scans, as per the ISO 21550:2004 protocol.
A colour profile was set for each scanner when using scanning software 1 to improve the colour accuracy of the scans, as per the FADGI guidelines. No colour profile was set for scanning software 2, as the version at our disposal, priced in a similar range to scanning software 1, did not allow for this function. To learn more about how to set a colour profile, consult How to Scan Reflective Objects Using a Flatbed Scanner.
In addition to the experiment described above, a preliminary test was performed to study the effects on dynamic range when using scanning software 1’s multi-pass feature, which is similar to but not the same as this software’s multi-exposure feature. Finally, a preliminary test was also performed using scanning software 1 without a user-set colour profile, to determine what effect colour profiles have on dynamic range. Findings from these preliminary tests are also discussed herein.
Test protocol
Scanning
For each test, the following protocol was used:
- Set environmental conditions:
- Establish a dust-free environment by cleaning all surfaces and running a high-efficiency particulate air (HEPA) filter in the workspace.
- Maintain room temperature (measured at 23⁰C to 24⁰C).
- Maintain relative humidity (measured at 35% to 40%).
- Prepare the hardware:
- Clean the film tray using a filtered squeeze bulb blower, lint-free cloth and reagent grade isopropyl alcohol.
- Clean the scanner surface (for the flatbed scanner) using a lint-free cloth and reagent grade isopropyl alcohol.
- Prepare the test target:
- Clean the ST-53-1 target using a filtered squeeze bulb blower.
- Load the test target onto the film tray and the tray into the scanner (loading either the tray or the test target first, depending on the scanner type).
- Prepare the software:
- Open the scanning software (scanning software 1 or scanning software 2, respectively).
- Set the multi-exposure feature to “yes” or “no.”
- For scanning software 1: ensure the correct colour profile was set. (Note that a colour profile for both scanners was set in advance using a slide-mounted IT8 chart.)
- Set the infrared feature to “yes” or “no.”
- Turn off all other filters and image modification features.
- Set the scanning resolution. As per ISO 21550:2004, the resolution must be set at the scanner’s maximum optical scanning resolution divided by an integer value. This integer value was selected based on the scanning resolutions available in the scanning software for each scanner:
- For the flatbed scanner, the published optical resolution is 6400 pixels per inch (ppi). Both scanning software applications allowed (among other resolutions) a scanning resolution of 3200 ppi for this device, requiring an integer value of “2,” and thus 3200 ppi was the selected resolution.
- For the slide scanner, the published optical resolution is 7200 ppi. Both scanning software applications allowed (among other resolutions) a scanning resolution of 1800 ppi for this device, requiring an integer value of “4,” and thus 1800 ppi was the selected resolution.
- Set the scanner bit depth to 16 (48 bits across 3 colour channels).
- Set the file output format to TIFF.
- Take a preview scan, then a test scan to ensure the process functions as expected.
- Produce trial scans:
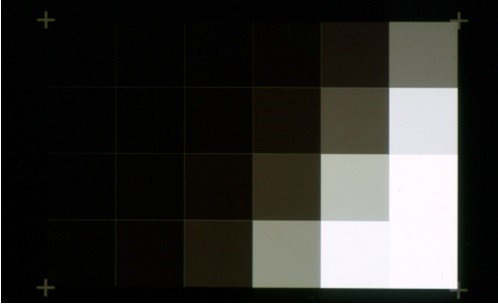
- As per ISO 21550:2004, 10 trials (10 scans) must be taken to determine the dynamic range. To automate this process and to ensure uniformity across tests, version 3.0.42 of a software called “Macro Recorder” was used to record the keystrokes and mousing that was required to perform the scans. The recorded macro was then repeated (or looped) with a 3-minute delay between each playback to produce all 10 trials. An example of a resulting scan is shown in Figure 1, below.
- Neither the scanning device nor the scanning test target were touched between trials or tests. Only the software settings and the scanning software itself were changed, as required.
- Once all tests for a given hardware device were complete, the test target was moved to the new device and tests were repeated for that scanner.
© Government of Canada, Canadian Heritage Information Network. 136181-0001
Figure 1. Example of a scanned test target.
Colour sampling
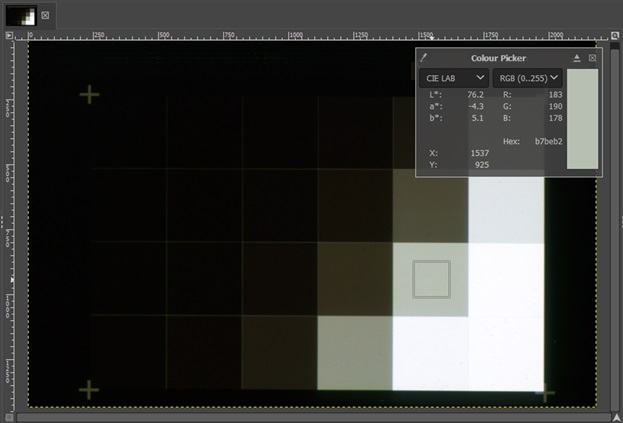
Once all trial scans were completed for all tests, GIMP version 2.10.12 image editing software was used to sample colour information in the scanned images. This was done by opening a sample image file, adjusting zoom settings to fill the viewing area with the test target image and using the GIMP colour sample tool to sample red, green, and blue (RGB) values inherent in the grey tone of each patch (Figure 2). The sample tool size was set to roughly two thirds the area of each sample patch, and samples were taken from the centre of each patch, ensuring that information adjacent to patch edges was not included in the sample. Values from the red, green and blue channels were then copied from the RGB colour information in the colour sampler dialogue box and pasted into an Excel table.
© Government of Canada, Canadian Heritage Information Network. 136181-0002
Figure 2. Colour sampling of a scanned image of the ST-53-1 target using GIMP image editing software.
In total, nearly 13,000 red, green and blue colour values were recorded over the course of this experiment. Macro Recorder was used to automate this process, thereby reducing labour and sampling errors and improving the uniformity of sample values. The populated Excel workbooks were then inspected by various means, including spot checking and comparison of all automatically recorded values to manually recorded values, to ensure colour information had been accurately transcribed from the patches.
Collection of data
Each test consisted of colour information being collected in 10 data tables (that is, one table for each trial [individual scan]). Mean and standard deviation values across all 10 trials were then copied for each patch to a master table, where dynamic range was calculated as per ISO 21550:2004. Dynamic range is discussed in greater detail in the next section, “Interpretation of data.”
| OECF patch (i) | Patch density (d) | Transmission (T) | Mean red channel record (R) | Mean green channel record (G) | Mean blue channel record (B) | Mean luminance channel (visually weighted output signal) (y) | Incremental gain (g) | Visually weighted standard deviation (σ) | Signal-to-noise ratio (S/N) | Dmax | Dmin | Dynamic range |
|---|---|---|---|---|---|---|---|---|---|---|---|---|
| 1 | 0.107 | 0.781628 | 252 | 248 | 254 | 249.57 | - | 0.50 | - | - | - | 3.647 |
| 2 | 0.107 | 0.781628 | 254 | 249 | 254 | 250.42 | - | 0.00 | - | - | 0.107 | - |
| 3 | 0.125 | 0.749894 | 247 | 245 | 253 | 246.01 | 208.24 | 0.36 | 429.52 | - | - | - |
| 4 | 0.217 | 0.606736 | 225 | 226 | 231 | 226.16 | 236.44 | 0.12 | 1186.14 | - | - | - |
| 5 | 0.426 | 0.374973 | 185 | 189 | 179 | 187.43 | 334.21 | 0.00 | - | - | - | - |
| 6 | 0.718 | 0.191426 | 141 | 143 | 127 | 141.42 | 500.92 | 0.00 | - | - | - | - |
| 7 | 1.05 | 0.089125 | 104 | 104 | 90 | 103.00 | 838.59 | 0.12 | 617.96 | - | - | - |
| 8 | 1.418 | 0.038194 | 74 | 70 | 53 | 69.85 | 1431.90 | 0.56 | 97.26 | - | - | - |
| 9 | 1.869 | 0.013521 | 48 | 43 | 26 | 42.55 | 2754.72 | 0.50 | 75.17 | - | - | - |
| 10 | 2.312 | 0.004875 | 29 | 23 | 12 | 23.52 | 3647.73 | 0.36 | 49.26 | - | - | - |
| 11 | 2.496 | 0.003192 | 24 | 19 | 11 | 19.23 | 5787.44 | 0.57 | 32.69 | - | - | - |
| 12 | 2.672 | 0.002128 | 19 | 14 | 7 | 14.43 | 7482.02 | 0.56 | 28.45 | - | - | - |
| 13 | 2.922 | 0.001197 | 13 | 9 | 5 | 9.56 | 8532.28 | 0.54 | 2.39 | - | - | - |
| 14 | 3.16 | 0.000692 | 9 | 6 | 4 | 6.57 | 1865.24 | 0.53 | 2.42 | - | - | - |
| 15 | 3.262 | 0.000547 | 8 | 7 | 4 | 6.73 | 10581.51 | 0.56 | 10.31 | - | - | - |
| 16 | 3.307 | 0.000493 | 7 | 6 | 4 | 6.13 | 13152.58 | 0.32 | 20.03 | - | - | - |
| 17 | 3.422 | 0.000378 | 6 | 5 | 3 | 5.26 | 7120.18 | 0.51 | 5.29 | - | - | - |
| 18 | 3.54 | 0.000288 | 6 | 5 | 3 | 4.96 | 2011.63 | 0.35 | 1.64 | - | - | - |
| 19 | 3.641 | 0.000229 | 5 | 5 | 3 | 4.94 | 9543.57 | 0.37 | 5.88 | - | - | - |
| 20 | 3.69 | 0.000204 | 5 | 5 | 3 | 4.71 | 16349.32 | 0.40 | 8.25 | - | - | - |
| 21 | 3.759 | 0.000174 | 5 | 4 | 3 | 4.36 | 1557.87 | 0.58 | 0.46 | 3.754 | - | - |
| 22 | 3.842 | 0.000144 | 4 | 5 | 3 | 4.49 | 17313.14 | 0.57 | 4.38 | - | - | - |
| 23 | 3.9 | 0.000126 | 4 | 4 | 3 | 4.14 | 9047.45 | 0.46 | 2.46 | - | - | - |
| 24 | 4.028 | 0.000094 | 4 | 5 | 3 | 4.16 | -677.74 | 1.12 | -0.06 | - | - | - |
Interpretation of data
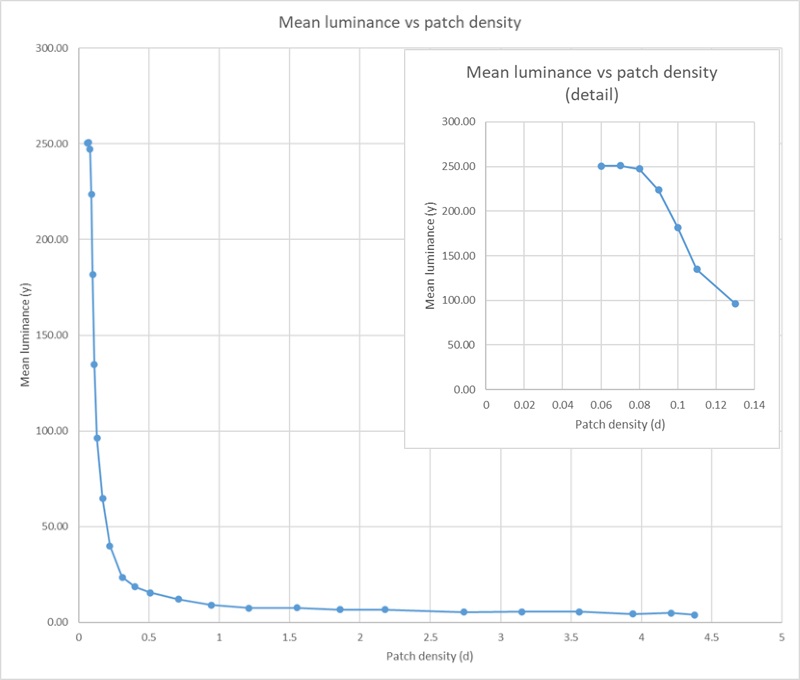
Broadly speaking, dynamic range is the ratio between the lightest optical density (measured as Dmin) and the darkest optical density (measured as Dmax) discernible by a scanner. Mean luminance (y) is used to determine both Dmin and Dmax. As per ISO 21550:2004, mean luminance is calculated as a function of the recorded red, green and blue values for each greyscale patch, averaged across all 10 trial scans, as they are perceived by the human eye. A graph is then used to map mean luminance on the y axis against patch density (opacity of each patch in the test target) on the x axis, as shown in Figure 3. The result is a line with a negative slope; as the optic density of a patch increases (becomes more opaque) mean luminance decreases (the patch appears darker in the image produced by the scanner). Dmin is identified as the patch density at the upper left end of the line (lightest end) where it shows clipping (that is, a deviation from the line’s linear trajectory). For instance, the line would be deemed to be clipped if its slope suddenly flattened, meaning that recorded luminance is not reactive to decreasingly dense patches (lighter patches that do not show up as light as they should in the scans).
© Government of Canada, Canadian Heritage Information Network. 136181-0004
Figure 3. Example of mean luminance values mapped against patch densities. Note the clipping at the top left end of line (inset).
Description
Chart showing the relationship between mean luminance (y) on the vertical axis and patch density (d) on the horizontal axis. Values for both these metrics start at zero in the lower left corner of the chart and extend to 300 (for mean luminance) and 5 (for patch density). A line graph showing the relationship approximates a hyperbolic curve on the chart, with the line beginning in the top left (patch density = 0.06, mean luminance = 250) and slopes steeply downwards before flattening out (around patch density = 0.5, mean luminance = 20) and running near horizontally to a patch density of approximately 4.4. An inset in the top right corner of the chart shows the detail of the chart for low patch densities. In this section, mean luminance does not change (flattens the curve out at around 250) for the lowest three patch density values. The flattened curve in this inset demonstrates the “clipping” effect discussed in this publication.
In some tests, clipping of mean luminance was not evident in even the lightest of test patches; the upper left end of the line did not deviate from the line’s overall trajectory. In such cases, it is suspected that a test target with a wider dynamic range (ST-53-2, which is currently not available) would be necessary to determine Dmin. Thus, for practical purposes, Dmin was defined in such instances as the density of the lightest test patch on the ST-53-1 target.
By contrast, Dmax is limited by random noise, which comes from random background light perceived by the scanner that is not attributable to the test patches. As the test patches become darker, the image signal, or the imaging information that is directly attributed to the test patches in the original test target, becomes weaker, which means that there is less light information relative to that noise. As test patches become darker still, the noise can be greater than the signal. Thus, even if the mean luminance curve, made up of an average of all 10 trial scans, continues its trajectory, random noise can obfuscate the recorded luminance information of a darker patch in any one scan. Dmax is therefore defined as the optical density of a patch or patches at which the image noise surpasses the signal, that is, where the signal-to-noise ratio is one. Refer to ISO 21550:2004 for detailed calculations. All tests resulted in a point where Dmax was identifiable using this definition.
Observations
The following table summarizes the dynamic range data calculated for each combination of scanner, software and settings tested.
| Test | Scanner used | Scanning software used | Use of multi-exposure | Use of infrared scanning | Dynamic range |
|---|---|---|---|---|---|
| 1 | Flatbed | 1 | No | No | 3.03 |
| 2 | Flatbed | 1 | No | Yes | 3.65 |
| 3 | Flatbed | 1 | Yes | No | 3.42 |
| 4 | Flatbed | 1 | Yes | Yes | 3.88 |
| 5 | Flatbed | 2 | No | No | 3.57 |
| 6 | Flatbed | 2 | No | Yes | 3.47 |
| 7 | Flatbed | 2 | Yes | No | 3.65 |
| 8 | Flatbed | 2 | Yes | Yes | 3.65 |
| 9 | Slide | 1 | No | No | 3.16 |
| 10 | Slide | 1 | No | Yes | 3.16 |
| 11 | Slide | 1 | Yes | No | 3.53 |
| 12 | Slide | 1 | Yes | Yes | 3.74 |
| 13 | Slide | 2 | No | No | 3.29 |
| 14 | Slide | 2 | No | Yes | 3.27 |
| 15 | Slide | 2 | Yes | No | 3.31 |
| 16 | Slide | 2 | Yes | Yes | 3.58 |
Discussion
The following subsections discuss findings for the various criteria tested.
Observed effects of multi-exposure scanning on dynamic range
Dynamic range was observed to change as follows when comparing tests that used the multi-exposure feature to those that did not.
| Average dynamic range using multi- exposure feature | 3.60 |
|---|---|
| Average dynamic range without multi- exposure feature | 3.33 |
| Average change to dynamic range | 0.27 |
On average, dynamic range increased by 0.27 when a multi-exposure feature was used. This finding is not surprising, as the feature has been widely adopted in scanning and digital photography. Moreover, multi-exposure scanning increased dynamic range regardless of the hardware, software or infrared settings used.
Observed effects of infrared scanning on dynamic range
Dynamic range was observed to change as follows when comparing tests that used the infrared scanning feature to those that did not.
| Average dynamic range using infrared feature | 3.55 |
|---|---|
| Average dynamic range without infrared feature | 3.37 |
| Average change to dynamic range | 0.18 |
Dynamic range increased by an average of 0.18 when using infrared scanning. Additionally, when infrared scanning was combined with multi-exposure scanning (as opposed to using neither feature), the average dynamic range improved from 3.26 to 3.71, a 0.45 increase. These improvements were found to result from a reduction in noise, rather than a significant increase in signal. This is understandable given that infrared scanning works by “flattening” image information through extrapolation from surrounding pixels. While infrared technology appears to enhance dynamic range by reducing noise, it remains unclear how it affects other metrics, such as spatial resolution. Until this is better understood, it is recommended that for any image scanned using infrared, a second version be scanned without this feature.
Observations of other preliminary tests
In addition to measuring the effects of multi-exposure and infrared scanning on dynamic range, some preliminary tests were run to explore the effects of multi-pass scanning and the use of colour profiles.
Multi-pass scanning is simply the process of forming a composite image by taking multiple scans of an image, all at the same level of exposure. The software does this by analyzing the scans and, if some contain artifacts, it will remove them by taking image information from the scans that contain no artifacts. This is similar to image stacking in astrophotography. It was hypothesized that the removal of artifacts would reduce image noise, as the multiple passes are recorded by the software as a single scan, and thereby improve Dmax. However, the findings did not support this. These results are inconclusive, as the test did not cover a range of hardware, software or various scanning settings.
A final, limited test investigated the effect of colour profiles on dynamic range. Colour profiles provide a mapping from colour information registered by a scanner to anticipated colour information. Using profiles improves a scanner’s colour accuracy, which is measured as the average colour distance (mean, or average Delta E) between anticipated and actual colour values. No significant effect on dynamic range was detected when alternating the use of colour profiles, but further investigation is required.
Conclusion
Multi-exposure scanning increases dynamic range, often by a full level of quality specified by FADGI’s technical guidelines. Infrared scanning, which is meant for the removal of artifacts such as dust and dirt, also appears to improve dynamic range by reducing noise levels, although the effects of infrared scanning on other metrics, such as spatial resolution, have yet to be quantified. It is suspected that infrared scanning may adversely affect spatial resolution, and for that reason, any scan with infrared should be followed by a scan without it. Further research is necessary to study the effects of multi-exposure, infrared and multi-pass scanning on spatial resolution.
Using both infrared and multi-exposure scanning increased workflow time between 30 seconds and 1 minute per trial scan, although this would obviously vary with the equipment, scanning resolution and size of the scanning area. Given the improvement in dynamic range, both multi-exposure scanning and infrared scanning are likely to be justified in most workflows.
Acknowledgements
The author would like to thank the following people for their contributions to this publication.
- Ember Lundgren, Royal BC Museum and Archives
- Cassandra Tavukciyan, Canadian War Museum
- Chloé Lucas, Chloé Lucas Conservation
- Bruce Covington, Document Imaging Solutions Center, Public Services and Procurement Canada
Glossary
- artifact
- Any element, such as dust, dirt, stray light or imaging noise, found in a scanned image. Also called “image artifact.”
- CIE2000
- The most recent formula developed by the International Commission on Illumination to quantify the difference between two colours.
- Delta E
- The difference (referred to as “distance”) between two colours, as determined by CIE2000.
- Dmax
- A numeric value expressing, in the context of this publication, a scanner’s ability to detect image information in the darkest sections of an image.
- Dmin
- A numeric value expressing, in the context of this publication, a scanner’s ability to detect image information in the lightest sections of an image.
- dynamic range
- The degree to which, in the context of this publication, a scanning device is able to capture and reproduce nuances in transparencies of varying optical densities, such as film, slides or negatives. Quantitatively, dynamic range is the difference between Dmax and Dmin.
- effective spatial resolution
- The minimum spatial resolution (measured in ppi) required to convey the smallest detail discernible in images produced by a given imaging system.
- FADGI
- An American group dedicated to creating and promoting best practices and standards for digitization.
- IT8
- A set of American National Standard Institute standards for colour communications and control specifications.
- mean Delta E
- The average colour distance between known values of several colour patches in a colour chart and corresponding patches in a scanned version of that chart. The result determines colour accuracy of the scanning system.
- multi-exposure scanning
- A process whereby an image scanner takes multiple scans of an image at different light exposures to produce a composite image in which information from the brightest exposures is used to define details in the darker section of the original image, and information from the darkest exposures is used to define details in the lightest section of the image.
- multi-pass scanning
- A process whereby an image scanner takes multiple scans of an image, all at the same level of exposure. The scanning software then removes any artifacts contained in the various scans by using image information from scans with no artifacts to provide a composite image with a better signal-to-noise ratio.
- noise
- In the context of this publication, any artifact in an image that is not consistently reproduced on subsequent scans by the same scanning system under identical conditions. Consult ISO 21550:2004 for a mathematical definition. Also called “image noise.”
- optical density
- The degree to which a medium obscures transmitted light. For example, darker, more opaque sections of an image on a transparency are said to have a higher optical density, whereas lighter, more translucent sections have a lower optical density.
- signal
- In the context of this publication, imaging information that is directly attributed to properties of the original subject (that is, the test patches in the imaging target). Consult ISO 21550:2004 for a mathematical definition.
- signal-to-noise ratio
- The ratio of noise relative to the desired signal. In the case of a flatbed scanner, this manifests itself as inconsistent results on subsequent scans of the same material.
- spatial resolution
- Measured in ppi, this metric determines the amount of detail in both the vertical and horizontal dimensions of a digital image.
Bibliography
Bieman, E. How to Scan Reflective Objects Using a Flatbed Scanner. Ottawa, ON: Canadian Heritage Information Network, 2023.
Federal Agencies Digital Guidelines Initiative. Technical Guidelines for Digitizing Cultural Heritage Materials (PDF format), 3rd ed. Washington, D.C.: Federal Agencies Digital Guidelines Initiative, May 2023.
International Organization for Standardization. ISO 21550:2004, Photography — Electronic scanners for photographic images — Dynamic range measurements, 2004.
Further reading
Adobe. What is HDR?, 2024.
Affinity.help. About astrophotography stacking, [n.d.]
Bieman, E. How to Scan Photographic Transparencies and Photographic Negatives – Supplement. Ottawa, ON: Canadian Heritage Information Network, 2023.
Wueller, D. “Measuring Scanner Dynamic Range” (PDF format). Paper presented at the PICS 2002: Image Processing, Image Quality, Image Capture, Systems Conference. Cologne, Germany: Society for Imaging Science and Technology, 2002.
© Government of Canada, Canadian Heritage Information Network, 2025
Published by:
Canadian Heritage Information Network
Department of Canadian Heritage
1030 Innes Road
Ottawa ON K1B 4S7
Canada
Cat. No.: CH57-4/84-2025E-PDF
ISBN 978-0-660-77287-5