
Express Entry Year-End Report 2019
Express Entry Year-End Report 2019 (PDF, 1.28 MB)
Overview of Express Entry
Launched in January 2015, Express Entry is Canada’s flagship application management system for the Federal Skilled Worker Program, the Federal Skilled Trades Program, Canadian Experience Class, and a portion of the Provincial Nominee Program. As described below, Express Entry provides the Government of Canada with the means to manage the intake of applications for permanent residence under these key economic immigration programs, while also facilitating the selection of individuals who are most likely to succeed in Canada.
As with previous reports, the Express Entry Year-End Report 2019 provides an overview of Express Entry and presents data from across all stages of the Express Entry continuum, including profile submissions, invitations to apply, applications, processing times, and admissions. Throughout the report, historical and gender-disaggregated dataFootnote i is presented alongside the 2019 figures to provide additional context.
How Express Entry works
The Express Entry system manages applications for permanent residence in two steps. First, individuals express their interest in immigrating to Canada by completing an online profile, which is screened electronically to determine if the individual is eligible for the Federal Skilled Worker Program, the Federal Skilled Trades Program, or the Canadian Experience Class. Individuals who meet the eligibility criteria for at least one of these programsFootnote ii are placed in the Express Entry pool and assigned a Comprehensive Ranking System (CRS) score, which is determined by comparing information in their profile to a transparent scoring criteria. Candidates in the pool are ranked against one another according to their CRS score.
Second, Ministerial Instructions are regularly published specifying the number of invitations to apply (ITA) for permanent residence that will be sent to candidates in the Express Entry pool on a specific date. The Ministerial Instruction also specifies the economic program(s) for which the Express Entry ITA round will apply. For each round, invitations are issued to candidates, in descending CRS score rank order, until the maximum number of invitations specified in the associated Ministerial Instruction is met. The profiles of candidates who do not receive an ITA, or decline an ITA, remain in the pool for up to 12 months.
Candidates that receive an ITA have 60 days to either decline the invitation or submit an online application for permanent residence to Immigration, Refugees and Citizenship Canada. Candidates who receive an ITA but take no action within the 60-day period are withdrawn from the pool. Upon receipt, an immigration officer assesses the application to verify the applicant’s CRS score, program eligibility, and admissibility. If the immigration officer is satisfied that all conditions have been met and that the applicants are not inadmissible, they are approved for a permanent resident visa. Applicants and their accompanying family members become permanent residents when they are admitted to Canada. The processing standard for applications sourced via Express Entry is six months for 80% of cases. Processing time is measured from the day a complete application is received until a final decision is made by an immigration officer.
The CRS is the backbone of the Express Entry application management system. A CRS score comprises two components: core points and additional points. A candidate without an accompanying spouseFootnote iii can receive a maximum of 600 points under the core component, depending on the person’s human capital characteristics (e.g., age, education, official language proficiency, work experience). These factors help predict candidates’ potential for success in the Canadian labour market.
Under the additional points component, a candidate can receive points for having a provincial/territorial nomination (600 points), arranged employment (50 or 200 points), Canadian post-secondary education credentials (15 or 30 points), French language proficiency (15 or 30 points), or a sibling in Canada (15 points). With the exception of points awarded for a provincial/territorial nomination, which is high enough to virtually guarantee a candidate an ITA in the following round that includes the Provincial Nominee Program, additional points increase the probability that a given candidate will receive an ITA without guaranteeing that outcome.
Candidates in the Express Entry pool can, and in some cases must, update their profile to reflect any change in circumstances, and this action can trigger a recalculation of the CRS score. Some updates are automatically triggered when milestones, such as a birthday or expiry of language test results, are reached. Accordingly, candidates can take steps to increase their CRS score, thereby increasing the probability they will be selected to receive an ITA. For example, a candidate could increase their proficiency in an official language, secure arranged employment, or provide an educational credential assessment for education acquired abroad.
The maximum CRS score a candidate can achieve is capped at 1,200 points—600 points under the core component and 600 points under the additional points component. All information provided at the profile stage for the purpose of generating a CRS score is self-reported and must be supported with appropriate documentation from the candidate at the application stage or the application could be refused.
Who submitted an Express Entry profile?
In 2019, 332,331 Express Entry profiles were submitted through the system, which represents an increase of nearly 20% from 2018 and more than 30% since 2017 (Figure 1). Among profiles submitted in 2019, 72% were eligible for at least one of the Federal Skilled Worker Program, the Federal Skilled Trades Program, or the Canadian Experience Class, which is about the same as in 2018 (70%), and slightly higher than in 2017 (65%).
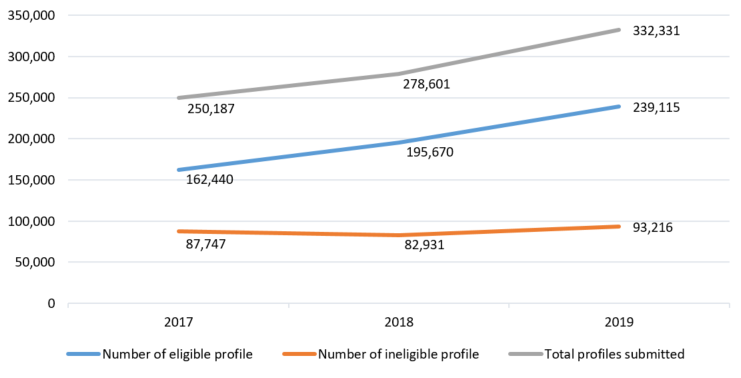
Figure 1: Profile submissions, 2019
In 2017, 250,187 total Express Entry profiles were submitted, including 162,440 eligible profiles and 87,747 ineligible profiles.
In 2018, 278,601 total Express Entry profiles were submitted, including 195,670 eligible profiles and 82,931 ineligible profiles.
In 2019, 332,331 total Express Entry profiles were submitted, including 239,115 eligible profiles and 93,216 ineligible profiles.
As displayed in Table 1, in 2019, more profiles were submitted by men (194,941) than women (137,287). Women submitted a slightly higher proportion of total profiles in 2019 (41%), continuing an upwards trend from 2018 (39%) and 2017 (36%). A higher proportion of profiles submitted in 2019 by women were eligible for at least one program (76%) compared to those submitted by men (69%), as was the case in 2018 (74% vs. 68%) and 2017 (70% vs. 62%).
Across all three years, few profiles were submitted by people with unspecified gender (96 profiles over the three-year period). In 2019, 32 profiles were submitted by people who indicated another gender. Because of this small count, the data presented below are not broken down by gender categorized as “unspecified” or “another.”
| Profile outcome | 2017 number | 2017 % | 2018 number | 2018 % | 2019 number | 2019 % |
|---|---|---|---|---|---|---|
| Men | ||||||
| Eligible | 99,850 | 62% | 114,710 | 68% | 135,369 | 69% |
| Ineligible | 60,732 | 38% | 54,401 | 32% | 59,572 | 31% |
| Total | 160,582 | 100% | 169,111 | 100% | 194,941 | 100% |
| Women | ||||||
| Eligible | 62,566 | 70% | 80,939 | 74% | 103,699 | 76% |
| Ineligible | 26,982 | 30% | 28,487 | 26% | 33,588 | 24% |
| Total | 89,548 | 100% | 109,426 | 100% | 137,287 | 100% |
| Total | ||||||
| Eligible | 162,440 | 65% | 195,670 | 70% | 239,115 | 72% |
| Ineligible | 87,747 | 35% | 82,931 | 30% | 93,216 | 28% |
| Total | 250,187 | 100% | 278,601 | 100% | 332,331 | 100% |
Source: MBR_FACT_EE_MAIN as of January 29, 2020
Data is operational and as such should be considered preliminary and subject to change.
Among individuals who submitted profiles that were eligible in 2019, a majority (69%) did not claim any type of additional points at the time of submission (Table 2).Footnote ivFootnote v Similar to 2018, Education in Canada (13%) and Siblings in Canada (12%) were the most frequent type of additional point type claimed at this stage in 2019. The sharp increase in the proportion of candidates in the Express Entry pool who claimed additional points for having a sibling in Canada (from 7% in 2017 to 12% in 2018) and for being proficient in FrenchFootnote vi (from 2% in 2017 to 4% in 2018) is, at least in part, a reflection of when these point types were introduced, i.e. in June 2017.
| Additional point type | 2017 number | 2017 % | 2018 number | 2018 % | 2019 number | 2019 % |
|---|---|---|---|---|---|---|
| No additional points | 119,192 | 73% | 138,143 | 71% | 164,740 | 69% |
| Arranged employment | 9,173 | 6% | 9,694 | 5% | 12,841 | 5% |
| Education in Canada | 23,517 | 14% | 22,453 | 11% | 30,055 | 13% |
| French-language proficiency | 2,437 | 2% | 7,180 | 4% | 9,356 | 4% |
| Siblings | 11,563 | 7% | 23,590 | 12% | 29,670 | 12% |
| Total | 162,441 | 195,670 | 239,115 | 100% |
Source: MBR_FACT_EE_MAIN as of January 29, 2020
Data is operational and as such should be considered preliminary and subject to change.
Please note that many candidates qualify for multiple additional point types. Therefore, the sum of eligible profiles in each multiple point type may exceed the total number of eligible profiles
In 2019, a higher proportion of men than women claimed no additional points at the time of submitting an eligible profile, although this gender difference has diminished somewhat since 2017 (Table 3).Footnote vii
| Gender | 2017 number | 2017 % | 2018 number | 2018 % | 2019 number | 2019 % |
|---|---|---|---|---|---|---|
| Men | 73,143 | 61% | 81,007 | 59% | 92,671 | 56% |
| Women | 46,033 | 39% | 57,125 | 41% | 72,041 | 44% |
| Total | 119,192 | 100% | 138,143 | 100% | 164,740 | 100% |
Source: MBR_FACT_EE_MAIN as of January 29, 2020
Data is operational and as such should be considered preliminary and subject to change.
Education in Canada and Siblings in Canada were the most common additional point type claimed by both men and women in 2019 (Table 4-7).Footnote viii Although men and women tended to claim each additional point type in relative proportion to their overall representation among those with eligible profiles, a considerably higher proportion of men (71%) than women (29%) claimed additional points for having arranged employment.
| Gender | 2017 number | 2017 % | 2018 number | 2018 % | 2019 number | 2019 % |
|---|---|---|---|---|---|---|
| Men | 6,595 | 72% | 6,998 | 72% | 9,112 | 71% |
| Women | 2,577 | 28% | 2,696 | 28% | 3,726 | 29% |
| Total | 9,173 | 100% | 9,694 | 100% | 12,841 | 100% |
Source: MBR_FACT_EE_MAIN as of January 29, 2020
Data is operational and as such should be considered preliminary and subject to change.
| Gender | 2017 number | 2017 % | 2018 number | 2018 % | 2019 number | 2019 % |
|---|---|---|---|---|---|---|
| Men | 14,386 | 61% | 13,194 | 59% | 17,304 | 58% |
| Women | 9,126 | 39% | 9,255 | 41% | 12,743 | 42% |
| Total | 23,517 | 100% | 22,453 | 100% | 30,055 | 100% |
Source: MBR_FACT_EE_MAIN as of January 29, 2020
Data is operational and as such should be considered preliminary and subject to change.
| Gender | 2017 number | 2017 % | 2018 number | 2018 % | 2019 number | 2019 % |
|---|---|---|---|---|---|---|
| Men | 1,355 | 56% | 3,990 | 56% | 4,944 | 53% |
| Women | 1,082 | 44% | 3,189 | 44% | 4,409 | 47% |
| Total | 2,437 | 100% | 7,180 | 100% | 9,356 | 100% |
Source: MBR_FACT_EE_MAIN as of January 29, 2020
Data is operational and as such should be considered preliminary and subject to change.
| Gender | 2017 number | 2017 % | 2018 number | 2018 % | 2019 number | 2019 % |
|---|---|---|---|---|---|---|
| Men | 6,501 | 56% | 12,670 | 54% | 15,681 | 53% |
| Women | 5,058 | 44% | 10,915 | 46% | 13,981 | 47% |
| Total | 11,563 | 100% | 23,590 | 100% | 29,670 | 100% |
Source: MBR_FACT_EE_MAIN as of January 29, 2020
Data is operational and as such should be considered preliminary and subject to change.
Who got into the Express Entry pool?
The distributions of CRS scores for candidate profiles in the pool in January of 2018, 2019, and 2020 are presented in Table 8. In each year, the CRS scores were concentrated in the 350-449 range. Compared to earlier years, when the size of the Express Entry pool was considerably smaller, there was a notable increase in the proportion of eligible candidate profiles in the 450-499 range in 2020 (from 2% in January 2018 to 14% in January 2020). This finding should be interpreted with caution because the data reflects the CRS score distribution in the pool later in January than in previous years (i.e. January 29 vs. January 3).Footnote ix It is important to note that the Express Entry pool is dynamic, and that the distribution of CRS scores changes every time an eligible profile is submitted, updated, or expires.
| CRS Score Range | number of Candidates on January 3, 2018 | number of Candidates on January 3, 2019 | number of Candidates on January 29, 2020 |
|---|---|---|---|
| >1000 | 36 | 35 | 117 |
| 950 - 999 | 76 | 85 | 71 |
| 900 - 949 | 69 | 83 | 44 |
| 850 - 899 | 17 | 20 | 11 |
| 800 - 849 | 1 | 8 | 4 |
| 750 - 799 | 1 | 10 | 0 |
| 700 - 749 | 3 | 4 | 1 |
| 650 - 699 | 0 | 2 | 0 |
| 600 - 649 | 0 | 2 | 2 |
| 550 - 599 | 10 | 9 | 11 |
| 500 - 549 | 97 | 101 | 119 |
| 450 - 499 | 1,177 | 1,684 | 20,326 |
| 400 - 449 | 20,404 | 31,181 | 41,128 |
| 350 - 399 | 28,983 | 37,547 | 49,048 |
| 300 - 349 | 17,385 | 21,110 | 26,896 |
| 250 - 299 | 1,976 | 2,302 | 2,755 |
| 200 - 249 | 466 | 496 | 466 |
| 150 - 199 | 279 | 190 | 213 |
| 100 - 149 | 84 | 63 | 58 |
| <100 | 23 | 18 | 11 |
| Total | 71,087 | 94,950 | 141,281 |
Source: MBR_FACT_EE_MAIN as of January 29, 2020
Data is operational and as such should be considered preliminary and subject to change.
Who did we invite to apply for permanent residence through Express Entry?
As displayed in Table 9, IRCC held 26 ITA rounds and issued 85,300 invitations in 2019, a slight decrease from the 89,800 invitations issued in 2018.Footnote x In 2019, a little less than half (45%) of the total invitations issued were under the Federal Skilled Worker Program, a decrease from 2018 (53%). About one third of candidates (36%) were invited under the Canadian Experience Class in 2019. The proportion of invitations issued under the Provincial Nomination Program increased from 12% in 2018 to 18% in 2019.
For the ITA rounds on May 15, 2019, and October 16, 2019, only candidates eligible for the Federal Skilled Trades Program were invited to apply for permanent residence. These program specific ITA rounds were conducted in line with the associated Ministerial Instructions. Excluding these two ITA rounds, the CRS cut-off score ranged from 438 to 475 in 2019 (median = 461), compared to from 439 to 456 for non-program specific ITA rounds in 2018 (median = 442). The rise in the median CRS cut off score suggests that the Express Entry pool became more competitive in 2019, including as a result of growth in the pool size, as well as the increased number of candidates who were selected through the Provincial Nomination Program, each of whom were assigned 600 points for the provincial or territorial nomination.
| Invitation to apply date | CRS cut-off | Canadian Experience Class | Provincial/Territorial Nominee | Federal Skilled Worker | Skilled Trades | Total |
|---|---|---|---|---|---|---|
| 2019-01-10 | 449 | 1,265 | 452 | 2,183 | 0 | 3,900 |
| 2019-01-23 | 443 | 1,307 | 318 | 2,275 | 0 | 3,900 |
| 2019-01-30 | 438 | 1,031 | 260 | 2,059 | 0 | 3,350 |
| 2019-02-20 | 457 | 1,149 | 548 | 1,653 | 0 | 3,350 |
| 2019-03-06 | 454 | 1,210 | 435 | 1,705 | 0 | 3,350 |
| 2019-03-20 | 452 | 1,009 | 447 | 1,894 | 0 | 3,350 |
| 2019-04-03 | 451 | 1,292 | 380 | 1,678 | 0 | 3,350 |
| 2019-04-17 | 451 | 1,160 | 417 | 1,773 | 0 | 3,350 |
| 2019-05-01 | 450 | 1,249 | 401 | 1,700 | 0 | 3,350 |
| 2019-05-15 | *332 | 0 | 0 | 0 | 500 | 500 |
| 2019-05-29 | 470 | 1,171 | 887 | 1,292 | 0 | 3,350 |
| 2019-06-12 | 465 | 1,320 | 407 | 1,623 | 0 | 3,350 |
| 2019-06-26 | 462 | 1,220 | 446 | 1,684 | 0 | 3,350 |
| 2019-07-10 | 460 | 1,515 | 434 | 1,651 | 0 | 3,600 |
| 2019-07-24 | 459 | 1,314 | 438 | 1,848 | 0 | 3,600 |
| 2019-08-12 | 466 | 1,410 | 752 | 1,438 | 0 | 3,600 |
| 2019-08-20 | 456 | 1,470 | 276 | 1,854 | 0 | 3,600 |
| 2019-09-04 | 463 | 1,457 | 630 | 1,513 | 0 | 3,600 |
| 2019-09-18 | 462 | 1,356 | 745 | 1,499 | 0 | 3,600 |
| 2019-10-02 | 464 | 1,540 | 933 | 1,427 | 0 | 3,900 |
| 2019-10-16 | *357 | 0 | 0 | 0 | 500 | 500 |
| 2019-10-30 | 475 | 1,326 | 1,495 | 1,079 | 0 | 3,900 |
| 2019-11-13 | 472 | 1,340 | 953 | 1,307 | 0 | 3,600 |
| 2019-11-27 | 471 | 1,162 | 1,120 | 1,318 | 0 | 3,600 |
| 2019-12-11 | 472 | 1,170 | 1,033 | 997 | 0 | 3,200 |
| 2019-12-19 | 469 | 1,120 | 721 | 1,359 | 0 | 3,200 |
| Total | 30,563 | 14,928 | 38,809 | 1,000 | 85,300 |
Source: MBR_FACT_EE_ITA as of January 29, 2020
Data is operational and as such should be considered preliminary and subject to change.
* program-specific ITA round
Overall, as displayed in Tables 10 and 11, in 2019, men received more than half of invitations issued (58%). This aligns with the higher representation of men in the Express Entry pool (57%; figures from Table 1). The invitation by program pattern was similar for men and women: both genders received invitations under Federal Skilled Worker Program most often and under Federal Skilled Trades Program least often. The number of women invited to apply to the Provincial Nominee Program and the Federal Skilled Trades Program nearly doubled from 2017 to 2019; the number of men invited to apply to the Provincial Nominee Program increased by half. From 2017 to 2019, 15 invitations were issued to candidates of an unspecified gender and one invitation was issued to a candidate with another gender. Because of these small counts, the data presented below is not broken down by gender categorized as “unspecified” or “another.”
| Program | 2017 number | 2017 % | 2018 number | 2018 % | 2019 number | 2019 % |
|---|---|---|---|---|---|---|
| Federal Skilled Worker | 23,787 | 45% | 26,231 | 50% | 21,150 | 43% |
| Canadian Experience Class | 22,184 | 42% | 18,583 | 35% | 18,184 | 37% |
| Federal Skilled Trades | 777 | 1% | 729 | 1% | 765 | 2% |
| Provincial/Territorial Nominee | 5,716 | 11% | 6,931 | 13% | 8,964 | 18% |
| Total | 52,464 | 100% | 52,474 | 100% | 49,063 | 100% |
Source: MBR_FACT_EE_ITA as of January 29, 2020
Data is operational and as such should be considered preliminary and subject to change.
| Program | 2017 number | 2017 % | 2018 number | 2018 % | 2019 number | 2019 % |
|---|---|---|---|---|---|---|
| Federal Skilled Worker | 17,576 | 52% | 21,287 | 57% | 17,655 | 49% |
| Canadian Experience Class | 12,834 | 38% | 11,987 | 32% | 12,377 | 34% |
| Federal Skilled Trades | 129 | 0% | 175 | 0% | 235 | 1% |
| Provincial/Territorial Nominee | 3,017 | 9% | 3,871 | 10% | 5,962 | 16% |
| Total | 33,556 | 100% | 37,320 | 100% | 36,229 | 100% |
Source: MBR_FACT_EE_ITA as of January 29, 2020
Data is operational and as such should be considered preliminary and subject to change.
Invitations issued by socio-demographic characteristics remained relatively stable from 2017, to 2018, to 2019 (Tables 12 to 15). Across these years, more than half of invitations were issued to candidates between the age of 20 and 29, which is the age category associated with the highest number of points under the CRS. In all years, a large majority of invitations (more than 90%) were issued to candidates that had a post-secondary credential of three years or longer, a Master’s degree or entry-to-practice professional degree. In every year since 2017, at least 40% of invited candidates have had one year or more of Canadian work experience. With respect to foreign work experience, there has been a similar pattern in each year since 2017, with nearly a quarter of invited candidates (21% to 26%) reporting less than one year of foreign work experience, and more than a third (35% to 40%) reporting five or more years of such experience—smaller proportions of invited candidates had one, two, three or four years of foreign work experience.
| Age category | 2017 number | 2017 % | 2018 number | 2018 % | 2019 number | 2019 % |
|---|---|---|---|---|---|---|
| <20 | 11 | 0% | 10 | 0% | 4 | 0% |
| 20-29 | 44,809 | 52% | 46,028 | 51% | 47,165 | 55% |
| 30-34 | 27,214 | 32% | 30,281 | 34% | 26,692 | 31% |
| 35-39 | 10,556 | 12% | 10,045 | 11% | 8,078 | 9% |
| 40-44 | 2,341 | 3% | 2,246 | 3% | 2,260 | 3% |
| 45+ | 1,091 | 1% | 1,188 | 1% | 1,100 | 1% |
| Total | 86,022 | 100% | 89,800 | 100% | 85,300 | 100% |
Source: MBR_FACT_EE_ITA as of January 29, 2020
Data is operational and as such should be considered preliminary and subject to change.
| Education level | 2017 number | 2017 % | 2018 number | 2018 % | 2019 number | 2019 % |
|---|---|---|---|---|---|---|
| High school or less | 1,247 | 1% | 1,441 | 2% | 1,158 | 1% |
| One or two year post-secondary credential | 4,851 | 6% | 4,291 | 5% | 4,395 | 5% |
| Post-secondary credential of three years or longer | 40,459 | 47% | 37,635 | 42% | 35,780 | 42% |
| Master's Degree or entry-to-practice professional degree | 36,270 | 42% | 43,008 | 48% | 40,673 | 48% |
| PhD | 3,195 | 4% | 3,425 | 4% | 3,294 | 4% |
| Total | 86,022 | 100% | 89,800 | 100% | 85,300 | 100% |
Source: MBR_FACT_EE_ITA as of January 29, 2020
Data is operational and as such should be considered preliminary and subject to change.
| Experience level | 2017 number | 2017 % | 2018 number | 2018 % | 2019 number | 2019 % |
|---|---|---|---|---|---|---|
| No work experience or less than one year | 46,380 | 54% | 53,460 | 60% | 47,733 | 56% |
| 1 year | 24,793 | 29% | 24,964 | 28% | 26,045 | 31% |
| 2 years | 10,655 | 12% | 8,456 | 9% | 8,951 | 10% |
| 3 years | 2,806 | 3% | 1,790 | 2% | 1,618 | 2% |
| 4 years | 745 | 1% | 613 | 1% | 504 | 1% |
| 5 years or more | 643 | 1% | 517 | 1% | 440 | 1% |
| Total | 86,022 | 100% | 89,800 | 100% | 85,300 | 100% |
Source: MBR_FACT_EE_ITA as of January 29, 2020
Data is operational and as such should be considered preliminary and subject to change.
| Experience level | 2017 number | 2017 % | 2018 number | 2018 % | 2019 number | 2019 % |
|---|---|---|---|---|---|---|
| No work experience or less than one year | 22,160 | 26% | 18,938 | 21% | 17,762 | 21% |
| 1 year | 6,082 | 7% | 7,292 | 8% | 6,106 | 7% |
| 2 years | 5,840 | 7% | 6,909 | 8% | 4,995 | 6% |
| 3 years | 9,458 | 11% | 12,136 | 14% | 15,189 | 18% |
| 4 years | 8,371 | 10% | 9,871 | 11% | 11,016 | 13% |
| 5 years or more | 34,111 | 40% | 34,654 | 39% | 30,237 | 35% |
| Total | 86,022 | 100% | 89,800 | 100% | 85,300 | 100% |
Source: MBR_FACT_EE_ITA as of January 29, 2020
Data is operational and as such should be considered preliminary and subject to change.
Table 16 provides information on (a) the number of invitations issued to candidates who were assigned additional points in each category and (b) the number of invitations issued to candidates who met relevant criteria for the category but were not necessarily assigned points.Footnote xi For example, in 2019, 10,905 invitations were issued to those claiming Arranged Employment but only 9,285 of those candidates were assigned the associated points. Data are provided for both conditions to facilitate comparison, as well as to reflect the fuller characteristics of candidates who received an invitation to apply for permanent residence.Footnote xii
In 2019, more than one third of invitations to apply (40%) were issued on the basis of human capital attributes alone (i.e. to candidates who were not assigned additional points)—this represents a decrease of 7 percentage points since 2018 (as reported in the 2018 Express Entry Year End Report).
Compared to all candidates in the Express Entry pool (refer to Table 2), a smaller proportion of invited candidates claimed no additional points (69% vs. 40%). More specifically, a higher proportion of invited candidates, compared to all candidates in the pool, were assigned points for having arranged employment (11% vs. 5%), for having post-secondary education in Canada (24% vs. 13%), and for French-language proficiency (5% vs. 4%). A smaller proportion of invited candidates were assigned points for having a sibling in Canada (9%), compared to points claimed by all candidates in the pool (12%).
| Additional point type* | Number | % |
|---|---|---|
| Assigned additional points | ||
| No Additional Points | 34,140 | 40% |
| Provincial Nominee | 14,928 | 18% |
| Arranged Employment | 9,285 | 11% |
| Education in Canada | 20,546 | 24% |
| French-language proficiency | 4,187 | 5% |
| Siblings in Canada | 8,052 | 9% |
| Met criteria for points | ||
| No Additional Points | 34,140 | 40% |
| Provincial Nominee | 14,928 | 18% |
| Arranged Employment | 10,905 | 13% |
| Education in Canada | 23,853 | 28% |
| French-language proficiency | 5,518 | 6% |
| Siblings in Canada | 10,001 | 12% |
| Total | 85,300 | 100% |
Source: MBR_FACT_EE_ITA as of January 29, 2020
Data is operational and as such should be considered preliminary and subject to change.
*Please note that candidates can qualify for multiple additional point types. Therefore, the sum of candidates by additional point type may exceed the total number of candidates issued additional points
Tables 17 to 20 display the number of invitations issued to men and women who met the criteria to receive each additional point type, regardless of whether candidates were actually assigned those points. In general, the proportion of male versus female invited candidates who met the criteria for each additional point type roughly aligns with the proportion of eligible profiles submitted by men and women (e.g., in 2019, 57% of eligible profiles were submitted by men and 43% by women; see Table 1 for figures). However, in 2019, among those who received an invitation to apply, a considerably higher proportion of men (70%) than women (30%) claimed arranged employment points. Over the course of the three year period under examination, 15 invitations were issued to candidates with unspecified gender, which are included in the totals below.
| Gender | 2017 number | 2017 % | 2018 number | 2018 % | 2019 number | 2019 % |
|---|---|---|---|---|---|---|
| Men | 6,278 | 73% | 6,681 | 72% | 7,633 | 70% |
| Women | 2,364 | 27% | 2,627 | 28% | 3,271 | 30% |
| Total | 8,642 | 100% | 9,308 | 100% | 10,905 | 100% |
Source: MBR_FACT_EE_ITA as of January 29, 2020
Data is operational and as such should be considered preliminary and subject to change.
| Gender | 2017 number | 2017 % | 2018 number | 2018 % | 2019 number | 2019 % |
|---|---|---|---|---|---|---|
| Men | 16,173 | 62% | 13,610 | 59% | 13,878 | 58% |
| Women | 9,774 | 38% | 9,283 | 41% | 9,973 | 42% |
| Total | 25,949 | 100% | 22,897 | 100% | 23,853 | 100% |
Source: MBR_FACT_EE_ITA as of January 29, 2020
Data is operational and as such should be considered preliminary and subject to change.
| Gender | 2017 number | 2017 % | 2018 number | 2018 % | 2019 number | 2019 % |
|---|---|---|---|---|---|---|
| Men | 1,060 | 56% | 2,567 | 56% | 2,891 | 52% |
| Women | 847 | 44% | 2,055 | 44% | 2,627 | 48% |
| Total | 1,907 | 100% | 4,623 | 100% | 5,518 | 100% |
Source: MBR_FACT_EE_ITA as of January 29, 2020
Data is operational and as such should be considered preliminary and subject to change.
| Gender | 2017 number | 2017 % | 2018 number | 2018 % | 2019 number | 2019 % |
|---|---|---|---|---|---|---|
| Men | 2,500 | 57% | 5,637 | 54% | 5,259 | 53% |
| Women | 1,858 | 43% | 4,842 | 46% | 4,739 | 47% |
| Total | 4,359 | 100% | 10,479 | 100% | 10,001 | 100% |
Source: MBR_FACT_EE_ITA as of January 29, 2020
Data is operational and as such should be considered preliminary and subject to change.
Consistent with 2017 and 2018, occupations in information technology, and business and financial services continued to dominate among candidates invited to apply for permanent residence, with about one third of invitations issued indicating an occupation in these areas (Table 21).
| Primary occupation | Skill type | 2017 | 2018 | 2019 |
|---|---|---|---|---|
| 2173 Software engineers and designers | A | 4,873 | 6,126 | 6,529 |
| 2171 Information systems analysts and consultants | A | 5,199 | 5,429 | 4,645 |
| 2174 Computer programmers and interactive media developers | A | 3,423 | 3,450 | 3,819 |
| 1111 Financial auditors and accountants | A | 2,392 | 2,483 | 2,607 |
| 1241 Administrative assistants | B | 1,914 | 2,335 | 2,407 |
| 1122 Professional occupations in business management consulting | A | 1,636 | 1,915 | 1,838 |
| 1123 Professional occupations in advertising, marketing and public relations | A | 1,887 | 2,049 | 1,808 |
| 1221 Administrative officers | B | 1,409 | 1,456 | 1,694 |
| 4011 University professors and lecturers | A | 1,825 | 1,942 | 1,684 |
| 0124 Advertising, marketing and public relations managers | 0 | 1,501 | 1,775 | 1,588 |
| 1112 Financial and investment analysts | A | 1,760 | 1,921 | 1,549 |
| 6311 Food service supervisors | B | 1,311 | 1,435 | 1,544 |
| 1311 Accounting technicians and bookkeepers | B | 1,073 | 1,196 | 1,484 |
| 2132 Mechanical engineers | A | 1,369 | 1,274 | 1,416 |
| 2172 Database analysts and data administrators | A | 795 | 1,038 | 1,312 |
| Other | 53,655 | 53,976 | 49,376 | |
| Total | 86,022 | 89,800 | 85,300 |
Source: MBR_FACT_EE_ITA as of January 29, 2020
Data is operational and as such should be considered preliminary and subject to change.
Skill Type 0: management jobs
Skill Level A: professional jobs that usually call for a degree from a university
Skill Level B: technical jobs and skilled trades that usually call for a college diploma or training as an apprentice
At the time of invitation, the primary occupations of men and women differed to some extent (Tables 22 to 23). For example, since 2017, the most common occupation among women who received an invitation to apply was Administrative assistant, which was not among the most common primary occupations for men during this time. Overall, the most common primary occupations among women who were invited to apply for permanent residence included more lower-skilled occupations, in comparison to the most common primary occupations among men.
| Primary occupation | Skill type | 2017 | 2018 | 2019 |
|---|---|---|---|---|
| 2173 Software engineers and designers | A | 3,708 | 4,574 | 4,844 |
| 2171 Information systems analysts and consultants | A | 3,828 | 3,837 | 3,210 |
| 2174 Computer programmers and interactive media developers | A | 2,708 | 2,579 | 2,836 |
| 2132 Mechanical engineers | A | 1,292 | 1,167 | 1,283 |
| 1111 Financial auditors and accountants | A | 1,212 | 1,258 | 1,276 |
| 1122 Professional occupations in business management consulting | A | 1,020 | 1,132 | 1,055 |
| 0213 Computer and information systems managers | 0 | 1,078 | 1,078 | 1,002 |
| 1112 Financial and investment analysts | A | 1,157 | 1,190 | 911 |
| 4011 University professors and lecturers | A | 953 | 998 | 897 |
| 2172 Database analysts and data administrators | A | 568 | 702 | 877 |
| 0124 Advertising, marketing and public relations managers | A | 805 | 901 | 788 |
| 0621 Retail and wholesale trade managers | 0 | 809 | 737 | 745 |
| 2282 User support technicians | B | 901 | 779 | 740 |
| 2133 Electrical and electronics engineers | A | 1,029 | 925 | 719 |
| 6322 Cooks | B | 604 | 696 | 712 |
| Other | 30,792 | 29,921 | 27,168 | |
| Total | 52,464 | 52,474 | 49,063 |
Source: MBR_FACT_EE_ITA as of January 29, 2020
Data is operational and as such should be considered preliminary and subject to change.
Skill Type 0: management jobs
Skill Level A: professional jobs that usually call for a degree from a university
Skill Level B: technical jobs and skilled trades that usually call for a college diploma or training as an apprentice
| Primary occupation | Skill type | 2017 | 2018 | 2019 |
|---|---|---|---|---|
| 1241 Administrative assistants | B | 1,443 | 1,734 | 1,785 |
| 2173 Software engineers and designers | A | 1,165 | 1,552 | 1,683 |
| 2171 Information systems analysts and consultants | A | 1,371 | 1,592 | 1,434 |
| 1111 Financial auditors and accountants | A | 1,180 | 1,225 | 1,331 |
| 1123 Professional occupations in advertising, marketing and public relations | A | 1,173 | 1,243 | 1,133 |
| 1221 Administrative officers | B | 958 | 952 | 1,120 |
| 2174 Computer programmers and interactive media developers | A | 715 | 871 | 983 |
| 1311 Accounting technicians and bookkeepers | B | 667 | 710 | 861 |
| 6311 Food service supervisors | B | 593 | 730 | 837 |
| 0124 Advertising, marketing and public relations managers | 0 | 696 | 873 | 800 |
| 4011 University professors and lecturers | A | 872 | 944 | 787 |
| 1122 Professional occupations in business management consulting | A | 616 | 783 | 783 |
| 1112 Financial and investment analysts | A | 603 | 731 | 638 |
| 0631 Restaurant and food service managers | 0 | 353 | 398 | 570 |
| 4021 College and other vocational instructors | A | 516 | 703 | 570 |
| Other | 20,635 | 22,279 | 20,914 | |
| Total | 33,556 | 37,320 | 36,229 |
Source: MBR_FACT_EE_ITA as of January 29, 2020
Data is operational and as such should be considered preliminary and subject to change.
Skill Type 0: management jobs
Skill Level A: professional jobs that usually call for a degree from a university
Skill Level B: technical jobs and skilled trades that usually call for a college diploma or training as an apprentice
Table 24 displays the most common occupations among candidates who were assigned arranged employment points and were invited to apply in 2019. The most common occupations among this sub-population included more lower-skilled occupations, such as food service supervisors (8%), and cooks (6%), compared to the full population of candidates who received an invitation to apply for permanent residence in 2019.
| Arranged employment occupation | Skill type | 2017 | 2018 | 2019 |
|---|---|---|---|---|
| 2174 Computer programmers and interactive media developers | A | 432 | 604 | 916 |
| 2173 Software engineers and designers | A | 523 | 783 | 871 |
| 6311 Food service supervisors | B | 459 | 525 | 838 |
| 6322 Cooks | B | 406 | 594 | 692 |
| 2171 Information systems analysts and consultants | A | 445 | 490 | 647 |
| 4011 University professors and lecturers | A | 386 | 430 | 501 |
| 0013 Senior managers - financial, communications and other business services | A | 269 | 264 | 364 |
| 0213 Computer and information systems managers | 0 | 206 | 282 | 336 |
| 5241 Graphic designers and illustrators | B | 374 | 392 | 331 |
| 1241 Administrative assistants | B | 88 | 122 | 218 |
| 6211 Retail sales supervisors | B | 187 | 153 | 209 |
| 1221 Administrative officers | B | 116 | 136 | 192 |
| 0016 Senior managers - construction, transportation, production and utilities | 0 | 181 | 185 | 180 |
| 0015 Senior managers - trade, broadcasting and other services | 0 | 87 | 105 | 157 |
| 8252 Agricultural service contractors, farm supervisors and specialized livestock workers | B | 83 | 127 | 142 |
| Other | 4,400 | 4,116 | 4,311 | |
| Total | 8,642 | 9,308 | 10,905 |
Source: MBR_FACT_EE_ITA as of January 29, 2020
Data is operational and as such should be considered preliminary and subject to change.
Skill Type 0: management jobs
Skill Level A: professional jobs that usually call for a degree from a university
Skill Level B: technical jobs and skilled trades that usually call for a college diploma or training as an apprentice
As displayed in Tables 25 and 26, the most common occupations among both men and women who claimed arranged employment points and received an invitation to apply for permanent residence were similar to those observed for the total population of those who claimed arranged employment points. In addition, the most common occupations among women with arranged employment points included more lower-skilled occupations in comparison to their counterparts who were men.
| Arranged employment occupation | Skill type | 2017 | 2018 | 2019 |
|---|---|---|---|---|
| 2173 Software engineers and designers | A | 453 | 697 | 789 |
| 2174 Computer programmers and interactive media developers | A | 382 | 515 | 769 |
| 2171 Information systems analysts and consultants | A | 394 | 411 | 547 |
| 6322 Cooks | B | 284 | 381 | 445 |
| 6311 Food service supervisors | B | 225 | 273 | 346 |
| 4011 University professors and lecturers | A | 261 | 288 | 331 |
| 0213 Computer and information systems managers | 0 | 187 | 242 | 294 |
| 0013 Senior managers - financial, communications and other business services | 0 | 220 | 220 | 292 |
| 5241 Graphic designers and illustrators | B | 285 | 294 | 268 |
| 0016 Senior managers - construction, transportation, production and utilities | 0 | 159 | 168 | 159 |
| 6211 Retail sales supervisors | B | 136 | 101 | 139 |
| 0015 Senior managers - trade, broadcasting and other services | 0 | 76 | 79 | 121 |
| 8252 Agricultural service contractors, farm supervisors and specialized livestock workers | B | 63 | 91 | 101 |
| 7271 Carpenters | B | 123 | 110 | 97 |
| 1215 Supervisors, supply chain, tracking and scheduling co-ordination occupations | B | 95 | 67 | 89 |
| Other | 2,935 | 2,744 | 2,846 | |
| Total | 6,278 | 6,681 | 7,633 |
Source: MBR_FACT_EE_ITA as of January 29, 2020
Data is operational and as such should be considered preliminary and subject to change.
Skill Type 0: management jobs
Skill Level A: professional jobs that usually call for a degree from a university
Skill Level B: technical jobs and skilled trades that usually call for a college diploma or training as an apprentice
| Arranged employment occupation | Skill type | 2017 | 2018 | 2019 |
|---|---|---|---|---|
| 6311 Food service supervisors | B | 234 | 252 | 492 |
| 6322 Cooks | B | 122 | 213 | 247 |
| 4011 University professors and lecturers | A | 125 | 142 | 170 |
| 2174 Computer programmers and interactive media developers | A | 50 | 89 | 147 |
| 1241 Administrative assistants | B | 63 | 80 | 139 |
| 1221 Administrative officers | B | 74 | 91 | 119 |
| 2171 Information systems analysts and consultants | A | 51 | 79 | 100 |
| 4214 Early childhood educators and assistants | B | 79 | 102 | 100 |
| 2173 Software engineers and designers | A | 70 | 86 | 82 |
| 0013 Senior managers - financial, communications and other business services | 0 | 49 | 44 | 72 |
| 0631 Restaurant and food service managers | 0 | 43 | 39 | 70 |
| 1311 Accounting technicians and bookkeepers | B | 46 | 60 | 70 |
| 6211 Retail sales supervisors | B | 51 | 52 | 70 |
| 5241 Graphic designers and illustrators | B | 89 | 98 | 63 |
| 1123 Professional occupations in advertising, marketing and public relations | A | 23 | 26 | 47 |
| Other | 1,195 | 1,174 | 1,283 | |
| Total | 2,364 | 2,627 | 3,271 |
Source: MBR_FACT_EE_ITA as of January 29, 2020
Data is operational and as such should be considered preliminary and subject to change.
Skill Type 0: management jobs
Skill Level A: professional jobs that usually call for a degree from a university
Skill Level B: technical jobs and skilled trades that usually call for a college diploma or training as an apprentice
The five most common countries of residence among invitations issued remained the same from 2017 to 2018 to 2019 (Table 27). Since 2017, about half of invitations to apply for permanent residence have been issued to candidates who indicated Canada as their country of residence. The proportion of invited candidates who indicated the United States as their country of residence nearly doubled from 2017 (7%) to 2019 (12%).
| Country of residence | 2017 | 2018 | 2019 |
|---|---|---|---|
| Canada | 42,233 | 39,936 | 40,550 |
| India | 14,910 | 17,636 | 14,926 |
| United States | 5,829 | 9,981 | 10,185 |
| Nigeria | 2,910 | 3,724 | 3,819 |
| United Arab Emirates | 2,436 | 2,029 | 1,708 |
| Pakistan | 1,331 | 1,365 | 1,180 |
| Morocco | 255 | 585 | 860 |
| Australia | 673 | 831 | 791 |
| China | 985 | 871 | 768 |
| United Kingdom | 1,560 | 1,186 | 699 |
| Other | 12,900 | 11,656 | 9,814 |
| Total | 86,022 | 89,800 | 85,300 |
Source: MBR_FACT_EE_ITA as of January 29, 2020
Data is operational and as such should be considered preliminary and subject to change.
As displayed in Tables 28 and 29, the most common countries of residence were similar for both men and women in 2017, 2018, and 2019. In 2019, a smaller proportion of women (44%) than men (50%) indicated Canada as their country of residence.
| Country of residence | 2017 | 2018 | 2019 |
|---|---|---|---|
| Canada | 26,734 | 24,662 | 24,725 |
| India | 8,848 | 9,363 | 7,652 |
| United States | 3,873 | 6,564 | 6,593 |
| Nigeria | 1,374 | 1,574 | 1,612 |
| United Arab Emirates | 1,405 | 1,125 | 905 |
| Pakistan | 888 | 832 | 659 |
| Australia | 410 | 477 | 469 |
| Morocco | 158 | 329 | 468 |
| United Kingdom | 895 | 658 | 392 |
| China | 421 | 409 | 321 |
| Other | 7,458 | 6,481 | 5,267 |
| Total | 52,464 | 52,474 | 49,063 |
Source: MBR_FACT_EE_ITA as of January 29, 2020
Data is operational and as such should be considered preliminary and subject to change.
| Country of residence | 2017 | 2018 | 2019 |
|---|---|---|---|
| Canada | 15,498 | 15,273 | 15,823 |
| India | 6,062 | 8,273 | 7,273 |
| United States | 1,956 | 3,417 | 3,591 |
| Nigeria | 1,536 | 2,150 | 2,207 |
| United Arab Emirates | 1,031 | 904 | 801 |
| Pakistan | 443 | 533 | 521 |
| China | 564 | 462 | 447 |
| Morocco | 97 | 256 | 392 |
| Australia | 263 | 354 | 322 |
| United Kingdom | 665 | 528 | 307 |
| Other | 5,441 | 5,170 | 4,545 |
| Total | 33,556 | 37,320 | 36,229 |
Source: MBR_FACT_EE_ITA as of January 29, 2020
Data is operational and as such should be considered preliminary and subject to change.
As with country of residence, the five most common countries of citizenship among individuals who received an ITA did not change from 2017, to 2018, to 2019 (Table 30). Across all years, India remained the most common country of citizenship by a significant margin—47% of ITAs were issued to those with Indian citizenship, compared to 7% of ITAs issued to individuals with Nigerian citizenship, as well 7% to individuals with Chinese citizenship, which were the second and third most common countries of citizenship, respectively. The proportion of invited candidates who indicated citizenship outside of the ten most common countries declined slightly from 2017 (27%) to 2019 (25%).
| Country of citizenship | 2017 | 2018 | 2019 |
|---|---|---|---|
| India | 36,308 | 41,678 | 40,275 |
| Nigeria | 5,128 | 6,025 | 5,886 |
| China | 7,467 | 6,247 | 5,668 |
| Pakistan | 3,337 | 3,108 | 2,509 |
| United Kingdom | 2,660 | 2,549 | 2,128 |
| Brazil | 1,686 | 1,847 | 1,801 |
| United States | 2,047 | 1,803 | 1,561 |
| Iran | 1,379 | 1,299 | 1,475 |
| France | 1,248 | 1,371 | 1,455 |
| Korea, South | 1,251 | 1,254 | 1,225 |
| Other | 23,511 | 22,619 | 21,317 |
| Total | 86,022 | 89,800 | 85,300 |
Source: MBR_FACT_EE_ITA as of January 29, 2020
Data is operational and as such should be considered preliminary and subject to change.
These patterns generally hold across men and women (Tables 31 and 32). However, in 2019, a smaller proportion of women (42%) than men (51%) held Indian citizenship.
| Country of citizenship | 2017 | 2018 | 2019 |
|---|---|---|---|
| India | 24,417 | 25,953 | 24,874 |
| Nigeria | 2,686 | 2,880 | 2,748 |
| China | 3,401 | 2,794 | 2,494 |
| Pakistan | 2,444 | 2,143 | 1,665 |
| United Kingdom | 1,652 | 1,570 | 1,303 |
| Brazil | 1,049 | 1,119 | 1,048 |
| United States | 1,230 | 1,083 | 894 |
| Iran | 860 | 793 | 888 |
| France | 715 | 783 | 754 |
| Ireland, Republic of | 774 | 753 | 694 |
| Other | 13,236 | 12,603 | 11,701 |
| Total | 52,464 | 52,474 | 49,063 |
Source: MBR_FACT_EE_ITA as of January 29, 2020
Data is operational and as such should be considered preliminary and subject to change.
| Country of citizenship | 2017 | 2018 | 2019 |
|---|---|---|---|
| India | 11,890 | 15,725 | 15,397 |
| China | 4,066 | 3,453 | 3,174 |
| Nigeria | 2,442 | 3,145 | 3,138 |
| Pakistan | 893 | 964 | 844 |
| United Kingdom | 1,008 | 979 | 825 |
| Brazil | 637 | 728 | 753 |
| France | 533 | 588 | 701 |
| Korea, South | 660 | 687 | 673 |
| Philippines | 666 | 489 | 667 |
| United States | 817 | 720 | 666 |
| Other | 9,944 | 9,842 | 9,391 |
| Total | 33,556 | 37,320 | 36,229 |
Source: MBR_FACT_EE_ITA as of January 29, 2020
Data is operational and as such should be considered preliminary and subject to change.
Who applied for permanent residence through Express Entry?
Excluding accompanying family members, i.e., considering only principal applicants, 67,260 applications for permanent residence were sourced through Express Entry in 2019 (Table 33). Among principal applicants, a slightly higher proportion of men (57%) than women (43%) submitted applications in 2019. The application by program pattern was similar for men and women—both genders applied most often under Federal Skilled Worker Program and least often under Federal Skilled Trades Program. A greater proportion of men than women submitted applications for every economic program; this difference was especially pronounced under the Federal Skilled Trade Program and least pronounced under the Federal Skilled Worker Program. Two candidates with an unspecified gender submitted applications for permanent residence in 2019; these individuals are included only in the total counts.
| Men | Number | % |
|---|---|---|
| Provincial Nominee | 7,346 | 60% |
| Federal Skilled Worker | 16,308 | 53% |
| Canadian Experience Class | 14,181 | 60% |
| Federal Skilled Trades | 541 | 75% |
| Total | 38,376 | 57% |
| Women | ||
| Provincial Nominee | 4,882 | 40% |
| Federal Skilled Worker | 14,335 | 47% |
| Canadian Experience Class | 9,480 | 40% |
| Federal Skilled Trades | 185 | 25% |
| Total | 28,882 | 43% |
| Grand total | ||
| Provincial Nominee | 12,229 | 100% |
| Federal Skilled Worker | 30,643 | 100% |
| Canadian Experience Class | 23,662 | 100% |
| Federal Skilled Trades | 726 | 100% |
| Total | 67,260 | 100% |
Source: CIC_EDW (MBR) as of February 9, 2020
Data is operational and as such should be considered preliminary and subject to change.
As displayed in Table 34, nearly two thirds of principal applicants (62%) who submitted an application for permanent residence through Express Entry in 2019 indicated Ontario as the province of destination, which is a decrease from 2018 when 65% of principal applicants indicated the same. Compared to 2018, the number of principal applicants who intended to reside in Alberta, Manitoba, and Nunavut increased considerably in 2019, although the number of those who intended to reside in Nunavut remained very small.
| Province of destination | 2018 | 2019 |
|---|---|---|
| Alberta | 4,477 | 6,422 |
| British Columbia | 13,418 | 13,482 |
| Manitoba | 1,017 | 1,492 |
| New Brunswick | 750 | 658 |
| Newfoundland and Labrador | 176 | 123 |
| Northwest Territories | 31 | 33 |
| Nova Scotia | 1,613 | 1,521 |
| Nunavut | 3 | 10 |
| Ontario | 44,224 | 41,749 |
| Prince Edward Island | 375 | 462 |
| Saskatchewan | 1,524 | 1,275 |
| Yukon | 41 | 33 |
| Total | 67,649 | 67,260 |
Source: CIC_EDW (MBR) as of February 9, 2020
Data is operational and as such should be considered preliminary and subject to change.
How long did it take to process an Express Entry application?
Table 35 displays the time, in months, that IRCC took to process 80% of applications under each program. In 2019, IRCC did not meet the processing standard of finalizing 80% of all applications sourced via Express Entry within six months. The processing time for Express Entry, overall, was eight months. As an alternative measure of processing times, 60% of applications finalized in the 12-month period ending on December 31, 2019, were completed within the six-month service standard.
| Program | 2017 | 2018 | 2019 |
|---|---|---|---|
| Canadian Experience Class | 4 | 5 | 7 |
| Federal Skilled Worker | 4 | 6 | 9 |
| Provincial/Territorial Nominee | 6 | 6 | 9 |
| Federal Skilled Trades | 6 | 7 | 12 |
| All Programs | 5 | 5 | 8 |
Source: CIC_EDW (MBR) as of January 3, 2020
Data is operational and as such should be considered preliminary and subject to change.
- Processing times refer to the time in which 80% of applications were finalized by IRCC. The processing time is measured from the day a complete application is received until the time a final decision is made by an immigration officer.
Who was admitted through Express Entry and where were they going?
In 2019, 109,595 principal applicants and their accompanying family members were admitted into Canada as permanent residents through Express Entry (Table 36). By comparison, 92,229 principal applicants and their accompanying family members were admitted in 2018 and 65,425 were admitted in 2017.
From 2017 to 2019, the individuals admitted under the Federal Skilled Worker Program, as a proportion of all individuals admitted in the calendar year, increased from 29% to 53%. The proportion of individuals admitted under the Canadian Experience Class Program decreased, from 48% to 28%, as did those admitted under the Federal Skilled Trades, from 3% to 1%. The proportion of people admitted under the Provincial Nominee Program remained relatively stable from 2017 (21%) to 2019 (18%).
| Program | 2017 | 2018 | 2019 |
|---|---|---|---|
| Provincial Nominee Program | 13,534 | 17,963 | 20,014 |
| Federal Skilled Worker | 18,822 | 45,926 | 58,173 |
| Canadian Experience Class | 31,212 | 27,466 | 30,230 |
| Federal Skilled Trades | 1,857 | 874 | 1,178 |
| Total | 65,425 | 92,229 | 109,595 |
Source: Netezza_DM2 - RDM, Permanent Residents, December 31, 2019
Data is operational and as such should be considered preliminary and subject to change.
As displayed in Tables 37 and 38, the pattern of principal applicant admissions by program was similar for men and women in 2019. Male and female principal applicants were most often admitted under the Federal Skilled Worker Program and least often admitted under the Federal Skilled Trades Program, which was also the case in 2018. In 2017, men and women admitted to Canada as principal applicants were most often under the Canadian Experience Class. From 2017 to 2019, one principal applicant who had an unspecified gender was admitted to Canada. Because of this small count, the data presented below are not broken down by gender categorized as “unspecified.”
| Program | 2017 number | 2017 % | 2018 number | 2018 % | 2019 number | 2019 % |
|---|---|---|---|---|---|---|
| Provincial Nominee Program | 4,511 | 18% | 5,601 | 18% | 5,781 | 16% |
| Federal Skilled Worker | 6,123 | 25% | 13,320 | 43% | 16,406 | 46% |
| Canadian Experience Class | 13,564 | 55% | 11,935 | 38% | 12,926 | 36% |
| Federal Skilled Trades | 647 | 3% | 323 | 1% | 511 | 1% |
| Total | 24,845 | 100% | 31,179 | 100% | 35,624 | 100% |
Source: Netezza_DM2 - RDM, Permanent Residents, December 31, 2019
Data is operational and as such should be considered preliminary and subject to change.
| Program | 2017 number | 2017 % | 2018 number | 2018 % | 2019 number | 2019 % |
|---|---|---|---|---|---|---|
| Provincial Nominee Program | 2,397 | 17% | 2,945 | 14% | 3,257 | 12% |
| Federal Skilled Worker | 4,320 | 31% | 10,367 | 50% | 14,166 | 54% |
| Canadian Experience Class | 7,085 | 51% | 7,175 | 35% | 8,519 | 33% |
| Federal Skilled Trades | 97 | 1% | 57 | 0% | 132 | 1% |
| Total | 13,899 | 100% | 20,544 | 100% | 26,074 | 100% |
Source: Netezza_DM2 - RDM, Permanent Residents, December 31, 2019
Data is operational and as such should be considered preliminary and subject to change.
As reported in Table 39, India was, by a large margin, the most common country of citizenship among principal applicants and their accompanying family members admitted to Canada through Express Entry in 2017 (40%), 2018 (43%), and 2019 (46%). The proportion of individuals admitted through Express Entry who held Nigerian citizenship increased from 4% in 2017 to 8% in 2019. The proportion of individuals who held Chinese citizenship decreased from 9% in 2017 to 5% in 2019.
| Province/Territory of destination | 2017 number | 2017 % | 2018 number | 2018 % | 2019 number | 2019 % |
|---|---|---|---|---|---|---|
| India | 26332 | 40% | 39680 | 43% | 50842 | 46% |
| Nigeria | 2878 | 4% | 6653 | 7% | 8423 | 8% |
| China | 5737 | 9% | 5885 | 6% | 5754 | 5% |
| Pakistan | 1523 | 2% | 3526 | 4% | 4691 | 4% |
| United States | 2848 | 4% | 3580 | 4% | 3947 | 4% |
| United Kingdom | 2,367 | 4% | 2,624 | 3% | 2,531 | 2% |
| Brazil | 1434 | 2% | 2214 | 2% | 2518 | 2% |
| Egypt | 740 | 1% | 1776 | 2% | 1747 | 2% |
| Korea, Republic of | 1174 | 2% | 1190 | 1% | 1646 | 2% |
| Iran | 377 | 1% | 1361 | 1% | 1417 | 1% |
| Other | 20,015 | 31% | 23,740 | 26% | 26,079 | 24% |
| Total | 65,425 | 100% | 92,229 | 100% | 109,595 | 100% |
Source: Netezza_DM2 - RDM, Permanent Residents, December 31, 2019
Data is operational and as such should be considered preliminary and subject to change.
Similar to the pattern observed at the application stage, and as in 2017 and in 2018, a majority of persons admitted in 2019 were destined for Ontario (Table 40).
| Province/Territory of destination | 2017 | 2018 | 2019 |
|---|---|---|---|
| Newfoundland and Labrador | 206 | 244 | 243 |
| Prince Edward Island | 819 | 470 | 546 |
| Nova Scotia | 2,269 | 3,255 | 3,345 |
| New Brunswick | 1,439 | 1,876 | 1,691 |
| Ontario | 36,103 | 59,666 | 69,969 |
| Manitoba | 541 | 961 | 2,521 |
| Saskatchewan | 2,870 | 2,744 | 3,108 |
| Alberta | 8,689 | 6,907 | 8,019 |
| British Columbia | 12,403 | 16,028 | 20,064 |
| Yukon | 23 | 39 | 40 |
| Northwest Territories | 55 | 36 | 39 |
| Nunavut | 8 | 3 | 10 |
| Total | 65,425 | 92,229 | 109,595 |
Source: Netezza_DM2 - RDM, Permanent Residents, December 31, 2019
Data is operational and as such should be considered preliminary and subject to change.
As expected, the concentration of admitted individuals destined for Ontario was less pronounced among the individuals who were selected through the Provincial Nominee Program (Table 41), as compared to those who were selected through the Federal Skilled Worker Program, the Canadian Experience Class, and the Federal Skilled Trades Program (Table 42).
| Province/Territory of destination | 2017 | 2018 | 2019 |
|---|---|---|---|
| Newfoundland and Labrador | 8 | 44 | 49 |
| Prince Edward Island | 740 | 384 | 459 |
| Nova Scotia | 1,851 | 2,605 | 2,626 |
| New Brunswick | 1,250 | 1,521 | 1,330 |
| Ontario | 4,424 | 7,505 | 6,118 |
| Manitoba | 48 | 74 | 1,487 |
| Saskatchewan | 2,154 | 1,733 | 2,049 |
| Alberta | 2 | 0 | 646 |
| British Columbia | 3,019 | 4,075 | 5,212 |
| Yukon | 6 | 14 | 22 |
| Northwest Territories | 32 | 8 | 16 |
| Nunavut | 0 | 0 | 0 |
| Total | 13,534 | 17,963 | 20,014 |
Source: Netezza_DM2 - RDM, Permanent Residents, December 31, 2019
Data is operational and as such should be considered preliminary and subject to change.
| Province/Territory of destination | 2017 | 2018 | 2019 |
|---|---|---|---|
| Newfoundland and Labrador | 198 | 200 | 194 |
| Prince Edward Island | 79 | 86 | 87 |
| Nova Scotia | 418 | 650 | 719 |
| New Brunswick | 189 | 355 | 361 |
| Ontario | 31,679 | 52,161 | 63,851 |
| Manitoba | 493 | 887 | 1,034 |
| Saskatchewan | 716 | 1,011 | 1,059 |
| Alberta | 8,687 | 6,907 | 7,373 |
| British Columbia | 9,384 | 11,953 | 14,852 |
| Yukon | 17 | 25 | 18 |
| Northwest Territories | 23 | 28 | 23 |
| Nunavut | 8 | 3 | 10 |
| Total | 51,891 | 74,266 | 89,581 |
Source: Netezza_DM2 - RDM, Permanent Residents, December 31, 2019
Data is operational and as such should be considered preliminary and subject to change.
Conclusion
In 2019, the fifth year of its operation, the Express Entry application management system continued to provide a pathway to permanent residence for a range of highly-skilled candidates who demonstrated the potential to successfully integrate and contribute to Canada’s economy. To address the longer Express Entry processing times observed in 2019, IRCC took steps in late 2019 to position the Department to return to meeting the Express Entry service standard—processing 80% of applications within six months—in the future.
Today, in the context of the COVID-19 pandemic that has elicited unprecedented challenges for the country throughout the spring of 2020, the Department is monitoring Express Entry and exploring ways the system could be used to ensure that Canada continues to derive maximum benefit from economic immigration in a rapidly evolving environment.