
Express Entry Year-End Report 2020
Overview of Express Entry
Launched in January 2015, Express Entry is Canada’s flagship application management system for the Federal Skilled Worker Program, the Federal Skilled Trades Program, Canadian Experience Class, and a portion of the Provincial Nominee Program. As described below, Express Entry provides the Government of Canada with the means to manage the intake of applications for permanent residence under these key economic immigration programs, while also facilitating the selection of individuals who are most likely to succeed in Canada.
As with previous reports, the Express Entry Year-End Report 2020 provides an overview of Express Entry and presents data from across all stages of the Express Entry continuum, including profile submissions, invitations to apply, applications, processing times, and admissions. Throughout the report, historical and gender-disaggregated dataFootnote i is presented alongside the 2020 figures to provide additional context.
How Express Entry works
The Express Entry system manages applications for permanent residence in two steps. First, individuals express their interest in immigrating to Canada by completing an online profile, which is screened electronically to determine if the individual is eligible for the Federal Skilled Worker Program, the Federal Skilled Trades Program, or the Canadian Experience Class. Individuals who meet the eligibility criteria for at least one of these programsFootnote ii are placed in the Express Entry pool and assigned a Comprehensive Ranking System (CRS) score, which is determined by comparing information in their profile to a transparent scoring criteria. Candidates in the pool are ranked against one another according to their CRS score.
Second, Ministerial Instructions are regularly published on Immigration, Refugees and Citizenship Canada (IRCC)’s website specifying the number of invitations to apply (ITA) for permanent residence that will be sent to candidates in the Express Entry pool on a specific date. The Ministerial Instruction also specifies the economic program(s) for which the Express Entry ITA round will apply. For each round, invitations are issued to candidates, in descending CRS score rank order, until the maximum number of invitations specified in the associated Ministerial Instruction is met. The profiles of candidates who do not receive an ITA, or decline an ITA, remain in the pool for up to 12 months.
Candidates that receive an ITA have 90 days to either decline the invitation or submit an online application for permanent residence to IRCC. Candidates who receive an ITA but take no action within the 90-day period are withdrawn from the pool. Upon receipt, an immigration officer assesses the application to verify the applicant’s CRS score, program eligibility, and admissibility. If the immigration officer is satisfied that all conditions have been met and that the applicant is not inadmissible, they are approved for a permanent resident visa. Applicants and their accompanying family members become permanent residents when they are admitted to Canada. The processing standard for applications sourced via Express Entry is six months for 80% of cases. Processing time is measured from the day a complete application is received until a final decision is made by an immigration officer.
The CRS is the backbone of the Express Entry application management system. A CRS score comprises two components: core points and additional points. A candidate without an accompanying spouseFootnote iii can receive a maximum of 600 points under the core component, depending on the person’s human capital characteristics (e.g., age, education, official language proficiency, work experience). These factors help predict a candidate’s potential for success in the Canadian labour market.
Under the additional points component, a candidate can receive points for having a provincial/territorial nomination (600 points), arranged employment (50 or 200 points), Canadian post-secondary education credentials (15 or 30 points), French language proficiency (25 or 50 points), or a sibling in Canada (15 points).Footnote iv Additional points increase the probability that a given candidate will receive an ITA, but cannot alone ensure it—with the exception of the points for a provincial/territorial nomination, which are enough to virtually guarantee an ITA in a following round that includes the Provincial Nominee Program.
Candidates in the Express Entry pool can, and in some cases must, update their profile to reflect any change in circumstances, and this action can trigger a recalculation of the CRS score. Some updates are automatically triggered when milestones, such as a birthday or expiry of language test results, are reached. Accordingly, candidates can take steps to increase their CRS score, thereby increasing the probability they will be selected to receive an ITA. For example, a candidate could increase their proficiency in an official language, secure arranged employment, or provide an educational credential assessment for education acquired abroad.
The maximum CRS score a candidate can achieve is capped at 1,200 points—600 points under the core component and 600 points under the additional points component. All information provided at the profile stage for the purpose of generating a CRS score is self-reported and must be supported with appropriate documentation from the candidate at the application stage or the application could be refused.
What’s new in 2020
COVID-19 has been an unprecedented challenge for Canadians, newcomers, and Canada’s immigration program – including Express Entry. In 2020, Immigration, Refugees and Citizenship Canada (IRCC) pivoted quickly to adapt its Express Entry system to new conditions presented by the pandemic. The validity period of an invitation to apply for permanent residence was increased from 60 to 90 days to provide clients with additional time to prepare their applications, in response new pandemic-related challenges in acquiring the necessary documentation. As well, IRCC targeted its invitations to apply at Canadian Experience Class- and Provincial Nominee Program-eligible candidates, who are more likely to be physically located in Canada and therefore less impacted by border restrictions. Despite the severe and prolonged impacts of COVID-19, 2020 saw more invitations to apply issued via Express Entry than in any previous year.
IRCC also increased the number of points available to French-speaking and bilingual candidates in the Express Entry pool. On October 20, 2020, the number of points awarded through Express Entry increased from 15 to 25 for French-speaking candidates and from 30 to 50 for bilingual candidates. This change increases the likelihood of these candidates receiving an invitation to apply to come to Canada through economic immigration programs, and supports the Government of Canada in achieving its 4.4% target for French-speaking immigrants outside Quebec by 2023.
Who submitted an Express Entry profile?
In 2020, 360,998 Express Entry profiles were submitted through the system, which represents an increase of 9% from 2019 and 30% since 2018 (Figure 1). Among profiles submitted in 2020, 74% were eligible for at least one of the federal programs managed by Express Entry (i.e., the Federal Skilled Worker Program, the Federal Skilled Trades Program, or the Canadian Experience Class), continuing an upwards trend from 2019 (72%) and 2018 (70%).
Figure 1: Profile Submissions, 2018-2020
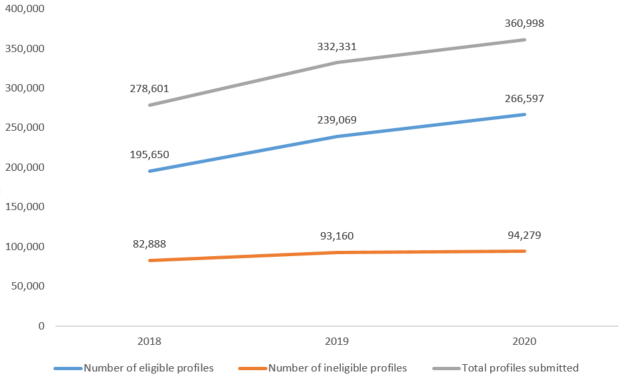
Figure 1: Profile Submissions, 2018-2020
In 2018, 278,601 total Express Entry profiles were submitted, including 195,650 eligible profiles and 82,888 ineligible profiles.
In 2019, 332,331 total Express Entry profiles were submitted, including 239,069 eligible profiles and 93,160 ineligible profiles.
In 2020, 360,998 total Express Entry profiles were submitted, including 266,597 eligible profiles and 94,279 ineligible profiles.
As displayed in Table 1, in 2020, more profiles were submitted by men (207,202) than women (153,674). Women submitted a slightly higher proportion of total profiles in 2020 (43%), continuing an upwards trend from 2019 (41%) and 2018 (39%). A higher proportion of profiles submitted in 2020 by women were eligible for at least one program (77%) compared to those submitted by men (71%), as was the case in 2019 (76% vs. 69%) and 2018 (74% vs. 68%).
In 2020, 64 profiles were submitted by people with unspecified genders; 58 profiles were submitted by people who indicated another gender. Because of this small count, the data presented below are not broken down by gender categorized as “unspecified” or “another.”
| Profile outcome | 2018 number | 2018% | 2019 number | 2019% | 2020 number | 2020% |
|---|---|---|---|---|---|---|
| Men | ||||||
| Eligible | 114,715 | 68% | 135,359 | 69% | 147,661 | 71% |
| Ineligible | 54,401 | 32% | 59,572 | 31% | 59,541 | 29% |
| TotalFootnote * | 169,116 | 100% | 194,931 | 100% | 207,202 | 100% |
| Women | ||||||
| Eligible | 80,935 | 74% | 103,710 | 76% | 118,936 | 77% |
| Ineligible | 28,487 | 26% | 33,588 | 24% | 34,738 | 23% |
| TotalFootnote * | 109,422 | 100% | 137,298 | 100% | 153,674 | 100% |
| Eligible | 195,670 | 70% | 239,115 | 72% | 266,658 | 74% |
| Ineligible | 82,931 | 30% | 93,216 | 28% | 94,340 | 26% |
| TotalFootnote * | 278,601 | 100% | 332,331 | 100% | 360,998 | 100% |
Source: IRCC-EDW (MBR) as of January 12, 2021
Note that the data is operational and may vary slightly compared to previous years’ reported numbers
Who got into the Express Entry pool?
The distributions of CRS scores for eligible candidate profiles at time of submission are presented in Table 2. In each year, the CRS scores were concentrated in the 301-500 range. 2020 saw a notable increase in of the proportion of eligible candidate profiles in the 451-500 range, to 27% from 18% in 2018 and 22% in 2019. It is important to note that the Express Entry pool is dynamic, and that the distribution of CRS scores changes every time an eligible profile is submitted, updated, or expires.
| CRS Score Range | 2018 number | 2018% | 2019 number | 2019% | 2020 number | 2020% |
|---|---|---|---|---|---|---|
| 701-1200 | 4 | <1% | 7 | <1% | 15 | <1% |
| 651-700 | 32 | <1% | 35 | <1% | 38 | <1% |
| 601-650 | 90 | <1% | 96 | <1% | 146 | <1% |
| 551-600 | 413 | <1% | 426 | <1% | 672 | <1% |
| 501-550 | 2,982 | 2% | 3,797 | 2% | 6,053 | 2% |
| 451-500 | 35,853 | 18% | 53,532 | 22% | 71,232 | 27% |
| 401-450 | 62,856 | 32% | 67,444 | 28% | 73,812 | 28% |
| 351-400 | 56,634 | 29% | 69,614 | 29% | 72,129 | 27% |
| 301-350 | 30,650 | 16% | 37,592 | 16% | 36,112 | 14% |
| 251-300 | 4,186 | 2% | 4,783 | 2% | 4,856 | 2% |
| 201-250 | 1,205 | 1% | 1,133 | <1% | 1,081 | <1% |
| 151-200 | 567 | <1% | 492 | <1% | 390 | <1% |
| 101-150 | 154 | <1% | 140 | <1% | 113 | <1% |
| 1-100 | 45 | <1% | 24 | <1% | 9 | <1% |
| Total | 195,670 | 100% | 239,115 | 100% | 266,658 | 100% |
Source: IRCC-EDW (MBR) as of January 12, 2021
Data is operational and as such should be considered preliminary and subject to change.
Among individuals who submitted eligible profiles in 2020, a majority (63%) did not meet criteria for any additional points at the time of submission—this represents a gradual reduction since 2018 (71%) (Table 3)Footnote v. Candidates continued to most often meet criteria for Education in Canada (17%) and Siblings in Canada (13%) points, with Education in Canada experiencing significant growth. The proportion of candidates in the Express Entry pool who met criteria for additional points for having a sibling in Canada and for being proficient in FrenchFootnote vi has remained stable over the last three years, following the introduction of these point types in June 2017.
| Additional point type | 2018 number | 2018% | 2019 number | 2019% | 2020 number | 2020% |
|---|---|---|---|---|---|---|
| No additional points | 138,143 | 71% | 164,740 | 69% | 168,565 | 63% |
| Arranged employment | 9,694 | 5% | 12,841 | 5% | 18,091 | 7% |
| Education in Canada | 22,453 | 11% | 30,055 | 13% | 45,529 | 17% |
| French-language proficiency | 7,180 | 4% | 9,356 | 4% | 12,806 | 5% |
| Siblings in Canada | 23,590 | 12% | 29,670 | 12% | 33,403 | 13% |
| TotalFootnote * | 195,670 | 239,115 | 266,658 |
Source: IRCC-EDW (MBR) as of January 12, 2021
Note that the data is operational and may vary a bit compared to previous years’ reported numbers
In 2020, a higher number of men than women did not meet criteria for any additional points at the time of submitting an eligible profile, although this difference has diminished somewhat since 2018 (Table 4).
| Gender | 2018 number | 2018% | 2019 number | 2019% | 2020 number | 2020% |
|---|---|---|---|---|---|---|
| Men | 81,011 | 59% | 92,670 | 56% | 92,434 | 55% |
| Women | 57,122 | 41% | 72,043 | 44% | 76,104 | 45% |
| TotalFootnote * | 138,143 | 100% | 164,740 | 100% | 168,565 | 100% |
Source: IRCC-EDW (MBR) as of January 12, 2021
Note that the data is operational and may vary a bit compared to previous years’ reported numbers
Education in Canada and Siblings in Canada were the most common additional point types for which both men and women met criteria in 2020 (Tables 5-8).Footnote vii Although men and women tended to meet criteria for each additional point type in relative proportion to their overall representation among those with eligible profiles, a considerably higher number of men met the criteria for additional points for having arranged employment.
| Gender | 2018 number | 2018% | 2019 number | 2019% | 2020 number | 2020% |
|---|---|---|---|---|---|---|
| Men | 6,999 | 72% | 9,113 | 71% | 12,305 | 68% |
| Women | 2,695 | 28% | 3,726 | 29% | 5,780 | 32% |
| TotalFootnote * | 9,694 | 100% | 12,841 | 100% | 18,091 | 100% |
Source: IRCC-EDW (MBR) as of January 12, 2021
Note that the data is operational and may vary a bit compared to previous years’ reported numbers
| Gender | 2018 number | 2018% | 2019 number | 2019% | 2020 number | 2020% |
|---|---|---|---|---|---|---|
| Men | 13,194 | 59% | 17,297 | 58% | 25,768 | 57% |
| Women | 9,255 | 41% | 12,749 | 42% | 19,741 | 43% |
| TotalFootnote * | 22,453 | 100% | 30,055 | 100% | 45,529 | 100% |
Source: IRCC-EDW (MBR) as of January 12, 2021
Note that the data is operational and may vary a bit compared to previous years’ reported numbers
| Gender | 2018 number | 2018% | 2019 number | 2019% | 2020 number | 2020% |
|---|---|---|---|---|---|---|
| Men | 3,990 | 56% | 4,941 | 53% | 6,476 | 51% |
| Women | 3,189 | 44% | 4,412 | 47% | 6,329 | 49% |
| TotalFootnote * | 7,180 | 100% | 9,356 | 100% | 12,806 | 100% |
Source: IRCC-EDW (MBR) as of January 12, 2021
Note that the data is operational and may vary a bit compared to previous years’ reported numbers
| Gender | 2018 number | 2018% | 2019 number | 2019% | 2020 number | 2020% |
|---|---|---|---|---|---|---|
| Men | 12,670 | 54% | 15,679 | 53% | 17,120 | 51% |
| Women | 10,915 | 46% | 13,983 | 47% | 16,272 | 49% |
| TotalFootnote * | 23,590 | 100% | 29,670 | 100% | 33,403 | 100% |
Source: IRCC-EDW (MBR) as of January 12, 2021
Note that the data is operational and may vary a bit compared to previous years’ reported numbers
Who did we invite to apply for permanent residence through Express Entry?
As displayed in Table 9, IRCC held 37 ITA rounds and issued 107,350 invitations in 2020, an increase of 26% from the 85,300 invitations issued in 2019.Footnote viii In 2020, more than half (54%) of the total invitations issued were under the Canadian Experience Class, a significant increase from 2019 (36%) reflecting IRCC’s shift to Canadian Experience Class-specific rounds of invitations following the outbreak of the COVID-19 pandemic. Correspondingly, the proportion of 2020 invitations issued under the Federal Skilled Worker Program dropped to 32%, from 45% in 2019; and the proportion of invitations issued under the Provincial Nomination Program also decreased from 18% in 2019 to 13% in 2020.
21 of the 37 rounds of invitations held in 2020 were program-specific, meaning that only candidates eligible for a specific program were invited to apply for permanent residence. 10 of these rounds invited candidates who were Canadian Experience Class-eligible, while 10 other rounds invited candidates who had received provincial nominations. CRS cut-off scores ranged from 687 to 808 for Provincial Nominee Program-specific rounds (median = 719), and from 431 to 467 for Canadian Experience Class-specific rounds ranged (median = 447). There was also one program-specific round for candidates eligible for the Federal Skilled Trades Program, with a cut-off score of 415. These program‑specific ITA rounds were conducted in line with the associated Ministerial Instructions.
Excluding these program-specific ITA rounds, the CRS cut-off score ranged from 468 to 478 in 2020 (median = 471.5), compared to 438 to 475 for non-program-specific ITA rounds in 2019 (median = 461). The rise in the median CRS cut‑off score suggests that the Express Entry pool became more competitive in 2020 for candidates who were eligible to be invited under the Federal Skilled Worker Program and Federal Skilled Trades Program, as a result of IRCC’s efforts to target invitations at in-Canada Express Entry candidates.
| Invitation to apply date | Round TypeFootnote * | CRS cut-off | Canadian Experience Class (CEC) | Provincial/Territorial Nominee (PNP) | Federal Skilled Worker (FSW) | Federal Skilled Trades (FST) | Total |
|---|---|---|---|---|---|---|---|
| 2020-01-08 | General | 473 | 1,385 | 734 | 1,281 | 0 | 3,400 |
| 2020-01-22 | General | 471 | 1,212 | 915 | 1,273 | 0 | 3,400 |
| 2020-02-05 | General | 472 | 1,546 | 658 | 1,296 | 0 | 3,500 |
| 2020-02-19 | General | 470 | 1,822 | 663 | 2,015 | 0 | 4,500 |
| 2020-03-04 | General | 471 | 1,733 | 714 | 1,453 | 0 | 3,900 |
| 2020-03-18 | PNP | 720 | 0 | 668 | 0 | 0 | 668 |
| 2020-03-23 | CEC | 467 | 3,232 | 0 | 0 | 0 | 3,232 |
| 2020-04-09 | PNP | 698 | 0 | 606 | 0 | 0 | 606 |
| 2020-04-09 | CEC | 464 | 3,294 | 0 | 0 | 0 | 3,294 |
| 2020-04-15 | PNP | 808 | 0 | 118 | 0 | 0 | 118 |
| 2020-04-16 | CEC | 455 | 3,782 | 0 | 0 | 0 | 3,782 |
| 2020-04-29 | PNP | 692 | 0 | 589 | 0 | 0 | 589 |
| 2020-04-30 | CEC | 452 | 3,311 | 0 | 0 | 0 | 3,311 |
| 2020-05-13 | PNP | 718 | 0 | 529 | 0 | 0 | 529 |
| 2020-05-14 | CEC | 447 | 3,371 | 0 | 0 | 0 | 3,371 |
| 2020-05-27 | PNP | 757 | 0 | 385 | 0 | 0 | 385 |
| 2020-05-28 | CEC | 440 | 3,515 | 0 | 0 | 0 | 3,515 |
| 2020-06-10 | PNP | 743 | 0 | 341 | 0 | 0 | 341 |
| 2020-06-11 | CEC | 437 | 3,559 | 0 | 0 | 0 | 3,559 |
| 2020-06-24 | PNP | 696 | 0 | 392 | 0 | 0 | 392 |
| 2020-06-25 | CEC | 431 | 3,508 | 0 | 0 | 0 | 3,508 |
| 2020-07-08 | General | 478 | 591 | 422 | 2,887 | 0 | 3,900 |
| 2020-07-22 | PNP | 687 | 0 | 557 | 0 | 0 | 557 |
| 2020-07-23 | CEC | 445 | 3,343 | 0 | 0 | 0 | 3,343 |
| 2020-08-05 | General | 476 | 911 | 582 | 2,407 | 0 | 3,900 |
| 2020-08-06 | FST | 415 | 0 | 0 | 0 | 250 | 250 |
| 2020-08-19 | PNP | 771 | 0 | 600 | 0 | 0 | 600 |
| 2020-08-20 | CEC | 454 | 3,300 | 0 | 0 | 0 | 3,300 |
| 2020-09-02 | General | 475 | 1,083 | 453 | 2,664 | 0 | 4,200 |
| 2020-09-16 | General | 472 | 1,453 | 441 | 2,305 | 1 | 4,200 |
| 2020-09-30 | General | 471 | 1,474 | 539 | 2,187 | 0 | 4,200 |
| 2020-10-14 | General | 471 | 1,673 | 486 | 2,341 | 0 | 4,500 |
| 2020-11-05 | General | 478 | 1,807 | 1,037 | 1,656 | 0 | 4,500 |
| 2020-11-18 | General | 472 | 1,951 | 439 | 2,610 | 0 | 5,000 |
| 2020-11-25 | General | 469 | 1,676 | 258 | 3,066 | 0 | 5,000 |
| 2020-12-09 | General | 469 | 2,089 | 530 | 2,381 | 0 | 5,000 |
| 2020-12-23 | General | 468 | 1,580 | 553 | 2,867 | 0 | 5,000 |
| Total | 58,201 | 14,209 | 34,689 | 251 | 107,350 |
Source: IRCC-EDW (MBR) as of January 12, 2021
Data is operational and as such should be considered preliminary and subject to change.
Overall, as displayed in Tables 10 and 11, in 2020, men received more than half of the invitations issued (57%). This aligns with the higher representation of men in the eligible profiles submitted in 2020 (55%; figures from Table 1). The invitation by program pattern was similar for men and women: both genders received invitations under Canadian Experience Class most often and under Federal Skilled Trades Program least often. While the number of men invited to apply to the Provincial Nominee Program held even with 2019, the number of women invited under the same program dropped by 11%. For both women and men, invitations under the Federal Skilled Trades Program dropped by three-quarters from 2019 to 2020. From 2018 to 2020, 28 invitations were issued to candidates of an unspecified gender and nine invitations were issued to a candidate with another gender. Because of these small counts, the data presented below is not broken down by gender categorized as “unspecified” or “another.” The number of invitations issued to candidates with an unspecified or another gender was 6 in 2018, 5 in 2019 and 26 in 2020.
| Program | 2018 number | 2018% | 2019 number | 2019% | 2020 number | 2020% |
|---|---|---|---|---|---|---|
| Canadian Experience Class | 18,583 | 35% | 18,184 | 37% | 33,763 | 56% |
| Provincial/Territorial Nominee | 6,931 | 13% | 8,962 | 18% | 8,909 | 15% |
| Federal Skilled Worker | 26,231 | 50% | 21,153 | 43% | 17,853 | 29% |
| Federal Skilled Trades | 729 | 1% | 765 | 2% | 195 | 0% |
| Total | 52,474 | 100% | 49,064 | 100% | 60,720 | 100% |
Source: IRCC-EDW (MBR) as of January 12, 2021
Data is operational and as such should be considered preliminary and subject to change.
| Program | 2018 number | 2018% | 2019 number | 2019% | 2020 number | 2020% |
|---|---|---|---|---|---|---|
| Canadian Experience Class | 11,987 | 32% | 12,378 | 34% | 24,416 | 52% |
| Provincial/Territorial Nominee | 3,871 | 10% | 5,966 | 16% | 5,298 | 11% |
| Federal Skilled Worker | 21,287 | 57% | 17,652 | 49% | 16,834 | 36% |
| Federal Skilled Trades | 175 | 0% | 235 | 1% | 56 | 0% |
| Total | 37,320 | 100% | 36,231 | 100% | 46,604 | 100% |
Source: IRCC-EDW (MBR) as of January 12, 2021
Data is operational and as such should be considered preliminary and subject to change.
The socio-demographic characteristics of the candidates invited to apply for permanent residence shifted significantly from 2019 to 2020, reflecting the impacts of focusing invitations at in-Canada populations (Tables 12 to 15). From 2019 to 2020, the share of invitations issued to candidates aged 20-29 (the age category associated with the highest number of points under the CRS) increased from just over half to almost two-thirds. Candidates invited to apply for permanent residence in 2020 were marginally less well-educated than in previous years, with fewer masters and entry-to-practice graduates receiving invitations; however, overall candidates who received invitations to apply remained highly educated, with more than 90% claiming post-secondary educational credentials of at least three years. In 2020, more invitations went to candidates with one or two years of eligible Canadian work experience, while fewer candidates with significant foreign work experience were invited to apply.
| Age category | 2018 number | 2018% | 2019 number | 2019% | 2020 number | 2020% |
|---|---|---|---|---|---|---|
| 19-29 | 46,038 | 51% | 47,165 | 55% | 67,933 | 63% |
| 30-34 | 30,281 | 34% | 26,692 | 31% | 25,726 | 24% |
| 35-39 | 10,045 | 11% | 8,078 | 9% | 9,158 | 9% |
| 40-44 | 2,246 | 3% | 2,260 | 3% | 3,011 | 3% |
| 45+ | 1,190 | 1% | 1,101 | 1% | 1,519 | 1% |
| Total | 89,800 | 100% | 85,300 | 100% | 107,350 | 100% |
Source: IRCC-EDW (MBR) as of January 12, 2021
Data is operational and as such should be considered preliminary and subject to change.
| Education level | 2018 number | 2018% | 2019 number | 2019% | 2020 number | 2020% |
|---|---|---|---|---|---|---|
| High school or less | 1,441 | 2% | 1,158 | 1% | 923 | 1% |
| One or two year post-secondary credential | 4,291 | 5% | 4,395 | 5% | 7,552 | 7% |
| Post-secondary credential of three years or longer | 37,635 | 42% | 35,780 | 42% | 49,661 | 46% |
| Master's Degree or entry-to-practice professional degree | 43,008 | 48% | 40,673 | 48% | 45,521 | 42% |
| PhD | 3,425 | 4% | 3,294 | 4% | 3,693 | 3% |
| Total | 89,800 | 100% | 85,300 | 100% | 107,350 | 100% |
Source: IRCC-EDW (MBR) as of January 12, 2021
Data is operational and as such should be considered preliminary and subject to change.
| Experience level | 2018 number | 2018% | 2019 number | 2019% | 2020 number | 2020% |
|---|---|---|---|---|---|---|
| No work experience or less than one year | 53,460 | 60% | 47,733 | 56% | 41,958 | 39% |
| 1 year | 24,964 | 28% | 26,054 | 31% | 43,334 | 40% |
| 2 years | 8,456 | 9% | 8,951 | 10% | 17,883 | 17% |
| 3 years | 1,790 | 2% | 1,618 | 2% | 3,035 | 3% |
| 4 years | 613 | 1% | 504 | 1% | 616 | 1% |
| 5 years or more | 517 | 1% | 440 | 1% | 524 | 0% |
| Total | 89,800 | 100% | 85,300 | 100% | 107,350 | 100% |
Source: IRCC-EDW (MBR) as of January 12, 2021
Data is operational and as such should be considered preliminary and subject to change.
| Experience level | 2018 number | 2018% | 2019 number | 2019% | 2020 number | 2020% |
|---|---|---|---|---|---|---|
| No work experience or less than one year | 18,938 | 21% | 17,762 | 21% | 33,751 | 31% |
| 1 year | 7,292 | 8% | 6,101 | 7% | 8,310 | 8% |
| 2 years | 6,909 | 8% | 4,995 | 6% | 5,619 | 5% |
| 3 years | 12,136 | 14% | 15,189 | 18% | 18,605 | 17% |
| 4 years | 9,871 | 11% | 11,016 | 13% | 12,227 | 11% |
| 5 years or more | 34,654 | 39% | 30,237 | 35% | 28,838 | 27% |
| Total | 89,800 | 100% | 85,300 | 100% | 107,350 | 100% |
Source: IRCC-EDW (MBR) as of January 12, 2021
Data is operational and as such should be considered preliminary and subject to change.
Table 16 provides information on (a) the number of invitations issued to candidates who were assigned additional points in each category and (b) the number of invitations issued to candidates who met relevant criteria for the category but were not necessarily assigned pointsFootnote ix. For example, in 2020, 17,249 invitations were issued to candidates who met criteria for Arranged Employment points, but only 15,453 of these candidates were actually assigned the associated points. Data are provided for both conditions to facilitate comparison, as well as to reflect the fuller characteristics of candidates who received an invitation to apply for permanent residenceFootnote x.
In 2020, less than one third of invitations to apply (28%) were issued on the basis of human capital attributes alone (i.e., to candidates who did not meet criteria for any additional points)—this represents a decrease of 12 percentage points since 2019 (as reported in the 2019 Express Entry Year End Report).
Compared to all candidates who submitted eligible profiles in 2020 (refer to Table 3), a smaller proportion of invited candidates met none of the criteria for additional points (28% vs. 63%). More specifically, a higher proportion of invited candidates met criteria for Arranged Employment points (16% vs. 7%), for Education in Canada points (42% vs. 17%), and for French-language proficiency points (7% vs. 5%), compared to all eligible profiles submitted in 2020. A smaller proportion of invited candidates met criteria for Siblings in Canada points (12%), compared to all eligible profiles submitted (13%).
| Additional point typeFootnote * | Number | % |
|---|---|---|
| Assigned additional points | ||
| No Additional Points | 30,376 | 28% |
| Provincial Nominee | 14,209 | 13% |
| Arranged Employment | 15,453 | 14% |
| Education in Canada | 41,470 | 39% |
| French-language proficiency | 6,157 | 6% |
| Siblings in Canada | 11,105 | 10% |
| Met criteria for points | ||
| No Additional Points | 30,376 | 28% |
| Provincial Nominee | 14,209 | 13% |
| Arranged Employment | 17,249 | 16% |
| Education in Canada | 45,548 | 42% |
| French-language proficiency | 7,105 | 7% |
| Siblings in Canada | 12,827 | 12% |
| Total | 107,350 | |
Source: IRCC-EDW (MBR) as of January 12, 2021
Data is operational and as such should be considered preliminary and subject to change.
Tables 17 to 20 display the number of invitations issued to men and women who met the criteria to receive each additional point type, regardless of whether candidates were actually assigned those points. In general, the proportion of male versus female invited candidates who met the criteria for each additional point type roughly aligns with the proportion of eligible profiles submitted by men and women (e.g., in 2020, 55% of eligible profiles were submitted by men and 45% by women; see Table 1 for figures). However, in 2020 a considerably higher proportion of the candidates with arranged employment points who received an invitation to apply were men (66%) than women (34%).
| Gender | 2018 number | 2018% | 2019 number | 2019% | 2020 number | 2020% |
|---|---|---|---|---|---|---|
| Men | 6,681 | 72% | 7,633 | 70% | 11,300 | 66% |
| Women | 2,627 | 28% | 3,272 | 30% | 5,943 | 34% |
| TotalFootnote * | 9,308 | 100% | 10,905 | 100% | 17,249 | 100% |
Source: IRCC-EDW (MBR) as of January 12, 2021
Data is operational and as such should be considered preliminary and subject to change.
| Gender | 2018 number | 2018% | 2019 number | 2019% | 2020 number | 2020% |
|---|---|---|---|---|---|---|
| Men | 13,610 | 59% | 13,878 | 58% | 25,898 | 57% |
| Women | 9,283 | 41% | 9,973 | 42% | 19,635 | 43% |
| TotalFootnote * | 22,897 | 100% | 23,853 | 100% | 45,548 | 100% |
Source: IRCC-EDW (MBR) as of January 12, 2021
Data is operational and as such should be considered preliminary and subject to change.
| Gender | 2018 number | 2018% | 2019 number | 2019% | 2020 number | 2020% |
|---|---|---|---|---|---|---|
| Men | 2,567 | 56% | 2,887 | 52% | 3,529 | 50% |
| Women | 2,055 | 44% | 2,631 | 48% | 3,575 | 50% |
| TotalFootnote * | 4,623 | 100% | 5,518 | 100% | 7,105 | 100% |
Source: IRCC-EDW (MBR) as of January 12, 2021
Data is operational and as such should be considered preliminary and subject to change.
| Gender | 2018 number | 2018% | 2019 number | 2019% | 2020 number | 2020% |
|---|---|---|---|---|---|---|
| Men | 5,637 | 54% | 5,259 | 53% | 6,558 | 51% |
| Women | 4,842 | 46% | 4,739 | 47% | 6,263 | 49% |
| TotalFootnote * | 10,479 | 100% | 10,001 | 100% | 12,827 | 100% |
Source: IRCC-EDW (MBR) as of January 12, 2021
Data is operational and as such should be considered preliminary and subject to change.
Consistent with 2018 and 2019, occupations in information technology, and business and financial services continued to dominate among candidates invited to apply for permanent residence; however, 2020 saw significant growth in occupations such as food service supervisor and administrative assistant—likely resulting from the shift to Canadian Experience Class-specific rounds of invitations following the declaration of the pandemic (Table 21).
| Primary Occupation | Skill type | 2018 | Primary Occupation | Skill type | 2019 | Primary Occupation | Skill type | 2020 |
|---|---|---|---|---|---|---|---|---|
| 2173 Software engineers and designers | A | 6,126 | 2173 Software engineers and designers | A | 6,529 | 2173 Software engineers and designers | A | 6,665 |
| 2171 Information systems analysts and consultants | A | 5,429 | 2171 Information systems analysts and consultants | A | 4,645 | 2171 Information systems analysts and consultants | A | 4,846 |
| 2174 Computer programmers and interactive media developers | A | 3,450 | 2174 Computer programmers and interactive media developers | A | 3,819 | 2174 Computer programmers and interactive media developers | A | 4,661 |
| 1111 Financial auditors and accountants | A | 2,483 | 1111 Financial auditors and accountants | A | 2,607 | 6311 Food service supervisors | B | 4,228 |
| 1241 Administrative assistants | B | 2,335 | 1241 Administrative assistants | B | 2,407 | 1241 Administrative assistants | B | 4,041 |
| 1123 Professional occupations in advertising, marketing and public relations | A | 2,049 | 1122 Professional occupations in business management consulting | A | 1,838 | 1111 Financial auditors and accountants | A | 2,623 |
| 4011 University professors and lecturers | A | 1,942 | 1123 Professional occupations in advertising, marketing and public relations | A | 1,808 | 1221 Administrative officers | B | 2,366 |
| 1112 Financial and investment analysts | A | 1,921 | 1221 Administrative officers | B | 1,694 | 1123 Professional occupations in advertising, marketing and public relations | A | 2,327 |
| 1122 Professional occupations in business management consulting | A | 1,915 | 4011 University professors and lecturers | A | 1,684 | 1311 Accounting technicians and bookkeepers | B | 2,128 |
| 0124 Advertising, marketing and public relations managers | 0 | 1,775 | 0124 Advertising, marketing and public relations managers | 0 | 1,588 | 6211 Retail sales supervisors | B | 2,119 |
| 1221 Administrative officers | B | 1,456 | 1112 Financial and investment analysts | A | 1,549 | 2282 User support technicians | B | 2,043 |
| 6311 Food service supervisors | B | 1,435 | 6311 Food service supervisors | B | 1,544 | 4011 University professors and lecturers | A | 1,823 |
| 0213 Computer and information systems managers | 0 | 1,409 | 1311 Accounting technicians and bookkeepers | B | 1,484 | 2172 Database analysts and data administrators | A | 1,767 |
| 2132 Mechanical engineers | A | 1,274 | 2132 Mechanical engineers | A | 1,416 | 0621 Retail and wholesale trade managers | 0 | 1,699 |
| 1311 Accounting technicians and bookkeepers | B | 1,196 | 2172 Database analysts and data administrators | A | 1,312 | 1122 Professional occupations in business management consulting | A | 1,680 |
| Other | 53,605 | 49,376 | 62,334 | |||||
| Total | 89,800 | Total | 85,300 | Total | 107,350 |
Source: IRCC-EDW (MBR) as of January 12, 2021
Data is operational and as such should be considered preliminary and subject to change.
Skill Type 0: management jobs
Skill Level A: professional jobs that usually call for a degree from a university
Skill Level B: technical jobs and skilled trades that usually call for a college diploma or training as an apprentice
At the time of invitation, the primary occupations of men and women differed to some extent (Tables 22 to 23). For example, from 2018-2020, the most common occupation among women who received an invitation to apply was Administrative Assistant, which was not among the most common primary occupations for men in 2018 or 2019, and was only tenth-most-common in 2020. In a departure from previous years, 2020 saw equal numbers of higher-skilled occupations among the top 15 most common primary occupations of both men and women invited to apply for permanent residence—however, lower-skilled occupations remained more common for women than for men.
| Primary occupation | Skill type | 2018 | Primary occupation | Skill type | 2019 | Primary occupation | Skill type | 2020 |
|---|---|---|---|---|---|---|---|---|
| 2173 Software engineers and designers | A | 4,574 | 2173 Software engineers and designers | A | 4,845 | 2173 Software engineers and designers | A | 5,002 |
| 2171 Information systems analysts and consultants | A | 3,837 | 2171 Information systems analysts and consultants | A | 3,213 | 2174 Computer programmers and interactive media developers | A | 3,560 |
| 2174 Computer programmers and interactive media developers | A | 2,579 | 2174 Computer programmers and interactive media developers | A | 2,835 | 2171 Information systems analysts and consultants | A | 3,335 |
| 1111 Financial auditors and accountants | A | 1,258 | 2132 Mechanical engineers | A | 1,284 | 6311 Food service supervisors | B | 1,754 |
| 1112 Financial and investment analysts | A | 1,190 | 1111 Financial auditors and accountants | A | 1,277 | 2282 User support technicians | B | 1,350 |
| 2132 Mechanical engineers | A | 1,167 | 1122 Professional occupations in business management consulting | A | 1,055 | 6211 Retail sales supervisors | B | 1,268 |
| 1122 Professional occupations in business management consulting | A | 1,132 | 0213 Computer and information systems managers | 0 | 1,002 | 2132 Mechanical engineers | A | 1,227 |
| 0213 Computer and information systems managers | 0 | 1,078 | 1112 Financial and investment analysts | A | 911 | 1111 Financial auditors and accountants | A | 1,181 |
| 4011 University professors and lecturers | A | 998 | 4011 University professors and lecturers | A | 898 | 2172 Database analysts and data administrators | A | 1,125 |
| 2133 Electrical and electronics engineers | A | 925 | 2172 Database analysts and data administrators | A | 878 | 1241 Administrative assistants | B | 1,120 |
| 0124 Advertising, marketing and public relations managers | 0 | 901 | 0124 Advertising, marketing and public relations managers | 0 | 787 | 1215 Supervisors, supply chain, tracking and scheduling co-ordination occupations | B | 1,091 |
| 1123 Professional occupations in advertising, marketing and public relations | A | 806 | 0621 Retail and wholesale trade managers | 0 | 746 | 0621 Retail and wholesale trade managers | 0 | 1,060 |
| 2282 User support technicians | B | 779 | 2282 User support technicians | B | 740 | 0213 Computer and information systems managers | 0 | 1,030 |
| 0621 Retail and wholesale trade managers | 0 | 737 | 2133 Electrical and electronics engineers | A | 719 | 4011 University professors and lecturers | A | 999 |
| 2131 Civil engineers | A | 725 | 6322 Cooks | B | 712 | 6322 Cooks | B | 960 |
| Other | 29,788 | Other | 27,162 | Other | 34,658 | |||
| Total | 52,474 | Total | 49,064 | Total | 60,720 |
Source: IRCC-EDW (MBR) as of January 12, 2021
Data is operational and as such should be considered preliminary and subject to change.
Skill Type 0: management jobs
Skill Level A: professional jobs that usually call for a degree from a university
Skill Level B: technical jobs and skilled trades that usually call for a college diploma or training as an apprentice
| Primary occupation | Skill type | 2018 | Primary occupation | Skill type | 2019 | Primary occupation | Skill type | 2020 |
|---|---|---|---|---|---|---|---|---|
| 1241 Administrative assistants | B | 1,734 | 1241 Administrative assistants | B | 1,786 | 1241 Administrative assistants | B | 2,921 |
| 2171 Information systems analysts and consultants | A | 1,592 | 2173 Software engineers and designers | A | 1,683 | 6311 Food service supervisors | B | 2,473 |
| 2173 Software engineers and designers | A | 1,552 | 2171 Information systems analysts and consultants | A | 1,431 | 2173 Software engineers and designers | A | 1,661 |
| 1123 Professional occupations in advertising, marketing and public relations | A | 1,243 | 1111 Financial auditors and accountants | A | 1,330 | 1221 Administrative officers | B | 1,535 |
| 1111 Financial auditors and accountants | A | 1,225 | 1123 Professional occupations in advertising, marketing and public relations | A | 1,135 | 2171 Information systems analysts and consultants | A | 1,511 |
| 1221 Administrative officers | B | 952 | 1221 Administrative officers | B | 1,119 | 1123 Professional occupations in advertising, marketing and public relations | A | 1,462 |
| 4011 University professors and lecturers | A | 944 | 2174 Computer programmers and interactive media developers | A | 984 | 1111 Financial auditors and accountants | A | 1,442 |
| 0124 Advertising, marketing and public relations managers | 0 | 873 | 1311 Accounting technicians and bookkeepers | B | 860 | 1311 Accounting technicians and bookkeepers | B | 1,254 |
| 2174 Computer programmers and interactive media developers | A | 871 | 6311 Food service supervisors | B | 837 | 2174 Computer programmers and interactive media developers | A | 1,101 |
| 1122 Professional occupations in business management consulting | A | 783 | 0124 Advertising, marketing and public relations managers | 0 | 801 | 0124 Advertising, marketing and public relations managers | 0 | 885 |
| 1112 Financial and investment analysts | A | 731 | 4011 University professors and lecturers | A | 786 | 6211 Retail sales supervisors | B | 850 |
| 6311 Food service supervisors | B | 730 | 1122 Professional occupations in business management consulting | A | 783 | 4011 University professors and lecturers | A | 823 |
| 1311 Accounting technicians and bookkeepers | B | 710 | 1112 Financial and investment analysts | A | 638 | 1122 Professional occupations in business management consulting | A | 801 |
| 4021 College and other vocational instructors | A | 703 | 4021 College and other vocational instructors | A | 571 | 0631 Restaurant and food service managers | 0 | 800 |
| 4214 Early childhood educators and assistants | A | 623 | 0631 Restaurant and food service managers | 0 | 570 | 6235 Financial sales representatives | B | 734 |
| Other | B | 22,054 | Other | 20,917 | Other | 26,351 | ||
| Total | 37,320 | Total | 36,231 | Total | 46,604 |
Source: IRCC-EDW (MBR) as of January 12, 2021
Data is operational and as such should be considered preliminary and subject to change.
Skill Type 0: management jobs
Skill Level A: professional jobs that usually call for a degree from a university
Skill Level B: technical jobs and skilled trades that usually call for a college diploma or training as an apprentice
Table 24 displays the most common occupations among candidates who were assigned arranged employment points and were invited to apply in 2020. This sub‑population features a larger proportion of candidates in lower-skilled occupations, such as food service supervisors (12%) and cooks (4%), compared to the full population of candidates who received an invitation to apply for permanent residence in 2020.
| Arranged employment occupation | Skill type | 2018 | Arranged employment occupation | Skill type | 2019 | Arranged employment occupation | Skill type | 2020 |
|---|---|---|---|---|---|---|---|---|
| 2173 Software engineers and designers | A | 783 | 2174 Computer programmers and interactive media developers | A | 917 | 6311 Food service supervisors | B | 1,997 |
| 2174 Computer programmers and interactive media developers | A | 604 | 2173 Software engineers and designers | A | 870 | 2174 Computer programmers and interactive media developers | A | 1,601 |
| 6322 Cooks | B | 594 | 6311 Food service supervisors | B | 838 | 2173 Software engineers and designers | A | 1,377 |
| 6311 Food service supervisors | B | 525 | 6322 Cooks | B | 692 | 2171 Information systems analysts and consultants | A | 1,032 |
| 2171 Information systems analysts and consultants | A | 490 | 2171 Information systems analysts and consultants | A | 647 | 6322 Cooks | B | 677 |
| 4011 University professors and lecturers | A | 430 | 4011 University professors and lecturers | A | 501 | 1241 Administrative assistants | B | 615 |
| 5241 Graphic designers and illustrators | A | 392 | 0013 Senior managers - financial, communications and other business services | 0 | 364 | 0213 Computer and information systems managers | 0 | 560 |
| 0213 Computer and information systems managers | 0 | 282 | 0213 Computer and information systems managers | 0 | 336 | 4011 University professors and lecturers | A | 558 |
| 0013 Senior managers - financial, communications and other business services | 0 | 264 | 5241 Graphic designers and illustrators | A | 331 | 6211 Retail sales supervisors | B | 531 |
| 0016 Senior managers - construction, transportation, production and utilities | 0 | 185 | 1241 Administrative assistants | B | 218 | 0013 Senior managers - financial, communications and other business services | 0 | 491 |
| 6211 Retail sales supervisors | B | 153 | 6211 Retail sales supervisors | B | 209 | 1221 Administrative officers | B | 440 |
| 1221 Administrative officers | B | 136 | 1221 Administrative officers | B | 192 | 0016 Senior managers - construction, transportation, production and utilities | 0 | 298 |
| 3111 Specialist physicians | A | 133 | 0016 Senior managers - construction, transportation, production and utilities | 0 | 180 | 1311 Accounting technicians and bookkeepers | B | 281 |
| 8252 Agricultural service contractors, farm supervisors and specialized livestock workers | B | 127 | 0015 Senior managers - trade, broadcasting and other services, n.e.c. | 0 | 157 | 1215 Supervisors, supply chain, tracking and scheduling co-ordination occupations | B | 277 |
| 1241 Administrative assistants | B | 122 | 8252 Agricultural service contractors, farm supervisors and specialized livestock workers | B | 142 | 0631 Restaurant and food service managers | 0 | 269 |
| Other | 4,088 | Other | 4,311 | Other | 6,245 | |||
| Total | 9,308 | Total | 10,905 | Total | 17,249 |
Source: IRCC-EDW (MBR) as of January 12, 2021
Data is operational and as such should be considered preliminary and subject to change.
Skill Type 0: management jobs
Skill Level A: professional jobs that usually call for a degree from a university
Skill Level B: technical jobs and skilled trades that usually call for a college diploma or training as an apprentice
As displayed in Tables 25 and 26, the most common occupations among both men and women who met the criteria for arranged employment points and received an invitation to apply for permanent residence were similar to those observed for the total population of those who met the same criteria. In addition, the most common occupations among invited women with arranged employment points included more lower-skilled occupations in comparison to their male counterparts.
| Arranged employment occupation | Skill type | 2018 | Arranged employment occupation | Skill type | 2019 | Arranged employment occupation | Skill type | 2020 |
|---|---|---|---|---|---|---|---|---|
| 2173 Software engineers and designers | A | 697 | 2173 Software engineers and designers | A | 788 | 2174 Computer programmers and interactive media developers | A | 1,342 |
| 2174 Computer programmers and interactive media developers | A | 515 | 2174 Computer programmers and interactive media developers | A | 770 | 2173 Software engineers and designers | A | 1,208 |
| 2171 Information systems analysts and consultants | A | 411 | 2171 Information systems analysts and consultants | A | 547 | 2171 Information systems analysts and consultants | A | 868 |
| 6322 Cooks | B | 381 | 6322 Cooks | B | 445 | 6311 Food service supervisors | B | 832 |
| 5241 Graphic designers and illustrators | B | 294 | 6311 Food service supervisors | B | 346 | 0213 Computer and information systems managers | 0 | 487 |
| 4011 University professors and lecturers | A | 288 | 4011 University professors and lecturers | A | 331 | 6322 Cooks | B | 446 |
| 6311 Food service supervisors | 0 | 273 | 0213 Computer and information systems managers | 0 | 294 | 0013 Senior managers - financial, communications and other business services | 0 | 390 |
| 0213 Computer and information systems managers | 0 | 242 | 0013 Senior managers - financial, communications and other business services | 0 | 292 | 4011 University professors and lecturers | A | 358 |
| 0013 Senior managers - financial, communications and other business services | B | 220 | 5241 Graphic designers and illustrators | B | 268 | 6211 Retail sales supervisors | B | 341 |
| 0016 Senior managers - construction, transportation, production and utilities | 0 | 168 | 0016 Senior managers - construction, transportation, production and utilities | 0 | 159 | 0016 Senior managers - construction, transportation, production and utilities | 0 | 249 |
| 7271 Carpenters | B | 110 | 6211 Retail sales supervisors | B | 139 | 1215 Supervisors, supply chain, tracking and scheduling co-ordination occupations | B | 213 |
| 6211 Retail sales supervisors | 0 | 101 | 0015 Senior managers - trade, broadcasting and other services, n.e.c. | 0 | 120 | 1241 Administrative assistants | B | 208 |
| 8252 Agricultural service contractors, farm supervisors and specialized livestock workers | B | 91 | 8252 Agricultural service contractors, farm supervisors and specialized livestock workers | B | 101 | 0015 Senior managers - trade, broadcasting and other services, n.e.c. | 0 | 187 |
| 3111 Specialist physicians | B | 86 | 7271 Carpenters | B | 97 | 5241 Graphic designers and illustrators | B | 173 |
| 0015 Senior managers - trade, broadcasting and other services, n.e.c. | B | 79 | 1215 Supervisors, supply chain, tracking and scheduling co-ordination occupations | B | 89 | 1221 Administrative officers | B | 147 |
| Other | 2,725 | Other | 2,847 | Other | 3,851 | |||
| Total | 6,681 | Total | 7,633 | Total | 11,300 |
Source: IRCC-EDW (MBR) as of January 12, 2021
Data is operational and as such should be considered preliminary and subject to change.
Skill Type 0: management jobs
Skill Level A: professional jobs that usually call for a degree from a university
Skill Level B: technical jobs and skilled trades that usually call for a college diploma or training as an apprentice
| Arranged employment occupation | Skill type | 2018 | Arranged employment occupation | Skill type | 2019 | Arranged employment occupation | Skill type | 2020 |
|---|---|---|---|---|---|---|---|---|
| 6311 Food service supervisors | B | 252 | 6311 Food service supervisors | B | 492 | 6311 Food service supervisors | B | 1,165 |
| 6322 Cooks | B | 213 | 6322 Cooks | B | 247 | 1241 Administrative assistants | B | 407 |
| 4011 University professors and lecturers | A | 142 | 4011 University professors and lecturers | A | 170 | 1221 Administrative officers | B | 293 |
| 4214 Early childhood educators and assistants | B | 102 | 2174 Computer programmers and interactive media developers | A | 147 | 2174 Computer programmers and interactive media developers | A | 259 |
| 5241 Graphic designers and illustrators | B | 98 | 1241 Administrative assistants | B | 139 | 4214 Early childhood educators and assistants | B | 250 |
| 1221 Administrative officers | B | 91 | 1221 Administrative officers | B | 119 | 6322 Cooks | B | 231 |
| 2174 Computer programmers and interactive media developers | A | 89 | 4214 Early childhood educators and assistants | B | 100 | 4011 University professors and lecturers | A | 200 |
| 2173 Software engineers and designers | A | 86 | 2171 Information systems analysts and consultants | A | 100 | 6211 Retail sales supervisors | B | 189 |
| 1241 Administrative assistants | B | 80 | 2173 Software engineers and designers | A | 82 | 1311 Accounting technicians and bookkeepers | B | 178 |
| 2171 Information systems analysts and consultants | A | 79 | 0013 Senior managers - financial, communications and other business services | 0 | 72 | 2173 Software engineers and designers | A | 168 |
| 1311 Accounting technicians and bookkeepers | B | 60 | 6211 Retail sales supervisors | B | 70 | 2171 Information systems analysts and consultants | A | 164 |
| 6211 Retail sales supervisors | B | 52 | 0631 Restaurant and food service managers | 0 | 70 | 0631 Restaurant and food service managers | 0 | 138 |
| 3111 Specialist physicians | A | 47 | 1311 Accounting technicians and bookkeepers | B | 70 | 0013 Senior managers - financial, communications and other business services | 0 | 100 |
| 0013 Senior managers - financial, communications and other business services | 0 | 44 | 5241 Graphic designers and illustrators | B | 63 | 5241 Graphic designers and illustrators | B | 91 |
| 2121 Biologists and related scientists | A | 41 | 1123 Professional occupations in advertising, marketing and public relations | A | 47 | 1123 Professional occupations in advertising, marketing and public relations | A | 83 |
| Other | 1,151 | Other | 1,284 | Other | 2,027 | |||
| Total | 2,627 | Total | 3,272 | Total | 5,943 |
Source: IRCC-EDW (MBR) as of January 12, 2021
Data is operational and as such should be considered preliminary and subject to change.
Skill Type 0: management jobs
Skill Level A: professional jobs that usually call for a degree from a university
Skill Level B: technical jobs and skilled trades that usually call for a college diploma or training as an apprentice
The five most common countries of residence among candidates who received an invitation to apply remained the same from 2018 to 2020 (Table 27). The proportion of invitations to apply for permanent residence that were issued to candidates who indicated Canada as their country of residence grew from 47% in 2019 to 63% in 2020, reflecting the growth in invitations to apply under the Canadian Experience Class. Over the same period, the proportion of invited candidates who indicated India as their country of residence dropped from 18% to 10%, while the share of invited candidates residing in the United States fell to 7% from 12%.
| Country of residence | 2018 | Country of residence | 2019 | Country of residence | 2020 |
|---|---|---|---|---|---|
| Canada | 39,923 | Canada | 40,517 | Canada | 67,570 |
| India | 17,647 | India | 15,107 | India | 11,259 |
| United States of America | 9,972 | United States of America | 10,004 | United States of America | 7,266 |
| Nigeria | 3,721 | Nigeria | 3,826 | Nigeria | 4,095 |
| United Arab Emirates | 2,030 | United Arab Emirates | 1,706 | United Arab Emirates | 1,412 |
| Pakistan | 1,366 | Pakistan | 1,178 | Pakistan | 1,309 |
| United Kingdom and Overseas Territories | 1,186 | Morocco | 862 | Australia | 1,081 |
| People's Republic of China | 878 | Australia | 776 | Lebanon | 998 |
| Australia | 834 | People's Republic of China | 775 | People's Republic of China | 916 |
| Saudi Arabia | 726 | United Kingdom and Overseas Territories | 720 | Morocco | 850 |
| Other | 11,517 | Other | 9,829 | Other | 10,594 |
| TotalFootnote * | 89,800 | TotalFootnote * | 85,300 | TotalFootnote * | 107,350 |
Source: IRCC-EDW (MBR) as of January 12, 2021
Data is operational and as such should be considered preliminary and subject to change.
As displayed in Tables 28 and 29, the most common countries of residence were similar for both men and women in 2018, 2019, and 2020. In 2020, smaller proportion of women (59%) than men (66%) indicated Canada as their country of residence.
| Country of residence | 2018 | Country of residence | 2019 | Country of residence | 2020 |
|---|---|---|---|---|---|
| Canada | 24,653 | Canada | 24,708 | Canada | 39,973 |
| India | 9,372 | India | 7,793 | India | 5,792 |
| United States of America | 6,555 | United States of America | 6,472 | United States of America | 4,564 |
| Nigeria | 1,572 | Nigeria | 1,607 | Nigeria | 1,556 |
| United Arab Emirates | 1,125 | United Arab Emirates | 899 | Pakistan | 750 |
| Pakistan | 833 | Pakistan | 667 | United Arab Emirates | 713 |
| United Kingdom and Overseas Territories | 660 | Morocco | 467 | Australia | 630 |
| Saudi Arabia | 509 | Australia | 457 | United Kingdom and Overseas Territories | 440 |
| Australia | 478 | United Kingdom and Overseas Territories | 399 | Morocco | 427 |
| People's Republic of China | 415 | People's Republic of China | 318 | People's Republic of China | 411 |
| Other | 6,302 | Other | 5,277 | Other | 5,464 |
| Total | 52,474 | Total | 49,064 | Total | 60,720 |
Source: IRCC-EDW (MBR) as of January 12, 2021
Data is operational and as such should be considered preliminary and subject to change.
| Country of residence | 2018 | Country of residence | 2019 | Country of residence | 2020 |
|---|---|---|---|---|---|
| Canada | 15,269 | Canada | 15,808 | Canada | 27,573 |
| India | 8,275 | India | 7,314 | India | 5,466 |
| United States of America | 3,417 | United States of America | 3,531 | United States of America | 2,702 |
| Nigeria | 2,149 | Nigeria | 2,219 | Nigeria | 2,539 |
| United Arab Emirates | 905 | United Arab Emirates | 805 | United Arab Emirates | 699 |
| Pakistan | 533 | Pakistan | 511 | Lebanon | 599 |
| United Kingdom and Overseas Territories | 526 | People's Republic of China | 457 | Pakistan | 559 |
| People's Republic of China | 463 | Morocco | 395 | People's Republic of China | 505 |
| Australia | 356 | United Kingdom and Overseas Territories | 321 | Australia | 451 |
| Republic of South Africa | 299 | Australia | 319 | Federal Republic of Cameroon | 445 |
| Other | 5,128 | Other | 4,551 | Other | 5,066 |
| Total | 37,320 | Total | 36,231 | Total | 46,604 |
Source: IRCC-EDW (MBR) as of January 12, 2021
Data is operational and as such should be considered preliminary and subject to change
As with country of residence, the five most common countries of citizenship among individuals who received an ITA did not change from 2018, to 2019, to 2020 (Table 30). Over the three-year period from 2018-2020, India was the most common country of citizenship of invited candidates by a significant margin (47%), followed by China (7%) and Nigeria (7%). From 2018 to 2020, the proportion of invited candidates who indicated citizenship outside of the ten most common countries remained stable at 25%.
| Country of citizenship | 2018 | Country of citizenship | 2019 | Country of citizenship | 2020 |
|---|---|---|---|---|---|
| India | 41,680 | India | 40,314 | India | 50,841 |
| People's Republic of China | 6,247 | Nigeria | 5,882 | People's Republic of China | 8,955 |
| Nigeria | 6,024 | People's Republic of China | 5,679 | Nigeria | 6,532 |
| Pakistan | 3,109 | Pakistan | 2,513 | Pakistan | 2,823 |
| United Kingdom and Overseas Territories | 2,542 | United Kingdom and Overseas Territories | 2,127 | United Kingdom and Overseas Territories | 2,689 |
| Brazil | 1,847 | Brazil | 1,805 | Brazil | 2,428 |
| United States of America | 1,804 | United States of America | 1,549 | Iran | 1,923 |
| France | 1,371 | Iran | 1,476 | Korea, Republic of | 1,653 |
| Iran | 1,299 | France | 1,460 | United States of America | 1,632 |
| Korea, Republic of | 1,254 | Korea, Republic of | 1,224 | Republic of Ireland | 1,563 |
| Other | 22,623 | Other | 21,271 | Other | 26,311 |
| TotalFootnote * | 89,800 | TotalFootnote * | 85,300 | TotalFootnote * | 107,350 |
Source: IRCC-EDW (MBR) as of January 12, 2021
Data is operational and as such should be considered preliminary and subject to change.
India, China and Nigeria were the most common countries of citizenship for both men and women who received an invitation to apply for permanent residence in 2020; however, a smaller proportion of invited women (41%) than invited men (52%) held Indian citizenship, while a larger proportion of invited women (11%) than invited men (6%) held Chinese citizenship (Tables 31 and 32).
| Country of citizenship | 2018 | Country of citizenship | 2019 | Country of citizenship | 2020 |
|---|---|---|---|---|---|
| India | 25,955 | India | 24,910 | India | 31,793 |
| Nigeria | 2,880 | Nigeria | 2,745 | People's Republic of China | 3,742 |
| People's Republic of China | 2,794 | People's Republic of China | 2,499 | Nigeria | 2,813 |
| Pakistan | 2,143 | Pakistan | 1,670 | Pakistan | 1,900 |
| United Kingdom and Overseas Territories | 1,568 | United Kingdom and Overseas Territories | 1,297 | United Kingdom and Overseas Territories | 1,632 |
| Brazil | 1,119 | Brazil | 1,053 | Brazil | 1,414 |
| United States of America | 1,083 | Iran | 889 | Iran | 1,126 |
| Iran | 793 | United States of America | 883 | Republic of Ireland | 941 |
| France | 783 | France | 757 | United States of America | 909 |
| Republic of Ireland | 753 | Republic of Ireland | 695 | France | 837 |
| Other | 12,603 | Other | 11,666 | Other | 13,613 |
| Total | 52,474 | Total | 49,064 | Total | 60,720 |
Source: IRCC-EDW (MBR) as of January 12, 2021
Data is operational and as such should be considered preliminary and subject to change.
| Country of citizenship | 2018 | Country of citizenship | 2019 | Country of citizenship | 2020 |
|---|---|---|---|---|---|
| India | 15,725 | India | 15,401 | India | 19,039 |
| People's Republic of China | 3,453 | People's Republic of China | 3,180 | People's Republic of China | 5,212 |
| Nigeria | 3,144 | Nigeria | 3,137 | Nigeria | 3,719 |
| United Kingdom and Overseas Territories | 974 | Pakistan | 843 | United Kingdom and Overseas Territories | 1,056 |
| Pakistan | 965 | United Kingdom and Overseas Territories | 830 | Brazil | 1,013 |
| Brazil | 728 | Brazil | 752 | Korea, Republic of | 1,012 |
| United States of America | 721 | France | 703 | Pakistan | 922 |
| Korea, Republic of | 687 | Korea, Republic of | 672 | Iran | 797 |
| France | 588 | Philippines | 667 | Philippines | 778 |
| Iran | 506 | United States of America | 666 | Lebanon | 720 |
| Other | 9,829 | Other | 9,380 | Other | 12,336 |
| Total | 37,320 | Total | 36,231 | Total | 46,604 |
Source: IRCC-EDW (MBR) as of January 12, 2021
Data is operational and as such should be considered preliminary and subject to change.
Who applied for permanent residence through Express Entry?
Excluding accompanying family members, i.e., considering only principal applicants, 76,050 applications for permanent residence were sourced through Express Entry in 2020 (Table 33). Among principal applicants, a slightly higher proportion of men (57%) than women (43%) submitted applications in 2020. The application by program pattern was similar for men and women—both genders applied most often under the Canadian Experience Class and least often under the Federal Skilled Trades Program. A greater number of men than women submitted applications for every economic program; this difference was especially pronounced under the Federal Skilled Trade Program and least pronounced under the Federal Skilled Worker Program. One candidate of unknown gender submitted an application for permanent residence in 2020; this individual is included only in the total counts.
| Men | Number | % |
|---|---|---|
| Provincial Nominee | 8,143 | 62% |
| Federal Skilled Worker | 10,814 | 52% |
| Canadian Experience Class | 24,539 | 58% |
| Federal Skilled Trades | 130 | 77% |
| Total | 43,626 | 57% |
| Women | ||
| Provincial Nominee | 4,944 | 38% |
| Federal Skilled Worker | 10,001 | 48% |
| Canadian Experience Class | 17,440 | 42% |
| Federal Skilled Trades | 39 | 23% |
| Total | 32,424 | 43% |
| Grand total | ||
| Provincial Nominee | 13,087 | 100% |
| Federal Skilled Worker | 20,815 | 100% |
| Canadian Experience Class | 41,979 | 100% |
| Federal Skilled Trades | 169 | 100% |
| Total | 76,050 | 100% |
Source: IRCC-EDW (CBR) as of January 21, 2021.
Data is operational and as such should be considered preliminary and subject to change.
As displayed in Table 34, nearly two thirds of principal applicants (63%) who submitted an application for permanent residence through Express Entry in 2020 indicated Ontario as the province of destination, which is a slight increase from 2019 when 62% of principal applicants indicated the same. Compared to 2019, the number of principal applicants who intended to reside in Saskatchewan, British Columbia, or New Brunswick increased considerably in 2020, while the number or applicants intending to reside in Alberta and Nova Scotia decreased. The number of applicants who intended to reside in Nunavut remained very small.
| Province of destination | 2019 | 2020 |
|---|---|---|
| Alberta | 6,423 | 5,749 |
| British Columbia | 13,482 | 16,069 |
| Manitoba | 1,492 | 1,360 |
| New Brunswick | 659 | 784 |
| Newfoundland and Labrador | 123 | 156 |
| Northwest Territories | 1,519 | 1,568 |
| Nova Scotia | 33 | 25 |
| Nunavut | 10 | 10 |
| Ontario | 41,746 | 47,924 |
| Prince Edward Island | 462 | 426 |
| Saskatchewan | 1,275 | 1,942 |
| Yukon | 33 | 39 |
| Total | 67,257 | 76,052 |
Source: IRCC-EDW (CBR) as of January 21, 2021.
Data is operational and as such should be considered preliminary and subject to change.
How long did it take to process an Express Entry application?
Table 35 displays the time, in months, that IRCC took to process 80% of applications under each program. In 2020, IRCC did not meet the processing standard of finalizing 80% of all applications sourced via Express Entry within six months. 2020’s overall processing time was nine months, an increase of one month from the 2019 overall processing time, reflecting the COVID-19 pandemic’s impact on IRCC’s operations and processing capacity. As an alternative measure of processing times, 51% of applications finalized in the 12-month period ending on December 31, 2020, were completed within the six-month service standard.
| Immigration Category | 2018 | 2019 | 2020 |
|---|---|---|---|
| Canadian Experience Class (EE) | 5 | 7 | 8 |
| Federal Skilled Workers (EE) | 6 | 9 | 12 |
| Provincial/Territorial Nominees (EE) | 6 | 9 | 11 |
| Skilled Trades (EE) | 7 | 12 | 16 |
| All Programs | 5 | 8 | 9 |
Source: IRCC-EDW (CBR) as of January 21, 2021.
Who was admitted through Express Entry and where were they going?
In 2020, 63,923 principal applicants and their accompanying family members were admitted into Canada as permanent residents through Express Entry (Table 36). By comparison, 109,601 principal applicants and their accompanying family members were admitted in 2019 and 92,229 were admitted in 2018.
From 2018 to 2020, the individuals admitted under the Federal Skilled Worker Program, as a proportion of all individuals admitted in the calendar year, decreased from 50% to 38%. The proportion of individuals admitted under the Canadian Experience Class Program increased, from 30% to 39%. The proportion of those admitted under the Federal Skilled Trades remained at around 1%. The proportion of people admitted under the Provincial Nominee Program remained relatively stable from 2018 (19%) to 2020 (22%).
| Program | 2018 | 2019 | 2020 |
|---|---|---|---|
| Provincial Nominee Program | 17,963 | 20,013 | 14,100 |
| Federal Skilled Worker | 45,926 | 58,184 | 24,244 |
| Canadian Experience Class | 27,466 | 30,226 | 25,014 |
| Federal Skilled Trades | 874 | 1,178 | 565 |
| Total | 92,229 | 109,601 | 63,923 |
Source: IRCC-CDO (RDM, Permanent Residents) as of December 31, 2020.
Data is operational and as such should be considered preliminary and subject to change.
As displayed in Tables 37 and 38, the pattern of principal applicant admissions by program was similar for men and women in 2020. In 2020, male and female principal applicants were most often admitted under the Canadian Experience Class and least often admitted under the Federal Skilled Trades Program—a shift from 2019, when both men and women were admitted to Canada as principal applicants most often under the Federal Skilled Worker Program. In 2020, one principal applicant who had another gender was admitted to Canada; this individual is included only in the total counts.
| Immigration Class Detail | 2018 # | 2018 % | 2019 # | 2019 % | 2020 # | 2020 % |
|---|---|---|---|---|---|---|
| Provincial Nominee Program | 5,600 | 18% | 5,782 | 16% | 4,501 | 20% |
| Federal Skilled Worker | 13,321 | 43% | 16,406 | 46% | 7,448 | 33% |
| Canadian Experience Class | 11,936 | 38% | 12,923 | 36% | 10,697 | 47% |
| Federal Skilled Trades | 323 | 1% | 511 | 1% | 214 | 1% |
| Total | 31,180 | 100% | 35,622 | 100% | 22,860 | 100% |
Source: IRCC-CDO (RDM, Permanent Residents) as of December 31, 2020.
Data is operational and as such should be considered preliminary and subject to change
| Immigration Class Detail | 2018 # | 2018 % | 2019 # | 2019 % | 2020 # | 2020 % |
|---|---|---|---|---|---|---|
| Provincial Nominee Program | 2,945 | 14% | 3,257 | 12% | 2,738 | 17% |
| Federal Skilled Worker | 10,366 | 50% | 14,169 | 54% | 6,307 | 38% |
| Canadian Experience Class | 7,174 | 35% | 8,517 | 33% | 7,389 | 45% |
| Federal Skilled Trades | 57 | 0% | 132 | 1% | 61 | 0% |
| Total | 20,542 | 100% | 26,075 | 100% | 16,495 | 100% |
Source: IRCC-CDO (RDM, Permanent Residents) as of December 31, 2020.
Data is operational and as such should be considered preliminary and subject to change
As reported in Table 39, India was, by a large margin, the most common country of citizenship among principal applicants and their accompanying family members admitted to Canada through Express Entry in 2018 (43%), 2019 (46%), and 2020 (43%). The proportion of individuals who held Chinese citizenship increased from 6% in 2018 to 7% in 2020. The proportion of individuals admitted through Express Entry who held Nigerian citizenship decreased from 7% in 2018 to 6% in 2020.
| Country of Citizenship | 2018 # | 2018% | 2019 # | 2019% | 2020 # | 2020% |
|---|---|---|---|---|---|---|
| India | 39,681 | 43% | 50,848 | 46% | 27,660 | 43% |
| China, People's Republic of | 5,885 | 6% | 5,753 | 5% | 4,329 | 7% |
| Nigeria | 6,653 | 7% | 8,428 | 8% | 3,909 | 6% |
| United States of America | 3,580 | 4% | 3,942 | 4% | 2,348 | 4% |
| Pakistan | 3,526 | 4% | 4,691 | 4% | 2,299 | 4% |
| Brazil | 2,214 | 2% | 2,518 | 2% | 1,961 | 3% |
| British Citizen | 2,609 | 3% | 2,522 | 2% | 1,652 | 3% |
| Iran | 1,361 | 1% | 1,417 | 1% | 1,129 | 2% |
| Korea, Republic of | 1,190 | 1% | 1,645 | 2% | 1,043 | 2% |
| France | 1,326 | 1% | 1,401 | 1% | 1,039 | 2% |
| Morocco | 451 | < 1% | 982 | < 1% | 970 | 2% |
| Philippines | 1,485 | 2% | 1,331 | 1% | 821 | 1% |
| Ireland, Republic of | 1,105 | 1% | 1,009 | 1% | 709 | 1% |
| Bangladesh | 1,301 | 1% | 1,303 | 1% | 646 | 1% |
| South Africa, Republic of | 1,262 | 1% | 958 | < 1% | 641 | 1% |
| Other | 18,600 | 20% | 20,853 | 19% | 12,767 | 20% |
| Total | 92,229 | 100% | 109,601 | 100% | 63,923 | 100% |
Source: IRCC-CDO (RDM, Permanent Residents) as of December 31, 2020.
Data is operational and as such should be considered preliminary and subject to change
Similar to the pattern observed at the application stage, and as in 2018 and in 2019, a majority of persons admitted in 2020 were destined for Ontario (Table 40).
| Province/Territory of destination | 2018 # | 2019 # | 2020 # |
|---|---|---|---|
| Newfoundland and Labrador | 244 | 245 | 159 |
| Prince Edward Island | 470 | 546 | 445 |
| Nova Scotia | 3,255 | 3,346 | 1,556 |
| New Brunswick | 1,876 | 1,691 | 820 |
| Ontario | 59,667 | 69,986 | 37,524 |
| Manitoba | 961 | 2,521 | 1,514 |
| Saskatchewan | 2,744 | 3,108 | 1,247 |
| Alberta | 6,906 | 8,019 | 7,003 |
| British Columbia | 16,028 | 20,050 | 13,589 |
| Yukon | 40 | 40 | 30 |
| Northwest Territories | 35 | 39 | 30 |
| Nunavut | -- | 10 | 6 |
| Total | 92,229 | 109,601 | 63,923 |
Source: IRCC-CDO (RDM, Permanent Residents) as of December 31, 2020.
Data is operational and as such should be considered preliminary and subject to change.
Note that all values between 0 and 5 are shown as “--”. This is done to prevent individuals from being identified when IRCC data is compiled and compared to other publicly available statistics. Some values are rounded to the closest multiple of 5 for the same reason; as a result of rounding, data may not sum to the totals indicated.
As expected, the concentration of admitted individuals destined for Ontario was less pronounced among the individuals who were selected through the Provincial Nominee Program (Table 41), as compared to those who were selected through the Federal Skilled Worker Program, the Canadian Experience Class Program, and the Federal Skilled Trades Program (Table 42).
| Province/Territory of destination | 2018 # | 2019 # | 2020 # |
|---|---|---|---|
| Newfoundland and Labrador | 44 | 50 | 65 |
| Prince Edward Island | 384 | 459 | 405 |
| Nova Scotia | 2,605 | 2,626 | 1,219 |
| New Brunswick | 1,521 | 1,330 | 540 |
| Ontario | 7,505 | 6,118 | 2,763 |
| Manitoba | 74 | 1,487 | 868 |
| Saskatchewan | 1,733 | 2,049 | 801 |
| Alberta | 0 | 646 | 2,903 |
| British Columbia | 4,075 | 5,210 | 4,517 |
| Yukon | 14 | 22 | 12 |
| Northwest Territories | 8 | 16 | 7 |
| Total | 17,963 | 20,013 | 14,100 |
Source: IRCC-CDO (RDM, Permanent Residents) as of December 31, 2020.
Data is operational and as such should be considered preliminary and subject to change
| Province/Territory of destination | 2018 # | 2019 # | 2020 # |
|---|---|---|---|
| Newfoundland and Labrador | 200 | 195 | 94 |
| Prince Edward Island | 86 | 87 | 40 |
| Nova Scotia | 650 | 720 | 337 |
| New Brunswick | 355 | 361 | 280 |
| Ontario | 52,162 | 63,868 | 34,761 |
| Manitoba | 887 | 1,034 | 646 |
| Saskatchewan | 1,011 | 1,059 | 446 |
| Alberta | 6,906 | 7,373 | 4,100 |
| British Columbia | 11,953 | 14,840 | 9,072 |
| Yukon | 25 | 18 | 18 |
| Northwest Territories | 30 | 23 | 23 |
| Nunavut | -- | 10 | 6 |
| Total | 74,266 | 89,588 | 49,823 |
Source: IRCC-CDO (RDM, Permanent Residents) as of December 31, 2020.
Data is operational and as such should be considered preliminary and subject to change
Note that all values between 0 and 5 are shown as “--”. This is done to prevent individuals from being identified when IRCC data is compiled and compared to other publicly available statistics. Some values are rounded to the closest multiple of 5 for the same reason; as a result of rounding, data may not sum to the totals indicated.
Conclusion
In 2020, the sixth year of its operation, the Express Entry application management system continued to provide a pathway to permanent residence for a range of highly-skilled candidates who demonstrated the potential to successfully integrate and contribute to Canada’s economy. To address the impacts of the COVID-19 pandemic, IRCC leveraged the responsiveness and adaptability of the Express Entry system to reduce barriers for clients and to maximize economic immigrant admissions towards the Government of Canada’s targets.
Today, in the context of the ongoing pandemic, the Department continues to monitor Express Entry and to explore ways the system could be used to ensure that Canada continues to derive maximum benefit from economic immigration in a rapidly evolving environment.
Page details
- Date modified: