
Express Entry Year-End Report 2021
Acronym Glossary
- CEC
- Canadian Experience Class
- CLB
- Canadian Language Benchmarks
- CRS
- Comprehensive Ranking System
- EE
- Express Entry
- FSTP
- Federal Skilled Trades Program
- FSWP
- Federal Skilled Worker Program
- IRCC
- Immigration, Refugee and Citizenship Canada
- ITA
- Invitation to Apply
- MI
- Ministerial Instructions
- NCLC
- Niveaux de compétence linguistique canadiens
- NOC
- National Occupation Classification
- PNP
- Provincial/Territorial Nominee Program
Overview of Express Entry
Launched in January 2015, Express Entry (EE) is Canada’s flagship application management system for the Federal High Skilled economic immigration programs (Federal Skilled Worker Program (FSWP), Federal Skilled Trades Program (FSTP) and Canadian Experience Class (CEC)) and a portion of the Provincial Nominee Program (PNP). As described below, EE provides the Government of Canada with the means to manage the intake of applications for permanent residence under these key economic immigration programs, while also facilitating the selection of individuals who are most likely to succeed in Canada.
As with previous reports, the EE Year-End Report 2021 provides an overview of EE and presents data from across all stages of the EE continuum, including profile submissions, invitations to apply (ITAs), applications, processing times, and admissions. Throughout the report, historical and gender-disaggregated dataFootnote 1 is presented alongside the 2021 figures to provide additional context.
How Express Entry works
The EE system manages applications for permanent residence in two steps. First, individuals express their interest in immigrating to Canada by completing an online profile, which is screened electronically to determine if the individual is eligible for the FSWP, the FSTP, or the CEC. Individuals who meet the eligibility criteria for at least one of these programsFootnote 2 are placed in the EE pool and assigned a Comprehensive Ranking System (CRS) score, which is determined by comparing information in their profile to scoring criteria that is publicly available on the Immigration, Refugees and Citizenship (IRCC) website. Candidates in the pool are ranked against one another according to their CRS score. Potential candidates can estimate their scores using a CRS tool, also available on the IRCC website.
Second, Ministerial Instructions (MIs) are regularly published on IRCC’s website specifying the number of ITAs for permanent residence that will be sent to candidates in the EE pool on a specific date. Some MIs also specify the economic immigration program(s) to which candidates will be invited to apply. For each round, invitations are issued to candidates who are eligible to be invited in that round, in descending CRS score rank order, until the maximum number of invitations specified in the associated MIs is met. The profiles of candidates who do not receive an ITA, or decline an ITA, remain in the pool for up to 12 months.
Candidates that receive an ITA have 60 days to either decline the invitation or submit an online application for permanent residence to IRCC. Candidates who receive an ITA but take no action within the 60-day period are withdrawn from the pool. Upon receipt, an immigration officer assesses the application to verify the applicant’s CRS score, program eligibility, and admissibility. If the immigration officer is satisfied that all conditions have been met and that the applicant is not inadmissible, they are approved for a permanent resident visa. Applicants and their accompanying family members become permanent residents when they are admitted to Canada. The processing standard for applications sourced via EE is six months for 80% of cases. Processing time is measured from the day a complete application is received until a final decision is made by an immigration officer.
The CRS is the backbone of the EE application management system. A CRS score comprises two components: core points and additional points. These factors help predict a candidate’s potential for success in the Canadian labour market. The maximum CRS score a candidate can achieve is capped at 1,200 points – 600 points under the core component and 600 points under the additional points component. All information provided at the profile stage for the purpose of generating a CRS score is self-reported and must be supported with appropriate documentation from the candidate at the application stage, or the application could be refused.
Under the core points, the person’s human capital characteristics (e.g., age, education, official language proficiency, work experience) are scored. A candidate who indicates they would apply with an accompanying spouse can receive a maximum of 560 points for their own core characteristics and is awarded up to a maximum of 40 points, depending on the human capital characteristics of their spouse. A candidate without an accompanying spouse can receive a maximum of 600 points under the core component. Under the additional points component, a candidate can receive points for having a provincial/territorial nomination (600 points), arranged employment (50 or 200 points), Canadian post-secondary education credentials (15 or 30 points), French-language proficiency (25 or 50 points), or a sibling in Canada (15 points).Footnote 3 Additional points increase the probability that a given candidate will receive an ITA, but cannot alone ensure it – with the exception of the points for a provincial/territorial nomination, which are enough to virtually guarantee an ITA, through either a general or PNP-specific round.
Candidates in the EE pool can, and in some cases must, update their profile to reflect any change in circumstances, and this action can trigger a recalculation of their CRS score. Some updates are automatically triggered when milestones, such as a birthday or expiry of language test results, are reached. Candidates can take steps to increase their CRS score, thereby increasing the probability they will be selected to receive an ITA. For example, a candidate could increase their proficiency in an official language, secure arranged employment, or provide an educational credential assessment for education acquired abroad.
What’s new in 2021?
In 2021, IRCC continued to leverage the flexibility and responsiveness of the EE system to adapt to the conditions presented by the COVID-19 pandemic and to support the Department in meeting the Government of Canada’s 2021-2023 Immigration Levels Plan. The validity period of an ITA for permanent residence, which had been increased from 60 to 90 days in 2020, was returned to 60 days in 2021 to support IRCC in processing higher volumes of applications in an expedited fashion.
In 2021, IRCC continued to target ITAs at CEC- and PNP-eligible candidates, who are more likely to be physically located in Canada and therefore less impacted by pandemic-related border restrictions; this included one invitation round on February 13, 2021, through which more than 27,000 ITAs were issued to all CEC-eligible candidates in the pool at that time, over 90% of whom were already in Canada and employed. No candidates were invited to apply to the FSWP or FSTP in 2021. Despite the impacts of COVID-19, 2021 saw more ITAs issued via EE than in any previous year.
Travel restrictions throughout most of 2020 and 2021 delayed the processing of overseas applications, which led to significant growth in the Federal High Skilled immigration programs processing inventory. To manage the large processing inventory and position IRCC to process existing applications in a timely manner, the Department paused EE ITAs to Federal High Skilled immigration programs beginning September 20, 2021, while continuing to issue ITAs to the PNP. This pause was temporary; ITAs to Federal High Skilled immigration programs resumed in July 2022 once the processing inventory had been reduced enough to create space for new intake.
The Minister of IRCC’s mandate letter, released in December 2021, included a commitment to expanding pathways to permanent residence for international students and temporary foreign workers through the EE system.
Upcoming enhancements to Express Entry
On June 23, 2022, legislative amendments were made to the Immigration and Refugee Protection Act that authorize the Minister of IRCC to invite foreign nationals to apply for permanent residence through EE on a new basis – their eligibility to be members of a category that supports an identified economic goal. This new authority will increase flexibility to select those with the skills and attributes needed to respond to Canada’s evolving economic needs and Government priorities. Categories will be established, change over time, and will be informed by data and labour market information, as well as engagement with provincial and territorial partners and through stakeholder consultations.
The first use of this upcoming enhancement to the EE system, referred to as “category-based selection” is anticipated to take place in 2023. More information on category-based selection will be presented in future year-end reports.
Who submitted an Express Entry profile?
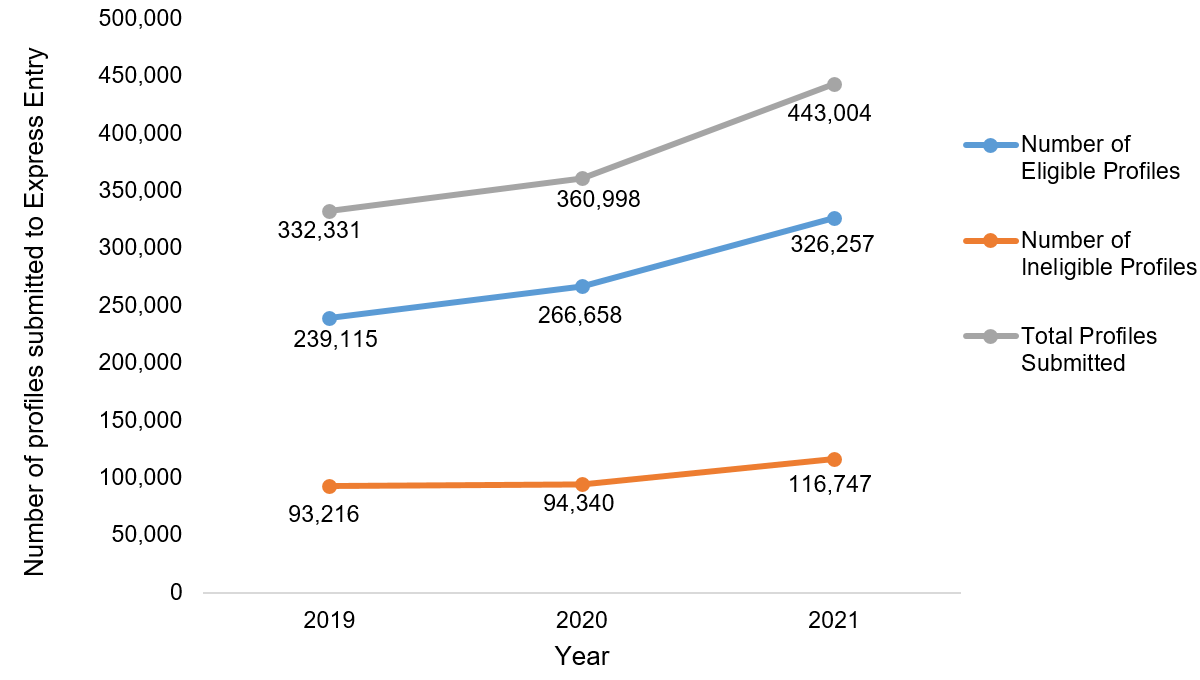
In 2021, 443,004 EE profiles were submitted through the system, which represents an increase of 23% from 2020 and 33% from 2019 (Figure 1). The proportion of the profiles submitted in 2021 that were eligible for at least one of the federal immigration programs managed by EE (74%) was unchanged from that observed in 2020.
Figure 1: Profile submissions to Express Entry, 2019-2021
Text version: Figure 1: Profile submissions to Express Entry, 2019-2021
In 2019, 332,331 total Express Entry profiles were submitted, including 239,115 eligible profiles and 93,216 ineligible profiles.
In 2020, 360,998 total Express Entry profiles were submitted, including 266,658 eligible profiles and 94,340 ineligible profiles.
In 2021, 443,004 total Express Entry profiles were submitted, including 326,257 eligible profiles and 116,747 ineligible profiles.
As displayed in Table 1, in 2021, more profiles were submitted by men (248,495) than women (194,370). Women submitted a slightly higher proportion of total profiles in 2021 (44%), continuing an upwards trend from 2020 (43%) and 2019 (41%). The proportions of profile submissions by men (71%) and women (77%) that were eligible for at least one program were unchanged from 2020. Women have consistently submitted a slightly higher proportion of eligible profiles, including 76% vs 69% in 2019.
| Profile outcome | 2019 # | 2019 % | 2020 # | 2020 % | 2021 # | 2021 % |
|---|---|---|---|---|---|---|
| Men | ||||||
| Eligible | 135,359 | 69% | 147,668 | 71% | 176,863 | 71% |
| Ineligible | 59,572 | 31% | 59,541 | 29% | 71,632 | 29% |
| Total | 194,931 | 100% | 207,209 | 100% | 248,495 | 100% |
| Women | ||||||
| Eligible | 103,713 | 76% | 118,947 | 77% | 149,338 | 77% |
| Ineligible | 33,588 | 24% | 34,738 | 23% | 45,032 | 23% |
| Total | 137,301 | 100% | 153,685 | 100% | 194,370 | 100% |
| TotalFootnote * | ||||||
| Eligible | 239,115 | 72% | 266,658 | 74% | 326,257 | 74% |
| Ineligible | 93,216 | 28% | 94,340 | 26% | 116,747 | 26% |
| TotalFootnote * | 332,331 | 100% | 360,998 | 100% | 443,004 | 100% |
Source: MBR_FACT_EE_MAIN as of January 11, 2022
Note that the data is operational and may vary slightly compared to previous years’ reported numbers.
Who got into the Express Entry pool?
The distributions of CRS scores for eligible candidate profiles at the time of submission are presented in Table 2. In each year, the CRS scores consistently remain concentrated in the 301-500 range even as the total number of eligible profiles submitted has increased. It is important to note that the EE pool is dynamic, and that the distribution of CRS scores changes every time an eligible profile is submitted, updated, or expires.
| CRS score range | 2019 # | 2019 % | 2020 # | 2020 % | 2021 # | 2021 % |
|---|---|---|---|---|---|---|
| 701-1200 | 7 | <1% | 15 | <1% | 79 | <1% |
| 651-700 | 35 | <1% | 38 | <1% | 38 | <1% |
| 601-650 | 96 | <1% | 146 | <1% | 133 | <1% |
| 551-600 | 426 | <1% | 672 | <1% | 786 | <1% |
| 501-550 | 3,797 | 2% | 6,053 | 2% | 6,847 | 2% |
| 451-500 | 53,532 | 22% | 71,232 | 27% | 69,195 | 21% |
| 401-450 | 67,444 | 28% | 73,812 | 28% | 86,626 | 27% |
| 351-400 | 69,614 | 29% | 72,129 | 27% | 99,623 | 31% |
| 301-350 | 37,592 | 16% | 36,112 | 14% | 50,759 | 16% |
| 251-300 | 4,783 | 2% | 4,856 | 2% | 7,583 | 2% |
| 201-250 | 1,133 | <1% | 1,081 | <1% | 2,928 | 1% |
| 151-200 | 492 | <1% | 390 | <1% | 1,239 | <1% |
| 101-150 | 140 | <1% | 113 | <1% | 367 | <1% |
| 1-100 | 24 | <1% | 9 | <1% | 54 | <1% |
| Total | 239,115 | 100% | 266,658 | 100% | 326,257 | 100% |
Source: MBR_FACT_EE_MAIN as of January 11, 2022
Data is operational and as such should be considered preliminary and subject to change.
Among individuals who submitted eligible profiles in 2021, a majority (58%) did not meet criteria for any additional points at the time of submission – this represents a gradual reduction since 2019 (69%) (Table 3).Footnote 4 Candidates continued to most often meet criteria for Education in Canada (21%) and Siblings in Canada (13%) points, with the proportion of eligible profile submissions that receive Education in Canada points growing steadily since 2019. The shares of candidates in the EE pool who met criteria for additional points for having a sibling in Canada, arranged employment and for being proficient in FrenchFootnote 5 has remained stable over the last three years, following the introduction of these point types in June 2017.
| Additional point type | 2019 # | 2019 % | 2020 # | 2020 % | 2021 # | 2021 % |
|---|---|---|---|---|---|---|
| No additional points | 164,740 | 69% | 168,564 | 63% | 190,668 | 58% |
| Arranged employment | 12,841 | 5% | 18,091 | 7% | 20,924 | 6% |
| Education in Canada | 30,055 | 13% | 45,530 | 17% | 69,148 | 21% |
| French-language proficiency | 9,356 | 4% | 12,806 | 5% | 18,140 | 6% |
| Siblings in Canada | 29,670 | 12% | 33,403 | 13% | 41,617 | 13% |
| Total | 239,115 | 100% | 266,658 | 100% | 326,257 | 100% |
Source: MBR_FACT_EE_MAIN as of January 11, 2022
Note that the data is operational and may vary slightly compared to previous years’ reported numbers.
The number of profiles with each additional point type do not sum to the total number of profiles, and the percentages by additional point type do not add to 100%, because a candidate may receive a maximum of 600 additional points. Candidates with provincial nominations (worth 600 points) may therefore meet criteria for, but not receive, other types of additional points.
In 2021, a higher number and proportion of men (54%) than women (46%) did not meet criteria for any additional points at the time of submitting an eligible profile, although this difference has diminished somewhat since 2019 (Table 4).
| Eligible profiles with no additional points | 2019 # | 2019 % | 2020 # | 2020 % | 2021 # | 2021 % |
|---|---|---|---|---|---|---|
| Men | 92,671 | 56% | 92,442 | 55% | 102,937 | 54% |
| Women | 72,044 | 44% | 76,099 | 45% | 87,696 | 46% |
| TotalFootnote * | 164,740 | 100% | 168,564 | 100% | 190,668 | 100% |
Source: MBR_FACT_EE_MAIN as of January 11, 2022
Note that the data is operational and may vary slightly compared to previous years’ reported numbers.
Education in Canada and Siblings in Canada were the most common additional point types for which both men and women met criteria in 2021 (Tables 5-8). While men and women met criteria for most additional point types in relatively equal proportions, a considerably higher number of men (67%) than women (33%) met the criteria for additional points for having arranged employment.
| Eligible profiles with Arranged Employment points | 2019 # | 2019 % | 2020 # | 2020 % | 2021 # | 2021 % |
|---|---|---|---|---|---|---|
| Men | 9,111 | 71% | 12,301 | 68% | 14,002 | 67% |
| Women | 3,728 | 29% | 5,788 | 32% | 6,921 | 33% |
| TotalFootnote * | 12,841 | 100% | 18,091 | 100% | 20,924 | 100% |
Source: MBR_FACT_EE_MAIN as of January 11, 2022
Note that the data is operational and may vary slightly compared to previous years’ reported numbers.
| Eligible profiles with Education in Canada points | 2019 # | 2019 % | 2020 # | 2020 % | 2021 # | 2021 % |
|---|---|---|---|---|---|---|
| Men | 17,298 | 58% | 25,767 | 57% | 37,645 | 54% |
| Women | 12,749 | 42% | 19,751 | 43% | 31,490 | 46% |
| TotalFootnote * | 30,055 | 100% | 45,530 | 100% | 69,148 | 100% |
Source: MBR_FACT_EE_MAIN as of January 11, 2022
Note that the data is operational and may vary slightly compared to previous years’ reported numbers.
| Eligible profiles with French-language proficiency points | 2019 # | 2019 % | 2020 # | 2020 % | 2021 # | 2021 % |
|---|---|---|---|---|---|---|
| Men | 4,940 | 53% | 6,475 | 51% | 9,091 | 50% |
| Women | 4,413 | 47% | 6,331 | 49% | 9,046 | 50% |
| TotalFootnote * | 9,356 | 100% | 12,806 | 100% | 18,140 | 100% |
Source: MBR_FACT_EE_MAIN as of January 11, 2022
Note that the data is operational and may vary slightly compared to previous years’ reported numbers.
| Eligible profiles with Sibling in Canada points | 2019 # | 2019 % | 2020 # | 2020 % | 2021 # | 2021 % |
|---|---|---|---|---|---|---|
| Men | 15,676 | 53% | 17,118 | 51% | 20,839 | 50% |
| Women | 13,986 | 47% | 16,278 | 49% | 20,768 | 50% |
| TotalFootnote * | 29,670 | 100% | 33,403 | 100% | 41,617 | 100% |
Source: MBR_FACT_EE_MAIN as of January 11, 2022
Note that the data is operational and may vary slightly compared to previous years’ reported numbers
Who was invited to apply for permanent residence through Express Entry?
As displayed in Table 9, IRCC held 42 ITA rounds and issued 114,431 invitations in 2021, an increase of 6% from the 107,350 invitations issued in 2020. In 2021, the great majority (87%) of the total invitations issued were under the CEC – a significant increase from 2020 (54%) and 2019 (36%) – with the remainder issued under the PNP. This reflects the ITA rounds strategy adopted by the Department to meet immigration targets in the context of ongoing pandemic-related border restrictions. No invitations were issued under the FSWP or the FSTP in 2021.
All 42 rounds of invitations held in 2021 were program-specific, meaning that only candidates eligible for a specific program were invited to apply for permanent residence; no general invitation rounds were held. 17 of these rounds invited candidates who were CEC-eligible, while the other 25 rounds invited candidates who had received provincial nominations. CRS cut-off scores ranged from 682 to 813 for PNP-specific rounds (median = 739), and from 75 to 462 for CEC-specific rounds ranged (median = 401). While the CRS cut-off scores of CEC-specific rounds decreased throughout the year, those of the PNP-specific rounds remained generally stable. All rounds of invitations were conducted in line with the associated MIs.
| ITA date | Round typeFootnote * | CRS cut-off | CEC # | PNP # | FSWP # | FSTP # | Total ITAs |
|---|---|---|---|---|---|---|---|
| 2021-01-06 | PNP | 813 | 0 | 250 | 0 | 0 | 250 |
| 2021-01-07 | CEC | 461 | 4,750 | 0 | 0 | 0 | 4,750 |
| 2021-01-20 | PNP | 741 | 0 | 374 | 0 | 0 | 374 |
| 2021-01-21 | CEC | 454 | 4,626 | 0 | 0 | 0 | 4,626 |
| 2021-02-10 | PNP | 720 | 0 | 654 | 0 | 0 | 654 |
| 2021-02-13 | CEC | 75 | 27,332 | 0 | 0 | 0 | 27,332 |
| 2021-03-08 | PNP | 739 | 0 | 671 | 0 | 0 | 671 |
| 2021-03-17 | PNP | 682 | 0 | 183 | 0 | 0 | 183 |
| 2021-03-18 | CEC | 449 | 5,000 | 0 | 0 | 0 | 5,000 |
| 2021-03-31 | PNP | 778 | 0 | 284 | 0 | 0 | 284 |
| 2021-04-01 | CEC | 432 | 5,000 | 0 | 0 | 0 | 5,000 |
| 2021-04-14 | PNP | 753 | 0 | 266 | 0 | 0 | 266 |
| 2021-04-17 | CEC | 417 | 6,000 | 0 | 0 | 0 | 6,000 |
| 2021-04-28 | PNP | 717 | 0 | 381 | 0 | 0 | 381 |
| 2021-04-29 | CEC | 400 | 6,000 | 0 | 0 | 0 | 6,000 |
| 2021-05-12 | PNP | 752 | 0 | 557 | 0 | 0 | 557 |
| 2021-05-13 | CEC | 401 | 4,147 | 0 | 0 | 0 | 4,147 |
| 2021-05-20 | CEC | 397 | 1,842 | 0 | 0 | 0 | 1,842 |
| 2021-05-26 | PNP | 713 | 0 | 500 | 0 | 0 | 500 |
| 2021-05-31 | CEC | 380 | 5,956 | 0 | 0 | 0 | 5,956 |
| 2021-06-09 | PNP | 711 | 0 | 940 | 0 | 0 | 940 |
| 2021-06-10 | CEC | 368 | 6,000 | 0 | 0 | 0 | 6,000 |
| 2021-06-23 | PNP | 742 | 0 | 1,002 | 0 | 0 | 1,002 |
| 2021-06-24 | CEC | 357 | 6,000 | 0 | 0 | 0 | 6,000 |
| 2021-07-07 | PNP | 760 | 0 | 627 | 0 | 0 | 627 |
| 2021-07-08 | CEC | 369 | 4,500 | 0 | 0 | 0 | 4,500 |
| 2021-07-21 | PNP | 734 | 0 | 462 | 0 | 0 | 462 |
| 2021-07-22 | CEC | 357 | 4,500 | 0 | 0 | 0 | 4,500 |
| 2021-08-04 | PNP | 760 | 0 | 512 | 0 | 0 | 512 |
| 2021-08-05 | CEC | 404 | 3,000 | 0 | 0 | 0 | 3,000 |
| 2021-08-18 | PNP | 751 | 0 | 463 | 0 | 0 | 463 |
| 2021-08-19 | CEC | 403 | 3,000 | 0 | 0 | 0 | 3,000 |
| 2021-09-01 | PNP | 764 | 0 | 635 | 0 | 0 | 635 |
| 2021-09-14 | CEC | 462 | 2,000 | 0 | 0 | 0 | 2,000 |
| 2021-09-15 | PNP | 732 | 0 | 521 | 0 | 0 | 521 |
| 2021-09-29 | PNP | 742 | 0 | 761 | 0 | 0 | 761 |
| 2021-10-13 | PNP | 720 | 0 | 681 | 0 | 0 | 681 |
| 2021-10-27 | PNP | 744 | 0 | 888 | 0 | 0 | 888 |
| 2021-11-10 | PNP | 685 | 0 | 775 | 0 | 0 | 775 |
| 2021-11-24 | PNP | 737 | 0 | 613 | 0 | 0 | 613 |
| 2021-12-10 | PNP | 698 | 0 | 1,032 | 0 | 0 | 1,032 |
| 2021-12-22 | PNP | 720 | 0 | 746 | 0 | 0 | 746 |
| Total | 99,653 | 14,778 | 0 | 0 | 114,431 |
Source: MBR_FACT_EE_ITA as of January 11, 2022
Data is operational and as such should be considered preliminary and subject to change.
Overall, as displayed in Tables 10 and 11, men received 57% of the invitations issued in 2021 – similar to the share of eligible profile submissions made by men in that year. The proportion of invitations issued to men and women by program was identical: both genders received invitations to apply to the CEC most often (87%), followed by the PNP (13%) and none under the FSWP or FSTP. From 2019 to 2021, 21 invitations were issued to candidates who indicated another gender, an unspecified gender or unknown. Because of the small counts, the data presented in this section of the report is not broken down by these gender categories.
| Economic immigration program | 2019 # | 2019 % | 2020 # | 2020 % | 2021 # | 2021 % |
|---|---|---|---|---|---|---|
| CEC | 18,184 | 37% | 33,780 | 56% | 57,498 | 87% |
| PNP | 8,963 | 18% | 8,909 | 15% | 8,485 | 13% |
| FSWP | 21,151 | 43% | 17,856 | 29% | 0 | 0% |
| FSTP | 765 | 2% | 194 | < 1% | 0 | 0% |
| Total | 49,063 | 100% | 60,739 | 100% | 65,983 | 100% |
Source: MBR_FACT_EE_ITA as of January 11, 2022
Data is operational and as such should be considered preliminary and subject to change.
| Economic immigration program | 2019 # | 2019 % | 2020 # | 2020 % | 2021 # | 2021 % |
|---|---|---|---|---|---|---|
| CEC | 12,378 | 35% | 24,415 | 52% | 42,147 | 87% |
| PNP | 5,965 | 16% | 5,299 | 11% | 6,293 | 13% |
| FSWP | 17,654 | 49% | 16,832 | 36% | 0 | 0% |
| FSTP | 235 | < 1% | 57 | < 1% | 0 | 0% |
| Total | 36,232 | 100% | 46,603 | 100% | 48,440 | 100% |
Source: MBR_FACT_EE_ITA as of January 11 2022
Data is operational and as such should be considered preliminary and subject to change.
The socio-demographic characteristics of the candidates invited to apply for permanent residence shifted significantly from 2019 to 2021, reflecting the impacts of focusing the ITA rounds strategy on inviting CEC-eligible candidates (Tables 12 to 16). From 2019 to 2021, the share of invitations issued to candidates aged 20-29 (the age category associated with the highest number of points under the CRS) increased from just over half to almost two-thirds. A smaller proportion of invitations were issued to candidates with masters and entry-to-practice graduates; however, overall candidates who received invitations to apply remained highly educated, with 75% claiming to hold a post-secondary educational credential of at least three years. First official language proficiency has declined: whereas in 2019 the most common (45%) Canadian Language Benchmarks (CLB)/Niveaux de compétence linguistique canadiens (NCLC) level among invited candidates was 9, in 2021 the most common (41%) level was 7. In 2021, the vast majority (92%) of invitations went to candidates with at least one year of eligible Canadian work experience, while fewer candidates with significant foreign work experience were invited to apply.
| Candidate age | 2019 # | 2019 % | 2020 # | 2020 % | 2021 # | 2021 % |
|---|---|---|---|---|---|---|
| <20 | 4 | < 1% | 3 | < 1% | 9 | < 1% |
| 20-29 | 47,165 | 55% | 67,933 | 63% | 73,689 | 64% |
| 30-34 | 26,692 | 31% | 25,726 | 24% | 21,518 | 19% |
| 35-39 | 8,078 | 9% | 9,158 | 9% | 10,870 | 9% |
| 40-44 | 2,260 | 3% | 3,011 | 3% | 5,240 | 5% |
| 45+ | 1,101 | 1% | 1,519 | 1% | 3,105 | 3% |
| Total | 85,300 | 100% | 107,350 | 100% | 114,431 | 100% |
Source: MBR_FACT_EE_ITA as of January 11, 2022
Data is operational and as such should be considered preliminary and subject to change.
| Education level | 2019 # | 2019 % | 2020 # | 2020 % | 2021 # | 2021 % |
|---|---|---|---|---|---|---|
| High school or less | 1,158 | 1% | 923 | 1% | 3,404 | 3% |
| One or two year post-secondary credential | 4,395 | 5% | 7,552 | 7% | 25,476 | 22% |
| Post-secondary credential of three years or longer | 35,780 | 42% | 49,661 | 46% | 61,226 | 54% |
| Master's Degree or entry-to-practice professional degree | 40,673 | 48% | 45,521 | 42% | 22,215 | 19% |
| PhD | 3,294 | 4% | 3,693 | 3% | 2,110 | 2% |
| Total | 85,300 | 100% | 107,350 | 100% | 114,431 | 100% |
Source: MBR_FACT_EE_ITA as of January 11 2022
Data is operational and as such should be considered preliminary and subject to change.
| First official language Level | 2019 # | 2019 % | 2020 # | 2020 % | 2021 # | 2021 % |
|---|---|---|---|---|---|---|
| CLB/NCLC 4 | 94 | < 1% | 18 | < 1% | 31 | < 1% |
| CLB/NCLC 5 | 1,051 | 1% | 761 | 1% | 5,161 | 5% |
| CLB/NCLC 6 | 1,934 | 2% | 2,614 | 2% | 13,551 | 12% |
| CLB/NCLC 7 | 17,990 | 21% | 28,187 | 26% | 47,271 | 41% |
| CLB/NCLC 8 | 13,613 | 16% | 21,453 | 20% | 25,457 | 22% |
| CLB/NCLC 9 | 38,146 | 45% | 37,483 | 35% | 14,959 | 13% |
| CLB/NCLC 10 | 12,472 | 15% | 16,834 | 16% | 8,001 | 7% |
| Total | 85,300 | 100% | 107,350 | 100% | 114,431 | 100% |
Source: MBR_FACT_EE_ITA as of September 29 2022
Data is operational and as such should be considered preliminary and subject to change.
| Years of Canadian work experience | 2019 # | 2019 % | 2020 # | 2020 % | 2021 # | 2021 % |
|---|---|---|---|---|---|---|
| No work experience or less than one year | 47,733 | 56% | 41,958 | 39% | 10,660 | 9% |
| 1 year | 26,054 | 31% | 43,334 | 40% | 74,375 | 65% |
| 2 years | 8,951 | 10% | 17,883 | 17% | 23,465 | 21% |
| 3 years | 1,618 | 2% | 3,035 | 3% | 4,119 | 4% |
| 4 years | 504 | 1% | 616 | 1% | 1,021 | 1% |
| 5 years or more | 440 | 1% | 524 | < 1% | 791 | 1% |
| Total | 85,300 | 100% | 107,350 | 100% | 114,431 | 100% |
Source: MBR_FACT_EE_ITA as of January 11 2022
Data is operational and as such should be considered preliminary and subject to change.
| Years of foreign work experience | 2019 # | 2019 % | 2020 # | 2020 % | 2021 # | 2021 % |
|---|---|---|---|---|---|---|
| No work experience or less than one year | 17,762 | 21% | 33,751 | 31% | 66,344 | 58% |
| 1 year | 6,101 | 7% | 8,310 | 8% | 7,482 | 7% |
| 2 years | 4,995 | 6% | 5,619 | 5% | 5,621 | 5% |
| 3 years | 15,189 | 18% | 18,605 | 17% | 6,661 | 6% |
| 4 years | 11,016 | 13% | 12,227 | 11% | 5,515 | 5% |
| 5 years or more | 30,237 | 35% | 28,838 | 27% | 22,808 | 20% |
| Total | 85,300 | 100% | 107,350 | 100% | 114,431 | 100% |
Source: MBR_FACT_EE_ITA as of January 11, 2022
Data is operational and as such should be considered preliminary and subject to change.
Table 17 provides information on (a) invitations issued to candidates who were assigned additional points in each category and (b) invitations issued to candidates who met relevant criteria for the category but were not necessarily assigned points.Footnote 6 (A maximum of 600 total additional points can be assigned under the CRS; candidates who have already been assigned 600 points for a provincial nomination cannot be assigned other additional points, even if they meet the criteria.) For example, in 2021, 20,299 ITAs were issued to candidates who met criteria for arranged employment points, but only 18,473 of these candidates were actually assigned the associated points. Data are provided for both conditions to facilitate comparison, as well as to reflect the fuller characteristics of candidates who were invited to apply for permanent residence.Footnote 7
In 2021, slightly over one quarter of ITAs (27%) were issued on the basis of human capital attributes alone (i.e., to candidates who did not meet criteria for any additional points). This figure is down from 28% in 2020 and 40% in 2019, and indicates that additional points are increasingly important to a candidate’s chances of receiving an invitation.
Despite the increase in additional points for French-language proficiency in 2020, fewer invitations were sent to candidates who were assigned and met criteria for that points category in 2021; this is likely due to the shift to CEC-specific rounds, as historically, most French-speaking candidates have been eligible to be invited under the FSWP but not the CEC.
| Additional point typeFootnote * | 2019 # | 2019 % | 2020 # | 2020 % | 2021 # | 2021 % |
|---|---|---|---|---|---|---|
| (a) Assigned additional points | ||||||
| No Additional Points | 34,140 | 40% | 30,376 | 28% | 30,796 | 27% |
| Provincial Nominee | 14,928 | 18% | 14,209 | 13% | 14,778 | 13% |
| Arranged Employment | 9,285 | 11% | 15,453 | 14% | 18,473 | 16% |
| Education in Canada | 20,546 | 24% | 41,470 | 39% | 67,410 | 59% |
| French-language proficiency | 4,187 | 5% | 6,157 | 6% | 1,282 | 1% |
| Siblings in Canada | 8,052 | 9% | 11,105 | 10% | 9,242 | 8% |
| (b) Met criteria for points | ||||||
| No Additional Points | 34,140 | 40% | 30,376 | 28% | 30,796 | 27% |
| Provincial Nominee | 14,928 | 18% | 14,209 | 13% | 14,778 | 13% |
| Arranged Employment | 10,905 | 13% | 17,249 | 16% | 20,299 | 18% |
| Education in Canada | 23,853 | 28% | 45,548 | 42% | 70,184 | 61% |
| French-language proficiency | 5,518 | 6% | 7,105 | 7% | 2,517 | 2% |
| Siblings in Canada | 10,001 | 12% | 12,827 | 12% | 11,551 | 10% |
| Total | 85,300 | 100% | 107,305 | 100% | 114,431 | 100% |
Source: MBR_FACT_EE_ITA as of January 11, 2022
Data is operational and as such should be considered preliminary and subject to change.
Tables 18 to 21 provide information on invitations issued to men and women who met the criteria to receive each additional point type. The figures generally align with the overall breakdown of ITAs by gender (57% men, 43% women), with the exception of arranged employment; roughly two-thirds of candidates with eligible job offers who receive invitations are men.
| ITAs to those that met criteria for Arranged Employment points |
2019 # | 2019 % | 2020 # | 2020 % | 2021 # | 2021 % |
|---|---|---|---|---|---|---|
| Men | 7,632 | 70% | 11,308 | 66% | 13,352 | 66% |
| Women | 3,273 | 30% | 5,939 | 34% | 6,946 | 34% |
| TotalFootnote * | 10,905 | 100% | 17,249 | 100% | 20,299 | 100% |
Source: MBR_FACT_EE_ITA as of January 11, 2022
Data is operational and as such should be considered preliminary and subject to change.
| ITAs to those that met criteria for Education in Canada points |
2019 # | 2019 % | 2020 # | 2020 % | 2021 # | 2021 % |
|---|---|---|---|---|---|---|
| Men | 13,877 | 58% | 25,908 | 57% | 38,908 | 55% |
| Women | 9,974 | 42% | 19,634 | 43% | 31,269 | 45% |
| TotalFootnote * | 23,853 | 100% | 45,548 | 100% | 70,184 | 100% |
Source: MBR_FACT_EE_ITA as of January 11, 2022
Data is operational and as such should be considered preliminary and subject to change.
| ITAs to those that met criteria for French-language proficiency points |
2019 # | 2019 % | 2020 # | 2020 % | 2021 # | 2021 % |
|---|---|---|---|---|---|---|
| Men | 2,887 | 52% | 3,528 | 50% | 1,267 | 50% |
| Women | 2,631 | 48% | 3,577 | 50% | 1,250 | 50% |
| TotalFootnote * | 5,518 | 100% | 7,105 | 100% | 2,517 | 100% |
Source: MBR_FACT_EE_ITA as of January 11, 2022
Data is operational and as such should be considered preliminary and subject to change.
| ITAs to those that met criteria for Siblings in Canada points |
2019 # | 2019 % | 2020 # | 2020 % | 2021 # | 2021 % |
|---|---|---|---|---|---|---|
| Men | 5,255 | 53% | 6,559 | 51% | 6,311 | 55% |
| Women | 4,743 | 47% | 6,266 | 49% | 5,240 | 45% |
| TotalFootnote * | 10,001 | 100% | 12,827 | 100% | 11,551 | 100% |
Source: MBR_FACT_EE_ITA as of September 6, 2022
Data is operational and as such should be considered preliminary and subject to change.
As seen in Table 22, in 2021, there were significant shifts from previous years in the most common primary occupations among candidates invited to apply for permanent residency through EE. The shift to CEC- and PNP-specific rounds of invitations resulted in a significantly higher number of candidates in National Occupation Classification (NOC) skill type B occupations (i.e., technical jobs and skilled trades that usually call for college diploma or apprentice training) receiving invitations in 2021, with food service supervisors, administrative assistants and retail sales supervisors comprising the most common occupations. Foreign nationals in skill type A occupations (i.e., professional jobs that usually call for a university degree), which were previously the most common occupations and mainly related to the technological field, continued to make up a significant proportion of the candidates invited to apply for permanent residence in 2021.
| Primary occupation and NOC skill type | 2019 # | Primary occupation and NOC skill type | 2020 # | Primary occupation and NOC skill type | 2021 # | |||
|---|---|---|---|---|---|---|---|---|
| 2173 Software engineers and designers | A | 6,529 | 2173 Software engineers and designers | A | 6,665 | 6311 Food service supervisors | B | 13,097 |
| 2171 Information systems analysts and consultants | A | 4,645 | 2171 Information systems analysts and consultants | A | 4,846 | 1241 Administrative assistants | B | 5,930 |
| 2174 Computer programmers and interactive media developers | A | 3,819 | 2174 Computer programmers and interactive media developers | A | 4,661 | 6211 Retail sales supervisors | B | 5,020 |
| 1111 Financial auditors and accountants | A | 2,607 | 6311 Food service supervisors | B | 4,228 | 2173 Software engineers and designers | A | 4,916 |
| 1241 Administrative assistants | B | 2,407 | 1241 Administrative assistants | B | 4,041 | 6322 Cooks | B | 4,624 |
| 1122 Professional occupations in business management consulting | A | 1,838 | 1111 Financial auditors and accountants | A | 2,623 | 2174 Computer programmers and interactive media developers | A | 3,878 |
| 1123 Professional occupations in advertising, marketing and public relations | A | 1,808 | 1221 Administrative officers | B | 2,366 | 2171 Information systems analysts and consultants | A | 3,056 |
| 1221 Administrative officers | B | 1,694 | 1123 Professional occupations in advertising, marketing and public relations | A | 2,327 | 2282 User support technicians | B | 3,001 |
| 4011 University professors and lecturers | A | 1,684 | 1311 Accounting technicians and bookkeepers | B | 2,128 | 0631 Restaurant and food service managers | 0 | 2,977 |
| 0124 Advertising, marketing and public relations managers | 0 | 1,588 | 6211 Retail sales supervisors | B | 2,119 | 1221 Administrative officers | B | 2,723 |
| 1112 Financial and investment analysts | A | 1,549 | 2282 User support technicians | B | 2,043 | 1215 Supervisors, supply chain, tracking and scheduling co-ordination occupations | B | 2,539 |
| 6311 Food service supervisors | B | 1,544 | 4011 University professors and lecturers | A | 1,823 | 0621 Retail and wholesale trade managers | 0 | 2,332 |
| 1311 Accounting technicians and bookkeepers | B | 1,484 | 2172 Database analysts and data administrators | A | 1,767 | 1311 Accounting technicians and bookkeepers | B | 2,172 |
| 2132 Mechanical engineers | A | 1,416 | 0621 Retail and wholesale trade managers | 0 | 1,699 | 4214 Early childhood educators and assistants | B | 1,650 |
| 2172 Database analysts and data administrators | A | 1,312 | 1122 Professional occupations in business management consulting | A | 1,680 | 6235 Financial sales representatives | B | 1,594 |
| Other | 49,376 | Other | 62,334 | Other | 54,922 | |||
| Total | 85,300 | Total | 107,350 | Total | 114,431 | |||
Source: MBR_FACT_EE_ITA as of January 11, 2022
Data is operational and as such should be considered preliminary and subject to change.
Skill Type 0: management jobs
Skill Level A: professional jobs that usually call for a degree from a university
Skill Level B: technical jobs and skilled trades that usually call for a college diploma or training as an apprentice
While their most common primary occupations at the time of invitation in 2021 were identical (food service supervisor), men and women’s other top occupations differed to some extent (Tables 23 to 24). Of the 15 most common primary occupations of men and women invited to apply, all but four are shared, although their order of precedence differs; their skill levels are similar as well, with nine of the top 15 occupations being skill type B for both men and women. The four top occupations amongst men that are not in the top 15 for women include: supervisors, supply chain, tracking and scheduling co-ordination occupations; machinists and machining and tooling inspectors; computer and information systems managers; and other services supervisors. The four top occupations amongst women that are not in the top 15 for men include: early childhood educators and assistants; accounting technicians and bookkeepers; professional occupations in advertising, marketing and public relations; and financial sales representatives.
| Primary occupation and NOC skill type | 2019 # | Primary occupation and NOC skill type | 2020 # | Primary occupation and NOC skill type | 2021 # | |||
|---|---|---|---|---|---|---|---|---|
| 2173 Software engineers and designers | A | 4,845 | 2173 Software engineers and designers | A | 5,005 | 6311 Food service supervisors | B | 5,176 |
| 2171 Information systems analysts and consultants | A | 3,214 | 2174 Computer programmers and interactive media developers | A | 3,563 | 2173 Software engineers and designers | A | 3,806 |
| 2174 Computer programmers and interactive media developers | A | 2,835 | 2171 Information systems analysts and consultants | A | 3,335 | 6322 Cooks | B | 3,118 |
| 2132 Mechanical engineers | A | 1,284 | 6311 Food service supervisors | B | 1,754 | 6211 Retail sales supervisors | B | 3,096 |
| 1111 Financial auditors and accountants | A | 1,277 | 2282 User support technicians | B | 1,350 | 2174 Computer programmers and interactive media developers | A | 2,993 |
| 1122 Professional occupations in business management consulting | A | 1,055 | 6211 Retail sales supervisors | B | 1,269 | 2171 Information systems analysts and consultants | A | 2,234 |
| 0213 Computer and information systems managers | 0 | 1,002 | 2132 Mechanical engineers | A | 1,228 | 2282 User support technicians | B | 1,948 |
| 1112 Financial and investment analysts | A | 911 | 1111 Financial auditors and accountants | A | 1,182 | 1215 Supervisors, supply chain, tracking and scheduling co-ordination occupations | B | 1,832 |
| 4011 University professors and lecturers | A | 897 | 2172 Database analysts and data administrators | A | 1,126 | 1241 Administrative assistants | B | 1,710 |
| 2172 Database analysts and data administrators | A | 877 | 1241 Administrative assistants | B | 1,119 | 0621 Retail and wholesale trade managers | 0 | 1,469 |
| 0124 Advertising, marketing and public relations managers | 0 | 787 | 1215 Supervisors, supply chain, tracking and scheduling co-ordination occupations | B | 1,091 | 0631 Restaurant and food service managers | 0 | 1,399 |
| 0621 Retail and wholesale trade managers | 0 | 746 | 0621 Retail and wholesale trade managers | 0 | 1,063 | 7231 Machinists and machining and tooling inspectors | B | 1,276 |
| 2282 User support technicians | B | 740 | 0213 Computer and information systems managers | 0 | 1,031 | 0213 Computer and information systems managers | 0 | 1,073 |
| 2133 Electrical and electronics engineers | A | 719 | 4011 University professors and lecturers | A | 999 | 1221 Administrative officers | B | 946 |
| 6322 Cooks | B | 711 | 6322 Cooks | B | 958 | 6316 Other services supervisors | B | 932 |
| Other | 27,163 | Other | 34,666 | Other | 32,975 | |||
| Total | 49,063 | Total | 60,739 | Total | 65,983 | |||
Source: MBR_FACT_EE_ITA as of January 11, 2022
Data is operational and as such should be considered preliminary and subject to change.
Skill Type 0: management jobs
Skill Level A: professional jobs that usually call for a degree from a university
Skill Level B: technical jobs and skilled trades that usually call for a college diploma or training as an apprentice
| Primary occupation and NOC skill type | 2019 # | Primary occupation and NOC skill type | 2020 # | Primary occupation and NOC skill type | 2021 # | |||
|---|---|---|---|---|---|---|---|---|
| 1241 Administrative assistants | B | 1,787 | 1241 Administrative assistants | B | 2,922 | 6311 Food service supervisors | B | 7,921 |
| 2173 Software engineers and designers | A | 1,683 | 6311 Food service supervisors | B | 2,474 | 1241 Administrative assistants | B | 4,218 |
| 2171 Information systems analysts and consultants | A | 1,430 | 2173 Software engineers and designers | A | 1,660 | 6211 Retail sales supervisors | B | 1,924 |
| 1111 Financial auditors and accountants | A | 1,330 | 1221 Administrative officers | B | 1,534 | 1221 Administrative officers | B | 1,776 |
| 1123 Professional occupations in advertising, marketing and public relations | A | 1,134 | 2171 Information systems analysts and consultants | A | 1,511 | 4214 Early childhood educators and assistants | B | 1,580 |
| 1221 Administrative officers | B | 1,119 | 1123 Professional occupations in advertising, marketing and public relations | A | 1,462 | 0631 Restaurant and food service managers | 0 | 1,578 |
| 2174 Computer programmers and interactive media developers | A | 984 | 1111 Financial auditors and accountants | A | 1,441 | 6322 Cooks | B | 1,506 |
| 1311 Accounting technicians and bookkeepers | B | 860 | 1311 Accounting technicians and bookkeepers | B | 1,252 | 1311 Accounting technicians and bookkeepers | B | 1,382 |
| 6311 Food service supervisors | B | 837 | 2174 Computer programmers and interactive media developers | A | 1,098 | 2173 Software engineers and designers | A | 1,110 |
| 0124 Advertising, marketing and public relations managers | 0 | 801 | 0124 Advertising, marketing and public relations managers | 0 | 885 | 2282 User support technicians | B | 1,052 |
| 4011 University professors and lecturers | A | 787 | 6211 Retail sales supervisors | B | 850 | 1123 Professional occupations in advertising, marketing and public relations | A | 945 |
| 1122 Professional occupations in business management consulting | A | 783 | 4011 University professors and lecturers | A | 824 | 2174 Computer programmers and interactive media developers | A | 885 |
| 1112 Financial and investment analysts | A | 638 | 0631 Restaurant and food service managers | 0 | 801 | 0621 Retail and wholesale trade managers | 0 | 863 |
| 4021 College and other vocational instructors | A | 571 | 1122 Professional occupations in business management consulting | A | 801 | 2171 Information systems analysts and consultants | A | 822 |
| 0631 Restaurant and food service managers | 0 | 570 | 6235 Financial sales representatives | B | 737 | 6235 Financial sales representatives | B | 796 |
| Other | 20,918 | Other | 26,351 | Other | 20,082 | |||
| Total | 36,232 | Total | 46,603 | Total | 48,440 | |||
Source: MBR_FACT_EE_ITA as of January 11, 2022
Data is operational and as such should be considered preliminary and subject to change.
Skill Type 0: management jobs
Skill Level A: professional jobs that usually call for a degree from a university
Skill Level B: technical jobs and skilled trades that usually call for a college diploma or training as an apprentice
Table 25 displays the most common occupations among candidates who were assigned arranged employment points and were invited to apply. An increasing number of these occupations are skill type B.
| Primary occupation and NOC skill type | 2019 # | Primary occupation and NOC skill type | 2020 # | Primary occupation and NOC skill type | 2021 # | |||
|---|---|---|---|---|---|---|---|---|
| 2174 Computer programmers and interactive media developers | A | 917 | 6311 Food service supervisors | B | 917 | 6311 Food service supervisors | B | 1,997 |
| 2173 Software engineers and designers | A | 870 | 2174 Computer programmers and interactive media developers | A | 870 | 6322 Cooks | B | 1,601 |
| 6311 Food service supervisors | B | 838 | 2173 Software engineers and designers | A | 838 | 2174 Computer programmers and interactive media developers | A | 1,377 |
| 6322 Cooks | B | 692 | 2171 Information systems analysts and consultants | A | 692 | 2173 Software engineers and designers | A | 1,032 |
| 2171 Information systems analysts and consultants | A | 647 | 6322 Cooks | B | 647 | 2171 Information systems analysts and consultants | A | 677 |
| 4011 University professors and lecturers | A | 501 | 1241 Administrative assistants | B | 501 | 6211 Retail sales supervisors | B | 615 |
| 0013 Senior managers - financial, communications and other business services | 0 | 364 | 0213 Computer and information systems managers | 0 | 364 | 1241 Administrative assistants | B | 560 |
| 0213 Computer and information systems managers | 0 | 336 | 4011 University professors and lecturers | A | 336 | 0213 Computer and information systems managers | 0 | 558 |
| 5241 Graphic designers and illustrators | B | 331 | 6211 Retail sales supervisors | B | 331 | 1221 Administrative officers | B | 531 |
| 1241 Administrative assistants | B | 218 | 0013 Senior managers - financial, communications and other business services | 0 | 218 | 4214 Early childhood educators and assistants | B | 491 |
| 6211 Retail sales supervisors | B | 209 | 1221 Administrative officers | B | 209 | 0631 Restaurant and food service managers | 0 | 440 |
| 1221 Administrative officers | B | 192 | 0016 Senior managers - construction, transportation, production and utilities | 0 | 192 | 4011 University professors and lecturers | A | 298 |
| 0016 Senior managers - construction, transportation, production and utilities | 0 | 180 | 1311 Accounting technicians and bookkeepers | B | 180 | 8252 Agricultural service contractors, farm supervisors and specialized livestock workers | B | 281 |
| 0015 Senior managers - trade, broadcasting and other services, n.e.c. | 0 | 157 | 1215 Supervisors, supply chain, tracking and scheduling co-ordination occupations | B | 157 | 1215 Supervisors, supply chain, tracking and scheduling co-ordination occupations | B | 277 |
| 8252 Agricultural service contractors, farm supervisors and livestock workers | B | 142 | 0631 Restaurant and food service managers | 0 | 142 | 1311 Accounting technicians and bookkeepers | B | 269 |
| Other | 4,311 | Other | 10,655 | Other | 9,295 | |||
| Total | 10,905 | Total | 17,249 | Total | 20,299 | |||
Source: MBR_FACT_EE_ITA as of January 11, 2022
Data is operational and as such should be considered preliminary and subject to change.
Skill Type 0: management jobs
Skill Level A: professional jobs that usually call for a degree from a university
Skill Level B: technical jobs and skilled trades that usually call for a college diploma or training as an apprentice
Table 26 and 27 show the most common occupations for candidates with arranged employment points who received ITAs, broken down by gender. The most common occupations among invited women with arranged employment points included more skill type B occupations in comparison to their male counterparts. While women’s top occupation (food service supervisors) remained the same from 2019 to 2021, men’s top occupation shifted from computer programmers and interactive media developers in 2020 to cooks in 2021. The top six occupations for men remained the same from 2020 to 2021, but there were shifts in the order of precedence reflecting the growth of skill type B occupations. Five of the top six occupations for women remained the same from 2020 to 2021 with shifts in the order of precedence, with skill type B occupations becoming increasingly common.
| Primary occupation and NOC skill type | 2019 # | Primary occupation and NOC skill type | 2020 # | Primary occupation and NOC skill type | 2021 # | |||
|---|---|---|---|---|---|---|---|---|
| 2173 Software engineers and designers | A | 788 | 2174 Computer programmers and interactive media developers | A | 1,342 | 6322 Cooks | B | 1,401 |
| 2174 Computer programmers and interactive media developers | A | 770 | 2173 Software engineers and designers | A | 1,209 | 6311 Food service supervisors | B | 1,220 |
| 2171 Information systems analysts and consultants | A | 547 | 2171 Information systems analysts and consultants | A | 868 | 2173 Software engineers and designers | A | 1,114 |
| 6322 Cooks | B | 444 | 6311 Food service supervisors | B | 831 | 2174 Computer programmers and interactive media developers | A | 1,092 |
| 6311 Food service supervisors | B | 346 | 0213 Computer and information systems managers | 0 | 487 | 2171 Information systems analysts and consultants | A | 739 |
| 4011 University professors and lecturers | A | 331 | 6322 Cooks | B | 446 | 0213 Computer and information systems managers | 0 | 574 |
| 0213 Computer and information systems managers | 0 | 294 | 0013 Senior managers - financial, communications and other business services | 0 | 390 | 6211 Retail sales supervisors | B | 549 |
| 0013 Senior managers - financial, communications and other business services | 0 | 292 | 4011 University professors and lecturers | A | 358 | 7271 Carpenters | B | 247 |
| 5241 Graphic designers and illustrators | B | 268 | 6211 Retail sales supervisors | B | 342 | 8252 Agricultural service contractors, farm supervisors and livestock workers | B | 233 |
| 0016 Senior managers - construction, transportation, production and utilities | 0 | 159 | 0016 Senior managers - construction, transportation, production and utilities | 0 | 249 | 1241 Administrative assistants | B | 227 |
| 6211 Retail sales supervisors | B | 139 | 1215 Supervisors, supply chain, tracking and scheduling co-ordination occupations | B | 213 | 4011 University professors and lecturers | A | 213 |
| 0015 Senior managers - trade, broadcasting and other services, n.e.c. | 0 | 120 | 1241 Administrative assistants | B | 208 | 1215 Supervisors, supply chain, tracking and scheduling co-ordination occupations | B | 205 |
| 8252 Agricultural service contractors, farm supervisors and livestock workers | B | 101 | 0015 Senior managers - trade, broadcasting and other services, n.e.c. | 0 | 187 | 0631 Restaurant and food service managers | 0 | 204 |
| 7271 Carpenters | B | 97 | 5241 Graphic designers and illustrators | B | 173 | 0013 Senior managers - financial, communications and other business services | 0 | 200 |
| 1215 Supervisors, supply chain, tracking and scheduling co-ordination occupations | B | 89 | 1221 Administrative officers | B | 147 | 5241 Graphic designers and illustrators | B | 194 |
| Other | 2,847 | Other | 3,858 | Other | 4,940 | |||
| Total | 7,632 | Total | 11,308 | Total | 13,352 | |||
Source: MBR_FACT_EE_ITA as of January 11, 2022
Data is operational and as such should be considered preliminary and subject to change.
Skill Type 0: management jobs
Skill Level A: professional jobs that usually call for a degree from a university
Skill Level B: technical jobs and skilled trades that usually call for a college diploma or training as an apprentice
| Primary occupation and NOC skill type | 2019 # | Primary occupation and NOC skill type | 2020 # | Primary occupation and NOC skill type | 2021 # | |||
|---|---|---|---|---|---|---|---|---|
| 6311 Food service supervisors | B | 492 | 6311 Food service supervisors | B | 1,166 | 6311 Food service supervisors | B | 1,778 |
| 6322 Cooks | B | 248 | 1241 Administrative assistants | B | 407 | 6322 Cooks | B | 641 |
| 4011 University professors and lecturers | A | 170 | 1221 Administrative officers | B | 293 | 1241 Administrative assistants | B | 438 |
| 2174 Computer programmers and interactive media developers | A | 147 | 2174 Computer programmers and interactive media developers | A | 259 | 4214 Early childhood educators and assistants | B | 416 |
| 1241 Administrative assistants | B | 139 | 4214 Early childhood educators and assistants | B | 250 | 1221 Administrative officers | B | 290 |
| 1221 Administrative officers | B | 119 | 6322 Cooks | B | 231 | 6211 Retail sales supervisors | B | 262 |
| 4214 Early childhood educators and assistants | B | 100 | 4011 University professors and lecturers | A | 200 | 0631 Restaurant and food service managers | 0 | 197 |
| 2171 Information systems analysts and consultants | A | 100 | 6211 Retail sales supervisors | B | 189 | 4011 University professors and lecturers | A | 161 |
| 2173 Software engineers and designers | A | 82 | 1311 Accounting technicians and bookkeepers | B | 177 | 1311 Accounting technicians and bookkeepers | B | 157 |
| 0013 Senior managers - financial, communications and other business services | 0 | 72 | 2173 Software engineers and designers | A | 168 | 2174 Computer programmers and interactive media developers | A | 151 |
| 6211 Retail sales supervisors | B | 70 | 2171 Information systems analysts and consultants | A | 164 | 2171 Information systems analysts and consultants | A | 143 |
| 0631 Restaurant and food service managers | 0 | 70 | 0631 Restaurant and food service managers | 0 | 139 | 2173 Software engineers and designers | A | 127 |
| 1311 Accounting technicians and bookkeepers | B | 70 | 0013 Senior managers - financial, communications and other business services | 0 | 100 | 4217 Other religious occupations | B | 100 |
| 5241 Graphic designers and illustrators | B | 63 | 5241 Graphic designers and illustrators | B | 91 | 6332 Bakers | B | 99 |
| 1123 Professional occupations in advertising, marketing and public relations | A | 47 | 1123 Professional occupations in advertising, marketing and public relations | A | 83 | 8252 Agricultural service contractors, farm supervisors and specialized livestock workers | B | 87 |
| Other | 1,284 | Other | 2,022 | Other | 1,899 | |||
| Total | 3,273 | Total | 5,939 | Total | 6,946 | |||
Source: MBR_FACT_EE_ITA as of January 11, 2022
Data is operational and as such should be considered preliminary and subject to change.
Skill Type 0: management jobs
Skill Level A: professional jobs that usually call for a degree from a university
Skill Level B: technical jobs and skilled trades that usually call for a college diploma or training as an apprentice
The four most common countries of residence among candidates who received an ITA remained the same from 2019 to 2021 (Table 28). The proportion of ITAs that were issued to candidates who indicated Canada as their country of residence grew from 63% in 2020 to 90% in 2021, reflecting the growth in ITAs under the CEC. Over the same period, the proportion of invited candidates who indicated India as their country of residence dropped from 10% to 3%, and the share of invited candidates residing in the United States fell from 7% to less than 1%.
| Country of residence | 2019 # | Country of residence | 2020 # | Country of residence | 2021 # |
|---|---|---|---|---|---|
| Canada | 40,522 | Canada | 67,632 | Canada | 102,806 |
| India | 15,137 | India | 11,235 | India | 3,826 |
| United States of America | 9,964 | United States of America | 7,272 | Nigeria | 1,432 |
| Nigeria | 3,812 | Nigeria | 4,066 | United States of America | 806 |
| United Arab Emirates | 1,707 | United Arab Emirates | 1,415 | People's Republic of China | 687 |
| Pakistan | 1,183 | Pakistan | 1,297 | United Arab Emirates | 465 |
| Morocco | 862 | Australia | 1,076 | United Kingdom and Overseas Territories | 348 |
| People's Republic of China | 782 | Lebanon | 979 | Pakistan | 269 |
| Australia | 776 | People's Republic of China | 962 | Morocco | 235 |
| United Kingdom and Overseas Territories | 728 | Morocco | 852 | Lebanon | 215 |
| Other | 9,827 | Other | 10,564 | Other | 3,342 |
| TotalFootnote * | 85,300 | TotalFootnote * | 107,350 | TotalFootnote * | 114,431 |
Source: MBR_FACT_EE_ITA as of January 11, 2022
Data is operational and as such should be considered preliminary and subject to change.
As displayed in Tables 29 and 30, the most common countries of residence were similar for both men and women in 2019, 2020 and 2021. In 2021, a smaller proportion of women (89%) than men (98%) indicated Canada as their country of residence.
| Country of residence | 2019 # | Country of residence | 2020 # | Country of residence | 2021 # |
|---|---|---|---|---|---|
| Canada | 24,713 | Canada | 40,076 | Canada | 59,692 |
| India | 7,821 | India | 5,772 | India | 2,163 |
| United States of America | 6,441 | United States of America | 4,551 | Nigeria | 619 |
| Nigeria | 1,597 | Nigeria | 1,544 | United States of America | 544 |
| United Arab Emirates | 898 | Pakistan | 741 | People's Republic of China | 284 |
| Pakistan | 672 | United Arab Emirates | 702 | United Arab Emirates | 246 |
| Morocco | 467 | Australia | 625 | United Kingdom and Overseas Territories | 213 |
| Australia | 457 | United Kingdom and Overseas Territories | 443 | Pakistan | 172 |
| United Kingdom and Overseas Territories | 399 | Morocco | 430 | Morocco | 124 |
| People's Republic of China | 327 | People's Republic of China | 429 | Australia | 100 |
| Other | 5,271 | Other | 5,426 | Other | 1,826 |
| Total | 49,063 | Total | 60,739 | Total | 65,983 |
Source: MBR_FACT_EE_ITA as of January 11, 2022
Data is operational and as such should be considered preliminary and subject to change.
| Country of residence | 2019 # | Country of residence | 2020 # | Country of residence | 2021 # |
|---|---|---|---|---|---|
| Canada | 15,808 | Canada | 27,549 | Canada | 43,106 |
| India | 7,316 | India | 5,462 | India | 1,663 |
| United States of America | 3,522 | United States of America | 2,721 | Nigeria | 813 |
| Nigeria | 2,215 | Nigeria | 2,522 | People's Republic of China | 403 |
| United Arab Emirates | 807 | United Arab Emirates | 713 | United States of America | 262 |
| Pakistan | 511 | Lebanon | 586 | United Arab Emirates | 219 |
| People's Republic of China | 455 | Pakistan | 556 | United Kingdom and Overseas Territories | 135 |
| Morocco | 395 | People's Republic of China | 533 | Lebanon | 134 |
| United Kingdom and Overseas Territories | 329 | Australia | 451 | Morocco | 111 |
| Australia | 319 | Federal Republic of Cameroon | 444 | Pakistan | 97 |
| Other | 4,555 | Other | 5,066 | Other | 1,497 |
| Total | 36,232 | Total | 46,603 | Total | 48,440 |
Source: MBR_FACT_EE_ITA as of January 11, 2022
Data is operational and as such should be considered preliminary and subject to change.
As displayed in Table 31, the top two countries of citizenship among candidates who received an ITA did not change from 2020 to 2021. India was the most common country of citizenship by a significant and growing margin (from 47% in 2020 to 57% in 2021). Looking at the top 10 most common country of citizenship among candidates who received an ITA, notable changes from 2020 to 2021 include: the Republic of Korea climbing from eighth to third most common country of citizenship; the number of applicants from Nigeria halving from 6,550 in 2020 to 3,123 in 2021 and dropping from third to fourth most common country of citizenship; the United States falling out of the top 10 from 2020 to 2021; and the Socialist Republic of Vietnam climbing into the top 10. From 2020 to 2021, the proportion of citizenships outside the top 10 (i.e. “Other” in Table 30), decreased from 24% in 2020 to 18% in 2021, indicating that the citizenship profile of invited candidates is becoming more homogeneous.
| Country of residence | 2019 # | Country of residence | 2020 # | Country of residence | 2021 # |
|---|---|---|---|---|---|
| India | 40,314 | India | 50,890 | India | 65,565 |
| Nigeria | 5,882 | People's Republic of China | 8,954 | People's Republic of China | 9,592 |
| People's Republic of China | 5,680 | Nigeria | 6,550 | Korea, Republic of | 3,131 |
| Pakistan | 2,512 | Pakistan | 2,824 | Nigeria | 3,123 |
| United Kingdom and Overseas Territories | 2,122 | United Kingdom and Overseas Territories | 2,709 | Brazil | 2,877 |
| Brazil | 1,806 | Brazil | 2,446 | Philippines | 2,429 |
| United States of America | 1,552 | Iran | 1,937 | United Kingdom and Overseas Territories | 2,298 |
| Iran | 1,475 | Korea, Republic of | 1,653 | Iran | 1,700 |
| France | 1,461 | United States of America | 1,648 | Socialist Republic of Vietnam | 1,514 |
| Korea, Republic of | 1,224 | Republic of Ireland | 1,568 | Republic of Ireland | 1,348 |
| Other | 21,272 | Other | 26,171 | Other | 20,854 |
| TotalFootnote * | 85,300 | TotalFootnote * | 107,350 | TotalFootnote * | 114,431 |
Source: MBR_FACT_EE_ITA as of January 11, 2022
Data is operational and as such should be considered preliminary and subject to change.
India and the People’s Republic of China were the most common countries of citizenship for both men and women who were invited to apply for permanent residence in 2021; however, a smaller proportion of invited women (53%) than invited men (61%) held Indian citizenship, while a larger proportion of invited women (11%) than invited men (6%) held Chinese citizenship (Tables 32 and 33). Nine of top 10 countries of citizenship were the same for men and women who received an ITA, with the sole exception of Pakistan for men and the Socialist Republic of Vietnam for women.
| Country of citizenship | 2019 # | Country of citizenship | 2020 # | Country of citizenship | 2021 # |
|---|---|---|---|---|---|
| India | 24,905 | India | 31,835 | India | 39,996 |
| Nigeria | 2,747 | People's Republic of China | 3,750 | People's Republic of China | 4,235 |
| People's Republic of China | 2,500 | Nigeria | 2,816 | Brazil | 1,750 |
| Pakistan | 1,669 | Pakistan | 1,904 | Nigeria | 1,559 |
| United Kingdom and Overseas Territories | 1,293 | United Kingdom and Overseas Territories | 1,640 | United Kingdom and Overseas Territories | 1,431 |
| Brazil | 1,053 | Brazil | 1,423 | Korea, Republic of | 1,339 |
| Iran | 888 | Iran | 1,130 | Iran | 1,028 |
| United States of America | 885 | Republic of Ireland | 953 | Philippines | 1,013 |
| France | 759 | United States of America | 912 | Pakistan | 885 |
| Republic of Ireland | 695 | France | 854 | Republic of Ireland | 796 |
| Other | 11,669 | Other | 13,522 | Other | 11,951 |
| Total | 49,063 | Total | 60,739 | Total | 65,983 |
Source: MBR_FACT_EE_ITA as of January 11, 2022
Data is operational and as such should be considered preliminary and subject to change.
| Country of citizenship | 2019 # | Country of citizenship | 2020 # | Country of citizenship | 2021 # |
|---|---|---|---|---|---|
| India | 15,406 | India | 19,051 | India | 25,568 |
| People's Republic of China | 3,180 | People's Republic of China | 5,203 | People's Republic of China | 5,355 |
| Nigeria | 3,135 | Nigeria | 3,734 | Korea, Republic of | 1,792 |
| Pakistan | 843 | United Kingdom and Overseas Territories | 1,069 | Nigeria | 1,564 |
| United Kingdom and Overseas Territories | 829 | Brazil | 1,023 | Philippines | 1,416 |
| Brazil | 753 | Korea, Republic of | 1,010 | Brazil | 1,127 |
| France | 702 | Pakistan | 920 | United Kingdom and Overseas Territories | 867 |
| Korea, Republic of | 672 | Iran | 807 | Socialist Republic of Vietnam | 848 |
| United States of America | 667 | Philippines | 777 | Iran | 672 |
| Philippines | 666 | United States of America | 735 | Republic of Ireland | 552 |
| Other | 9,379 | Other | 12,274 | Other | 8,679 |
| Total | 36,232 | Total | 46,603 | Total | 48,440 |
Source: MBR_FACT_EE_ITA as of January 11, 2022
Data is operational and as such should be considered preliminary and subject to change.
Who applied for permanent residence through Express Entry?
Excluding accompanying family members (i.e., considering only principal applicants), a notable increase of total applications were sourced through the EE in 2021 (102,452) (Table 34). That is a 35% increase from 2020 applications (75,941) and a 52% increase from 2019 (67,545). The proportion of the applications remained the same over the last three years between men and women, with a greater distribution of applications submitted by men (57%) than women (43%). The breakdown of applications by program was similar for men and women for all three years. Since 2020, applications to the CEC were the most common, whereas in 2019 the FSWP was the most common. 2021 had seen a significant decline in the FSTP with three total applications compared to its previous years, 2020 and 2019 with 169 and 726 total applications respectively.
| Economic immigration program applications | 2019 # | 2019 % | 2020 # | 2020 % | 2021 # | 2021 % |
|---|---|---|---|---|---|---|
| Men | ||||||
| PNP | 7,344 | 60% | 8,106 | 62% | 7,250 | 57% |
| FSWP | 16,381 | 53% | 10,781 | 52% | 3,900 | 47% |
| CEC | 14,208 | 60% | 24,492 | 58% | 47,280 | 58% |
| FSTP | 546 | 74% | 130 | 77% | 3 | 100% |
| Total | 38,479 | 57% | 43,509 | 57% | 58,433 | 57% |
| Women | ||||||
| PNP | 4,887 | 40% | 4,923 | 38% | 5,402 | 43% |
| FSWP | 14,441 | 47% | 9,973 | 48% | 4,344 | 53% |
| CEC | 9,542 | 40% | 17,495 | 42% | 34,271 | 42% |
| FSTP | 195 | 26% | 39 | 23% | 0 | 0% |
| Total | 29,065 | 43% | 32,430 | 43% | 44,017 | 43% |
| Grand total | ||||||
| PNP | 12,231 | 100% | 13,029 | 100% | 12,652 | 100% |
| FSWP | 30,822 | 100% | 20,754 | 100% | 8,245 | 100% |
| CEC | 23,751 | 100% | 41,989 | 100% | 81,552 | 100% |
| FSTP | 741 | 100% | 169 | 100% | 3 | 100% |
| TotalFootnote * | 67,545 | 100% | 75,941 | 100% | 102,452 | 100% |
Source: COGNOS (MBR) extracted as of October 7, 2022.
Data is operational and as such should be considered preliminary and subject to change.
As displayed in Table 35, Ontario has remained the most popular province in the last three years with nearly two thirds of principal applicants indicating Ontario as the province of destination.
| Province/Territory of destination | 2019 # | 2019 % | 2020 # | 2020 % | 2021 # | 2021 % |
|---|---|---|---|---|---|---|
| Alberta | 6,441 | 10% | 5,740 | 8% | 7,633 | 7% |
| British Columbia | 13,543 | 20% | 16,012 | 21% | 23,421 | 23% |
| Manitoba | 1,498 | 2% | 1,366 | 2% | 1,791 | 2% |
| New Brunswick | 662 | 1% | 781 | 1% | 1,354 | 1% |
| Newfoundland and Labrador | 124 | < 1% | 156 | 0.2% | 261 | < 1% |
| Northwest Territories | 33 | < 1% | 25 | < 1% | 58 | < 1% |
| Nova Scotia | 1,526 | 2% | 1,568 | 2% | 2,918 | 3% |
| Nunavut | 10 | < 1% | 10 | < 1% | 9 | < 1% |
| Ontario | 41,932 | 62% | 47,875 | 63% | 62,360 | 61% |
| Prince Edward Island | 462 | 1% | 426 | 1% | 724 | 1% |
| Saskatchewan | 1,280 | 2% | 1,942 | 3% | 1,826 | 2% |
| Yukon | 33 | < 1% | 38 | < 1% | 90 | < 1% |
| Unspecified | 1 | < 1% | 2 | < 1% | 7 | < 1% |
| Total | 67,545 | 100% | 75,941 | 100% | 102,452 | 100% |
Source: COGNOS (MBR) extracted as of October 7, 2022.
Data is operational and as such should be considered preliminary and subject to change.
How long did it take to process Express Entry applications?
Table 36 displays the time, in months, that IRCC took to process 80% of applications under each program. In 2021, IRCC did not meet the processing standard of finalizing 80% of all applications sourced via EE within six months. 2021’s overall processing time was nine months, matching the 2020 overall processing time and reflecting the COVID-19 pandemic’s impact on IRCC’s operations and processing capacity. The processing time for CEC applications (representing the vast majority of applications received in 2021) remained at seven months, whereas processing time for other programs was significantly higher. As an alternative measure of processing times, 59% of applications finalized in the 12-month period ending on December 31, 2021, were completed within the six-month service standard. This is an increase from 54% in 2020, meaning a larger proportion of applications are being processed within the six-month service standard.
| Economic immigration program | 2019 (months) | 2020 (months) | 2021 (months) |
|---|---|---|---|
| CEC | 7 | 7 | 7 |
| FSWP | 8 | 13 | 26 |
| PNP | 8 | 10 | 21 |
| FSTP | 12 | 16 | 23 |
| All programs | 8 | 9 | 9 |
Source: COGNOS (MBR) extracted as of March 17, 2022.
Who was admitted through Express Entry and where is their intended destination?
In 2021, 155,810 principal applicants and their accompanying family members were admitted into Canada as permanent residents through EE (Table 37). By comparison, 63,888 principal applicants and their accompanying family members were admitted in 2020 and 109,601 were admitted in 2019.
In 2021, the vast majority (84%) of EE-sourced admissions were through the CEC, a significant increase from 2019 (28%). 11% of admissions were through the PNP, which saw a slight decrease from 18% in 2019. Individuals admitted under the FSWP decreased from 53% to 5%, and FSTP admissions also dropped from about 1% to 0.3%.
| Economic immigration program | 2019 # | 2019 % | 2020 # | 2020 % | 2021 # | 2021 % |
|---|---|---|---|---|---|---|
| PNP | 20,013 | 18% | 14,097 | 22% | 16,708 | 11% |
| FSWP | 58,184 | 53% | 24,259 | 38% | 8,156 | 5% |
| CEC | 30,226 | 28% | 24,967 | 39% | 130,446 | 84% |
| FSTP | 1,178 | 1% | 565 | 1% | 500 | < 1% |
| Total | 109,601 | 100% | 63,888 | 100% | 155,810 | 100% |
Source: IRCC, CDO, Permanent Residents, January 31, 2022 Data.
Data is operational and as such should be considered preliminary and subject to change.
As displayed in Tables 38 and 39, and in line with 2020 admissions, the pattern of principal applicant admissions by program was similar for men and women in 2021: male and female principal applicants were most often admitted under the CEC and least often admitted under the FSTP. From 2019 to 2021, three principal applicants who indicated another gender, an unspecified gender or unknown were admitted to Canada. Because of the small counts, the data presented in tables 38 and 39 is not broken down by these gender categories.
| Economic immigration program | 2019 # | 2019 % | 2020 # | 2020 % | 2021 # | 2021 % |
|---|---|---|---|---|---|---|
| CEC | 12,923 | 36% | 10,682 | 47% | 54,909 | 87% |
| PNP | 5,782 | 16% | 4,499 | 20% | 5,397 | 9% |
| FSTP | 511 | 1% | 214 | 1% | 232 | < 1% |
| FSWP | 16,406 | 46% | 7,454 | 33% | 2,478 | 4% |
| Total | 35,622 | 100% | 22,849 | 100% | 63,016 | 100% |
Source: IRCC, CDO, Permanent Residents, January 31, 2022 Data.
Data is operational and as such should be considered preliminary and subject to change.
| Economic immigration program | 2019 # | 2019 % | 2020 # | 2020 % | 2021 # | 2021 % |
|---|---|---|---|---|---|---|
| CEC | 8,517 | 33% | 7,372 | 45% | 39,386 | 88% |
| PNP | 3,257 | 12% | 2,738 | 17% | 3,086 | 7% |
| FSTP | 132 | 1% | 61 | < 1% | 83 | < 1% |
| FSWP | 14,169 | 54% | 6,307 | 38% | 2,151 | 5% |
| Total | 26,075 | 100% | 16,478 | 100% | 44,706 | 100% |
Source: IRCC, CDO, Permanent Residents, January 31, 2022 Data.
Data is operational and as such should be considered preliminary and subject to change.
As reported in Table 40, India has remained, by a large margin, the most common country of citizenship among principal applicants and their accompanying family members admitted to Canada through EE. The proportion of individuals admitted through EE who held Chinese citizenship increased from 5% in 2019 to 8% in 2021, while the proportion of Nigerian nationals decreased from 8% in 2019 to 4% in 2021.
| Country of Citizenship | 2019 # | 2019 % | 2020 # | 2020 % | 2021 # | 2021 % |
|---|---|---|---|---|---|---|
| India | 50,848 | 46% | 27,639 | 43% | 82,936 | 53% |
| China, People's Republic of | 5,753 | 5% | 4,318 | 7% | 11,701 | 8% |
| Nigeria | 8,428 | 8% | 3,919 | 6% | 5,795 | 4% |
| Brazil | 2,518 | 2% | 1,961 | 3% | 5,650 | 4% |
| United States of America | 3,942 | 4% | 2,346 | 4% | 4,280 | 3% |
| Korea, Republic of | 1,645 | 2% | 1,041 | 2% | 3,851 | 2% |
| United Kingdom and Overseas Territories | 2,556 | 2% | 1,674 | 3% | 3,547 | 2% |
| Philippines | 1,331 | 1% | 820 | 1% | 2,937 | 2% |
| Iran | 1,417 | 1% | 1,132 | 2% | 2,385 | 2% |
| Ireland, Republic of | 1,009 | 1% | 707 | 1% | 2,101 | 1% |
| France | 1,401 | 1% | 1,039 | 2% | 1,706 | 1% |
| Pakistan | 4,691 | 4% | 2,294 | 4% | 1,683 | 1% |
| Mexico | 692 | 1% | 616 | 1% | 1,661 | 1% |
| Vietnam | 655 | 1% | 453 | 1% | 1,619 | 1% |
| Ukraine | 881 | 1% | 508 | 1% | 1,408 | 1% |
| Other Country of Citizenship | 21,834 | 20% | 13,421 | 21% | 22,550 | 14% |
| Total | 109,601 | 100% | 63,888 | 100% | 155,810 | 100% |
Source: IRCC, CDO, Permanent Residents, January 31, 2022 Data.
Data is operational and as such should be considered preliminary and subject to change.
Similar to the pattern observed at the application stage, and as in 2019 and 2020, the majority of persons admitted in 2021were destined for Ontario (Table 41).
| Province/Territory of destination | 2019 # | 2020 # | 2021 # |
|---|---|---|---|
| Newfoundland and Labrador | 245 | 159 | 332 |
| Prince Edward Island | 546 | 445 | 875 |
| Nova Scotia | 3,346 | 1,553 | 3,155 |
| New Brunswick | 1,691 | 820 | 1,393 |
| Ontario | 69,986 | 37,505 | 96,535 |
| Manitoba | 2,521 | 1,516 | 2,800 |
| Saskatchewan | 3,108 | 1,249 | 2,716 |
| Alberta | 8,019 | 7,000 | 12,082 |
| British Columbia | 20,050 | 13,575 | 35,735 |
| Yukon | 40 | 30 | 102 |
| Northwest Territories | 39 | 30 | 72 |
| Nunavut | 10 | 6 | 13 |
| Total | 109,601 | 63,888 | 155,810 |
Source: IRCC, CDO, Permanent Residents, January 31, 2022 Data.
Data is operational and as such should be considered preliminary and subject to change.
The concentration of admitted individuals destined for Ontario was significantly less pronounced among the individuals who were selected through the PNP (Table 42), compared to those who were admitted through the FSWP, the CEC, and the FSTP (Table 43).
| Province/Territory of destination | 2019 # | 2020 # | 2021 # |
|---|---|---|---|
| Newfoundland and Labrador | 50 | 65 | 34 |
| Prince Edward Island | 459 | 405 | 388 |
| Nova Scotia | 2,626 | 1,217 | 1,441 |
| New Brunswick | 1,330 | 540 | 714 |
| Ontario | 6,118 | 2,767 | 3,895 |
| Manitoba | 1,487 | 869 | 1,473 |
| Saskatchewan | 2,049 | 803 | 1,439 |
| Alberta | 646 | 2,900 | 2,579 |
| British Columbia | 5,210 | 4,512 | 4,717 |
| Yukon | 22 | 12 | 12 |
| Northwest Territories | 16 | 7 | 16 |
| Total | 20,013 | 14,097 | 16,708 |
Source: IRCC, CDO, Permanent Residents, January 31, 2022 Data.
Data is operational and as such should be considered preliminary and subject to change
| Province/Territory of destination | 2019 # | 2020 # | 2021 # |
|---|---|---|---|
| Newfoundland and Labrador | 195 | 94 | 298 |
| Prince Edward Island | 87 | 40 | 487 |
| Nova Scotia | 720 | 336 | 1,714 |
| New Brunswick | 361 | 280 | 679 |
| Ontario | 63,868 | 34,738 | 92,640 |
| Manitoba | 1,034 | 647 | 1,327 |
| Saskatchewan | 1,059 | 446 | 1,277 |
| Alberta | 7,373 | 4,100 | 9,503 |
| British Columbia | 14,840 | 9,063 | 31,018 |
| Yukon | 18 | 18 | 90 |
| Northwest Territories | 23 | 23 | 56 |
| Nunavut | 10 | 6 | 13 |
| Total | 89,588 | 49,791 | 139,102 |
Source: IRCC, CDO, Permanent Residents, January 31, 2022 Data.
Data is operational and as such should be considered preliminary and subject to change.
Conclusion
In 2021, the seventh year of its operation, the EE application management system continued to provide a pathway to permanent residence for a range of highly-skilled candidates who demonstrated the potential to successfully integrate and contribute to Canada’s economy. IRCC leveraged the responsiveness and adaptability of the EE system by managing application inventories and maximizing economic immigrant admissions to help meet the Government of Canada’s immigration targets and support Canada’s ongoing recovery from the impacts of the COVID-19 pandemic.
Going forward, the EE system will be a key component of IRCC’s Strategy to Expand Transitions to Permanent Residency, which was tabled in Parliament on September 20, 2022 and supports the achievement of the Minister’s mandate commitment to expand permanent residence pathways for international students and temporary foreign workers. The strategy aims to reform the EE system, including by increasing its flexibility as immigration selection tool through recent changes to the Immigration and Refugee Protection Act. The Department will continue to monitor EE and to explore ways the system could be used to ensure that Canada continues to derive maximum benefit from economic immigration in a rapidly evolving environment.