
Express Entry Year-End Report 2022
Acronym Glossary
- CEC
- Canadian Experience Class
- CLB
- Canadian Language Benchmarks
- CRS
- Comprehensive Ranking System
- EE
- Express Entry
- FHS
- Federal High Skilled
- FSTP
- Federal Skilled Trades Program
- FSWP
- Federal Skilled Worker Program
- GCMS
- Global Case Management System
- GoC
- Government of Canada
- IRCC
- Immigration, Refugee and Citizenship Canada
- IRPA
- Immigration and Refugee Protection Act
- ITA
- Invitation to Apply
- MI
- Ministerial Instructions
- NCLC
- Niveaux de compétence linguistique canadiens
- NOC
- National Occupation Classification
- PNP
- Provincial/Territorial Nominee Program
- TEER
- Training, Education, Experience and Responsibilities
Overview of Express Entry
Launched in January 2015, Express Entry (EE) is Canada’s flagship application management system for three Federal High Skilled (FHS) permanent economic immigration programs (i.e. the Federal Skilled Worker Program (FSWP), Federal Skilled Trades Program (FSTP) and Canadian Experience Class (CEC)) and a portion of the Provincial Nominee Program (PNP). In addition to providing a pathway to permanent residence for prospective immigrants currently abroad, many temporary residents already in Canada also transition to permanent residence through EE, with Canada consistently being the top country of residence of individuals who receive an invitation to apply for permanent residence. As described below, EE provides the Government of Canada (GoC) with the means to manage the intake of applications for permanent residence under the-above listed key economic immigration programs, while also facilitating the selection of individuals who are most likely to succeed economically in Canada.
As with previous reports, the EE Year-End Report 2022 provides an overview of EE and presents data from across all stages of the EE continuum, including profile submissions, candidates in the pool, invitations to apply (ITAs), applications, processing times, admissions, and for the first time since Express Entry Year-End Reports have been issued, economic outcomes of applicants; as we now have sufficient longitudinal economic outcome data. Throughout the report, historical and gender-disaggregated dataFootnote 1 is presented alongside the 2022 figures to provide additional context. Data is operational and as such should be considered preliminary and subject to change.
How Express Entry Works
The EE system manages applications for permanent residence in two steps.
First, individuals express their interest in immigrating to Canada by completing an online profile, which is screened electronically to determine if the individual is eligible for at least one of the FHS immigration programs managed by the system. The profiles of individuals who meet the eligibility criteria for at least one of these FHS programsFootnote 2 are placed in the EE pool and assigned a Comprehensive Ranking System (CRS) score, based on information in their profile, including skills and experience, according to point criteria that is publicly available on the Immigration, Refugees and Citizenship (IRCC) website. Candidates in the pool are ranked according to their CRS score. Potential candidates can estimate their scores prior to completing an online profile using a CRS tool, also available on the IRCC websiteFootnote 3.
Second, Ministerial Instructions (MIs) are regularly published on IRCC’s website specifying the number of ITAs for permanent residence that will be sent to candidates in the EE pool on a specific date, known as an invitation round. Invitation rounds normally take place every two weeks. General invitation rounds are solely based on CRS scores, but some MIs also specify the economic immigration program(s) to which candidates will be invited to apply. For each invitation round, ITAs are issued to candidates who are eligible to be invited in that round, in descending CRS score rank order, until the maximum number of invitations specified in the associated MIs is met. The profiles of candidates who do not receive an ITA, or decline an ITA, remain in the pool for up to 12 months.
Candidates that receive an ITA have 60 days to either submit an online application for permanent residence to IRCC or decline the invitation (which means their profile would re-enter the pool). Candidates who receive an ITA but take no action within the 60-day period are withdrawn from the pool. Upon receipt by IRCC, an immigration officer assesses the application to verify the applicant’s CRS score, program eligibility, and admissibility. If the immigration officer is satisfied that all conditions have been met and that the applicant is not inadmissible, they are approved for a permanent resident visa. Applicants and their accompanying family members become permanent residents when they are admitted to Canada. The processing standard for applications sourced via EE is six months for 80% of cases. Processing times are measured from the day a complete application is received by IRCC until a final decision is made by an immigration officer.
The Comprehensive Ranking System
The CRS is the backbone of the EE application management system. A CRS score comprises two components: core points and additional points. These factors help predict a candidate’s potential for success in the Canadian labour market. The maximum CRS score a candidate can achieve is capped at 1,200 points – 600 points under the core component and 600 points under the additional points component. All information provided at the profile submission stage for the purpose of generating a CRS score is self-reported and must be supported with appropriate documentation from the candidate at the application stage, or the application could be refused.
Under the core points, the person’s human capital characteristics (e.g., age, education, official language proficiency, work experience) are scored. A candidate who indicates they would apply with an accompanying spouse or common-law partner can receive a maximum of 560 points for their own core characteristics and is awarded up to a maximum of 40 points, depending on the human capital characteristics of their spouse/common-law partner. A candidate without an accompanying spouse/common-law partner can receive a maximum of 600 points under the core component. Under the additional points component, a candidate can receive points for having a provincial/territorial nomination (600 points), arranged employment (50 or 200 points), Canadian post-secondary education credentials (15 or 30 points), French-language proficiency (25 or 50 points), or a sibling in Canada (15 points).Footnote 4
Additional points increase the probability that a given candidate will receive an ITA, but cannot alone ensure it – with the exception of the points for a provincial/territorial nomination, which are enough to virtually guarantee an ITA, through either a general invitation or PNP-specific round.
Candidates in the EE pool can, and in some cases must, update their profile to reflect any change in circumstances, which may affect their CRS score. Some updates are automatically triggered when milestones are reached, such as a birthday or expiry of language test results. Other updates must be manually revised, such as steps candidates take to improve their CRS scores, thereby increasing their probability of receiving an ITA. This includes for example, increasing official language skills or securing arranged employment.
Changes to Express Entry in 2022
On November 16, 2022, IRCC implemented the new National Occupational Classification (NOC) 2021 system, developed by Employment and Social Development Canada and Statistics Canada which is updated every five years. IRCC uses the NOC to determine and assess the occupational eligibility criteria under its immigration programs. NOC 2021 introduced structural changes by replacing skill level groups with Training, Education, Experience and Responsibility (TEER) categories. With the implementation of the NOC 2021, 16 new occupations became eligible under the FSWP and CEC, and eight new occupations became eligible under the FSTP.
Upcoming enhancements to Express Entry
On June 23, 2022, legislative amendments were made to the Immigration and Refugee Protection Act (IRPA) that authorize the Minister of IRCC to invite foreign nationals to apply for permanent residence through EE on a new basis – their eligibility to be members of a category that supports an identified economic goal. This new authority, referred to as “category-based selection” will increase flexibility to select candidates in the EE pool with the skills and attributes needed to respond to Canada’s evolving economic needs and Government priorities through a new invitation round type. The development of categories for use in category-based selection rounds will be informed by data, labour market information engagement with provincial and territorial partners and stakeholder consultations. Categories will be based on key attributes, such as official language knowledge and work experience and will change over time.
The Department conducted public consultations between late November 2022 and January 2023 on enhancing Express Entry through category-based selection, through a web-based questionnaire and direct engagement with provinces and territories. The consultation process also invited written input from 2,960 organizations across Canada, and received 263 responses to the online questionnaire, as well as 26 written submissions via email. A summary of input received from IRCC stakeholders is available on IRCC’s website. The input highlighted the need for a focus on addressing labour market shortages, and supporting Francophone immigration and economic growth in Francophone minority communities.
Similarly, in February 2023, the Minister of IRCC launched a wide-ranging consultation and review of Canada’s immigration system, “An Immigration System for Canada’s Future” to hear directly about how Canada’s immigration policies and programs could best support Canada’s present and future needs. The review provided opportunities for partners and stakeholder to express their views, including regional roundtables, focused sessions in key areas of interest, and an online survey, resulting in input from over 16,000 clients, individuals, and representatives of business, academia, and settlement organizations. Input received through the strategic immigration review highlighted the need to ensure immigrant selection is rigorous and evidence-based, further confirming the need to inform category-based selection through reliable data.
Based on the input received during the category-based selection consultation process and in-line with feedback received during the review of the immigration system, the first use of category-based selection will take place in 2023 and will focus on helping address structural labour market shortages, and supporting economic growth through francophone immigration outside of Quebec. More information on category-based selection will be presented in future year-end reports.
Who submitted an Express Entry profile?
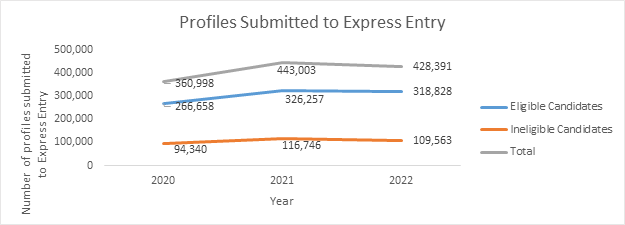
In 2022, 428,391 EE profiles were submitted through the system, which represents a slight decrease of 3% from 2021 but an increase of 19% from 2020 (Figure 1). The proportion of profiles submitted in 2022 that were eligible for at least one of the FHS immigration programs managed by EE (74%) was unchanged from that observed in 2021.
Figure 1: Profile submissions to Express Entry, 2020-2022
Source: MBR_FACT_EE_MAIN as of January 09, 2023
Text Version: Profile submission to Express Entry, 2020-2022
In 2020, 360,998 Express Entry profiles were submitted, including 266,658 eligible profiles and 94,340 ineligible profiles. In 2021, 443,003 total Express Entry profiles were submitted, including 326,257 eligible profiles and 116,746 ineligible profiles. In 2022, 428,391 total Express Entry profiles were submitted, including 318,828 eligible profiles and 109,563 ineligible profiles.
As displayed in Table 1, in 2022, more profiles were submitted by men (238,382) than women (189,881). The proportion of total profile submissions by men (56%) and women (44%) were unchanged from 2021. While the proportion of profile submissions that were eligible for at least one program has not changed from 2020 to 2022 by men (71%), there was a slight increase from previous years in 2022 by women (78%). Overall, women have consistently submitted a slightly higher proportion of eligible profiles, by approximately 6-7 percentage points compared to men.
| Profile outcome | 2020 # | 2020 % | 2021 # | 2021 % | 2022 # | 2022 % |
|---|---|---|---|---|---|---|
| Men | ||||||
| Eligible | 147,666 | 71% | 176,870 | 71% | 169,812 | 71% |
| Ineligible | 59,541 | 29% | 71,637 | 29% | 68,570 | 29% |
| Total | 207,207 | 100% | 248,507 | 100% | 238,382 | 100% |
| Women | ||||||
| Eligible | 118,950 | 77% | 149,338 | 77% | 148,959 | 78% |
| Ineligible | 34,738 | 23% | 45,032 | 23% | 40,922 | 22% |
| Total | 153,688 | 100% | 194,370 | 100% | 189,881 | 100% |
| TotalFootnote * | ||||||
| Eligible | 266,658 | 74% | 326,257 | 74% | 318,828 | 74% |
| Ineligible | 94,340 | 26% | 116,746 | 26% | 109,563 | 26% |
| TotalFootnote * | 360,998 | 100% | 443,003 | 100% | 428,391 | 100% |
Source: MBR_FACT_EE_MAIN as of January 09, 2023
Who got into the Express Entry pool?
The distributions of CRS scores for eligible candidate profiles at the time of submission are presented in Table 2. In each year, the CRS scores consistently remain concentrated in the 301-500 range even as the total number of eligible profiles submitted slightly decreased in 2022. It is important to note that the EE pool is dynamic, and that the distribution of CRS scores change every time an eligible profile is submitted, updated, or expires.
| CRS Score Range | 2020 # | 2020 % | 2021 # | 2021 % | 2022 # | 2022 % |
|---|---|---|---|---|---|---|
| 701-1200 | 15 | <1% | 79 | <1% | 11 | <1% |
| 651-700 | 38 | <1% | 38 | <1% | 71 | <1% |
| 601-650 | 146 | <1% | 133 | <1% | 240 | <1% |
| 551-600 | 672 | <1% | 786 | <1% | 1,126 | <1% |
| 501-550 | 6,053 | 2% | 6,847 | 2% | 10,725 | 3% |
| 451-500 | 71,232 | 27% | 69,195 | 21% | 76,504 | 24% |
| 401-450 | 73,812 | 27% | 86,626 | 27% | 77,447 | 26% |
| 351-400 | 72,129 | 27% | 99,623 | 31% | 93,621 | 29% |
| 301-350 | 36,112 | 14% | 50,759 | 16% | 49,923 | 15% |
| 251-300 | 4,856 | 2% | 7,583 | 2% | 6,225 | 2% |
| 201-250 | 1,081 | <1% | 2,928 | <1% | 1,986 | <1% |
| 151-200 | 390 | <1% | 1,239 | <1% | 731 | <1% |
| 101-150 | 113 | <1% | 367 | <1% | 190 | <1% |
| 1-100 | 9 | <1% | 54 | <1% | 28 | <1% |
| Total | 266,658 | 100% | 326,257 | 100% | 318,828 | 100% |
Source: MBR_FACT_EE_MAIN as of January 09, 2023
As seen in Table 3, among individuals who submitted eligible profiles in 2022, a majority (55%) did not meet criteria for any additional points at the time of submission. However, this is a gradual reduction since 2020 (63%) and 2021 (58%), meaning an increasing number of candidates are eligible for at least one type of additional point.Footnote 5 Candidates continued to most often meet criteria for Education in Canada (23%) and Siblings in Canada (14%) points. The proportion of eligible profiles that received Education in Canada points has grown more and been higher than other additional point types since 2020. The proportion of candidates in the EE pool who met additional points criteria for having a sibling in Canada, arranged employment and French-language proficiency Footnote 6remained stable between 2020 and 2022.
| Additional point type | 2020 # | 2020 % | 2021 # | 2021 % | 2022 # | 2022 % |
|---|---|---|---|---|---|---|
| No additional points | 168,564 | 63% | 190,664 | 58% | 176,777 | 55% |
| Arranged employment | 18,091 | 7% | 20,927 | 6% | 20,495 | 6% |
| Education in Canada | 45,530 | 17% | 69,148 | 21% | 74,654 | 23% |
| French-language proficiency | 12,806 | 5% | 18,140 | 6% | 18,681 | 6% |
| Siblings in Canada | 33,403 | 13% | 41,618 | 13% | 44,483 | 14% |
| Total | 266,658 | N/A | 326,257 | N/A | 318,828 | N/A |
Source: MBR_FACT_EE_MAIN as of January 09, 2023
N/A - Breakdown by category exceeds annual total as candidates may be eligible for multiple additional point types
As displayed in Table 4, in 2022, a higher number and proportion of men (93,817, 53%) than women (82,930, 47%) did not meet criteria for any additional points at the time of submitting an eligible profile, although this gap has diminished somewhat, from 10 percentage points to 6 between 2020 and 2022.
| Gender | 2020 # | 2020 % | 2021 # | 2021 % | 2022 # | 2022 % |
|---|---|---|---|---|---|---|
| Men | 92,441 | 55% | 102,930 | 54% | 93,817 | 53% |
| Women | 76,100 | 45% | 87,703 | 46% | 82,930 | 47% |
| TotalFootnote * | 168,564 | 100% | 190,664 | 100% | 176,777 | 100% |
Source: MBR_FACT_EE_MAIN as of January 09, 2023
Tables 5 to 8 further explore additional point breakdowns by gender, and show that Education in Canada and Siblings in Canada were the most common additional point types for both men and women in 2022. Similar to the trend seen in 2020 and 2021, a considerably higher proportion of men (66%) than women (34%) continued to meet the criteria for Arranged Employment in 2022. While there was a higher proportion of men (53%) who met the criteria for Education in Canada than women (47%) in 2022, the difference has diminished somewhat since 2020. In regards to additional points for French-language proficiency, there was a slightly higher proportion of women (52%) who met the criteria than men (48%) in 2022, compared to an equal distribution (both at 50%) in 2021. In 2022, the proportion of women (51%) meeting Siblings in Canada criteria slightly exceeded men (49%), a minor shift from previous years where there was an equal distribution (both at 50%) in 2021, and slightly higher proportion of men (51%) than women (49%) in 2020. Table 9 displays the CRS score distribution of eligible candidates in the pool. It can be seen that the CRS scores of eligible candidates in the pool consistently remain concentrated in the 301-500 range.
| Gender | 2020 # | 2020 % | 2021 # | 2021 % | 2022 # | 2022 % |
|---|---|---|---|---|---|---|
| Men | 12,302 | 68% | 14,008 | 67% | 13,603 | 66% |
| Women | 5,787 | 32% | 6,918 | 33% | 6,886 | 34% |
| TotalFootnote * | 18,091 | 100% | 20,927 | 100% | 20,495 | 100% |
Source: MBR_FACT_EE_MAIN as of February 06, 2023
| Gender | 2020 # | 2020 % | 2021 # | 2021 % | 2022 # | 2022 % |
|---|---|---|---|---|---|---|
| Men | 25,766 | 57% | 37,650 | 54% | 39,859 | 53% |
| Women | 19,753 | 43% | 31,488 | 46% | 34,782 | 47% |
| TotalFootnote * | 45,530 | 100% | 69,148 | 100% | 74,654 | 100% |
Source: MBR_FACT_EE_MAIN as of January 09, 2023
| Gender | 2020 # | 2020 % | 2021 # | 2021 % | 2022 # | 2022 % |
|---|---|---|---|---|---|---|
| Men | 6,474 | 51% | 9,094 | 50% | 8,982 | 48% |
| Women | 6,332 | 49% | 9,043 | 50% | 9,694 | 52% |
| TotalFootnote * | 12,806 | 100% | 18,140 | 100% | 18,681 | 100% |
Source: MBR_FACT_EE_MAIN as of January 09, 2023
| Gender | 2020 # | 2020 % | 2021 # | 2021 % | 2022 # | 2022 % |
|---|---|---|---|---|---|---|
| Men | 17,118 | 51% | 20,842 | 50% | 21,933 | 49% |
| Women | 16,278 | 49% | 20,768 | 50% | 22,544 | 51% |
| TotalFootnote * | 33,403 | 100% | 41,618 | 100% | 44,483 | 100% |
Source: MBR_FACT_EE_MAIN as of January 11, 2022
| CRS Score Range | 2020 | 2021 | 2022 | |||
|---|---|---|---|---|---|---|
| Number # | Percent % | Number # | Percent % | Number # | Percent % | |
| 701-1200 | 443 | <1% | 170 | <1% | 303 | <1% |
| 651-700 | 4 | <1% | 1 | <1% | 15 | <1% |
| 601-650 | 1 | <1% | 5 | <1% | 68 | <1% |
| 551-600 | 13 | <1% | 12 | <1% | 451 | <1% |
| 501-550 | 218 | <1% | 210 | <1% | 4,451 | <1% |
| 451-500 | 17,471 | 13% | 23,913 | 16% | 46,386 | 24% |
| 401-450 | 40,748 | 30% | 45,405 | 31% | 46,389 | 24% |
| 351-400 | 47,504 | 35% | 47,796 | 33% | 57,592 | 30% |
| 301-350 | 26,969 | 20% | 24,860 | 17% | 31,081 | 16% |
| 251-300 | 2,860 | 2% | 2,613 | 2% | 3,898 | 2% |
| 201-250 | 479 | <1% | 424 | <1% | 1,115 | 1% |
| 151-200 | 213 | <1% | 181 | <1% | 471 | 0% |
| 101-150 | 65 | <1% | 46 | <1% | 146 | 0% |
| 1-100 | 10 | <1% | 4 | <1% | 15 | 0% |
| 136,998 | 100% | 145,640 | 100% | 192,381 | 100% | |
Source: MBR_FACT_EE Pool as of January 09, 2023
Who was invited to apply for permanent residence through Express Entry?
In 2022, IRCC continued to leverage the flexibility and responsiveness of the EE system to support the Department in meeting the Government of Canada’s 2021-2023 Immigration Levels Plan. Travel restrictions throughout most of 2020 and 2021 as a result of the COVID-19 pandemic delayed the processing of overseas applications, which led to significant growth in the FHS immigration programs processing inventory. To manage the large processing inventory and position IRCC to process existing applications in a timely manner, the Department temporarily paused EE ITAs to FHS immigration programs from September 2021 to July 2022, while continuing to issue ITAs to PNP nominees throughout this period. ITAs to FHS immigration programs resumed once the processing inventory had fallen to a point where new applications received could be processed within the six month service standard. As a result, between January and June 2022, IRCC held 13 PNP-specific invitation rounds and 11 generic rounds between July and November 2022. There were no ITA round held in December 2022 due to introduction of NOC 21 followed by technical difficulties in the GCMS system.
As displayed in Table 10, IRCC held 24 ITA rounds and issued 46,539 invitations in 2022, a 59% decrease from the 114,431 invitations issued in 2021. This reflects the Department’s decision to temporarily pause ITAs to the FHS immigration programs managed under EE, while only continuing PNP-specific rounds from September 2021 until July 2022.
Further, as a result of temporary general round invitation pauses, in 2022, the majority of ITAs were issued to candidates under two programs, 19,258 under PNP and 18,895 under CEC. The remaining 8,386 ITAs were issued to candidates under FSWP and no ITAs were issued under FSTP in 2022. This demonstrates a difference in distribution from 2021, where only CEC-specific and PNP-specific invitation rounds were held given Department’s strategy to target CEC- and PNP-eligible candidates, who were more likely to be physically located in Canada and therefore less impacted by pandemic-related border restrictions.
In terms of candidates invited to apply, CRS cut-off scores in 2022 ranged from 674 to 808 for PNP-specific rounds (median = 754), and from 491 to 557 for generic rounds (median = 510). The CRS cut-off scores of generic rounds could be seen to decrease throughout the year as the number of total ITAs issued per round increased, while the number of total ITAs issued for PNP-specific rounds were generally more consistent but also saw a similar variation in cut-off scores. All rounds of invitations were conducted in line with the associated MIs.
| Invitation to apply date | Round TypeFootnote * | CRS cut-off | CEC # | PNP # | FSWP # | FSTP # | Total ITAs # |
|---|---|---|---|---|---|---|---|
| 2022-01-05 | PNP | 808 | 0 | 392 | 0 | 0 | 392 |
| 2022-01-19 | PNP | 745 | 0 | 1,036 | 0 | 0 | 1,036 |
| 2022-02-02 | PNP | 674 | 0 | 1,070 | 0 | 0 | 1,070 |
| 2022-02-16 | PNP | 710 | 0 | 1,082 | 0 | 0 | 1,082 |
| 2022-03-02 | PNP | 761 | 0 | 1,047 | 0 | 0 | 1,047 |
| 2022-03-16 | PNP | 754 | 0 | 924 | 0 | 0 | 924 |
| 2022-03-30 | PNP | 785 | 0 | 919 | 0 | 0 | 919 |
| 2022-04-13 | PNP | 782 | 0 | 787 | 0 | 0 | 787 |
| 2022-04-27 | PNP | 772 | 0 | 829 | 0 | 0 | 829 |
| 2022-05-11 | PNP | 753 | 0 | 545 | 0 | 0 | 545 |
| 2022-05-25 | PNP | 741 | 0 | 590 | 0 | 0 | 590 |
| 2022-06-08 | PNP | 796 | 0 | 932 | 0 | 0 | 932 |
| 2022-06-22 | PNP | 752 | 0 | 636 | 0 | 0 | 636 |
| 2022-07-06 | Generic | 557 | 595 | 700 | 205 | 0 | 1,500 |
| 2022-07-20 | Generic | 542 | 569 | 764 | 417 | 0 | 1,750 |
| 2022-08-03 | Generic | 533 | 928 | 704 | 368 | 0 | 2,000 |
| 2022-08-17 | Generic | 525 | 1,103 | 658 | 489 | 0 | 2,250 |
| 2022-08-31 | Generic | 516 | 1,398 | 570 | 782 | 0 | 2,750 |
| 2022-09-14 | Generic | 510 | 1,975 | 581 | 694 | 0 | 3,250 |
| 2022-09-28 | Generic | 504 | 2,108 | 628 | 1,014 | 0 | 3,750 |
| 2022-10-12 | Generic | 500 | 2,498 | 721 | 1,031 | 0 | 4,250 |
| 2022-10-26 | Generic | 496 | 2,600 | 996 | 1,154 | 0 | 4,750 |
| 2022-11-09 | Generic | 494 | 2,421 | 1,204 | 1,125 | 0 | 4,750 |
| 2022-11-23 | Generic | 491 | 2,700 | 943 | 1,107 | 0 | 4,750 |
| Total | 18,895 | 19,258 | 8,386 | 0 | 46,539 |
Source: MBR_FACT_EE_MAIN as of January 09, 2023
Overall, when comparing Tables 11 and 12, it can be seen that men received the majority (58%) of invitations issued in 2022 – similar to the share of eligible profile submissions made by men from total submissions in that year. When looking at the program type, men were issued higher proportions of invitation than women in both CEC (42% vs 39%, respectively) and PNP (43% and 39%, respectively).
This is a contrast to 2021, where a larger number and proportion of invitations issued to men and women (both at 87%) were under CEC. Further, while the proportion of invitations to apply issued under the PNP in 2021 to men and women (both at 13%) were significantly lower than 2022, the number of invitations issued in both years are comparable. This trend is a reflection of the Department’s temporary pause on ITAs in the context of ongoing COVID-19 pandemic-related travel restrictions. With the resumption of general rounds, in contrast to PNP and CEC ITAs, women were issued a higher proportion (22%) of invitations than men (15%) under the FSWP. There were no invitations issued under the FSTP in 2022. In 2022, only 1 invitation was issued to a candidate who indicated another gender, an unspecified gender or unknown. Because of the small counts, the data presented in this section of the report is not broken down by these gender categories.
| Program | 2020 # | 2020 % | 2021 # | 2021 % | 2022 # | 2022 % |
|---|---|---|---|---|---|---|
| CEC | 33,932 | 56% | 57,493 | 87% | 11,310 | 42% |
| PNP | 8,911 | 15% | 8,485 | 13% | 11,675 | 43% |
| FSWP | 17,888 | 29% | 0 | 0% | 4,112 | 15% |
| FSTP | 9 | 0% | 0 | 0% | 0 | 0% |
| Total | 60,740 | 100% | 65,978 | 100% | 27,097 | 100% |
Source: MBR_FACT_EE_MAIN as of January 09, 2023
| Program | 2020 # | 2020 % | 2021 # | 2021 % | 2022 # | 2022 % |
|---|---|---|---|---|---|---|
| CEC | 24,461 | 52% | 42,153 | 87% | 7,584 | 39% |
| PNP | 5,297 | 11% | 6,293 | 13% | 7,583 | 39% |
| FSWP | 16,843 | 36% | 0 | 0% | 4,273 | 22% |
| FSTP | 2 | 0% | 0 | 0% | 0 | 0% |
| Total | 46,603 | 100% | 48,446 | 100% | 19,440 | 100% |
Source: MBR_FACT_EE_MAIN as of January 09, 2023
Tables 13 to 17 display the socio-demographic characteristics of candidates invited to apply for permanent residence, and show shifting trends between 2020 and 2022, largely attributable to the uncommon invitation round strategies over the past couple of years, including focusing on CEC and PNP eligible candidates in 2020 and 2021 and temporary pauses of general rounds in fall of 2021 and 2022.
In terms of the age of candidates invited to apply, the share of invitations issued to those aged 20-29 (the age category associated with the highest number of points under the CRS) remained the largest group in 2022 (50%), but experienced a decline from 2021 (64%) and 2020 (63%). Those aged 30-34 represented the second largest age group and saw the largest proportional increase in 2022 (29%) from 2021 (19%).
Looking at the highest level of education of those invited to apply, in 2022, the largest proportion of invitations (46%) were issued to candidates with masters and entry-to-practice degrees, over double the proportion in 2021 (19%). In 2022, this was followed by candidates with post-secondary credential of three years or longer (40%), which decreased from 2021 (54%). The proportion of candidates with one or two year post-secondary credential as well as high school or less decreased in 2022 from 2021 and those with PhDs doubled in proportion over the same period. Overall candidates who received ITAs remained highly educated, with 90% claiming to hold a post-secondary educational credential of at least three years.
When considering the first official language proficiency of candidates invited to apply, general skill level slightly increased in 2022, despite a decline from 2020 to 2021. In 2022, the most common Canadian Language Benchmarks (CLB)/Niveaux de compétence linguistique canadiens (NCLC) level was 9 (33%) followed by level 10 (21%). These are higher proficiency levels than 2021, where the most common CLB/NCLC level of candidates invited were 7 (41%) and 8 (22%). In 2020, the most common CLB/NCLC levels among invited candidates were 9 (35%) and 7 (26%).
Looking at Canadian work experience (Table 16), in 2022, a majority of candidates invited to apply (62%) had at least one year of eligible Canadian work experience. This is a decline from 2021, where a significant proportion (92%) of candidates invited to apply had at least one year of eligible Canadian work experience. This can be attributed to the Department’s ITA strategy in 2021 as 87% (Table 11) of the ITAs were issued under CEC, a program that requires Canadian work experience. In 2022 (Table 16), 41% of invitations went to candidates with at least one year of eligible Canadian work experience followed by 35% of invitations being issued to candidates with no Canadian experience. While fewer candidates with significant foreign work experience were invited to apply in 2021, this shifted in 2022 as 58% (Table 17) of the invited candidates had 3 or more years of foreign work experience.
| Age category | 2020 # | 2020 % | 2021 # | 2021 % | 2022 # | 2022 % |
|---|---|---|---|---|---|---|
| <20 | 3 | 0% | 9 | < 1% | 0 | < 1% |
| 20-29 | 67,933 | 63% | 73,689 | 64% | 23,305 | 50% |
| 30-34 | 25,726 | 24% | 21,518 | 19% | 13,721 | 29% |
| 35-39 | 9,158 | 9% | 10,870 | 9% | 6,156 | 13% |
| 40-44 | 3,011 | 3% | 5,240 | 5% | 2,213 | 5% |
| 45+ | 1,518 | 1% | 3,101 | 3% | 1,143 | 2% |
| TotalFootnote * | 107,350 | 100% | 114,431 | 100% | 46,539 | 100% |
Source: MBR_FACT_EE_MAIN as of January 09, 2023
| Education level | 2020 # | 2020 % | 2021 # | 2021 % | 2022 # | 2022 % |
|---|---|---|---|---|---|---|
| High school or less | 923 | 1% | 3,404 | 3% | 540 | 1% |
| One or two year post-secondary credential | 7,552 | 7% | 25,476 | 22% | 4,050 | 9% |
| Post-secondary credential of three years or longer | 49,661 | 46% | 61,226 | 54% | 18,588 | 40% |
| Master's Degree or entry-to-practice professional degree | 45,521 | 42% | 22,215 | 19% | 21,278 | 46% |
| PhD | 3,693 | 3% | 2,110 | 2% | 2,083 | 4% |
| Total | 107,350 | 100% | 114,431 | 100% | 46,539 | 100% |
Source: MBR_FACT_EE_MAIN as of January 09, 2023
| First official language Level | 2020 # | 2020 % | 2021 # | 2021 % | 2022 # | 2022 % |
|---|---|---|---|---|---|---|
| CLB/NCLC 4 | 18 | < 1% | 31 | < 1% | 7 | < 1% |
| CLB/NCLC 5 | 761 | 1% | 5,161 | 5% | 817 | 2% |
| CLB/NCLC 6 | 2,614 | 2% | 13,551 | 12% | 2,094 | 4% |
| CLB/NCLC 7 | 28,187 | 26% | 47,271 | 41% | 9,444 | 20% |
| CLB/NCLC 8 | 21,453 | 20% | 25,457 | 22% | 8,709 | 19% |
| CLB/NCLC 9 | 37,483 | 35% | 14,959 | 13% | 15,587 | 33% |
| CLB/NCLC 10 | 16,834 | 16% | 8,001 | 7% | 9,881 | 21% |
| Total | 107,350 | 100% | 114,431 | 100% | 46,539 | 100% |
Source: MBR_FACT_EE_MAIN as of January 09, 2023
| Years of Canadian work experience | 2020 # | 2020 % | 2021 # | 2021 % | 2022 # | 2022 % |
|---|---|---|---|---|---|---|
| Less than one year | 1,895 | 2% | 1,178 | 1% | 1,957 | 4% |
| 1 year | 43,334 | 40% | 74,375 | 65% | 18,986 | 41% |
| 2 years | 17,883 | 17% | 23,465 | 21% | 7,246 | 16% |
| 3 years | 3,035 | 3% | 4,119 | 4% | 1,528 | 3% |
| 4 years | 616 | 1% | 1,021 | < 1% | 480 | 1% |
| 5 years or more | 524 | 0% | 791 | < 1% | 276 | < 1% |
| None | 40,063 | 37% | 9,482 | 8% | 16,066 | 35% |
| Total | 107,350 | 100% | 114,431 | 100% | 46,539 | 100% |
Source: MBR_FACT_EE_MAIN as of January 09, 2023
| Years of foreign work experience | 2020 # | 2020 % | 2021 # | 2021 % | 2022 # | 2022 % |
|---|---|---|---|---|---|---|
| No foreign work experience or less than one year | 33,751 | 31% | 66,344 | 58% | 12,569 | 27% |
| 1 year | 8,310 | 8% | 7,482 | 7% | 3,796 | 8% |
| 2 years | 5,619 | 5% | 5,621 | 5% | 3,267 | 7% |
| 3 years | 18,605 | 17% | 6,661 | 6% | 6,035 | 13% |
| 4 years | 12,227 | 11% | 5,515 | 5% | 4,621 | 10% |
| 5 years or more | 28,838 | 27% | 22,808 | 20% | 16,251 | 35% |
| Total | 107,350 | 100% | 114,431 | 100% | 46,539 | 100% |
Source: MBR_FACT_EE_MAIN as of January 09, 2023
Table 18 provides information on (a) invitations issued to candidates who were assigned additional points in each category and (b) invitations issued to candidates who met relevant criteria for the category but were not necessarily assigned points.Footnote 7 A maximum of 600 total additional points can be assigned under the CRS, meaning candidates assigned 600 points for a provincial nomination cannot be assigned other additional points, even if they meet the criteria. For example, in 2022, while 9,538 ITAs were issued to candidates who met criteria for Arranged Employment points, only 7,350 of these candidates were assigned the points in their CRS scores. Data are provided for both candidates who met criteria for and were assigned additional points to facilitate comparison, as well as to reflect the fuller characteristics of candidates who were invited to apply for permanent residence.Footnote 8 In 2022, less than one half of ITAs (45%) were issued on the basis of human capital attributes alone (i.e., to candidates who did not meet criteria for any additional points); this figure is up from 28% in 2020 and 14% in 2021.
In 2020, the number of additional points for French-language proficiency were increased. However, in 2021, fewer invitations were sent to candidates who were assigned and met criteria for that points category; this is likely due to the shift to CEC-specific rounds, as historically, most French-speaking candidates have been eligible to be invited under the FSWP but not the CEC. In 2022, with the recommencement of invitations under FSWP, there was a considerable increase in ITAs issued to French-speaking candidates.
| Additional point typeFootnote * | 2020 # | 2020 % | 2021 # | 2021 % | 2022 # | 2022 % |
|---|---|---|---|---|---|---|
| (a) Assigned additional points | ||||||
| No Additional Points | 30,376 | 28% | 16,018 | 14% | 20,933 | 45% |
| Provincial Nominee | 14,209 | 13% | 14,778 | 13% | 19,258 | 41% |
| Arranged Employment | 15,453 | 14% | 18,473 | 16% | 7,350 | 16% |
| Education in Canada | 41,470 | 39% | 67,410 | 59% | 12,625 | 27% |
| French-language proficiency | 6,157 | 6% | 1,282 | 1% | 6,251 | 13% |
| Siblings in Canada | 11,105 | 10% | 9,242 | 8% | 4,937 | 11% |
| (b) Met criteria for points | ||||||
| No Additional Points | 30,376 | 28% | 16,018 | 14% | 8,953 | 19% |
| Provincial Nominee | 14,209 | 13% | 14,778 | 13% | 19,258 | 41% |
| Arranged Employment | 17,249 | 16% | 20,299 | 18% | 9,538 | 20% |
| Education in Canada | 45,548 | 42% | 70,184 | 61% | 19,587 | 42% |
| French-language proficiency | 7,105 | 7% | 2,517 | 2% | 7,561 | 16% |
| Siblings in Canada | 12,827 | 12% | 11,551 | 10% | 7,766 | 17% |
| Total | 107,350 | 100% | 114,431 | 100% | 46,539 | 100% |
Source: MBR_FACT_EE_MAIN as of February 06, 2023
Tables 19 to 22 provide information on invitations issued to men and women who met the criteria to receive each additional point type. Education in Canada (19,587) and Arranged Employment (8,756) were the most common additional point types for which both men and women met criteria in 2022. While Education in Canada (11,819) and Arranged Employment (5,676) remained as the most common additional point type for men, the most common additional type for women was Education in Canada (7,768) and French-language proficiency (4,029) in 2022. The share of additional points for Arranged Employment for both genders remained stable over the last three years, with men meeting the criteria at a higher proportion (65%) than women (35%). There was a slightly higher number of ITAs issued to men for meeting the criteria for siblings in Canada (52%) than women (48%). While the number of ITAs issued to both genders were equal in 2020 and 2021, both at 50%, women (53%) met the criteria for French-language proficiency points at a slightly higher proportion to men (47%) in 2022.
| Gender | 2020 # | 2020 % | 2021 # | 2021 % | 2022 # | 2022 % |
|---|---|---|---|---|---|---|
| Men | 11,308 | 66% | 13,352 | 66% | 5,676 | 65% |
| Women | 5,939 | 34% | 6,946 | 34% | 3,080 | 35% |
| Total | 17,249 | 100% | 20,299 | 100% | 8,756 | 100% |
Source: MBR_FACT_EE_MAIN as of January 09, 2023
| Gender | 2020 # | 2020 % | 2021 # | 2021 % | 2022 # | 2022 % |
|---|---|---|---|---|---|---|
| Men | 25,909 | 57% | 38,903 | 55% | 11,819 | 60% |
| Women | 19,634 | 43% | 31,275 | 45% | 7,768 | 40% |
| Total | 45,548 | 100% | 70,184 | 100% | 19,587 | 100% |
Source: MBR_FACT_EE_MAIN as of February 06, 2023
| Gender | 2020 # | 2020 % | 2021 # | 2021 % | 2022 # | 2022 % |
|---|---|---|---|---|---|---|
| Men | 3,527 | 50% | 1,269 | 50% | 3,531 | 47% |
| Women | 3,578 | 50% | 1,248 | 50% | 4,029 | 53% |
| Total | 7,105 | 100% | 2,517 | 100% | 7,561 | 100% |
Source: MBR_FACT_EE_MAIN as of January 09, 2023
| Gender | 2020 # | 2020 % | 2021 # | 2021 % | 2022 # | 2022 % |
|---|---|---|---|---|---|---|
| Men | 6,560 | 51% | 6,311 | 55% | 4,010 | 52% |
| Women | 6,265 | 49% | 5,240 | 45% | 3,756 | 48% |
| Total | 12,827 | 100% | 11,551 | 100% | 7,766 | 100% |
Source: MBR_FACT_EE_MAIN as of January 09, 2023
As seen in Table 23, in 2022, there were significant shifts from previous years in the most common primary occupations among candidates invited to apply for permanent residency through EE. While in 2021, the shift to CEC- and PNP-specific rounds of invitations resulted in a significantly higher number of candidates with TEER 2 occupations (i.e., occupations that usually require a college diploma, including occupations that require apprenticeship training of 2 or more years, or supervisory occupations), candidates with TEER 1 occupations (occupations that usually require a university degree) made-up a significant proportion of ITAs in 2022. Similar to 2020, software engineers and designers, information systems specialists and computer systems developers and programmers, which are related mainly to the technological field, were the most common occupations and made-up a significant proportion of the candidates invited to apply through EE in 2022.
| Primary Occupation | TEER | 2020 # | Primary Occupation | TEER | 2021 # | Primary Occupation | TEER | 2022 # |
|---|---|---|---|---|---|---|---|---|
| 21231 Software engineers and designers | 1 | 6,665 | 62020 Food service supervisors | 2 | 13,097 | 21231 Software engineers and designers | 1 | 3,848 |
| 21222 Information systems specialists | 1 | 4,846 | 13200 Customs, ship and other brokers | 3 | 6,107 | 21222 Information systems specialists | 1 | 1,889 |
| 21230 Computer systems developers and programmers | 1 | 4,661 | 62010 Retail sales supervisors | 2 | 5,020 | 21230 Computer systems developers and programmers | 1 | 1,855 |
| 62020 Food service supervisors | 2 | 4,228 | 21231 Software engineers and designers | 1 | 4,916 | 62020 Food service supervisors | 2 | 1,558 |
| 13200 Customs, ship and other brokers | 3 | 4,104 | 63200 Cooks | 3 | 4,624 | 11202 Professional occupations in advertising, marketing and public relations | 1 | 1,025 |
| 11100 Financial auditors and accountants | 1 | 2,623 | 21230 Computer systems developers and programmers | 1 | 3,878 | 21223 Database analysts and data administrators | 1 | 1,025 |
| 13100 Administrative officers | 3 | 2,366 | 21222 Information systems specialists | 1 | 3,056 | 41200 University professors and lecturers | 1 | 955 |
| 11202 Professional occupations in advertising, marketing and public relations | 1 | 2,327 | 22221 User support technicians | 2 | 3,001 | 13200 Customs, ship and other brokers | 3 | 945 |
| 12200 Accounting technicians and bookkeepers | 2 | 2,128 | 60030 Restaurant and food service managers | 0 | 2,977 | 11201 Professional occupations in business management consulting | 1 | 901 |
| 62010 Retail sales supervisors | 2 | 2,119 | 13100 Administrative officers | 3 | 2,723 | 11100 Financial auditors and accountants | 1 | 857 |
| 22221 User support technicians | 2 | 2,043 | 12013 Supervisors, supply chain, tracking and scheduling | 2 | 2,539 | 20012 Computer and information systems managers | 0 | 855 |
| 41200 University professors and lecturers | 1 | 1,823 | 60020 Retail and wholesale trade managers | 0 | 2,332 | 22221 User support technicians | 2 | 842 |
| 21223 Database analysts and data administrators | 1 | 1,767 | 12200 Accounting technicians and bookkeepers | 2 | 2,172 | 10022 Advertising, marketing and public relations managers | 0 | 812 |
| 60020 Retail and wholesale trade managers | 0 | 1,699 | 42202 Early childhood educators and assistants | 2 | 1,650 | 13100 Administrative officers | 3 | 800 |
| 11201 Professional occupations in business management consulting | 1 | 1,680 | 63102 Financial sales representatives | 3 | 1,594 | 63200 Cooks | 3 | 728 |
| Other | 62,271 | 54,835 | 27,664 | |||||
| Total | 107,350 | Total | 114,431 | Total | 46,539 |
Source: MBR_FACT_EE_MAIN as of February 06, 2023
TEER Definition
TEER 0: Management occupations examples Advertising, marketing and public relations managers, financial managers
TEER 1: Occupations that usually require a university degree, examples - Financial advisors, Software engineers
TEER 2: Occupations that usually require a college diploma, including occupations that require apprenticeship training of 2 or more years, or supervisory occupations
TEER 3: Occupations that usually require, a college diploma, including occupations that require apprenticeship training of less than 2 years, or more than 6 months of on-the-job training
As seen in Table 24 and 25, there were differences in the 15 most common primary occupations at the time of invitation for men and women in 2022. While the most common primary occupation at the time of invitation in 2022 were identical (software engineers and designers), men and women’s other top occupations differed to some extent. For example, almost half of the primary occupations were shared although their order of precedence differed. In addition, for women, nine primary occupations were TEER 1 whereas for men seven occupations were TEER 1.
The top 15 occupations amongst men that were not in the top 15 for women include: web developers and programmers, retail sales supervisors, technical sales specialist- wholesale trade, machinist and machining and tooling inspectors, senior managers-financial, communications and other business services, cooks, and other user support technicians. The top 15 occupations amongst women that were not in the top 15 for men include: customs, ship and other brokers, professional occupations in advertising, marketing and public relations managers, financial auditors and accountants, accounting technicians and bookkeepers, and registered nurses and registered psychiatric nurses.
The top four occupations amongst men that were not in the top 15 for women include: user support technician, cooks, senior managers-financial, communications and public relations managers and machinists and machining and tooling inspectors. The top four occupations amongst women that are not in the top 15 for men include: early childhood educators and assistants; accounting technicians and bookkeepers; professional occupations in advertising, marketing and public relations; and financial sales representatives.
| Primary Occupation | TEER | 2020 # | Primary Occupation | TEER | 2021 # | Primary Occupation | TEER | 2022 # |
|---|---|---|---|---|---|---|---|---|
| 21231 Software engineers and designers | 1 | 5,005 | 62020 Food service supervisors | 2 | 5,176 | 21231 Software engineers and designers | 1 | 2,945 |
| 21230 Computer systems developers and programmers | 1 | 3,563 | 21231 Software engineers and designers | 1 | 3,806 | 21230 Computer systems developers and programmers | 1 | 1,402 |
| 21222 Information systems specialists | 1 | 3,335 | 63200 Cooks | 3 | 3,119 | 21222 Information systems specialists | 1 | 1,248 |
| 62020 Food service supervisors | 2 | 1,754 | 62010 Retail sales supervisors | 2 | 3,096 | 62020 Food service supervisors | 2 | 684 |
| 22221 User support technicians | 2 | 1,350 | 21230 Computer systems developers and programmers | 1 | 2,992 | 21223 Database analysts and data administrators | 1 | 662 |
| 62010 Retail sales supervisors | 2 | 1,269 | 21222 Information systems specialists | 1 | 2,233 | 20012 Computer and information systems managers | 0 | 624 |
| 21301 Mechanical engineers | 1 | 1,228 | 22221 User support technicians | 2 | 1,949 | 41200 University professors and lecturers | 1 | 554 |
| 11100 Financial auditors and accountants | 1 | 1,182 | 12013 Supervisors, supply chain, tracking and scheduling | 2 | 1,830 | 22221 User support technicians | 2 | 528 |
| 13200 Customs, ship and other brokers | 3 | 1,149 | 13200 Customs, ship and other brokers | 3 | 1,748 | 11201 Professional occupations in business management consulting | 1 | 471 |
| 21223 Database analysts and data administrators | 1 | 1,126 | 60020 Retail and wholesale trade managers | 0 | 1,469 | 63200 Cooks | 3 | 467 |
| 12013 Supervisors, supply chain, tracking and scheduling | 2 | 1,091 | 60030 Restaurant and food service managers | 0 | 1,399 | 00012 Senior managers- financial, communication and other business services | 0 | 462 |
| 60020 Retail and wholesale trade managers | 0 | 1,063 | 72100 Machinists and machining and tooling inspectors | 2 | 1,276 | 72100 Machinists and machining and tooling inspectors | 2 | 455 |
| 20012 Computer and information systems managers | 0 | 1,031 | 20012 Computer and information systems managers | 0 | 1,073 | 62100 Technical sales specialists-wholesale trade | 2 | 445 |
| 41200 University professors and lecturers | 1 | 999 | 72205 Telecommunications equipment installation and cable television service | 2 | 957 | 62010 Retail sales supervisors | 2 | 435 |
| 63200 Cooks | 3 | 958 | 13100 Administrative officers | 3 | 946 | 21234 Web developers and programmers | 1 | 424 |
| Other | 34,637 | 32,909 | 15,291 | |||||
| Total | 60,742 | Total | 65,978 | Total | 27,097 |
Source: MBR_FACT_EE_MAIN as of February 06, 2023
| Primary Occupation | TEER | 2020 # | Primary Occupation | TEER | 2021 # | Primary Occupation | TEER | 2022 # |
|---|---|---|---|---|---|---|---|---|
| 13200 Customs, ship and other brokers | 3 | 2,955 | 62020 Food service supervisors | 2 | 7,921 | 21231 Software engineers and designers | 1 | 903 |
| 62020 Food service supervisors | 2 | 2,474 | 13200 Customs, ship and other brokers | 3 | 4,267 | 62020 Food service supervisors | 2 | 874 |
| 21231 Software engineers and designers | 1 | 1,660 | 62010 Retail sales supervisors | 2 | 1,924 | 13200 Customs, ship and other brokers | 3 | 706 |
| 13100 Administrative officers | 3 | 1,534 | 13100 Administrative officers | 3 | 1,776 | 21222 Information systems specialists | 1 | 641 |
| 21222 Information systems specialists | 1 | 1,511 | 42202 Early childhood educators and assistants | 2 | 1,580 | 11202 Professional occupations in advertising, marketing and public relations | 1 | 636 |
| 11202 Professional occupations in advertising, marketing and public relations | 1 | 1,463 | 60030 Restaurant and food service managers | 0 | 1,578 | 13100 Administrative officers | 3 | 554 |
| 11100 Financial auditors and accountants | 1 | 1,441 | 63200 Cooks | 3 | 1,505 | 42202 Early childhood educators and assistants | 2 | 489 |
| 12200 Accounting technicians and bookkeepers | 2 | 1,252 | 12200 Accounting technicians and bookkeepers | 2 | 1,381 | 10022 Advertising, marketing and public relations managers | 0 | 485 |
| 21230 Computer systems developers and programmers | 1 | 1,098 | 21231 Software engineers and designers | 1 | 1,110 | 11100 Financial auditors and accountants | 1 | 479 |
| 10022 Advertising, marketing and public relations managers | 0 | 885 | 22221 User support technicians | 2 | 1,051 | 21230 Computer systems developers and programmers | 1 | 453 |
| 62010 Retail sales supervisors | 2 | 850 | 11202 Professional occupations in advertising, marketing and public relations | 1 | 944 | 11201 Professional occupations in business management consulting | 1 | 430 |
| 41200 University professors and lecturers | 1 | 824 | 21230 Computer systems developers and programmers | 1 | 886 | 12200 Accounting technicians and bookkeepers | 2 | 422 |
| 11201 Professional occupations in business management consulting | 1 | 801 | 60020 Retail and wholesale trade managers | 0 | 863 | 41200 University professors and lecturers | 1 | 999 |
| 60030 Restaurant and food service managers | 0 | 801 | 21222 Information systems specialists | 1 | 823 | 31301 Registered nurses and registered psychiatric nurses | 1 | 385 |
| 63102 Financial sales representative | 3 | 737 | 63102 Financial sales representative | 3 | 799 | 21223 Database analysts and data administrators | 1 | 363 |
| Other | 26,317 | 20,039 | 11,220 | |||||
| Total | 46,603 | Total | 48,447 | Total | 19,441 |
Source: MBR_FACT_EE_MAIN as of February 06, 2023
Table 26 displays the most common occupations among candidates invited to apply who were assigned Arranged Employment points. The most common Arranged Employment occupation changed from food service supervisors (TEER 2) in both 2020 and 2021, to software engineers and designers (TEER 1) in 2022. In 2022, there was an equal distribution among the TEER categories of the top 15 occupations, including four TEER 0 occupations, four TEER 1 occupations, four TEER 2 occupations and three TEER 3 occupations.
| Arranged employment occupation | TEER | 2020 # | Arranged employment occupation | TEER | 2021 # | Arranged employment occupation | TEER | 2022 # |
|---|---|---|---|---|---|---|---|---|
| 62020 Food service supervisors | 2 | 1,792 | 62020 Food service supervisors | 2 | 2,863 | 21231 Software engineers and designers | 1 | 1,173 |
| 21230 Computer systems developers and programmers | 1 | 1,615 | 63200 Cooks | 3 | 1,925 | 21230 Computer systems developers and programmers | 1 | 641 |
| 21231 Software engineers and designers | 1 | 1,391 | 21231 Software engineers and designers | 1 | 1,272 | 21222 Information systems specialists | 1 | 497 |
| 21222 Information systems specialists | 1 | 1,005 | 21230 Computer systems developers and programmers | 1 | 1,246 | 62020 Food service supervisors | 2 | 497 |
| 63200 Cooks | 3 | 646 | 21222 Information systems specialists | 1 | 861 | 41200 University professors and lecturers | 1 | 475 |
| 13200 Customs, ship and other brokers | 3 | 565 | 62010 Retail sales supervisors | 2 | 778 | 00012 Senior managers- financial, communication and other business services | 0 | 434 |
| 41200 University professors and lecturers | 1 | 545 | 13200 Customs, ship and other brokers | 3 | 632 | 00015 Senior managers- construction, transportation, production and utilities | 0 | 313 |
| 20012 Computer and information systems managers | 0 | 542 | 20012 Computer and information systems managers | 0 | 629 | 20012 Computer and information systems managers | 0 | 276 |
| 62010 Retail sales supervisors | 2 | 493 | 60030 Restaurant and food service managers | 0 | 489 | 13100 Administrative officers | 3 | 233 |
| 13100 Administrative officers | 3 | 448 | 13100 Administrative officers | 3 | 447 | 13200 Customs, ship and other brokers | 3 | 230 |
| 00012 Senior managers- financial, communication and other business services | 0 | 444 | 42202 Early childhood educators and assistants | 2 | 414 | 63200 Cooks | 3 | 226 |
| 60030 Restaurant and food service managers | 0 | 434 | 41200 University professors and lecturers | 1 | 358 | 00014 Senior managers- trade, broadcasting and other services | 0 | 213 |
| 12200 Accounting technicians and bookkeepers | 2 | 271 | 82030 Agricultural service contractors and farm supervisors | 2 | 314 | 52120 Graphic designers and illustrators | 2 | 190 |
| 52120 Graphic designers and illustrators | 2 | 264 | 62200 Chefs | 2 | 265 | 42202 Early childhood educators and assistants | 2 | 169 |
| 12013 Supervisors, supply chain, tracking and scheduling coordination occupations | 2 | 262 | 52120 Graphic designers and illustrators | 2 | 263 | 12200 Accounting technicians and bookkeepers | 2 | 162 |
| Other | 6,532 | 7,534 | 3,854 | |||||
| Total | 17,249 | Total | 20,299 | Total | 9,583 |
Source: MBR_FACT_EE_MAIN as of February 06, 2023
Table 27 and 28 show the most common occupations for candidates with Arranged Employment points who received ITAs, broken down by gender. The most common occupations among invited men with Arranged Employment points included more TEER 1 occupations in comparison to their female counterparts. While women’s top occupation, food service supervisors, remained the same from 2020 to 2022, men’s top occupation shifted from cooks in 2021 to software engineers and designers in 2022. The top six occupations changed for men from 2021 to 2022 as there was a shift towards a higher number of TEER 1 and TEER 0 occupations. There were also some changes to the order of precedence for the top six occupations for women from 2021 to 2022 as the proportion of TEERs were equally shared for TEER 0, 1, 2 and 3.
| Arranged employment occupation | TEER | 2020 # | Arranged employment occupation | TEER | 2021 # | Arranged employment occupation | TEER | 2022 # |
|---|---|---|---|---|---|---|---|---|
| 21230 Computer systems developers and programmers | 1 | 1,354 | 63200 Cooks | 3 | 1,295 | 21231 Software engineers and designers | 1 | 975 |
| 21231 Software engineers and designers | 1 | 1,221 | 62020 Food service supervisors | 2 | 1,172 | 21230 Computer systems developers and programmers | 1 | 544 |
| 21222 Information systems specialists | 1 | 841 | 21231 Software engineers and designers | 1 | 1,144 | 21222 Information systems specialists | 1 | 372 |
| 62020 Food service supervisors | 2 | 748 | 21230 Computer systems developers and programmers | 1 | 1,091 | 00012 Senior managers- financial, communication and other business services | 0 | 334 |
| 20012 Computer and information systems managers | 0 | 472 | 21222 Information systems specialists | 1 | 720 | 41200 University professors and lecturers | 1 | 287 |
| 63200 Cooks | 3 | 419 | 20012 Computer and information systems managers | 0 | 561 | 00015 Senior managers- construction, transportation, production and utilities | 0 | 248 |
| 00012 Senior managers- financial, communication and other business services | 0 | 355 | 62010 Retail sales supervisors | 2 | 527 | 20012 Computer and information systems managers | 0 | 229 |
| 41200 University professors and lecturers | 1 | 350 | 72310 Carpenters | 2 | 248 | 62020 Food service supervisors | 2 | 210 |
| 62010 Retail sales supervisors | 2 | 323 | 60030 Restaurant and food service managers | 0 | 236 | 00014 Senior managers- trade, broadcasting and other services | 0 | 150 |
| 00015 Senior managers- construction, transportation, production and utilities | 0 | 214 | 62200 Chefs | 2 | 229 | 63200 Cooks | 3 | 130 |
| 12013 Supervisors, supply chain, tracking and scheduling | 2 | 200 | 82030 Agricultural service contractors and farm supervisors | 2 | 229 | 52120 Graphic designers and illustrators | 2 | 126 |
| 60030 Restaurant and food service managers | 0 | 196 | 13200 Customs, ship and other brokers | 3 | 211 | 62010 Retail sales supervisors | 2 | 121 |
| 13200 Customs, ship and other brokers | 3 | 189 | 41200 University professors and lecturers | 1 | 207 | 21223 Database analysts and data administrators | 1 | 113 |
| 52120 Graphic designers and illustrators | 2 | 174 | 52120 Graphic designers and illustrators | 2 | 191 | 60030 Restaurant and food service managers | 0 | 75 |
| 00014 Senior managers- trade, broadcasting and other services | 0 | 162 | 12013 Supervisors, supply chain, tracking and scheduling coordination occupations | 2 | 187 | 21234 Web developers and programmers | 1 | 71 |
| Other | 4,091 | 5,103 | 2,211 | |||||
| Total | 11,309 | Total | 13,351 | Total | 6,196 |
Source: MBR_FACT_EE_MAIN as of February 06, 2023
| Arranged employment occupation | TEER | 2020 # | Arranged employment occupation | TEER | 2021 # | Arranged employment occupation | TEER | 2022 # |
|---|---|---|---|---|---|---|---|---|
| 62020 Food service supervisors | 2 | 1,044 | 62020 Food service supervisors | 2 | 1,691 | 62020 Food service supervisors | 2 | 287 |
| 13200 Customs, ship and other brokers | 3 | 376 | 63200 Cooks | 3 | 630 | 21231 Software engineers and designers | 1 | 198 |
| 13100 Administrative officers | 3 | 298 | 13200 Customs, ship and other brokers | 3 | 420 | 41200 University professors and lecturers | 1 | 188 |
| 21230 Computer systems developers and programmers | 1 | 261 | 42202 Early childhood educators and assistants | 2 | 403 | 13200 Customs, ship and other brokers | 3 | 172 |
| 42202 Early childhood educators and assistants | 2 | 242 | 13100 Administrative officers | 3 | 279 | 13100 Administrative officers | 3 | 164 |
| 60030 Restaurant and food service managers | 0 | 238 | 60030 Restaurant and food service managers | 0 | 262 | 42202 Early childhood educators and assistants | 2 | 163 |
| 63200 Cooks | 3 | 227 | 62010 Retail sales supervisors | 2 | 251 | 21222 Information systems specialists | 1 | 125 |
| 41200 University professors and lecturers | 1 | 195 | 21230 Computer systems developers and programmers | 1 | 155 | 12200 Accounting technicians and bookkeepers | 2 | 103 |
| 21231 Software engineers and designers | 1 | 170 | 41200 University professors and lecturers | 1 | 151 | 00012 Senior managers- financial, communication and other business services | 0 | 100 |
| 62010 Retail sales supervisors | 2 | 170 | 12200 Accounting technicians and bookkeepers | 2 | 146 | 21230 Computer systems developers and programmers | 1 | 97 |
| 12200 Accounting technicians and bookkeepers | 2 | 168 | 21222 Information systems specialists | 1 | 141 | 63200 Cooks | 3 | 96 |
| 21222 Information systems specialists | 1 | 164 | 21231 Software engineers and designers | 1 | 128 | 00015 Senior managers- construction, transportation, production and utilities | 0 | 65 |
| 52120 Graphic designers and illustrators | 2 | 90 | 63202 Bakers | 3 | 100 | 52120 Graphic designers and illustrators | 2 | 64 |
| 00012 Senior managers- financial, communication and other business services | 0 | 88 | 42204 Religion workers | 2 | 94 | 60030 Restaurant and food service managers | 0 | 64 |
| 11202 Professional occupations in advertising, marketing and public relations | 1 | 81 | 82030 Agricultural service contractors and farm supervisors | 2 | 85 | 00014 Senior managers- trade, broadcasting and other services | 0 | 63 |
| Other | 2,171 | 2,011 | 1,438 | |||||
| Total | 5,983 | Total | 6,947 | Total | 3,387 |
Source: MBR_FACT_EE_MAIN as of February 06, 2023
Table 29 shows that the three most common countries of residence among candidates who received an ITA remained the same from 2021 to 2022. While Canada has consistently been the top country of residence of candidates who receive an ITA, the proportion of ITAs issued to this group decreased from 90% in 2021 to 68% in 2022, reflecting the resumption of general invitation rounds following a focus on CEC-specific rounds. Over the same period, the proportion of invited candidates who indicated India as their country of residence increased from 3% in 2021 to 8% in 2022, and the share of invited candidates residing in Nigeria increased from 1% (2021) to 4% in 2022.
| Country of Residence | 2020 # | Country of residence | 2021 # | Country of residence | 2022 # |
|---|---|---|---|---|---|
| Canada | 68,061 | Canada | 102,906 | Canada | 31,486 |
| India | 11,031 | India | 3,772 | India | 3,787 |
| USA | 7,228 | Nigeria | 1,393 | Nigeria | 1,730 |
| Nigeria | 3,939 | USA | 851 | Cameroon | 1,063 |
| UAE | 1,462 | China | 716 | USA | 842 |
| Pakistan | 1,249 | UAE | 463 | Morocco | 793 |
| Australia | 1,051 | UK and Overseas Territories | 379 | UAE | 683 |
| China | 985 | Pakistan | 265 | Lebanon | 559 |
| UK and Overseas Territories | 923 | Morocco | 232 | Algeria | 550 |
| Lebanon | 896 | Lebanon | 199 | France | 381 |
| Other | 10,525 | Other | 3,255 | Other | 4,665 |
| Total | 107,350 | Total | 114,431 | Total | 46,539 |
Source: MBR_FACT_EE_MAIN as of January 09, 2023
As displayed in Tables 30 and 31, the most common countries of residence were the same for both men and women in 2021 and 2022. In 2022, a smaller proportion of women (61%) than men (72%) indicated Canada as their country of residence.
| Country of Residence | 2020 # | Country of residence | 2021 # | Country of residence | 2022 # |
|---|---|---|---|---|---|
| Canada | 40,282 | Canada | 59,758 | Canada | 19,539 |
| India | 5,660 | India | 2,140 | India | 2,001 |
| USA | 4,519 | Nigeria | 600 | Nigeria | 689 |
| Nigeria | 1,494 | USA | 578 | USA | 504 |
| Pakistan | 725 | China | 289 | Cameroon | 481 |
| UAE | 722 | UAE | 248 | Morocco | 372 |
| Australia | 601 | UK and Overseas Territories | 219 | UAE | 336 |
| UK and Overseas Territories | 510 | Pakistan | 169 | Algeria | 241 |
| China | 434 | Morocco | 121 | France | 215 |
| Morocco | 419 | Australia | 102 | Pakistan | 207 |
| Other | 5,374 | Other | 1,754 | Other | 2,512 |
| Total | 60,740 | Total | 65,978 | Total | 27,097 |
Source: MBR_FACT_EE_MAIN as of January 09, 2023
| Country of residence | 2020 # | Country of residence | 2021 # | Country of residence | 2022 # |
|---|---|---|---|---|---|
| Canada | 27,773 | Canada | 43,141 | Canada | 11,946 |
| India | 5,370 | India | 1,632 | India | 1,786 |
| USA | 2,709 | Nigeria | 793 | Nigeria | 1,041 |
| Nigeria | 2,445 | China | 427 | Cameroon | 582 |
| UAE | 740 | USA | 273 | Morocco | 421 |
| China | 551 | UAE | 215 | Lebanon | 359 |
| Lebanon | 529 | UK and Overseas Territories | 160 | UAE | 347 |
| Pakistan | 524 | Lebanon | 127 | USA | 338 |
| Australia | 450 | Morocco | 111 | Algeria | 309 |
| Cameroon | 443 | Pakistan | 96 | UK and Overseas Territories | 183 |
| Other | 5,069 | Other | 1,471 | Other | 2,128 |
| Total | 46,603 | Total | 48,446 | Total | 19,440 |
Source: MBR_FACT_EE_MAIN as of January 09, 2023
As displayed in Table 32, the top two countries of citizenship among candidates who received an ITA changed from India and China in 2020 and 2021, to India and Nigeria in 2022. While India remained the most common country of citizenship by a significant and growing margin (from 47% in 2020 to 57% in 2021), the margin (44%) decreased in 2022. India and the People’s Republic of China remained in the top three countries of citizenship since 2020, Nigeria moved up from being the fourth most common country of citizenship in 2021 to being second in 2022. Looking at the top 10 most common countries of citizenship among candidates who received an ITA, notable changes from 2021 to 2022 include: South Korea, Ireland, Vietnam, UK and Overseas Territories and Brazil falling out of the top 10 from 2021 to 2022; Pakistan, USA, Morocco, France, and Cameroon entered among the top 10 most common countries of citizenship in 2022; the People’s Republic of China dropped from second to third most common country of citizenship; and Iran moved from eighth to fifth most common country of citizenship. From 2021 to 2022, the proportion of citizenships outside the top 10 (i.e. “Other in Table 32) increased from 18% in 2021 to 28% in 2022, indicating that the citizenship profile of invited candidates is becoming more diverse.
| Country of citizenship | 2020 # | Country of citizenship | 2021 # | Country of citizenship | 2022 # |
|---|---|---|---|---|---|
| India | 50,920 | India | 65,565 | India | 20,769 |
| China | 8,944 | China | 9,590 | Nigeria | 2,909 |
| Nigeria | 6,549 | South Korea | 3,131 | China | 2,456 |
| Pakistan | 2,823 | Nigeria | 3,126 | Cameroon | 1,218 |
| UK and Overseas Territories | 2,712 | Brazil | 2,880 | Iran | 1,210 |
| Brazil | 2,446 | Philippines | 2,428 | France | 1,069 |
| Iran | 1,935 | UK and Overseas Territories | 2,306 | Morocco | 978 |
| South Korea | 1,652 | Iran | 1,701 | USA | 939 |
| USA | 1,641 | Vietnam | 1,514 | Philippines | 934 |
| Ireland | 1,564 | Ireland | 1,351 | Pakistan | 923 |
| Other | 26,164 | Other | 20,839 | Other | 13,134 |
| Total | 107,350 | Total | 114,431 | Total | 46,539 |
Source: MBR_FACT_EE_MAIN as of January 09, 2023
Tables 33 and 34 look at the gender breakdown of most common country of citizenship among candidates who received ITAs. They show that India, the People’s Republic of China, and Nigeria were the most common countries of citizenship for both men and women who were invited to apply for permanent residence in 2022. Men with Indian citizenship (49%) continued to have a greater proportion of ITAs then women (38%), even though these proportions decreased when compared to 2021. Women with Chinese citizenship (6%) and Nigerian citizenship (8%) had a slightly larger proportion of ITAs issued than men with Chinese (4.5%) and Nigerian (4.5%) citizenship. There were some differences in the top 10 countries amongst men and women in 2022. For example, Pakistan, UK and Overseas Territories and Brazil were in the top 10 countries for men, but not women, while Morocco, Lebanon and Philippines were in the top 10 countries for women, but not men.
| Country of citizenship | 2020 # | Country of citizenship | 2021 # | Country of citizenship | 2022 # |
|---|---|---|---|---|---|
| India | 31,857 | India | 39,990 | India | 13,323 |
| China | 3,746 | China | 4,235 | Nigeria | 1,275 |
| Nigeria | 2,815 | Brazil | 1,753 | China | 1,218 |
| Pakistan | 1,905 | Nigeria | 1,560 | Iran | 717 |
| UK and Overseas Territories | 1,641 | UK and Overseas Territories | 1,437 | Pakistan |
633 |
| Brazil | 1,423 | South Korea | 1,339 | Cameroon | 563 |
| Iran | 1,129 | Iran | 1,030 | France | 559 |
| Ireland | 950 | Philippines | 1,014 | UK and Overseas Territories |
543 |
| USA | 909 | Pakistan | 883 | Brazil | 540 |
| France | 853 | Ireland | 798 | USA | 526 |
| Other | 13,512 | Other | 11,939 | Other | 7,200 |
| Total | 60,740 | Total | 65,978 | Total | 27,097 |
Source: MBR_FACT_EE_MAIN as of January 09, 2023
| Country of citizenship | 2020 # | Country of citizenship | 2021 # | Country of citizenship | 2022 # |
|---|---|---|---|---|---|
|
India |
19,059 | India | 25,574 | India | 7,446 |
| China | 5,197 | China | 5,353 | Nigeria | 1,634 |
| Nigeria | 3,734 | South Korea | 1,792 | China | 1,238 |
| UK and Overseas Territories | 1,071 | Nigeria | 1,566 | Cameroon | 655 |
| Brazil | 1,023 | Philippines | 1,414 | Philippines | 539 |
| South Korea | 1,010 | Brazil | 1,127 | Lebanon | 510 |
| Pakistan | 918 | UK and Overseas Territories | 869 | France | 509 |
| Iran | 806 | Vietnam | 848 | Morocco | 501 |
| Philippines | 776 | Iran | 671 | Iran | 493 |
| USA | 732 | Ireland | 553 | USA | 413 |
| Other | 12,277 | Other | 8,679 | Other | 5,502 |
| Total | 46,603 | Total | 48,446 | Total | 19,440 |
Source: MBR_FACT_EE_MAIN as of January 09, 2023
Who applied for permanent residence through Express Entry?
Excluding accompanying family members (i.e., considering only principal applicants), total applications sourced through the EE in 2022 (102,138) remained similar to 2021 (102,452), as seen in Table 35. The proportion of the applications remained the same over the last three years between men and women, with a greater distribution of applications submitted by men (57%) than women (43%). As Table 35 displays, there were some differences in the breakdown of application by program between men and women. The proportion of applications submitted by men under CEC (58%) was higher than those submitted by women (42%) for all three years. The same trend was seen for the PNP under EE with more applications being made by men (57%) compared to applications submitted by women (43%) for the last two years. On the other hand, women (53%) submitted higher proportion of application for FSWP than men (47%) in the last two years. Among the women, the most popular economic immigration programs through Express Entry was FSWP (53%), while for men, it was divided among CEC (58%) and PNP (57%) in 2022.
| Economic immigration program applications | 2020 # | 2020 % | 2021 # | 2021 % | 2022 # | 2022 % |
|---|---|---|---|---|---|---|
| Men | ||||||
| CEC | 24,492 | 58% | 47,280 | 58% | 7,385 | 58% |
| FSWP | 10,781 | 52% | 3,900 | 47% | 2,265 | 47% |
| PNP | 8,106 | 62% | 7,250 | 57% | 10,765 | 57% |
| FSTP | 130 | 77% | 3 | 100% | 0 | 0% |
| Total | 43,509 | 57% | 58,433 | 57% | 20,415 | 57% |
| Women | ||||||
| CEC | 17,495 | 42% | 34,271 | 42% | 4,933 | 42% |
| FSWP | 9,973 | 48% | 4,344 | 53% | 2,547 | 53% |
| PNP | 4,923 | 38% | 5,402 | 43% | 7,166 | 43% |
| FSTP | 39 | 23% | 0 | 0% | 0 | 0% |
| Total | 32,430 | 43% | 44,017 | 43% | 14,646 | 43% |
| Grand Total | ||||||
| CEC | 41,989 | 100% | 81,552 | 100% | 81,302 | 100% |
| FSWP | 20,754 | 100% | 8,245 | 100% | 8,189 | 100% |
| PNP | 13,029 | 100% | 12,652 | 100% | 12,647 | 100% |
| FSTP | 169 | 100% | 3 | 100% | 0 | 0% |
| TotalFootnote * | 75,941 | 100% | 102,452 | 100% | 102,138 | 100% |
Data source: COGNOS (MBR) extracted as of February 2, 2023
Data compiled by: OPP-DART-2023-19940
Total includes Another gender, Unknown and Unspecified (2019 - 1, 2020 - 2, 2021 - 2).
As displayed in Table 36, in 2022, Ontario (48%) remained the most popular province in followed by British Columbia (20%), and Alberta (12%). These have been the top provinces of destination over the past three years. Nevertheless, there was a significant decline in the proportions of applications received through EE destined for Ontario, from 61% in 2021 to 48% in 2022, and British Columbia from 23% to 20% over the same period. This difference can be attributed to the fact that only CEC focused rounds were held in 2021 with CEC applicants being more likely -historically- to be destined to Ontario and British Columbia than other provinces. Hence, CEC-only rounds in 2021 increased the number and proportion of applications received through Express Entry with Ontario and British Columbia being the province of destination.
| Province of destination | 2020 # | 2020 % | 2021 # | 2021 % | 2022 # | 2022 % |
|---|---|---|---|---|---|---|
| Alberta | 5,725 | 8% | 7,613 | 7% | 4,372 | 12% |
| British Columbia | 15,976 | 21% | 23,365 | 23% | 6,966 | 20% |
| Manitoba | 1,360 | 2% | 1,784 | 2% | 2,046 | 6% |
| New Brunswick | 778 | 1% | 1,348 | 1% | 872 | 2% |
| Newfoundland and Labrador | 155 | 0% | 259 | 0% | 308 | 1% |
| Nova Scotia | 1,564 | 2% | 2,912 | 3% | 1,786 | 5% |
| Northwest Territories | 25 | 0% | 58 | 0% | 32 | 0% |
| Nunavut | 10 | 0% | 9 | 0% | 7 | 0% |
| Ontario | 47,765 | 63% | 62,175 | 61% | 16,978 | 48% |
| Prince Edward Island | 425 | 1% | 720 | 1% | 393 | 1% |
| Saskatchewan | 1,937 | 3% | 1,819 | 2% | 1,263 | 4% |
| Yukon | 38 | 0% | 90 | 0% | 39 | 0% |
| Grand Total | 75,758 | 100% | 102,152 | 100% | 35,062 | 100% |
Data source: COGNOS (MBR) extracted as of February 2, 2023
Data compiled by: OPP-DART-2023-19940
How long did it take to process Express Entry applications?
Table 37 displays the time, in months, that IRCC took to process 80% of applications under each program. In 2022, IRCC did not meet the processing standard of finalizing 80% of all applications sourced via EE within six months. There was a significant increase in overall processing time with 80% of all applications being processed in 21 months, reflecting the COVID-19 pandemic’s ongoing impact on IRCC’s operations and processing capacity. The processing times for all EE programs except for PNP increased from 2021 to 2022.
| Immigration Category | 2020 (months) | 2021 (months) | 2022 (months) |
|---|---|---|---|
| CEC | 8 | 6 | 19 |
| FSWP | 18 | 28 | 29 |
| PNP | 11 | 21 | 13 |
| FSTP | -- | 23 | 63 |
| All Programs | 10 | 8 | 21 |
Data source: COGNOS (MBR) extracted as of February 2, 2023
Data compiled by: OPP-DART-2023-19940
Who was admitted through Express Entry and where is their intended destination?
As seen in Table 38, in 2022, 116,228 principal applicants and their accompanying family members were admitted into Canada as permanent residents through EE. By comparison, 155,851 principal applicants and their accompanying family members were admitted in 2021 and 63,891 in 2020. The admissions were lower in 2022 when compared to 2021 due to IRCC’s temporary pause of invitation rounds.
In 2022, 24% of EE-sourced admissions were through CEC, a significant decrease from 84% of EE-sourced in 2021, as CEC-specific rounds were held in 2021 but not 2022. Additionally, in 2022, admissions under the PNP (40%) saw a considerable increase from 2021 and 2020 to becoming the main source of admissions, as only PNP-specific rounds were held for the first half of 2022. Individuals admitted under FSWP also saw a considerable increase from 5% in 2021 to 35% in 2022 as general invitation rounds resumed FSTP admissions remained stable at under 1% over the same time period.
| Immigration Category | 2020 # | 2020 % | 2021 # | 2021 % | 2022 # | 2022 % |
|---|---|---|---|---|---|---|
| CEC | 24,971 | 39% | 130,465 | 84% | 28,327 | 24% |
| PNP | 14,098 | 22% | 16,720 | 11% | 46,669 | 40% |
| FSTP | 565 | 1% | 500 | 0% | 450 | 0% |
| FSWP | 24,257 | 38% | 8,166 | 5% | 40,782 | 35% |
| Total | 63,891 | 155,851 | 116,228 |
Source: IRCC, CDO, Permanent Residents, December 31, 2022
As displayed in Tables 39 and 40, the pattern of principal applicant admissions by programs differed in 2022 from what was seen in 2020 and 2021 as CEC no longer accounted for the vast majority of admissions. This shows a gradual return to a more balanced distribution of admissions as general invitation rounds resumed following an emphasis on program specific rounds as a mitigation measure for COVID-19 pandemic related impacts. In 2022, male principal applicants were most often admitted under the PNP (36%), and least often admitted under the FSTP (0.4%). On the other hand, women principal applicants were most often admitted under FSWP (42%) and least under FSTP (0.1%) in 2022. In 2022, there were no principal applicants who indicated another gender, an unspecified gender or unknown were admitted to Canada.
| Immigration Category | 2020 # | 2020 % | 2021 # | 2021 % | 2022 # | 2022 % |
|---|---|---|---|---|---|---|
| CEC | 10,681 | 47% | 54,909 | 87% | 9,726 | 30% |
| PNP | 4,499 | 20% | 5,399 | 9% | 11,789 | 36% |
| FSTP | 214 | 1% | 232 | < 1% | 14 | < 1% |
| FSWP | 7,452 | 33% | 2,483 | 4% | 11,281 | 34% |
| Total | 22,846 | 63,023 | 32,939 |
Source: IRCC, CDO, Permanent Residents, December 31, 2022
| Immigration Category | 2020 # | 2020 % | 2021 # | 2021 % | 2022 # | 2022 % |
|---|---|---|---|---|---|---|
| CEC | 7,373 | 45% | 39,391 | 88% | 7,067 | 25% |
| PNP | 2,738 | 17% | 3,087 | 7% | 8,954 | 32% |
| FSTP | 61 | < 1% | 83 | < 1% | 38 | < 1% |
| FSWP | 6,309 | 38% | 2,152 | 5% | 11,782 | 42% |
| Total | 16,481 | 44,713 | 27,841 |
Source: IRCC, CDO, Permanent Residents, December 31, 2022
As reported in Table 41, India has remained, by a large margin, the most common country of citizenship among principal applicants and their accompanying family members admitted to Canada through EE. The proportion of individuals admitted through EE who held Nigerian citizenship increased from 6% in 2020 to 12% in 2022, while the proportion of Chinese nationals slightly decreased from 7% in 2020 to 4% in 2022. In 2022, Cameroon, Lebanon, Morocco, Algeria and Bangladesh made it to the list of top 15 most common countries of citizenship of admitted individuals through EE. On the other hand, Ireland, France, Mexico, Vietnam and Ukraine, which were countries listed among the top 15 most common countries of citizenship in 2021, fell from the list in 2022.
| Country of Citizenship | 2020 # | 2020 % | Country of Citizenship | 2021 # | 2021 % | Country of Citizenship | 2022 # | 2022 % |
|---|---|---|---|---|---|---|---|---|
| India | 27,642 | 43% | India | 82,956 | 53% | India | 53,663 | 46% |
| China | 4,318 | 7% | China | 11,706 | 8% | Nigeria | 13,757 | 12% |
| Nigeria | 3,920 | 6% | Nigeria | 5,801 | 4% | China | 4,407 | 4% |
| USA | 2,346 | 4% | Brazil | 5,650 | 4% | Pakistan | 4,001 | 3% |
| Pakistan | 2,294 | 4% | USA | 4,281 | 3% | USA | 2,820 | 2% |
| Brazil | 1,961 | 3% | South Korea | 3,851 | 2% | Cameroon | 2,352 | 2% |
|
UK - British citizen |
1,652 | 3% |
UK - British citizen |
3,474 | 2% | Philippines | 2,235 | 2% |
| Iran | 1,133 | 2% | Philippines | 2,938 | 2% | Lebanon | 2,219 | 2% |
| South Korea | 1,041 | 2% | Iran | 2,384 | 2% | Morocco | 2,046 | 2% |
| France | 1,039 | 2% | Ireland | 2,101 | 1% | Iran | 2,022 | 2% |
| Morocco | 970 | 2% | France | 1,706 | 1% | Brazil | 1,838 | 2% |
| Philippines | 821 | 1% | Pakistan | 1,686 | 1% | Algeria | 1,537 | 1% |
| Ireland | 707 | 1% | Mexico | 1,662 | 1% |
UK - British citizen |
1,510 | 1% |
| Bangladesh | 646 | 1% | Vietnam | 1,619 | 1% | Bangladesh | 1,420 | 1% |
| South Africa | 646 | 1% | Ukraine | 1,408 | 1% | South Korea | 1,344 | 1% |
| Top 15 Countries Total | 51,136 | 80% | 133,223 | 85% | 97,171 | 84% | ||
| Other | 12,755 | 20% | 22,628 | 15% | 19,057 | 16% | ||
| Total | 63,891 | 155,851 | 116,228 |
Source: IRCC, CDO, Permanent Residents, December 31, 2022 Data
Similar to the pattern observed at the application stage, and as in 2020 and 2021, the majority of persons admitted in 2022 were destined for Ontario followed by British Columbia and Alberta, as seen in Table 42. Nova Scotia, New Brunswick, Manitoba and Saskatchewan have also been seeing a notable increase in the number of admission since 2020.
| Province/Territory | 2020 # | 2021 # | 2022 # |
|---|---|---|---|
| Newfoundland and Labrador | 159 | 332 | 547 |
| Prince Edward Island | 445 | 875 | 613 |
| Nova Scotia | 1,554 | 3,157 | 5,293 |
| New Brunswick | 820 | 1,394 | 3,724 |
| Ontario | 37,506 | 96,561 | 60,194 |
| Manitoba | 1,516 | 2,801 | 5,839 |
| Saskatchewan | 1,249 | 2,716 | 6,751 |
| Alberta | 7,001 | 12,090 | 13,140 |
| British Columbia | 13,575 | 35,738 | 19,974 |
| Yukon | 30 | 102 | 83 |
| Northwest Territories | 30 | 72 | 55 |
| Nunavut | 6 | 13 | 15 |
| Total | 63,891 | 155,851 | 116,228 |
Source: IRCC, CDO, Permanent Residents, December 31, 2022 Data
The concentration of admitted individuals destined for Ontario was considerably less pronounced among the individuals who were selected through the PNP (Table 43), compared to those who were admitted through the FSWP, the CEC, and the FSTP (Table 44). On the other hand, Atlantic provinces (i.e. Newfoundland and Labrador, Prince Edward Island, Nova Scotia and New Brunswick) have a greater number of admitted individuals through the PNP than through the FSWP, the CEC and FSTP in 2022.
| Province/Territory | 2020 # | 2021 # | 2022 # |
|---|---|---|---|
| Newfoundland and Labrador | 65 | 34 | 428 |
| Prince Edward Island | 405 | 388 | 494 |
| Nova Scotia | 1,218 | 1,443 | 4,592 |
| New Brunswick | 540 | 715 | 3,159 |
| Ontario | 2,767 | 3,898 | 12,328 |
| Manitoba | 869 | 1,474 | 4,983 |
| Saskatchewan | 803 | 1,439 | 6,136 |
| Alberta | 2,900 | 2,583 | 6,656 |
| British Columbia | 4,512 | 4,718 | 7,838 |
| Yukon | 12 | 12 | 27 |
| Northwest Territories | 7 | 16 | 28 |
| Total | 14,098 | 16,720 | 46,669 |
Source: IRCC, CDO, Permanent Residents, December 31, 2022 Data
| Province | 2020 # | 2021 # | 2022 # |
|---|---|---|---|
| Newfoundland and Labrador | 94 | 298 | 119 |
| Prince Edward Island | 40 | 487 | 119 |
| Nova Scotia | 336 | 1,714 | 701 |
| New Brunswick | 280 | 679 | 565 |
| Ontario | 34,739 | 92,663 | 47,866 |
| Manitoba | 647 | 1,327 | 856 |
| Saskatchewan | 446 | 1,277 | 615 |
| Alberta | 4,101 | 9,507 | 6,484 |
| British Columbia | 9,063 | 31,020 | 12,136 |
| Yukon | 18 | 90 | 56 |
| Northwest Territories | 23 | 56 | 27 |
| Nunavut | 6 | 13 | 15 |
| Total | 49,793 | 139,131 | 69,559 |
Source: IRCC, CDO, Permanent Residents, December 31, 2022 Data
What were the economic outcomes of applicants?
Figure 2 demonstrates the median employment earnings for EE Federal High Skilled principal applicants with the earliest cohort being admitted to Canada the same year as the EE system launch, in 2015, and the Canadian median employment earnings. As seen, there is a generally positive trend line for all EE Federal High Skilled admission cohorts for most years, meaning an annual increase in employment earnings. At one year since being admitted to Canada, applicants in the 2016 admission cohort had median employment earnings of $56,500 in 2017 which reached $70,200 at four years since admission in 2020. Those who were admitted in 2017 had median employment earnings of $53,200 at one year since admission in 2018 and reached a high of $65,100 at three years since admission in 2020. Following a similar pattern, those who were admitted in 2018 had median employment earnings of $53,400 at one year since being admitted to Canada in 2019 which increased to $61,600 at two years since admission in 2020. Applicants in the 2019 admission cohort had median employment earnings of $50,500 at one year since admission in 2020 which is slightly lower than the median employment earnings at one year since admission for the 2016, 2017 and 2018 admission cohorts. COVID-19 and the associated impacts on the labour market may be the potential cause of the difference in the median employment earnings at one year since admission for the 2019 admission cohort. When compared to the Canadian median employment earnings, all EE admission cohorts have a significantly higher median employment earnings.
Moreover, the 2015 admission cohort follows a different trajectory than subsequent cohorts. The 2015 admission cohort had a slightly lower starting median employment earnings of $47,300 at one year since admission in 2016 than the other four admission cohorts. The median employment earnings increased to $57,800 at four years since admission in 2019 before slightly decreasing to $56,800 at five years since admission in 2020. This can be attributed to the differences in the characteristics of the 2015 cohort due to EE system changes since its launch – including a growing profile pool and number of admissions, different requirements and updates to the CRS grid (reduction of Arranged Employment points from 600 to 200 or 50 points and new additional point types such as French-language proficiency, Siblings in Canada, and Education in Canada). For example, in 2015, IRCC received 21,562 applications for permanent residence through EE in all programs, resulting in a small admission cohort of 9,739 applicants. Furthermore, in the early years of EE, candidates were required to register with Job Bank and 600 additional points were granted for Arranged Employment in any occupation, which has since changed to 200 or 50 points depending on the NOC TEER category. Candidates working as Food Service Supervisors or Cooks, which generally have a lower pay range than current top occupations in EE, were the largest group of invited candidates in 2015, and were the most likely group to have an arranged employment than the other top occupation groups in 2015.
Figure 2: Median employment earnings for Federal High Skilled by admission cohort and Canadians, 2016-2020
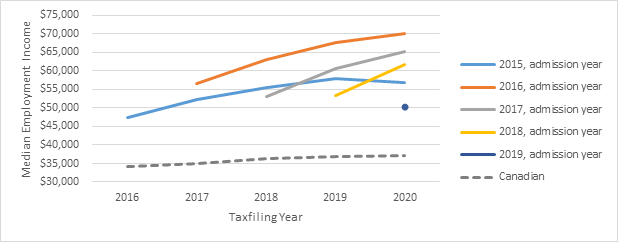
Source: IMDB, 2020 update and Statistics Canada,2022. Table 11-10-0004-01 Selected characteristics of tax filers and dependants, income and demographics (final T1 Family File)
Text version:
Median employment earnings for Federal High Skilled immigrants by admission year cohort and Canadians, 2016-2020
For the 2015 cohort, median employment income was $47,300 at one year since admission in 2016, $52,200 at two years since admission in 2017, $55,500 at three years since admission in 2018, $57,800 at four years since admission in 2019, and $56,800 at five years since admission in 2020. For the 2016 cohort, median employment income was $56,500 at one year since admission in 2017, $63,100 at two years since admission in 2018, $67,600 at three years since admission in 2019, $70, 200 at four years since admission in 2020. For the 2017 cohort, median employment income was $53,200 at one year since admission in 2018, $60,500 at two years since admission in 2019, $65,100 at three years since admission in 2020.
For the 2018 cohort, median employment income was $53,400 at one year since admission in 2019, $61,600 at two years since admission in 2020. For the 2019 cohort, median employment income was $50,500 at one year since admission in 2020. The Canadian median employment income was $34,050 in 2016, $ 35,000 in 2017, $ 36,300 in 2018, $ 36, 960 in 2019 and $ 37, 080 in 2020.
As Figure 3 displays, the median employment earnings for PNP admission cohorts were fairly similar to one another at one year since admission with the median employment earnings in mid-to-high $40,000 range. It was seen that 2015, 2016 and 2017 admission cohorts had somewhat similar median employment earnings at three years since admission, ranging from $58,800 for the 2015 cohort to $62,100 for the 2017 cohort. Of those in the 2016 cohort, median employment earnings was $65,400 at four years since admission in 2020. At five years since admission, principal applicants admitted to Canada in 2015 had median employment earnings of $64,800 in 2020. Those admitted under PNP in 2015 had a slightly higher median employment earnings than those admitted under FHS programs in EE. However, in years 2016, 2017, 2018 and 2019 candidates admitted through the PNP had lower median employment earnings than those admitted under FHS programs in EE. On the other hand, when compared to the Canadian median employment earnings, PNP admission cohorts under EE have a significantly higher median employment earnings.
Figure 3: Median employment earnings for Provincial Nominees admitted under EE by admission cohort and Canadians, 2016-2020
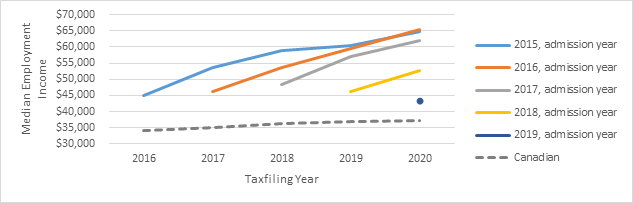
Source: IMDB, 2020 update and Statistics Canada,2022. Table 11-10-0004-01 Selected characteristics of tax filers and dependants, income and demographics (final T1 Family File)
Text version:
Median employment earnings for Provincial Nominees admitted under EE by admission year cohort and Canadians, 2016-2020
For the 2015 cohort, median employment income was $45,100 at one year since admission in 2016, $53,700 at two years since admission in 2017, $58,800 at three years since admission in 2018, $60,300 at four years since admission in 2019, and $64,800 at five years since admission in 2020. For the 2016 cohort, median employment income was $46,300 at one year since admission in 2017, $53,700 at two years since admission in 2018, $59,600 at three years since admission in 2019, $65, 400 at four years since admission in 2020. For the 2017 cohort, median employment income was $48,500 at one year since admission in 2018, $56,900 at two years since admission in 2019, $62,100 at three years since admission in 2020. For the 2018 cohort, median employment income was $46,300 at one year since admission in 2019, $52,700 at two years since admission in 2020. For the 2019 cohort, median employment income was $43,400 at one year since admission in 2020. The Canadian median employment income was $34,050 in 2016, $ 35,000 in 2017, $ 36,300 in 2018, $ 36, 960 in 2019 and $ 37, 080 in 2020.
Table 45 demonstrates the median employment earnings two years after admission by Education in Canada attribute for the 2017 and 2018 admission cohort. Applicants admitted to Canada in 2018 who had three years or more post-secondary credential ($65,600) had a slightly higher median employment earnings than those admitted in 2017 ($63,100). On the other hand, applicants admitted to Canada in 2017 had a slightly higher median employment earnings than the 2018 admission cohort in the other Education in Canada attributes. Applicants who had three years or more post-secondary credential in the 2018 admission cohort had a slightly higher median employment ($65,600) earnings two years after admission in Canada in comparison to other Education in Canada attributes. On the other hand, applicants admitted to Canada in 2017 without Canadian a post-secondary credential ($65,300) had a slightly higher median employment earnings when compared to other Education in Canada attributes, as candidates who obtain points for their Education in Canada often pursue further studies after receiving PR.
| 1- or 2-year post-secondary credential | 3 years or more post-secondary credential | Without Canadian Post-secondary credential | Not applicableFootnote * | |
|---|---|---|---|---|
| 2017, admission year | $49,000 | $63,100 | $65,300 | $61,800 |
| 2018, admission year | $47,700 | $65,600 | $62,700 | $60,400 |
Source: IMDB, 2020 update
Although the Arranged Employment additional points were reduced from 600 points to 50 or 200 points in November 2016, due to processing times and lag between visa issuance and admission, there were small numbers of applicants who received 600 points for Arranged Employment for the 2017 and 2018 admission cohorts. As Table 46 demonstrates, applicants in senior managers roles admitted to Canada in 2017 ($236,300) and 2018 ($262,100) with arranged employment had a significantly higher median employment earnings two years after their arrival than those applicant with arranged employment in other occupations. Applicants admitted to Canada who received 50 or 200 additional points for Arranged Employment points had a higher median employment earnings than those who received 600 points for Arranged Employment or without Arranged Employment.
| Arranged Employment - Senior manager (50 vs 200 points)Footnote * | Arranged Employment - Other occupation (50 vs 200 points)Footnote * | Arranged Employment (600 points) | Without Arranged Employment | |
|---|---|---|---|---|
| 2015, admission year | N\A | N\A | $48,700 | $63,600 |
| 2016, admission year | N\A | N\A | $53,700 | $64,900 |
| 2017, admission year | $236,300 | $78,700 | $52,100 | $59,900 |
| 2018, admission year | $262,100 | $81,800 | $47,500 | $58,800 |
Source: IMDB, 2020 update
Unilingual French language speakers in the 2017 and 2018 admission cohorts had a higher median employment earnings two years after admission than their bilingual counterparts (Table 47). Moreover, it was also seen that applicants without siblings in Canada (Table 48) had a higher median employment earnings two years after admission than their counterparts with siblings in Canada.
| CLB 7 or more in French and CLB 4 or less in English | CLB 7 or more in French and CLB 5 or more in English | No French Test Result or CLB 6 less in French | Not ApplicableFootnote * | |
|---|---|---|---|---|
| 2017, admission year | $55,200 | $53,700 | $59,500 | $60,100 |
| 2018, admission year | $57,300 | $55,700 | $59,700 | $61,900 |
Source: IMDB, 2020 update
| With Siblings in Canada | Without Siblings in Canada | Not ApplicableFootnote * | |
|---|---|---|---|
| 2017, admission year | 54,500 | $59,800 | $60,100 |
| 2018, admission year | $52,600 | $60,300 | $61,900 |
Source: IMDB, 2020 update
Conclusion
In 2022, in the eighth year of its operation, the EE application management system continued to provide a pathway to permanent residence for a range of highly-skilled candidates who demonstrated the potential to successfully integrate and contribute to Canada’s economy. IRCC leveraged the responsiveness and adaptability of the EE system by managing application inventories and maximizing economic immigrant admissions to help meet the GoC’s immigration targets and support Canada’s ongoing recovery from the impacts of the COVID-19 pandemic.
Going forward, the EE system will be a key component of IRCC’s Strategy to Expand Transitions to Permanent Residency, which was tabled in Parliament on September 20, 2022 and supports the achievement of the Minister’s mandate commitment to expand permanent residence pathways for international students and temporary foreign workers. The strategy aims to reform the EE system, including by increasing its flexibility as immigration selection tool through recent changes to the IRPA. With the recent legislative amendments made to the IRPA on June 23, 2022, further enhancements to the EE system, referred to as “category-based selection,” are being planned to increase flexibility to select those with skills and attributed needed to respond to Canada’s evolving economic needs and Government priorities. The Department will continue to monitor EE and to explore ways the system could be used to ensure that Canada continues to derive maximum benefit from economic immigration in a rapidly evolving environment.