
Express Entry Year-End Report 2024
Table of Contents
- List of Figures
- List of Tables
- Acronym Glossary
- Overview of Express Entry
- How Express Entry Works
- Who submitted an Express Entry profile?
- Who got into the Express Entry pool?
- Who was invited to apply for permanent residence through Express Entry?
- Who was eligible for category-based selection categories among the eligible profiles submitted to Express Entry?
- Who in the pool qualified for category-based selection in Express Entry?
- Who was invited to apply for permanent residence through category-based selection in Express Entry?
- Who applied for permanent residence through Express Entry?
- How long did it take to process Express Entry applications?
- What were the economic outcomes of applicants?
- Conclusion
- Annex: Category-Based Selection Occupations by Category
List of Figures
- Figure 1: How Express Entry works
- Figure 2: How category-based selection works in Express Entry
- Figure 3: Profile submissions to Express Entry, 2022-2024
- Figure 4: Median employment earnings (in 2021$) for Federal High Skilled by admission cohort and Canadians, 2017-2021
- Figure 5: Median employment earnings (in 2021$) for Provincial Nominees admitted under EE by admission cohort and Canadians, 2017-2021
List of Tables
- Table 1: Profile submissions by eligibility by gender, 2022-2024
- Table 2: Comprehensive Ranking System score distribution of total eligible profiles submitted to Express Entry, at time of submission, 2022-2024
- Table 3: Eligible profiles by additional point type, broken down by gender, 2022-2024
- Table 4: Comprehensive Ranking System score distribution of candidates in the pool, as of December 1st of 2022, 2023 and 2024
- Table 5: Total invitations to apply issued to candidates by invitation type, including CBS rounds, 2024
- Table 6: Invitations to apply issued to candidates by economic immigration program – broken down by gender, 2022-2024
- Table 7: Invitations to apply issued to candidates by age and level of education, 2022-2024
- Table 8: Invitations to apply issued to candidates by first official language proficiency level, 2022-2024
- Table 9: Invitations to apply issued to candidates by amount of Canadian work experience and Foreign work experience, 2022-2024
- Table 10: Invitations to apply issued to candidates assigned additional points (a) and invitations to apply issued to candidates that met relevant criteria of additional points (b) –not mutually exclusive, 2022-2024
- Table 11: Invitations to apply issued to candidates that met the criteria to receive each additional point type for Arranged Employment, Education in Canada, French Language Proficiency and Siblings in Canada, broken down by gender, 2022-2024
- Table 12a: Most common primary occupations, upon invitation to apply – Total, 2022-2024
- Table 12b: Most common primary occupations, upon invitation to apply – Men, 2022-2024
- Table 12c: Most common primary occupations, upon invitation to apply – Women, 2022-2024
- Table 13a: Most common occupations of candidates assigned Arranged Employment points, upon invitation to apply – Total, 2022-2024
- Table 13b: Most common occupations of candidates assigned Arranged Employment points, upon invitation to apply – Men, 2022-2024
- Table 13c: Most common Arranged Employment occupations, upon invitation to apply – Women, 2022- 2024
- Table 14a: Most common countries of residence among candidates who received an invitation to apply – Total, 2022-2024
- Table 14b: Most common countries of residence among candidates who received an invitation to apply – Men, 2022-2024
- Table 14c: Most common countries of residence among candidates who received an invitation to apply – Women, 2022-2024
- Table 15a: Most common countries of citizenship among candidates who received an invitation to apply – Total, 2022-2024
- Table 15b: Most common countries of citizenship among candidates who received an invitation to apply – Men, 2022-2024
- Table 15c: Most common countries of citizenship among candidates who received an invitation to apply – Women, 2022-2024
- Table 16a: Number and percentages of eligible profiles submitted by candidates who qualify for CBS criteria by gender and age group, 2024
- Table 16b: Eligible profiles submitted by candidates who qualify for CBS criteria by Age group, 2024
- Table 17a: Number and percentages of candidates in the pool who qualify for CBS criteria by gender as of Dec 01, 2024
- Table 17b: Candidates in the pool who qualify for CBS criteria by age group as of Dec 01, 2024
- Table 18a: Invitations to apply issued to candidates who qualify for CBS categories by age group, 2024
- Table 18b: Number and percentage of Invitations to apply issued to candidates who qualify for CBS and other categories by gender, 2024
- Table 19a: Number of Invitations to apply issued to candidates by program who qualify for CBS categories, 2024
- Table 19b: Invitations to apply issued to candidates by CBS categories and by candidates who qualify for General round criteria including PNP, 2024
- Table 19c: Average total CRS points for CBS groups and progress against category targets, 2024, excludes PNP
- Table 20a: Invitations to apply issued to candidates by top 10 country of citizenship who qualify for CBS criteria, 2024
- Table 20b: Invitations to apply issued to candidates by top 10 country of residence who qualify for CBS criteria, 2024
- Table 21: Invitations to apply issued to candidates who qualify for CBS criteria by first official language – CLB levels, 2024
- Table 22: Invitations to apply issued to candidates who qualify for CBS criteria by intended destinations (Provinces and Territories), 2024
- Table 23: Number of Express Entry (EE) applications received as principal applicants for permanent residence between 2022 and 2024; broken down by immigration category and gender (in cases)
- Table 24: Number of Express Entry (EE) applications received as principal applicants for permanent residence between 2022 and 2024; broken down by province/territory of destination (in Cases)
- Table 25: Processing times* of Express Entry applications finalized for permanent residence between 2022 and 2024, by Year and Immigration category (in months)
- Table 26: Median Employment Earnings (2022$) 2 years after admission by Education in Canada attribute (i.e. including PNP)
- Table 27: Median Employment Earnings (2022$) 2 years after admission by Arranged Employment attribute (i.e. including PNP)
- Table 28: Median Employment Earnings (2022$) 2 years after admission by French-Speaker attribute (i.e. including PNP)
- Table 29: Median Employment Earnings (2022$) 2 years after admission by Siblings in Canada attribute (i.e. including PNP)
Acronym Glossary
- CEC
- Canadian Experience Class
- CBS
- Category-Based Selection
- CLB
- Canadian Language Benchmarks
- CRS
- Comprehensive Ranking System
- EE
- Express Entry
- FHS
- Federal High Skilled
- FSTP
- Federal Skilled Trades Program
- FSWP
- Federal Skilled Worker Program
- GCMS
- Global Case Management System
- GoC
- Government of Canada
- IRCC
- Immigration, Refugees and Citizenship Canada
- IRPA
- Immigration and Refugee Protection Act
- ITA
- Invitation to Apply
- MI
- Ministerial Instructions
- NCLC
- Niveaux de compétence linguistique canadiens
- NOC
- National Occupation Classification
- PNP
- Provincial/Territorial Nominee Program
- STEM
- Science, Technology, Engineering and Mathematics
- TEER
- Training, Education, Experience and Responsibilities
Overview of Express Entry
Launched in January 2015, Express Entry (EE) is Canada’s flagship application management system for three Federal High Skilled (FHS) permanent economic immigration programs (i.e., the Federal Skilled Worker Program (FSWP), Federal Skilled Trades Program (FSTP), and Canadian Experience Class (CEC)), and a portion of the Provincial Nominee Program (PNP). In addition to providing a pathway to permanent residence for prospective immigrants currently abroad, many temporary residents already in Canada transition to permanent residence through EE-managed programs. Canada is consistently the top country of residence for individuals who receive an invitation to apply (ITA) for permanent residence through EE, demonstrating a transition from temporary to permanent residence status. As described below, EE provides the Government of Canada (GoC) with the means to manage the intake of applications for permanent residence under the key economic immigration programs listed above, while facilitating the selection of individuals who are most likely to succeed economically in Canada.
As with previous reports, the EE Year-End Report 2024 provides an overview of EE and presents data from across all stages of the EE continuum, including profile submissions, candidates in the pool, ITAs, applications, processing times, admissions, source countries, and immigrant outcomes. Since the new enhancement to Express Entry, category-based selection, was launched in June 2023, the report also presents category-related results from January to December 2024. Throughout the report, historical and gender-disaggregated dataFootnote 1 is presented alongside the 2024 figures to provide additional context. Data is operational and should be considered preliminary and subject to change.
How Express Entry Works
The EE system manages applications for permanent residence in two steps.
First, individuals express their interest in immigrating to Canada by completing an online profile, which is screened electronically to determine if the individual is eligible for at least one of the FHS immigration programs managed by the system. The profiles of individuals who meet the eligibility criteria for at least one of these FHS programsFootnote 2 are placed in the EE pool and assigned a Comprehensive Ranking System (CRS) score, based on information in their profile, including skills and experience, according to point criteria that is publicly available on Immigration, Refugees and Citizenship Canada’s (IRCC) website. Candidates in the pool are ranked according to their CRS score. Potential candidates can estimate their scores prior to completing an online profile using a CRS tool, also available on the IRCC websiteFootnote 3.
Second, Ministerial Instructions (MIs) are regularly published on IRCC’s website specifying the number of ITAs for permanent residence that have been sent to candidates in the EE pool on a specific date, known as an invitation round, the date of the round, the number of ITAs, and the lowest score that was issued an ITA. Invitation rounds are conducted regularly. The number of ITAs that will be issued is determined for each round. The candidates with the highest CRS scores receive ITAs.
General invitation rounds are solely based on CRS scores, but some rounds select candidates who are eligible for one of the economic immigration program(s) and issue ITAs to the highest scorers.
Furthermore, some rounds may be category-specific. A “category” refers to a single, or a combination, of particular criteria (e.g., official language skills, occupation specific work experiences, etc.) linked to an economic goal. Categories can then be used to issue invitations to apply to candidates in the Express Entry pool that meet the given criteria. Further information related to category-based selection is provided in upcoming sections of the report.
For each round, invitations are issued to candidates who are eligible to be invited in that round, in descending CRS score rank order, until the maximum number of invitations specified in the associated round is met. The score of the final invited candidate is published as the ‘cut off’ score for that round. The profiles of candidates who do not receive an invitation, or decline one, remain in the pool for up to 12 months.
Candidates that receive an ITA have 60 days to either submit an online application for permanent residence to IRCC or decline the invitation. The profile is returned to the pool if the ITA is declined. Candidates who receive an ITA but take no action within the 60-day period are withdrawn from the pool. Upon receipt of an application by IRCC, an immigration officer assesses it to verify the applicant’s CRS score, program eligibility, and admissibility.
Each candidate is invited to apply under a program for which they qualify. If a candidate qualifies for more than one program, the candidate is invited to apply for the first program they are eligible for, in the following order: CEC, FSW, FST. If the immigration officer is satisfied that all conditions have been met and that the applicant is admissible, they are approved for a permanent resident visa. Applicants and their accompanying family members become permanent residents when they are admitted to Canada. The processing standard for applications sourced through EE is generally six months for 80% of cases. Processing times are measured from the day a complete application is received by IRCC until a final decision is made by an immigration officer.
The Comprehensive Ranking System
The Comprehensive Ranking System (CRS) is the backbone of the EE application management system. A CRS score comprises two components: core points and additional points. These factors help predict a candidate’s potential for success in the Canadian labour market. The maximum CRS score a candidate can achieve is 1,200 points – 600 points under the core component and 600 points under the additional points component. All information the candidate provides when submitting the profile in order to receive a CRS score must be supported with appropriate documentation when they submit the application, or it could be refused.
A candidate’s human capital characteristics (e.g., age, education, official language proficiency, work experience) are scored in the core points.
A candidate who indicates they would apply with an accompanying spouse or common-law partner can receive a maximum of 560 points for their own core characteristics and is awarded a maximum of 40 points for the human capital characteristics of their spouse/common-law partner. A candidate without an accompanying spouse/common-law partner can receive a maximum of 600 points under the core component. Under the additional points component, a candidate can receive points for having a provincial/territorial nomination (600 points), arranged employment (50 or 200 points), Canadian post-secondary education credentials (15 or 30 points), French-language proficiency (25 or 50 points), or a sibling in Canada (15 points)Footnote 4.
Additional points increase the probability that a given candidate will receive an ITA, but cannot ensure it. However, the points for a Provincial/Territorial nomination are usually enough to guarantee an ITA, through either a general invitation or PNP-specific round.
Candidates in the EE pool must update their profile to reflect any change in circumstances. This may affect their CRS score. The system automatically updates some data. For example, age is updated on a candidate’s birthday and language levels are removed on the date a language test expires. Other updates must be manually revised, such as steps candidates take to improve their CRS scores, thereby increasing their probability of receiving an ITA. This includes, for example, increasing official language skills.
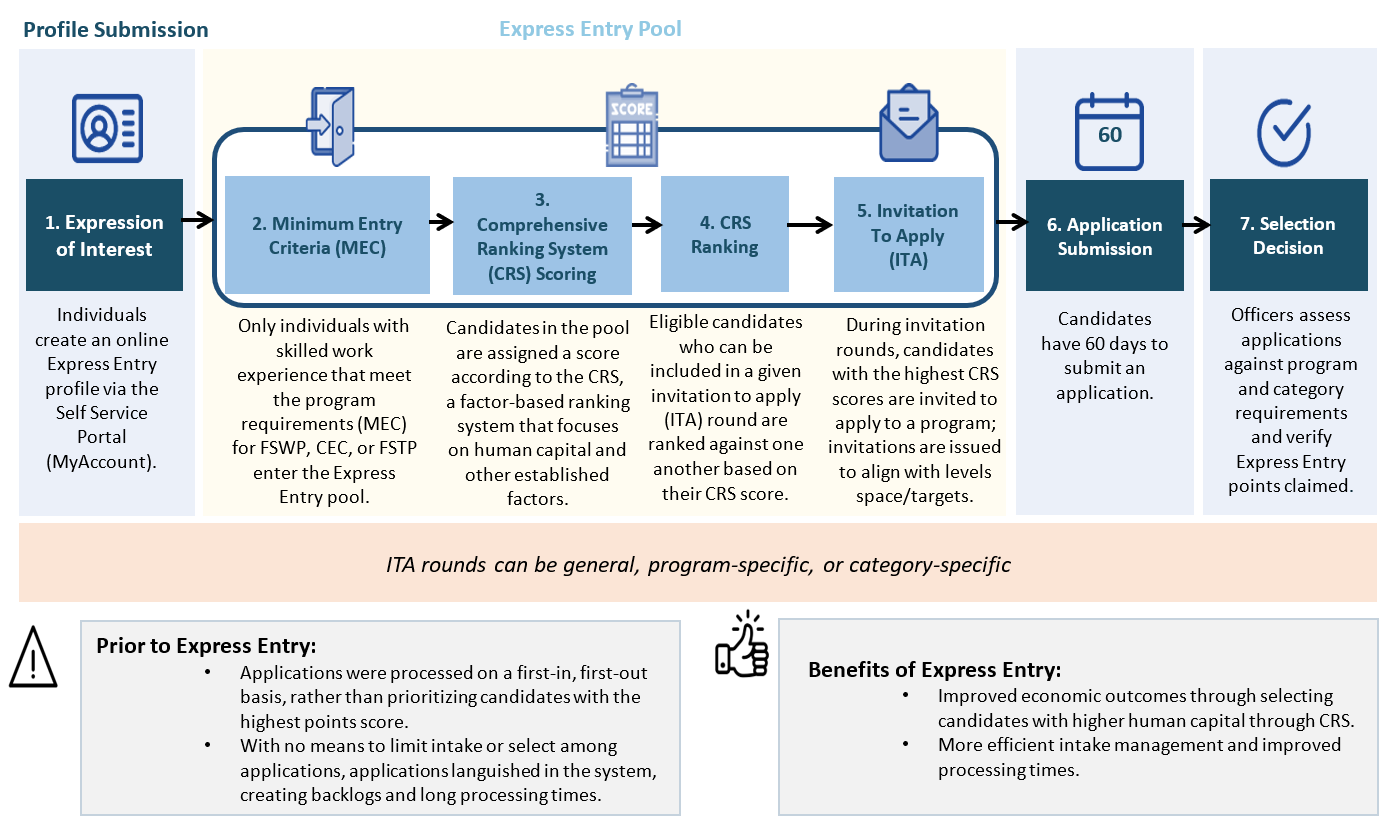
Figure 1 text version
How Express Entry works
Profile Submission
-
Expression of Interest
Individuals create an online Express Entry profile via the Self Service Portal (MyAccount).
Express Entry Pool
-
Minimum Entry Criteria (MEC)
Only individuals with skilled work experience that meet the program requirements (MEC) for FSWP, CEC, or FSTP enter the Express Entry pool.
-
Comprehensive Ranking System (CRS) Scoring
Candidates in the pool are assigned a score according to the CRS, a factor-based ranking system that focuses on human capital and other established factors.
-
CRS Ranking
Eligible candidates who can be included in a given invitation to apply (ITA) round are ranked against one another based on their CRS score.
-
Invitation To Apply (ITA)
During invitation rounds, candidates with the highest CRS scores are invited to apply to a program; invitations are issued to align with levels space/targets.
-
Application Submission
Candidates have 60 days to submit an application.
-
Selection Decision
Officers assess applications against program and category requirements and verify Express Entry points claimed.
ITA rounds can be general, program-specific, or category-specific
Prior to Express Entry:
- Applications were processed on a first-in, first-out basis, rather than prioritizing candidates with the highest points score.
- With no means to limit intake or select among applications, applications languished in the system, creating backlogs and long processing times.
Benefits of Express Entry:
- Improved economic outcomes through selecting candidates with higher human capital through CRS.
- More efficient intake management and improved processing times.
Overview of Category-Based Selection
On June 23, 2022, legislative amendments were made to the Immigration and Refugee Protection Act (IRPA) that authorize the Minister of IRCC to invite foreign nationals to apply for permanent residence through EE on a new basis – their eligibility to be members of a category that supports an identified economic goal. This new authority, referred to as “category-based selection”, increases flexibility to select candidates in the EE pool with the skills and attributes needed to respond to Canada’s evolving economic needs and Government priorities through a new invitation round type. Categories are based on key attributes, such as official language knowledge and work experience, and will change over time.
IRPA sets out three key requirements respecting the use of category-based selection:
- Economic goal: If the Minister establishes a category in an instruction […] the Minister shall set out, in the instruction, the economic goal that the Minister seeks to support in establishing the category.
- Public consultation process: For the purpose of establishing categories of eligible foreign nationals […] the Minister must engage in a public consultation process with stakeholders, including provinces and territories, industry, unions, employers, workers, worker advocacy groups, settlement provider organizations and immigration researchers and practitioners, to obtain information, advice and recommendations in respect of the labour market conditions, including occupations expected to face shortage conditions, as well as on how categories can be formed to meet economic goals. 10.5 (2) The advice and recommendations from the public consultation process must be based on written submissions provided by relevant industry members and stakeholders.
-
Annual Reporting: Specified in subsection 10.5. (3) The Minister shall cause to be tabled before each House of Parliament […] following the end of each fiscal year, a report containing the list of the categories of eligible foreign nationals established […] and the selection criteria and the process applied for the establishment of those categories.
Furthermore, specified in subsection 94 (2) (a.1) of IRPA, the Minister must, […] table in each House of Parliament a report […] the report shall include a description of any instructions given under paragraph 10.3(1)(h.2) that establish a category of eligible foreign nationals, the economic goal sought to be supported in establishing the category and the number of foreign nationals invited to make an application for permanent residence in respect of the category.
How Does Category-Based Selection Work in Express Entry?
Category-based selection allows IRCC to use the Express Entry system to identify candidates with specific skills or attributes most needed in Canada, and supplements general and program invitation rounds by inviting applicants whose selection would help achieve an economic goal established by the Minister. Candidates in the pool who meet a category’s eligibility criteria are still ranked according to their Comprehensive Ranking System score, and the top among them are invited to apply. Figure 2 below illustrates how category-based selection works in Express Entry.
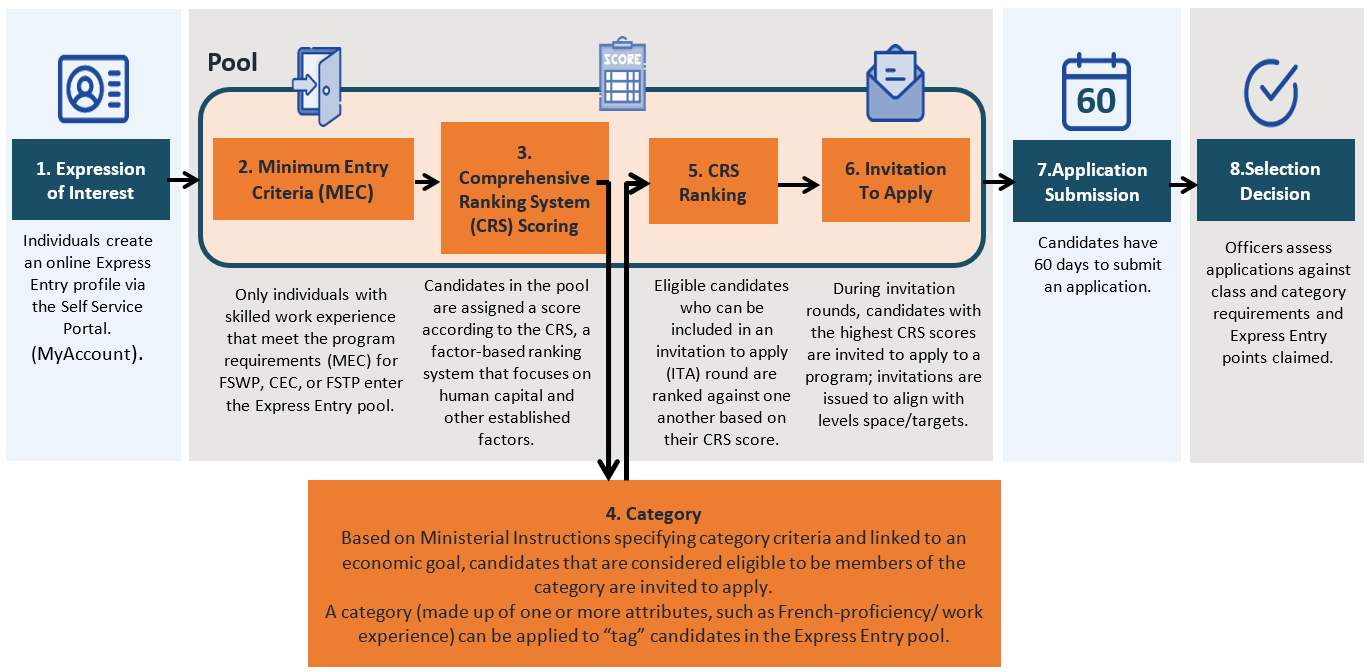
Figure 2 text version
How category-based selection works in Express Entry
-
Expression of Interest
Individuals create an online Express Entry profile via the Self Service Portal (MyAccount).
Pool
-
Minimum Entry Criteria (MEC)
Only individuals with skilled work experience that meet the program requirements (MEC) for FSWP, CEC, or FSTP enter the Express Entry pool.
-
Comprehensive Ranking System (CRS) Scoring
Candidates in the pool are assigned a score according to the CRS, a factor-based ranking system that focuses on human capital and other established factors.
-
Category
Based on Ministerial Instructions specifying category criteria and linked to an economic goal, candidates that are considered eligible to be members of the category invited to apply.
A category (made up of one or more attributes, such as French-proficiency/ work experience) can be applied to “tag” candidates in the Express Entry pool.
-
CRS Ranking
Eligible candidates who can be included in an invitation to apply (ITA) round are ranked against one another based on their CRS score.
-
Invitation To Apply
During invitation rounds, candidates with the highest CRS scores are invited to apply to a program; invitations are issued to align with levels space/targets.
-
Application Submission
Candidates have 60 days to submit an application.
-
Selection Decision
Officers assess applications against class and category requirements and Express Entry points claimed.
As seen in Figure 2, individuals need to submit an expression of interest, meet the minimum entry criteria for one of the programs to enter the Express Entry Pool and receive a CRS score. At the time of a category invitation round, candidates who are considered to be eligible members of the category will be ranked against one another based on their CRS score. During the invitation rounds, those with the highest CRS scores will be invited to apply for permanent residence.
Development of Categories for Category-Based Selection in 2024
Category-based selection is an enhancement to the Express Entry system and offers more flexibility in Canada’s immigration response to changing economic and labour market needs, as well as government priorities. The development of categories is informed by data, labour market information, engagement with Federal, Provincial and Territorial partners, and stakeholder consultations.
From July 10 to August 16, 2023, the Department held a public consultation on immigration levels which included questions specific to Express Entry and category-based selection. An online survey was made available to the public on IRCC’s website, and 4,780 stakeholder organizations across Canada were invited by email to take part. Participating stakeholders included, but were not limited to, non-profit organizations, settlement or resettlement organizations, academic and educational institutions, government bodies, employers and businesses, chambers of commerce, Francophone and official language minority community organizations, and industry and sector councils. This number represents a substantial increase from the 2,867 stakeholders invited in 2022, and reflects the department’s commitment to expand outreach and seek a plurality of views on immigration. A summary of input received from IRCC stakeholders is available on IRCC’s website, and includes a list of participating organizations. Findings from these consultations supported the use of category-based selection to address long-term labour market shortages. The labour needs most often mentioned were in healthcare, skilled trades, and transportation. On Francophone immigration, stakeholders more strongly highlighted the need for a dedicated temporary resident to permanent resident pathway to achieve Francophone immigration objectives. In parallel, IRCC engaged on potential priorities, needs, and categories with Provincial and Territorial representatives through the Forum of Ministers Responsible for Immigration.
Following these consultations, the Minister established six categories designed to both help address long-term labour market shortages and support economic growth through Francophone immigration in communities outside Quebec.
Candidates with French-language proficiency or with work experience in the occupations that were eligible under the following categories were invited to apply for permanent residence through category-based selection in 2024:
- French-language proficiency
- Healthcare occupations
- Science, technology, engineering and math (STEM) occupations
- Trade occupations
- Transport occupations
- Agriculture and agri-food occupations
In order to qualify for the French-language proficiency rounds, candidates needed to have French language test results demonstrating a competency of Niveaux de compétence linguistique canadiens (NCLC) 7 or above in all four language abilities, in addition to meeting the eligibility requirements for one of the EE programs. For the occupation-based categories, candidates needed to have continuous experience, obtained over a period that meets or exceeds six months in the past three-year period, in one of the eligible occupations that were part of the categories.
Who submitted an Express Entry profile?
In 2024, 468,073 EE profiles were submitted in the system, which represents a decrease of 4% from 2023 but an increase of 9% from 2022 (Figure 3). The proportion of profiles submitted in 2024 that were eligible for at least one of the FHS immigration programs managed by EE (73%) slightly increased from that observed in 2023 (70%).
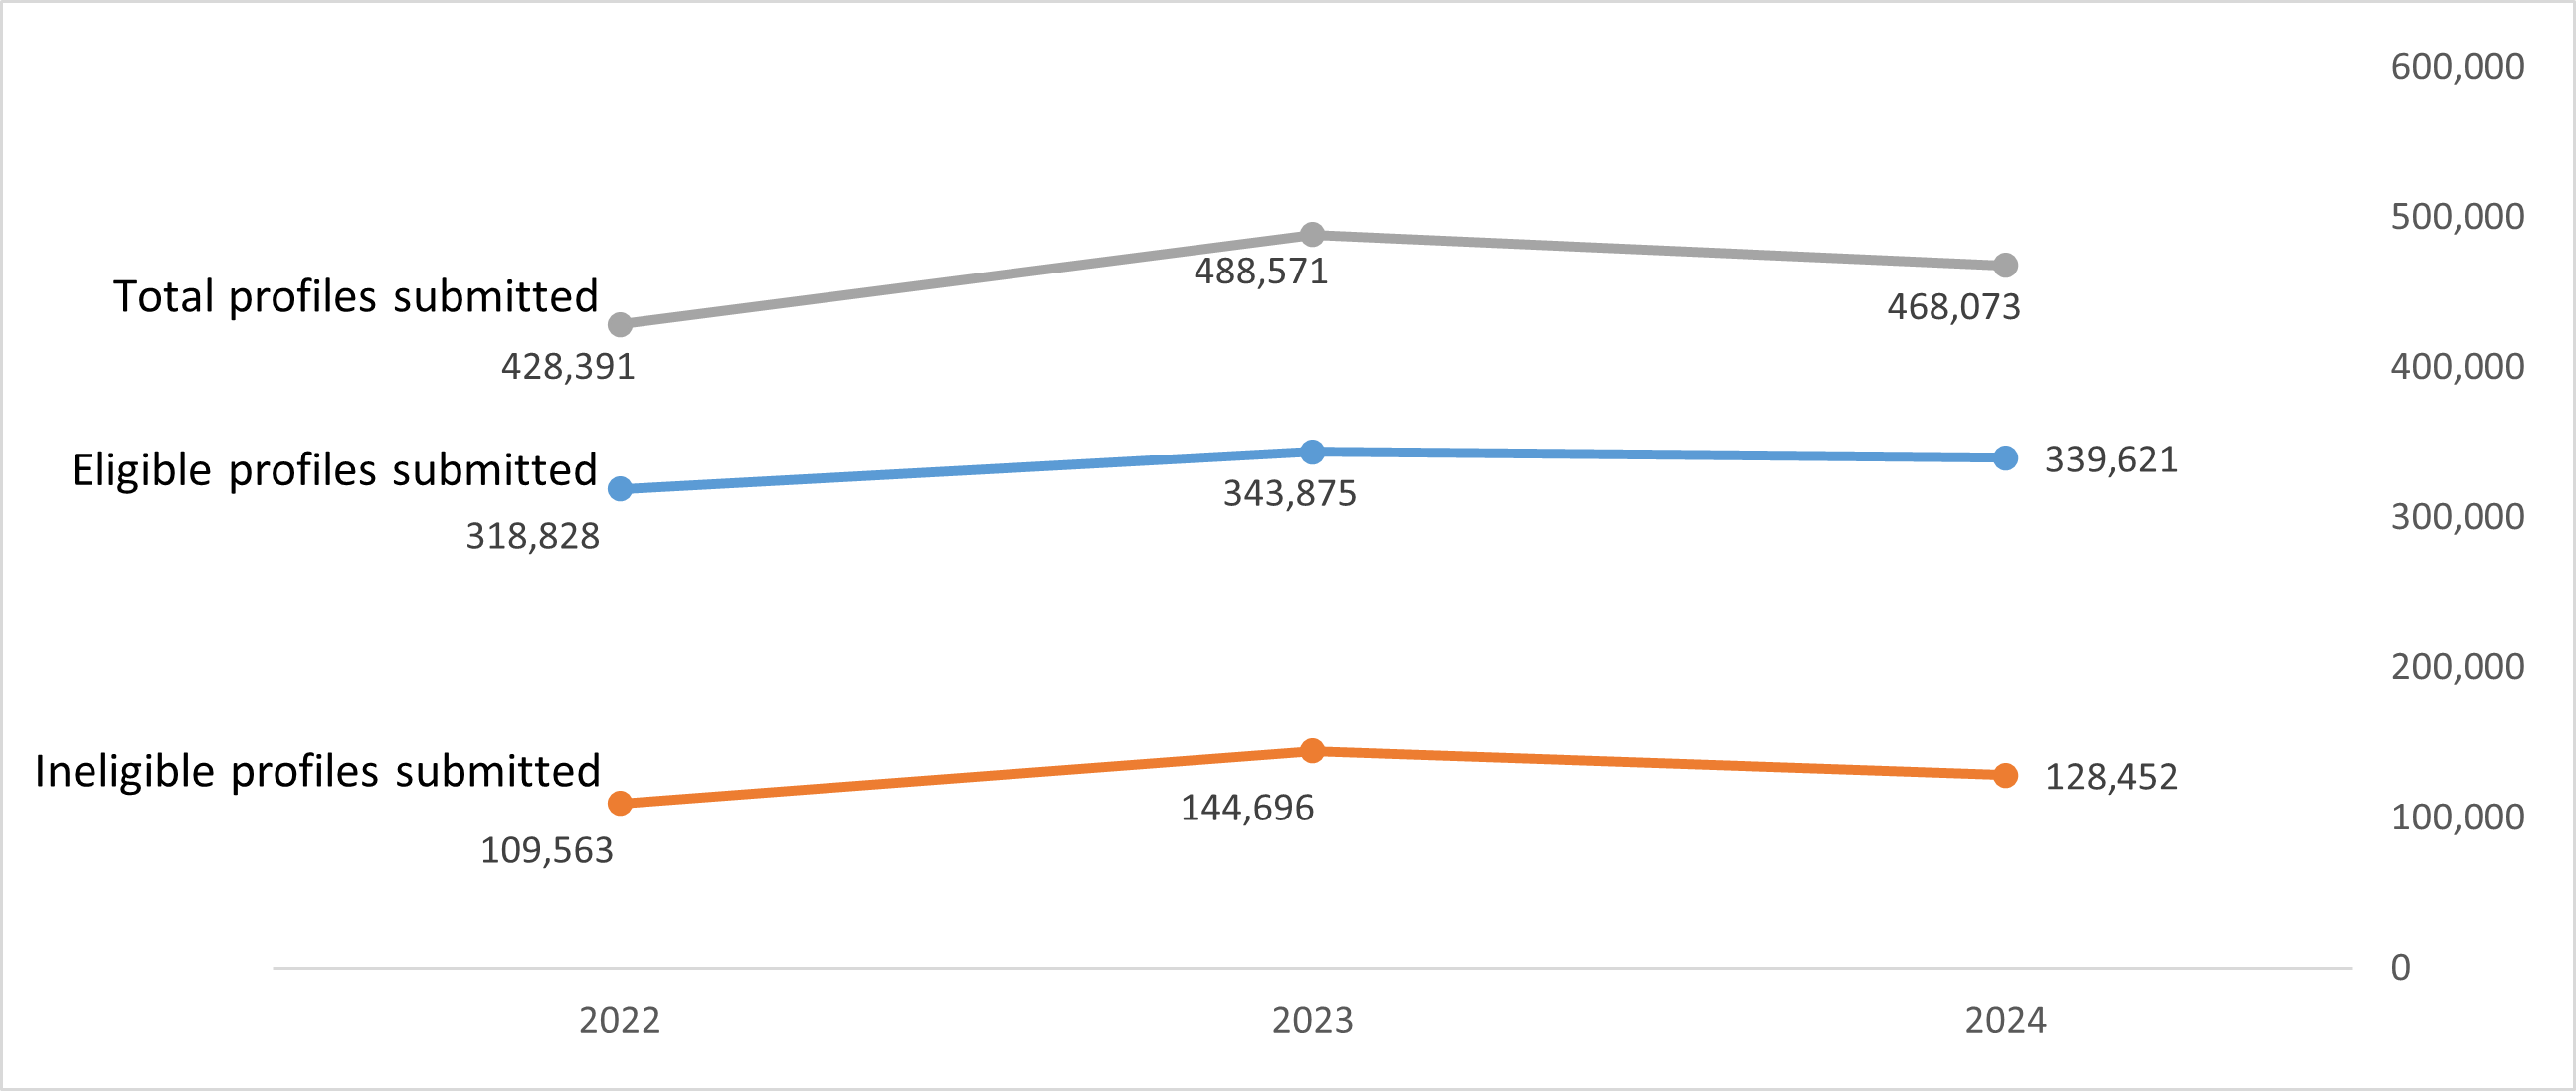
Figure 3 text version
Profile submissions to Express Entry, 2022-2024
In 2022, 428,391 Express Entry profiles were submitted, including 318,828 eligible profiles and 109,563 ineligible profiles. In 2023, a total of 488,571 Express Entry profiles were submitted, including 343,875 eligible profiles and 144,696 ineligible profiles. In 2024, a total of 468,073 Express Entry profiles were submitted, including 339,621 eligible profiles and 128,452 ineligible profiles.
As displayed in Table 1 below, in 2024, more profiles were submitted by men (251,125) than women (216,784). The proportion of total profile submissions by men (54%) and women (46%) was relatively similar to 2023 with a 2% increase in share of women. The proportion of profile submissions that was eligible for at least one program has increased for men (71%) and slighty decreased for women (74%) in 2024 when compared to 2023. Overall, women have consistently submitted a slightly higher proportion of eligible profiles, by approximately 3-8 percentage points compared to men. As seen in Table 1, the share of ineligible and eligible profile submissions have remained relatively similar around the 30% range for ineligible profiles, and 70% range for eligible profiles since 2022.
| Profile Outcome | 2022 # | 2022 % | 2023 # | 2023 % | 2024 # | 2024 % |
|---|---|---|---|---|---|---|
| Men | ||||||
| Eligible | 169,828 | 71% | 183,913 | 67% | 178,370 | 71% |
| Ineligible | 68,570 | 29% | 92,060 | 33% | 72,755 | 29% |
| Total | 238,398 | 100% | 275,973 | 100% | 251,125 | 100% |
| Women | ||||||
| Eligible | 148,961 | 78% | 159,902 | 75% | 161,172 | 74% |
| Ineligible | 40,922 | 22% | 52,489 | 25% | 55,612 | 26% |
| Total | 189,883 | 100% | 212,391 | 100% | 216,784 | 100% |
| TotalTable footnote * | ||||||
| Eligible | 318,828 | 74% | 343,875 | 70% | 339,621 | 73% |
| Ineligible | 109,563 | 26% | 144,696 | 30% | 128,452 | 27% |
| Grand Total | 428,391 | 100% | 488,571 | 100% | 468,073 | 100% |
Source: MBR_FACT_EE_MAIN as of February 03, 2025
Data is operational and as such should be considered preliminary and subject to change
Who got into the Express Entry pool?
The distributions of CRS scores for eligible candidate profiles at the time of submission are presented in Table 2. In each year, the CRS scores consistently remain concentrated in the 301-500 range. It is important to note that the EE pool is dynamic, and that the distribution of CRS scores changes as eligible profiles are submitted, updated, invited, or expire.
| CRS Score Range | 2022 # | 2022 % | 2023 # | 2023 % | 2024 # | 2024 % |
|---|---|---|---|---|---|---|
| 701-1200 | 11 | <1% | 12 | <1% | 7 | <1% |
| 651-700 | 71 | <1% | 76 | <1% | 77 | <1% |
| 601-650 | 240 | <1% | 300 | <1% | 304 | <1% |
| 551-600 | 1,126 | <1% | 1,241 | <1% | 1,973 | 1% |
| 501-550 | 10,725 | 3% | 13,970 | 4% | 25,304 | 7% |
| 451-500 | 76,504 | 24% | 90,692 | 26% | 89,782 | 26% |
| 401-450 | 77,447 | 24% | 88,641 | 26% | 91,445 | 27% |
| 351-400 | 93,621 | 29% | 91,937 | 27% | 82,719 | 24% |
| 301-350 | 49,923 | 16% | 46,806 | 14% | 36,651 | 11% |
| 251-300 | 6,225 | 2% | 6,656 | 2% | 7,161 | 2% |
| 201-250 | 1,986 | 1% | 2,307 | 1% | 2,799 | 1% |
| 151-200 | 731 | <1% | 986 | <1% | 1,087 | <1% |
| 101-150 | 190 | <1% | 218 | <1% | 259 | <1% |
| 1-100 | 28 | <1% | 33 | <1% | 53 | <1% |
| Total | 318,828 | 100% | 343,875 | 100% | 339,621 | 100% |
Source: MBR_FACT_EE_MAIN as of February 03, 2025
Data is operational and as such should be considered preliminary and subject to change.
As seen in Table 3, among individuals who submitted eligible profiles in 2024, more than one-third (38%) did not meet the criteria for any additional points at the time of submission. This is a gradual reduction since 2022 (55%) and 2023 (47%), meaning an increasing share of candidates are eligible for additional points.Footnote 5 Similar to previous years, candidates who met criteria for additional points most often did so through Education in Canada and Siblings in Canada points. For example, in 2024, candidates who claimed additional points for Education in Canada (36%) and Siblings in Canada (16%) met the criteria for additional points. The proportion of eligible profiles that received Education in Canada points has grown more and been higher than other additional point types since 2022. While the proportion of candidates in the EE pool who met additional points criteria for French-language proficiencyFootnote 6 remained stable between 2022 and 2023, it saw a slight increase (3%) in 2024. The proportion of candidates who met additional points criteria for Arranged Employment and for Siblings in Canada slightly increased (3%) in 2024.
| Additional point type | Men 2022 # |
Women 2022 # |
2022 Total # |
2022 Total % |
Men 2023 # |
Women 2023 # |
2023 Total # |
2023 Total % |
Men 2024 # |
Women 2024 # |
2024 Total # |
2024 Total % |
|---|---|---|---|---|---|---|---|---|---|---|---|---|
| No additional points | 93,814 | 82,937 | 176,777 | 55% | 86,516 | 76,462 | 163,007 | 47% | 66,214 | 61,716 | 127,964 | 38% |
| Arranged employment | 13,608 | 6,885 | 20,495 | 6% | 20,285 | 10,464 | 30,751 | 9% | 25,314 | 16,572 | 41,899 | 12% |
| Education in Canada | 39,875 | 34,776 | 74,654 | 23% | 54,001 | 48,321 | 102,346 | 30% | 63,982 | 59,377 | 123,387 | 36% |
| French-language proficiency | 8,982 | 9,695 | 18,681 | 6% | 10,485 | 10,402 | 20,888 | 6% | 15,593 | 15,133 | 30,729 | 9% |
| Siblings in Canada | 21,933 | 22,545 | 44,483 | 14% | 25,647 | 26,607 | 52,264 | 15% | 26,797 | 28,334 | 55,135 | 16% |
| Total | 318,828 | N/A | 343,875 | N/A | 339,621 | N/A |
Source: MBR_FACT_EE_MAIN as of February 03, 2025.
Total includes Another Gender, Unknown and Unspecified (2022 - 39, 2023 - 60, 2024 - 79)
N/A - Breakdown by category exceeds annual total as candidates may be eligible for multiple additional point types (non mutually exclusive)
Data is operational and as such should be considered preliminary and subject to change
As displayed in Table 3, in 2024, a higher number and proportion of men (66, 214, 52%) than women (61,716, 48%) did not meet criteria for any additional points at the time of submitting an eligible profile, although this gap has diminished somewhat, from 6 percentage points to 4 between 2022 and 2024.
Tables 3 further explores additional point breakdowns by gender, and shows that Education in Canada and Siblings in Canada were the most common additional point types for both men and women in 2024. Similar to the trend seen in 2022 and 2023, a considerably higher proportion of men (60%) than women (40%) continued to meet the criteria for Arranged Employment in 2024. While there was a higher proportion of men (52%) who met the criteria for Education in Canada than women (48%) in 2024, the difference has remained stable since 2021.
In regards to additional points for French-language proficiency, there was a near equal distribution between men (51%) and women (49%) in 2024. As in 2023, the proportion of women (51%) meeting Siblings in Canada criteria slightly exceeded men (49%) in 2024.
Table 4 displays the CRS score distribution of eligible candidates in the pool. It can be seen that the CRS scores of eligible candidates in the pool consistently remain concentrated in the 301-500 range. However, in 2024 there was a fourfold increase of those with CRS scores 501-550 relative to previous years.
| CRS Score Range | 2022 # | 2022 % | 2023 # | 2023 % | 2024 # | 2024 % |
|---|---|---|---|---|---|---|
| 701-1200 | 970 | <1% | 3,893 | <1% | 651 | <1% |
| 651-700 | 11 | <1% | 8 | <1% | 14 | <1% |
| 601-650 | 32 | <1% | 63 | <1% | 71 | <1% |
| 551-600 | 83 | <1% | 239 | <1% | 439 | <1% |
| 501-550 | 1,218 | 1% | 4,213 | 2% | 18,152 | 8% |
| 451-500 | 61,500 | 26% | 59,179 | 27% | 62,868 | 29% |
| 401-450 | 58,523 | 25% | 53,619 | 25% | 57,529 | 26% |
| 351-400 | 68,855 | 30% | 59,255 | 27% | 50,638 | 23% |
| 301-350 | 36,001 | 15% | 30,657 | 14% | 22,322 | 10% |
| 251-300 | 3,943 | 2% | 3,755 | 2% | 3,600 | 2% |
| 201-250 | 990 | <1% | 1,058 | <1% | 1,339 | 1% |
| 151-200 | 368 | <1% | 461 | <1% | 518 | <1% |
| 101-150 | 94 | <1% | 100 | <1% | 129 | <1% |
| 1-100 | 18 | <1% | 12 | <1% | 21 | <1% |
| Total | 232,606 | 100% | 216,512 | 100% | 218,291 | 100% |
Source: MBR_FACT_EE_POOL as of February 03, 2025
Data is operational and as such should be considered preliminary and subject to change.
Who was invited to apply for permanent residence through Express Entry?
As seen in Table 5, IRCC held category-based selection rounds from February 1, 2024 to December 3, 2024. The Department issued 98,903 ITAs across economic programs. There were 47,749 candidates who received an ITA through CEC, followed by 27,110 candidates through FSWP, 24,038 candidates through PNP, and 6 through FSTP.
Overall, IRCC held 52 rounds in 2024 to issue 98,903 ITAs, representing a 10% decrease from the 110, 266 issued in 2023. There were 9 general invitation rounds, 14 PNP rounds, 10 CEC rounds, and 19 category-based selection rounds. The highest number of ITAs were issued to candidates through CEC invitation rounds (47, 749, of which 21,249 qualified for CBS), followed by PNP (15,483), and 14,445 ITAs issued under general rounds (Table 5).
Category-based selection rounds comprised 42, 475 ITAs, representing 43% of the total number of ITAs. There were 19 category-based selection rounds, with 11 French language-proficiency rounds yielding (23,000 ITAs), 3 healthcare occupations rounds (10,250 ITAs), 1 STEM occupations round (4,500 ITAs), 2 trade occupations rounds (3,600 ITAs), 1 transport occupations round (975 ITAs), and 1 agriculture and agri-food occupations round (150 ITAs).
In terms of candidates invited to apply in other rounds, CRS cut-off scores in 2024 ranged from 663 to 816 for PNP-specific rounds (median = 716) and from 524 to 549 for general rounds (median = 535). It is worth noting that candidates who are nominated through the PNP automatically receive 600 points through the process. The CRS cut-off scores of general rounds were notably higher by over 20 points in 2024 compared to 2023.
For category-based rounds, CRS cut-off scores in 2024 ranged from 336 to 491 (median = 433). For the French language-proficiency rounds, the CRS cut-off scores ranged from 336 to 478 (median = 410) while for the healthcare occupation rounds, the CRS cut-off scores ranged from 422 to 463 (median = 445). For the STEM occupation round, the CRS cut-off score was 491 and 437 for the agriculture and agri-food occupation round. Lastly, the CRS cut-off score, similar to year 2023, remained at 430 for the transportation occupation round, while it ranged from 433 to 436 (median = 435) for the trade occupations rounds.
| ITA Type | Average CRS Cut-off | Grand Total |
|---|---|---|
| Provincial Nominee Program | 725 | 15,483 |
| General | 536 | 14,445 |
| Canadian Experience Class | 524 | 26,500 |
| French language proficiency | 409 | 23,000 |
| STEM Occupations | 491 | 4,500 |
| Healthcare Occupations | 443 | 10,250 |
| Trade Occupations | 435 | 3,600 |
| Transport Occupations | 430 | 975 |
| Agriculture and agri-food Occupations | 437 | 150 |
| Total ITA | 98,903 | |
Source: MBR_FACT_EE_ITA_CBS as of February 03, 2025
Data is operational and as such should be considered preliminary and subject to change.
Overall, when comparing the distribution of ITAs by gender in Table 6, it can be seen that men received a higher proportion (53%) of invitations issued in 2024. When further breaking down the data by program type, men received similar proportions of invitations to women in CEC (48%) and a slightly higher proportion of invitations in PNP (27% and 21%, respectively). This is similar in the gender distribution across programs in 2023. A similar trend was seen for women, as 46% of invitations were issued under CEC and 21% under PNP in 2023, while there was a slight increase in proportion for CEC (48%) while PNP (21%) remained relatively similar in 2024 to year 2023.
Similar to 2023, women received a higher proportion (31%) of invitations than men (25%) under the FSWP in 2024. There were no invitations issued under the FSTP in 2023 for women while there were 6 invitations issued for men, less than 1%, in 2024. This is because candidates who may qualify for FSTP may also qualify for CEC or FSWP, and may be invited through program eligibility in those programs.
| Program Hierarchy | 2022 # | 2022 % | 2023 # | 2023 % | 2024 # | 2024 % |
|---|---|---|---|---|---|---|
| Men | ||||||
| Canadian Experience Class | 11,309 | 42% | 32,284 | 52% | 25,318 | 48% |
| Provincial/Territorial Nominees | 11,676 | 43% | 16,337 | 26% | 14,234 | 27% |
| Federal Skilled Workers | 4,109 | 15% | 14,007 | 22% | 12,878 | 25% |
| Skilled Trades | 7 | <1% | 6 | <1% | ||
| Total | 27,094 | 100% | 62,635 | 100% | 52,436 | 100% |
| Women | ||||||
| Canadian Experience Class | 7.586 | 39% | 21,981 | 46% | 22,421 | 48% |
| Provincial/Territorial Nominees | 7,582 | 39% | 10,108 | 21% | 9,804 | 21% |
| Federal Skilled Workers | 4,276 | 22% | 15,534 | 33% | 14,231 | 31% |
| Skilled Trades | 1 | <1% | ||||
| Total | 19,444 | 100% | 47,624 | 100% | 46,456 | 100% |
Source: MBR_FACT_EE_ITA as of February 03, 2025
Data is operational and as such should be considered preliminary and subject to change.
Tables 7 to 9 display the socio-demographic characteristics of candidates invited to apply for permanent residence, and show shifting trends between 2022 and 2024, largely attributable to changes in the invitation round strategies, including a focus on CEC and PNP, and the introduction of category-based selection in mid-2023, and the first full year of category-based rounds in 2024.
In terms of the age of candidates invited to apply, the share of invitations issued to those aged 20-29 (the age category associated with the highest number of points under the CRS) remained the largest group in 2024 (53%), representing a slight decline from 2023 (54%) but an increase from 2022 (50%). Those aged 30-34 represented the second largest age group and saw a slight increase in 2024 (28%) from 2023 (27%). Overall, the age structure remained relatively similar over consecutive years.
Looking at the highest level of education of those invited to apply, in 2024, the distribution was relatively on par with year 2023 but slightly varied from year 2022. The largest proportion of invitations (47%) was issued to candidates with post-secondary credential of three years or longer, demonstrating an increase of 7 percentage points from 2022 (40%). This was followed by candidates with master’s degree and entry-to-practice professional degree (41%), which decreased from 2022 (46%). The proportion of candidates with one or two year post-secondary credential as well as high school or less remained relatively the same rate since 2022, and those with PhDs decreased slightly in number in 2024 compared to 2023 but as a share of total of ITAs remained at the same rate of 3% since 2023. Overall candidates who received ITAs remained highly educated, with 90% claiming to hold a post-secondary educational credential of at least three years, which was a slight decrease from 2023 (92%).
Table 7: Invitations to apply issued to candidates by age and level of education, 2022-2024
| Age Group | 2022 # | 2022 % | 2023 # | 2023 % | 2024 # | 2024 % |
|---|---|---|---|---|---|---|
| <20 | 2 | <1% | 10 | <1% | ||
| 20-29 | 23,305 | 50% | 59,938 | 54% | 52,562 | 53% |
| 30-34 | 13,721 | 29% | 29,627 | 27% | 27,259 | 28% |
| 35-39 | 6,156 | 13% | 13,481 | 12% | 12,295 | 12% |
| 40-44 | 2,213 | 5% | 4,916 | 4% | 4,560 | 5% |
| 44+ | 1,144 | 2% | 2,302 | 2% | 2,217 | 2% |
| Total | 46,539 | 100% | 110,266 | 100% | 98,903 | 100% |
| Highest Level of Education | 2022 # | 2022 % | 2023 # | 2023 % | 2024 # | 2024 % |
|---|---|---|---|---|---|---|
| High School or Less | 540 | 1% | 810 | 1% | 727 | 1% |
| One or two year post-secondary credential | 4,050 | 9% | 7,819 | 7% | 9,243 | 9% |
| Post-secondary credential of three years or longer | 18,588 | 40% | 50,294 | 46% | 46,052 | 47% |
| Master's Degree or entry-to-practice professional degree | 21,278 | 46% | 47,529 | 43% | 40,244 | 41% |
| PhD | 2,083 | 4% | 3,814 | 3% | 2,637 | 3% |
| Total | 46,539 | 100% | 110,266 | 100% | 98,903 | 100% |
Source: MBR_FACT_EE_ITA as of February 03, 2025
Data is operational and as such should be considered preliminary and subject to change.
When considering the first official language proficiency (Table 8) of candidates invited to apply, language skill level slightly increased in 2024 for both CLB 7 and 8, but slightly decreased for both CBL 9 and 10. In 2023, the most common Canadian Language Benchmarks (CLB)/Niveaux de compétence linguistique canadiens (NCLC) level was 9 (31%) followed by level 7 (24%). In 2024, these two CLB/NCLC levels were equally common (27% for both), followed by level 8 (25%). However, when compared to 2022, these CLB levels nearly doubled in number given the larger volume of invitations issued in 2024.
Looking at Canadian work experience (Table 9), in 2024, a majority of candidates invited to apply (64%) had at least one year of eligible Canadian work experience. The share is consistent with previous years with a slight increase from 2023 (63%) and 2022 (62%). In 2024 (Table 9), 34% of invitations went to candidates with no eligible Canadian work experience followed by 31% of invitations being issued to candidates with one year of Canadian work experience.
The proportion of candidates with 3 or more years of foreign experience in 2024 (54%) was somewhat similar to the proportion in 2023 (56%) (Table 9), but declined slightly since 2022 (58%). A drastic contrast in 2024 is seen in the proportion of candidates with no foreign work experience or less than one year foreign work experience (1% in 2024 versus 28% in 2023 versus 27% in 2022).
| First official language Level | 2022 # | 2022 % | 2023 # | 2023 % | 2024 # | 2024 % |
|---|---|---|---|---|---|---|
| CLB/NCLC 4 | 7 | <1% | 5 | <1% | 5 | <1% |
| CLB/NCLC 5 | 817 | 2% | 1192 | 1% | 1,134 | 1% |
| CLB/NCLC 6 | 2,094 | 4% | 3,849 | 3% | 3,646 | 4% |
| CLB/NCLC 7 | 9,444 | 20% | 26,173 | 24% | 26,535 | 27% |
| CLB/NCLC 8 | 8,709 | 19% | 25,214 | 23% | 25,167 | 25% |
| CLB/NCLC 9 | 15,587 | 33% | 33,872 | 31% | 26,609 | 27% |
| CLB/NCLC 10 | 9,881 | 21% | 19,961 | 18% | 15,807 | 16% |
| Total | 46,539 | 100% | 110,266 | 100% | 98,903 | 100% |
Source: MBR_FACT_EE_ITA as of February 03, 2025
Data is operational and as such should be considered preliminary and subject to change.
| Experience level | 2022 # | 2022 % | 2023 # | 2023 % | 2024 # | 2024 % |
|---|---|---|---|---|---|---|
| Canadian Work Experience | ||||||
| Less than one year | 1,957 | 4% | 4,126 | 4% | 2,161 | 2% |
| 1 year | 18,986 | 41% | 40,033 | 36% | 31,151 | 31% |
| 2 years | 7,246 | 16% | 25,127 | 23% | 22,839 | 23% |
| 3 years | 1,528 | 3% | 3,255 | 3% | 8,112 | 8% |
| 4 years | 480 | 1% | 872 | 1% | 1,017 | 1% |
| 5 years or more | 276 | 1% | 506 | 0% | 464 | 0% |
| None | 16,066 | 35% | 36,347 | 33% | 33,159 | 34% |
| Total | 46,539 | 100% | 110,266 | 100% | 98,903 | 100% |
| Foreign Work Experience | ||||||
| No foreign work experience or less than one year | 12,569 | 27% | 31,276 | 28% | 497 | 1% |
| 1 year | 3,796 | 8% | 9,576 | 9% | 11,340 | 11% |
| 2 years | 3,267 | 7% | 7,077 | 6% | 7,812 | 8% |
| 3 years | 6,035 | 13% | 14,706 | 13% | 13,224 | 13% |
| 4 years | 4,621 | 10% | 11,908 | 11% | 10,517 | 11% |
| 5 years or more | 16,251 | 35% | 35,723 | 32% | 30,094 | 30% |
| Total | 46,539 | 100% | 110,266 | 100% | 98,903 | 100% |
Source: MBR_FACT_EE_ITA as of February 03, 2025
Data is operational and as such should be considered preliminary and subject to change.
Table 10 provides information on (a) invitations issued to candidates who were assigned additional points in each category and (b) invitations issued to candidates who met relevant criteria for the category but were not necessarily assigned points.Footnote 7 A maximum of 600 total additional points can be assigned under the CRS, meaning candidates assigned 600 points for a provincial nomination cannot be assigned other additional points, even if they meet the criteria. For example, in 2024, while 20, 957 ITAs were issued to candidates who met criteria for Arranged Employment points, only 18,708 of these candidates were assigned the points in their CRS scores. Data are provided for both candidates who met criteria for and were assigned additional points to facilitate comparison, as well as to reflect the fuller characteristics of candidates who were invited to apply for permanent residence.Footnote 8 In 2024, less than one half of ITAs (31%) were issued on the basis of human capital attributes alone (i.e. to candidates who did not meet criteria for any additional points).
In 2024, the number of candidates who received additional points for French-language proficiency nearly doubled at 25% compared to 2023 at 14%. Nearly all 25% met the criteria for additional points in 2024. This increase is primarily related to the French-proficiency category and the Department’s growing Francophone immigration targets.
| Additional point typeTable footnote * | 2022 # | 2022 % | 2023 # | 2023 % | 2024 # | 2024 % |
|---|---|---|---|---|---|---|
| (a) Assigned additional points | ||||||
| No Additional Points | 20,933 | 45% | 37,268 | 34% | 30,458 | 31% |
| Provincial Nominee | 19,258 | 41% | 26,445 | 24% | 24,038 | 24% |
| Arranged Employment | 7,350 | 16% | 17,881 | 16% | 18,708 | 19% |
| Education in Canada | 12,625 | 27% | 40,027 | 36% | 35,208 | 36% |
| French-language proficiency | 6,251 | 13% | 14,944 | 14% | 24,303 | 25% |
| Siblings in Canada | 4,937 | 11% | 16,226 | 15% | 13,664 | 14% |
| (b) Met Criteria for points | ||||||
| No Additional Points | 8,953 | 19% | 19,830 | 18% | 14,467 | 15% |
| Provincial Nominee | 19,258 | 41% | 26,445 | 24% | 24,038 | 24% |
| Arranged Employment | 9,583 | 21% | 20,716 | 19% | 20,957 | 21% |
| Education in Canada | 19,587 | 42% | 50,987 | 46% | 47,038 | 48% |
| French-language proficiency | 7,561 | 16% | 15,812 | 14% | 24,686 | 25% |
| Siblings in Canada | 7,766 | 17% | 20,823 | 19% | 16,864 | 17% |
| Total | 46,539 | 100% | 110,266 | 100% | 98,903 | 100% |
Source: MBR_FACT_EE_ITA as of February 3, 2025
Data is operational and as such should be considered preliminary and subject to change.
Table 11 provides information on invitations issued to men and women who met the criteria to receive each additional point type. Education in Canada (47,038) and French language proficiency (24,686) were the most common additional point types for which both men and women met criteria in 2024. While Education in Canada (25,559) and Arranged Employment (11,699) remained the most common additional point type for men, the most common additional point type for women was Education in Canada (21,476) and French language proficiency (12,242) in 2024. The share of additional points for Arranged Employment across genders began to equalize in 2024 with 56% of men meeting the criteria compared to 44% of women. This was a change from previous years where differences between men and women were more notable with the share of men nearly two-fold relative to women with arranged employment. Furthermore, for French-language proficiency and Siblings in Canada, differences across genders have remained somewhat stable since 2022 with some slight fluctuations.
| Gender | 2022 # | 2022 % | 2023 # | 2023 % | 2024 # | 2024 % |
|---|---|---|---|---|---|---|
| Arranged Employment | ||||||
| Men | 6,195 | 65% | 13,548 | 65% | 11,699 | 56% |
| Women | 3,388 | 35% | 7,166 | 35% | 9,253 | 44% |
| Total | 9,583 | 100% | 20,716 | 100% | 20,957 | 100% |
| Education in Canada | ||||||
| Men | 11,822 | 60% | 29,973 | 59% | 25,559 | 54% |
| Women | 7,765 | 40% | 21,010 | 41% | 21,476 | 46% |
| Total | 19,587 | 100% | 50,987 | 100% | 47,038 | 100% |
| French Language Proficiency | ||||||
| Men | 3,529 | 47% | 7,709 | 49% | 12,443 | 50% |
| Women | 4,031 | 53% | 8,103 | 51% | 12,242 | 50% |
| Total | 7,561 | 100% | 15,812 | 100% | 24,686 | 100% |
| Siblings in Canada | ||||||
| Men | 4,008 | 52% | 10,496 | 50% | 8,017 | 48% |
| Women | 3,758 | 48% | 10,326 | 50% | 8,846 | 52% |
| Total | 7,766 | 100% | 20,823 | 100% | 16,864 | 100% |
Source: MBR_FACT_EE_ITA as of February 3, 2025
Data is operational and as such should be considered preliminary and subject to change.
As seen in Table 12a, in 2024, candidates with TEER 1 occupations (occupations that usually require a university degree) made-up a significant proportion (62%) of ITAs among the top 15 occupations relative to TEER 2 and 3. By comparison, 72% were in TEER 1 in 2023 and 65% in 2022. In 2024, occupations in the IT sector made-up a significant proportion of the candidates invited to apply through EE, including software engineers and designers, software developers and programmers, and information systems specialists. This was a relatively similar trend to 2023, but at lower levels of ITAs. 2024 saw more diversity across sectors of top primary occupations in IT, food services, trades, finance, and healthcare relative to 2023 that saw a great concentration of occupations in the IT sector.
| Primary Occupation | TEER | 2022 # | Primary Occupation | TEER | 2023 # | Primary Occupation | TEER | 2024 # |
|---|---|---|---|---|---|---|---|---|
| 21231 Software engineers and designers | 1 | 3,848 | 21231 Software engineers and designers | 1 | 7,259 | 21231 Software engineers and designers | 1 | 3,715 |
| 21222 Information systems specialists | 1 | 1,889 | 21232 Software developers and programmers | 1 | 5,183 | 62020 Food service supervisors | 2 | 3,608 |
| 21230 Computer systems developers and programmers | 1 | 1,855 | 62020 Food service supervisors | 2 | 3,277 | 21232 Software developers and programmers | 1 | 3,142 |
| 62020 Food service supervisors | 2 | 1,558 | 21222 Information systems specialists | 1 | 2,951 | 13110 Administrative assistants | 3 | 2,669 |
| 11202 Professional occupations in advertising, marketing and public relations | 1 | 1,025 | 13110 Administrative assistants | 3 | 2,538 | 41220 Secondary school teachers | 1 | 2,136 |
| 21223 Database analysts and data administrators | 1 | 1,025 | 21223 Database analysts and data administrators | 1 | 2,151 | 21222 Information systems specialists | 1 | 2,091 |
| 41200 University professors and lecturers | 1 | 955 | 11202 Professional occupations in advertising, marketing and public relations | 1 | 2,142 | 11100 Financial auditors and accountants | 1 | 2,079 |
| 13200 Customs, ship and other brokers | 3 | 945 | 11100 Financial auditors and accountants | 1 | 2,090 | 33102 Nurse aides, orderlies and patient service associates | 3 | 1,946 |
| 11201 Professional occupations in business management consulting | 1 | 901 | 22221 User support technicians | 2 | 1,844 | 11202 Professional occupations in advertising, marketing and public relations | 1 | 1,945 |
| 11100 Financial auditors and accountants | 1 | 857 | 20012 Computer and information systems managers | 0 | 1,841 | 31102 General practitioners and family physicians | 1 | 1,841 |
| 20012 Computer and information systems managers | 0 | 855 | 13100 Administrative officers | 3 | 1,747 | 31301 Registered nurses and registered psychiatric nurses | 1 | 1,776 |
| 22221 User support technicians | 2 | 842 | 21211 Data scientists | 1 | 1,654 | 22221 User support technicians | 2 | 1,733 |
| 10022 Advertising, marketing and public relations managers | 0 | 812 | 21221 Business systems specialists | 1 | 1,600 | 62010 Retail sales supervisors | 2 | 1,718 |
| 13100 Administrative officers | 3 | 800 | 12200 Accounting technicians and bookkeepers | 2 | 1,599 | 13100 Administrative officers | 3 | 1,708 |
| 63200 Cooks | 3 | 728 | 21230 Computer systems developers and programmers | 1 | 1,475 | 21221 Business systems specialists | 1 | 1,517 |
| Other | 27,644 | Other | 70,915 | Other | 65,279 | |||
| Total | 46,539 | Total | 110,266 | Total | 98,903 |
| Primary Occupation | TEER | 2022 # | Primary Occupation | TEER | 2023 # | Primary Occupation | TEER | 2024 # |
|---|---|---|---|---|---|---|---|---|
| 21231 Software engineers and designers | 1 | 2,945 | 21231 Software engineers and designers | 1 | 5484 | 21231 Software engineers and designers | 1 | 2,807 |
| 21230 Computer systems developers and programmers | 1 | 1,402 | 21232 Software developers and programmers | 1 | 3807 | 21232 Software developers and programmers | 1 | 2,321 |
| 21222 Information systems specialists | 1 | 1,249 | 21222 Information systems specialists | 1 | 2002 | 21222 Information systems specialists | 1 | 1,424 |
| 62020 Food service supervisors | 2 | 684 | 20012 Computer and information systems managers | 0 | 1333 | 62020 Food service supervisors | 2 | 1,320 |
| 21223 Database analysts and data administrators | 1 | 662 | 62020 Food service supervisors | 2 | 1332 | 22221 User support technicians | 2 | 1,029 |
| 20012 Computer and information systems managers | 0 | 624 | 21223 Database analysts and data administrators | 1 | 1284 | 72106 Welders and related machine operators | 2 | 998 |
| 41200 University professors and lecturers | 1 | 553 | 22221 User support technicians | 2 | 1187 | 41220 Secondary school teachers | 1 | 983 |
| 22221 User support technicians | 2 | 528 | 21230 Computer systems developers and programmers | 1 | 1094 | 11100 Financial auditors and accountants | 1 | 944 |
| 11201 Professional occupations in business management consulting | 1 | 471 | 21211 Data scientists | 1 | 1091 | 62010 Retail sales supervisors | 2 | 940 |
| 63200 Cooks | 3 | 469 | 73300 Transport truck drivers | 3 | 1065 | 21221 Business systems specialists | 1 | 883 |
| 00012 Senior managers - financial, communications and other business services | 0 | 462 | 72106 Welders and related machine operators | 2 | 1060 | 31102 General practitioners and family physicians | 1 | 801 |
| 72100 Machinists and machining and tooling inspectors | 2 | 456 | 21221 Business systems specialists | 1 | 947 | 21223 Database analysts and data administrators | 1 | 800 |
| 62100 Technical sales specialists - wholesale trade | 2 | 445 | 11100 Financial auditors and accountants | 1 | 923 | 72204 Telecommunications line and cable installers and repairers | 2 | 794 |
| 62010 Retail sales supervisors | 2 | 435 | 21300 Civil engineers | 1 | 865 | 73300 Transport truck drivers | 3 | 789 |
| 21234 Web developers and programmers | 1 | 424 | 62010 Retail sales supervisors | 2 | 852 | 20012 Computer and information systems managers | 0 | 767 |
| Other | 15,285 | Other | 38,309 | Other | 34,836 | |||
| Total | 27,094 | Total | 62,635 | Total | 52,436 |
Source: MBR_FACT_EE_ITA as of February 03, 2025
Data is operational and as such should be considered preliminary and subject to change.
TEER Definition
TEER 0: Management occupations examples - Advertising, marketing and public relations managers, financial managers
TEER 1: Occupations that usually require a university degree, examples - Financial advisors, Software engineers
TEER 2: Occupations that usually require a college diploma, including occupations that require apprenticeship training of 2 or more years, or supervisory occupations
TEER 3: Occupations that usually require, a college diploma, including occupations that require apprenticeship training of less than 2 years, or more than 6 months of on-the-job training
| Primary Occupation | TEER | 2022 # | Primary Occupation | TEER | 2023 # | Primary Occupation | TEER | 2024 # |
|---|---|---|---|---|---|---|---|---|
| 21231 Software engineers and designers | 1 | 903 | 62020 Food service supervisors | 2 | 1,945 | 62020 Food service supervisors | 2 | 2,286 |
| 62020 Food service supervisors | 2 | 874 | 13110 Administrative assistants | 3 | 1,893 | 13110 Administrative assistants | 3 | 2,017 |
| 13200 Customs, ship and other brokers | 3 | 706 | 21231 Software engineers and designers | 1 | 1,775 | 31301 Registered nurses and registered psychiatric nurses | 1 | 1,530 |
| 21222 Information systems specialists | 1 | 640 | 21232 Software developers and programmers | 1 | 1,376 | 33102 Nurse aides, orderlies and patient service associates | 3 | 1,510 |
| 11202 Professional occupations in advertising, marketing and public relations | 1 | 637 | 11202 Professional occupations in advertising, marketing and public relations | 1 | 1,326 | 11202 Professional occupations in advertising, marketing and public relations | 1 | 1,226 |
| 13100 Administrative officers | 3 | 555 | 11100 Financial auditors and accountants | 1 | 1,167 | 13100 Administrative officers | 3 | 1,209 |
| 42202 Early childhood educators and assistants | 2 | 489 | 13100 Administrative officers | 3 | 1,131 | 42202 Early childhood educators and assistants | 2 | 1,190 |
| 10022 Advertising, marketing and public relations managers | 0 | 485 | 31110 Dentists | 1 | 1,042 | 41220 Secondary school teachers | 1 | 1,153 |
| 11100 Financial auditors and accountants | 1 | 479 | 31301 Registered nurses and registered psychiatric nurses | 1 | 1,014 | 11100 Financial auditors and accountants | 1 | 1,135 |
| 21230 Computer systems developers and programmers | 1 | 453 | 21222 Information systems specialists | 1 | 949 | 31102 General practitioners and family physicians | 1 | 1,040 |
| 11201 Professional occupations in business management consulting | 1 | 430 | 12200 Accounting technicians and bookkeepers | 2 | 939 | 31110 Dentists | 1 | 978 |
| 12200 Accounting technicians and bookkeepers | 2 | 423 | 42202 Early childhood educators and assistants | 2 | 930 | 21231 Software engineers and designers | 1 | 905 |
| 41200 University professors and lecturers | 1 | 402 | 21223 Database analysts and data administrators | 1 | 867 | 12200 Accounting technicians and bookkeepers | 2 | 878 |
| 31301 Registered nurses and registered psychiatric nurses | 1 | 386 | 31102 General practitioners and family physicians | 1 | 850 | 21232 Software developers and programmers | 1 | 821 |
| 21223 Database analysts and data administrators | 1 | 363 | 41200 University professors and lecturers | 1 | 702 | 62010 Retail sales supervisors | 2 | 778 |
| Other | 11,219 | Other | 29,718 | Other | 27,800 | |||
| Total | 19,444 | Total | 47,624 | Total | 46,456 |
Source: MBR_FACT_EE_ITA as of February 03, 2025
Data is operational and as such should be considered preliminary and subject to change.
TEER Definition
TEER 0: Management occupations examples - Advertising, marketing and public relations managers, financial managers
TEER 1: Occupations that usually require a university degree, examples - Financial advisors, Software engineers
TEER 2: Occupations that usually require a college diploma, including occupations that require apprenticeship training of 2 or more years, or supervisory occupations
TEER 3: Occupations that usually require, a college diploma, including occupations that require apprenticeship training of less than 2 years, or more than 6 months of on-the-job training
As seen in Table 12b and 12c, there were differences in the 15 most common primary occupations at the time of invitation for men and women in 2024. While the most common primary occupation at the time of invitation in 2024 were identical to 2023 (software engineers and designers), men and women’s top occupations differed. Overall, men had a higher share of ITAs in IT, trades, finance, and transport, whereas women had a higher share of ITAs in the service sector, education, healthcare as well as IT.
Table 13a displays the most common occupations among candidates invited to apply who were assigned Arranged Employment points. Candidates most likely to have Arranged Employment included those employed in the service sector, IT, financial, and trades. In 2024, there was a greater diversity among Arranged Employment occupations, when compared to 2023. The TEER categories of the top 15 occupations were slightly higher than in 2023, including four TEER 0 occupations, five TEER 1 occupations, three TEER 2 occupations, and three TEER 3 occupations. Moreover, in 2024 there were three top occupations represented in healthcare and one in education as a result of category-based selection. This is in contrast to 2022 and 2023, when no occupations in healthcare and education were represented.
| Primary Occupation with assigned arranged employment point | TEER | 2022 # | Primary Occupation with assigned arranged employment point | TEER | 2023 # | Primary Occupation with assigned arranged employment point | TEER | 2024 # |
|---|---|---|---|---|---|---|---|---|
| 21231 Software engineers and designers | 1 | 889 | 21231 Software engineers and designers | 1 | 2,016 | 62020 Food service supervisors | 2 | 2,590 |
| 21230 Computer systems developers and programmers | 1 | 512 | 62020 Food service supervisors | 2 | 1,477 | 21231 Software engineers and designers | 1 | 1074 |
| 00012 Senior managers - financial, communications and other business services | 0 | 457 | 21232 Software developers and programmers | 1 | 1,008 | 13110 Administrative assistants | 3 | 992 |
| 21222 Information systems specialists | 1 | 441 | 21222 Information systems specialists | 1 | 956 | 62010 Retail sales supervisors | 2 | 790 |
| 41200 University professors and lecturers | 1 | 407 | 00012 Senior managers - financial, communications and other business services | 0 | 733 | 63200 Cooks | 3 | 607 |
| 62020 Food service supervisors | 2 | 375 | 21230 Computer systems developers and programmers | 1 | 666 | 13100 Administrative officers | 3 | 602 |
| 00015 Senior managers - construction, transportation, production and utilities | 0 | 305 | 13110 Administrative assistants | 3 | 576 | 21232 Software developers and programmers | 1 | 578 |
| 00014 Senior managers - trade, broadcasting and other services | 0 | 206 | 20012 Computer and information systems managers | 0 | 526 | 21222 Information systems specialists | 1 | 556 |
| 20012 Computer and information systems managers | 0 | 206 | 41200 University professors and lecturers | 1 | 526 | 00012 Senior managers - financial, communications and other business services | 0 | 483 |
| 13100 Administrative officers | 3 | 150 | 00015 Senior managers - construction, transportation, production and utilities | 0 | 476 | 60030 Restaurant and food service managers | 0 | 448 |
| 63200 Cooks | 3 | 150 | 13100 Administrative officers | 3 | 430 | 41200 University professors and lecturers | 1 | 431 |
| 13200 Customs, ship and other brokers | 3 | 145 | 63200 Cooks | 3 | 420 | 12200 Accounting technicians and bookkeepers | 2 | 425 |
| 21223 Database analysts and data administrators | 1 | 137 | 00014 Senior managers - trade, broadcasting and other services | 0 | 350 | 00014 Senior managers - trade, broadcasting and other services | 0 | 298 |
| 12200 Accounting technicians and bookkeepers | 2 | 125 | 62010 Retail sales supervisors | 2 | 339 | 00015 Senior managers - construction, transportation, production and utilities | 0 | 292 |
| 52120 Graphic designers and illustrators | 2 | 98 | 73300 Transport truck drivers | 3 | 334 | 11202 Professional occupations in advertising, marketing and public relations | 1 | 245 |
| Other | 2,747 | Other | 7,048 | Other | 8,297 | |||
| Total | 7,350 | Total | 17,881 | Total | 18,708 |
Source: MBR_FACT_EE_ITA as of February 03, 2025
Data is operational and as such should be considered preliminary and subject to change.
TEER Definition
TEER 0: Management occupations examples - Advertising, marketing and public relations managers, financial managers
TEER 1: Occupations that usually require a university degree, examples - Financial advisors, Software engineers
TEER 2: Occupations that usually require a college diploma, including occupations that require apprenticeship training of 2 or more years, or supervisory occupations
TEER 3: Occupations that usually require, a college diploma, including occupations that require apprenticeship training of less than 2 years, or more than 6 months of on-the-job training
Table 13b and 13c show the most common occupations for candidates with Arranged Employment points who received ITAs, broken down by gender. The most common occupations among invited men (5) with Arranged Employment points included the same number of TEER 1 occupations (5) in comparison to their female counterparts (5). However, men had more TEER 0 occupations (5) compared to women (2). Women’s top occupation, food service supervisors, remained the same from 2022 to 2024. Similarly, men’s top occupation changed to food service supervisors compared to software engineers and designers from 2022 to 2023. For women, new occupations that made it among the top 15 relative to year 2023 include early childhood educators and senior managers in finance, communications, and other business. For men, new occupations include administrative assistants, university professors and lecturers, as well as restaurant and food service managers. Overall, 2024 saw a lower share of candidates in TEER 1 occupations compared to year 2023. The highest share of candidates with arranged employment came from TEER 2 occupations whereas in year 2023, the highest share came from TEER 1.
| Primary Occupation with assigned arranged employment point | TEER | 2022 # | Primary Occupation with assigned arranged employment point | TEER | 2023 # | Primary Occupation with assigned arranged employment point | TEER | 2024 # |
|---|---|---|---|---|---|---|---|---|
| 21231 Software engineers and designers | 1 | 723 | 21231 Software engineers and designers | 1 | 1,629 | 62020 Food service supervisors | 2 | 927 |
| 21230 Computer systems developers and programmers | 1 | 429 | 21232 Software developers and programmers | 1 | 788 | 21231 Software engineers and designers | 1 | 825 |
| 00012 Senior managers - financial, communications and other business services | 0 | 353 | 21222 Information systems specialists | 1 | 730 | 62010 Retail sales supervisors | 2 | 443 |
| 21222 Information systems specialists | 1 | 330 | 00012 Senior managers - financial, communications and other business services | 0 | 585 | 21232 Software developers and programmers | 1 | 423 |
| 41200 University professors and lecturers | 1 | 246 | 62020 Food service supervisors | 2 | 581 | 21222 Information systems specialists | 1 | 396 |
| 00015 Senior managers - construction, transportation, production and utilities | 0 | 242 | 21230 Computer systems developers and programmers | 1 | 518 | 00012 Senior managers - financial, communications and other business services | 0 | 370 |
| 20012 Computer and information systems managers | 0 | 162 | 20012 Computer and information systems managers | 0 | 433 | 63200 Cooks | 3 | 353 |
| 00014 Senior managers - trade, broadcasting and other services | 0 | 148 | 00015 Senior managers - construction, transportation, production and utilities | 0 | 356 | 13110 Administrative assistants | 3 | 261 |
| 62020 Food service supervisors | 2 | 145 | 73300 Transport truck drivers | 3 | 325 | 41200 University professors and lecturers | 1 | 246 |
| 21223 Database analysts and data administrators | 1 | 98 | 41200 University professors and lecturers | 1 | 292 | 00015 Senior managers - construction, transportation, production and utilities | 0 | 209 |
| 63200 Cooks | 3 | 87 | 63200 Cooks | 3 | 268 | 60030 Restaurant and food service managers | 0 | 200 |
| 62010 Retail sales supervisors | 2 | 66 | 00014 Senior managers - trade, broadcasting and other services | 0 | 226 | 00014 Senior managers - trade, broadcasting and other services | 0 | 197 |
| 52120 Graphic designers and illustrators | 2 | 57 | 62010 Retail sales supervisors | 2 | 210 | 73300 Transport truck drivers | 3 | 182 |
| 31100 Specialists in clinical and laboratory medicine | 1 | 53 | 21221 Business systems specialists | 1 | 174 | 21230 Computer systems developers and programmers | 1 | 176 |
| 21234 Web developers and programmers | 1 | 52 | 13100 Administrative officers | 3 | 169 | 20012 Computer and information systems managers | 0 | 166 |
| Other | 1,553 | Other | 4,252 | Other | 4,688 | |||
| Total | 4,744 | Total | 11,536 | Total | 10,062 |
Source: MBR_FACT_EE_ITA as of February 03, 2025
Data is operational and as such should be considered preliminary and subject to change.
TEER Definition
TEER 0: Management occupations examples - Advertising, marketing and public relations managers, financial managers
TEER 1: Occupations that usually require a university degree, examples - Financial advisors, Software engineers
TEER 2: Occupations that usually require a college diploma, including occupations that require apprenticeship training of 2 or more years, or supervisory occupations
TEER 3: Occupations that usually require, a college diploma, including occupations that require apprenticeship training of less than 2 years, or more than 6 months of on-the-job
| Primary Occupation with assigned arranged employment point | TEER | 2022 # | Primary Occupation with assigned arranged employment point | TEER | 2023 # | Primary Occupation with assigned arranged employment point | TEER | 2024 # |
|---|---|---|---|---|---|---|---|---|
| 62020 Food service supervisors | 2 | 230 | 62020 Food service supervisors | 2 | 896 | 62020 Food service supervisors | 2 | 1,663 |
| 21231 Software engineers and designers | 1 | 166 | 13110 Administrative assistants | 3 | 431 | 13110 Administrative assistants | 3 | 731 |
| 41200 University professors and lecturers | 1 | 161 | 21231 Software engineers and designers | 1 | 387 | 13100 Administrative officers | 3 | 444 |
| 21222 Information systems specialists | 1 | 111 | 13100 Administrative officers | 3 | 261 | 62010 Retail sales supervisors | 2 | 347 |
| 13100 Administrative officers | 3 | 106 | 41200 University professors and lecturers | 1 | 233 | 12200 Accounting technicians and bookkeepers | 2 | 276 |
| 00012 Senior managers - financial, communications and other business services | 0 | 104 | 21222 Information systems specialists | 1 | 226 | 63200 Cooks | 3 | 254 |
| 13200 Customs, ship and other brokers | 3 | 104 | 21232 Software developers and programmers | 1 | 220 | 60030 Restaurant and food service managers | 0 | 248 |
| 21230 Computer systems developers and programmers | 1 | 83 | 12200 Accounting technicians and bookkeepers | 2 | 180 | 21231 Software engineers and designers | 1 | 246 |
| 12200 Accounting technicians and bookkeepers | 2 | 81 | 63200 Cooks | 3 | 152 | 41200 University professors and lecturers | 1 | 185 |
| 00015 Senior managers - construction, transportation, production and utilities | 0 | 63 | 00012 Senior managers - financial, communications and other business services | 0 | 148 | 21222 Information systems specialists | 1 | 160 |
| 63200 Cooks | 3 | 63 | 21230 Computer systems developers and programmers | 1 | 148 | 21232 Software developers and programmers | 1 | 155 |
| 00014 Senior managers - trade, broadcasting and other services | 0 | 58 | 62010 Retail sales supervisors | 2 | 129 | 33102 Nurse aides, orderlies and patient service associates | 3 | 153 |
| 11201 Professional occupations in business management consulting | 1 | 48 | 00014 Senior managers - trade, broadcasting and other services | 0 | 124 | 42202 Early childhood educators and assistants | 2 | 148 |
| 11202 Professional occupations in advertising, marketing and public relations | 1 | 44 | 00015 Senior managers - construction, transportation, production and utilities | 0 | 120 | 11202 Professional occupations in advertising, marketing and public relations | 1 | 141 |
| 20012 Computer and information systems managers | 0 | 44 | 60030 Restaurant and food service managers | 0 | 113 | 00012 Senior managers - financial, communications and other business services | 0 | 113 |
| Other | 1,140 | Other | 2,575 | Other | 3,377 | |||
| Total | 2,606 | Total | 6,343 | Total | 8,641 |
Source: MBR_FACT_EE_ITA as of February 03, 2025
Data is operational and as such should be considered preliminary and subject to change.
TEER Definition
TEER 0: Management occupations examples - Advertising, marketing and public relations managers, financial managers
TEER 1: Occupations that usually require a university degree, examples - Financial advisors, Software engineers
TEER 2: Occupations that usually require a college diploma, including occupations that require apprenticeship training of 2 or more years, or supervisory occupations
TEER 3: Occupations that usually require, a college diploma, including occupations that require apprenticeship training of less than 2 years, or more than 6 months of on-the-job training
Table 14 shows that the three most common countries of residence among candidates who received an ITA changed slightly from 2022 to 2024. While Canada has consistently been the top country of residence of candidates who receive an ITA, 69% in 2024 similar to 2023. Over the same period, the proportion of invited candidates who indicated India as their country of residence decreased slightly from 7% in 2023 to 3% in 2024. While Cameroon took the top share in 2024 and rose from 3% of ITAs in 2023 to 9% of ITAs in 2024. Nigeria remained among the top three most common countries of residence in 2024 with 3% of ITAs, similar to year 2023.
| Country of residence | 2022 # | Country of residence | 2023 # | Country of residence | 2024 # |
|---|---|---|---|---|---|
| Canada | 31,661 | Canada | 76,946 | Canada | 67,817 |
| India | 3,724 | India | 7,401 | Federal Republic of Cameroon | 8,999 |
| Nigeria | 1,706 | Federal Republic of Cameroon | 3,815 | India | 3,104 |
| Federal Republic of Cameroon | 1,057 | Nigeria | 3,766 | Nigeria | 3,088 |
| United States of America | 890 | United States of America | 2,597 | Morocco | 1,770 |
| Morocco | 784 | Morocco | 1,675 | Algeria | 1,621 |
| United Arab Emirates | 669 | Algeria | 1,349 | United Kingdom and Overseas Territories | 1,139 |
| Lebanon | 555 | Pakistan | 1,162 | United States of America | 991 |
| Algeria | 549 | United Kingdom and Overseas Territories | 1,151 | Republic of Ivory Coast | 982 |
| United Kingdom and Overseas Territories | 366 | United Arab Emirates | 1,041 | France | 819 |
| Other | 4,578 | Other | 9,363 | Other | 8,573 |
| Total | 46,539 | Total | 110,266 | Total | 98,903 |
Source: MBR_FACT_EE_ITA as of February 03, 2025
Data is operational and as such should be considered preliminary and subject to change.
As displayed in Tables 14b and 14c, the most common countries of residence varied slightly for both men and women in 2023 and 2024. While Canada and Cameroon were the top two common countries of residence for both genders, the top third common country was India for men and Nigeria for women. In 2024, the Republic of Ivory Coast and France were among the top countries of residence of candidates who received an invitation to apply. In 2024, a smaller proportion of women (65%) than men (72%) indicated Canada as their country of residence.
| Country of residence | 2022 # | Country of residence | 2023 # | Country of residence | 2024 # |
|---|---|---|---|---|---|
| Canada | 19,633 | Canada | 46,810 | Canada | 37,751 |
| India | 1,973 | India | 3,450 | Federal Republic of Cameroon | 4,383 |
| Nigeria | 684 | Federal Republic of Cameroon | 1,781 | India | 1,402 |
| United States of America | 530 | United States of America | 1,473 | Nigeria | 1,063 |
| Federal Republic of Cameroon | 478 | Nigeria | 1,365 | Morocco | 891 |
| Morocco | 368 | Morocco | 831 | Algeria | 769 |
| United Arab Emirates | 328 | Algeria | 638 | Republic of Ivory Coast | 574 |
| Algeria | 240 | Pakistan | 560 | United States of America | 516 |
| Pakistan | 202 | United Arab Emirates | 524 | United Kingdom and Overseas Territories | 476 |
| France | 199 | United Kingdom and Overseas Territories | 507 | France | 471 |
| Other | 2,459 | Other | 4,696 | Other | 4,140 |
| Total | 27,094 | Total | 62,635 | Total | 52,436 |
Source: MBR_FACT_EE_ITA as of February 03, 2025
Data is operational and as such should be considered preliminary and subject to change.
| Country of residence | 2022 # | Country of residence | 2023 # | Country of residence | 2024 # |
|---|---|---|---|---|---|
| Canada | 12,028 | Canada | 30,131 | Canada | 30,056 |
| India | 1,751 | India | 3,950 | Federal Republic of Cameroon | 4,616 |
| Nigeria | 1022 | Nigeria | 2,400 | Nigeria | 2,024 |
| Federal Republic of Cameroon | 579 | Federal Republic of Cameroon | 2,034 | India | 1,702 |
| Morocco | 416 | United States of America | 1,124 | Morocco | 879 |
| Lebanon | 360 | Morocco | 844 | Algeria | 852 |
| United States of America | 360 | Algeria | 711 | United Kingdom and Overseas Territories | 663 |
| United Arab Emirates | 341 | United Kingdom and Overseas Territories | 644 | Pakistan | 559 |
| Algeria | 309 | Pakistan | 602 | United States of America | 475 |
| United Kingdom and Overseas Territories | 195 | United Arab Emirates | 517 | Republic of Ivory Coast | 408 |
| Other | 2,083 | Other | 4,667 | Other | 4,222 |
| Total | 19,444 | Total | 47,624 | Total | 46,456 |
Source: MBR_FACT_EE_ITA as of February 03, 2025
Data is operational and as such should be considered preliminary and subject to change.
As displayed in Table 15a, the top five countries of citizenship among candidates who received an ITA was relatively similar to 2023, with the Philippines making it in the top 5 in 2024. While India remained the most common country of citizenship by a significant margin, the margin decreased slightly in 2024 (43%) compared to 2023 (47%). India, Cameroon, and Nigeria were in the top three countries of citizenship in 2024.
Looking at the top 10 most common countries of citizenship among candidates who received an ITA, notable changes from 2023 to 2024 include:
- Philippines moved up from sixth to fifth most common country of citizenship; France made it among the top 10 from 2023 to 2024;
- Brazil no longer featured in the top 10 and Algeria moved up from tenth to seventh in 2024; Morocco moved up from eighth to sixth in 2024. and,
- Pakistan dropped from seventh to ninth most common country of citizenship from 2023 to 2024.
- From 2022 to 2023, the proportion of citizenships outside the top 10 (i.e. “Other” in Table 15a) decreased slightly from 24% in 2023 to 23% in 2024.
| Country of citizenship | 2022 # | Country of citizenship | 2023 # | Country of citizenship | 2024 # |
|---|---|---|---|---|---|
| India | 20,801 | India | 52,411 | India | 43,004 |
| Nigeria | 2,917 | Nigeria | 7,296 | Federal Republic of Cameroon | 10,141 |
| People's Republic of China | 2,467 | People's Republic of China | 5,897 | Nigeria | 6,696 |
| Federal Republic of Cameroon | 1,218 | Federal Republic of Cameroon | 4,339 | People's Republic of China | 3,689 |
| Iran | 1,214 | Iran | 2,728 | Philippines | 2,561 |
| France | 1,081 | Philippines | 2,614 | Morocco | 2,227 |
| Morocco | 974 | Pakistan | 2,564 | Algeria | 1,989 |
| United States of America | 959 | Morocco | 2,043 | Iran | 1,982 |
| Philippines | 934 | Brazil | 1,811 | Pakistan | 1,785 |
| Pakistan | 923 | Algeria | 1,592 | France | 1,701 |
| Other | 13,051 | Other | 26,971 | Other | 23,128 |
| Total | 46,539 | Total | 110,266 | Total | 98,903 |
Source: MBR_FACT_EE_ITA as of February 03, 2025
Data is operational and as such should be considered preliminary and subject to change.
Tables 15b and 15c display the gender breakdown by most common country of citizenship among candidates who received ITAs. The tables show that India, Cameroon, and Nigeria were the most common countries of citizenship for both men and women who were invited to apply for permanent residence in 2024. Men with Indian citizenship (47%) continued to have a greater proportion of ITAs then women (39%). Women with Cameroonian citizenship (11%) and Nigerian citizenship (9%) had a slightly larger proportion of ITAs issued than men with Cameroonian (10%) and Nigerian (5%) citizenship. There were slight differences in the top 10 countries amongst men and women in 2024. For example, the Philippines came in fifth place for women but ninth place for men. However, there were many similarities among the top countries.
| Country of citizenship | 2022 # | Country of citizenship | 2023 # | Country of citizenship | 2024 # |
|---|---|---|---|---|---|
| India | 13,348 | India | 32,627 | India | 24,839 |
| Nigeria | 1,278 | Nigeria | 2,990 | Federal Republic of Cameroon | 5,060 |
| People's Republic of China | 1,226 | People's Republic of China | 2,831 | Nigeria | 2,590 |
| Iran | 716 | Federal Republic of Cameroon | 2,096 | People's Republic of China | 1,704 |
| Pakistan | 632 | Pakistan | 1,591 | Morocco | 1,145 |
| France | 565 | Iran | 1,468 | Iran | 1,010 |
| Federal Republic of Cameroon | 562 | Brazil | 1,113 | Algeria | 977 |
| United Kingdom and Overseas Territories | 547 | Philippines | 1,066 | Pakistan | 940 |
| Brazil | 543 | Morocco | 1,041 | Philippines | 881 |
| United States of America | 536 | United Kingdom and Overseas Territories | 946 | France | 855 |
| Other | 7,141 | Other | 14,866 | Other | 12,435 |
| Total | 27,094 | Total | 62,635 | Total | 52,436 |
Source: MBR_FACT_EE_ITA as of February 03, 2024
Data is operational and as such should be considered preliminary and subject to change.
| Country of citizenship | 2022 # | Country of citizenship | 2023 # | Country of citizenship | 2024 # |
|---|---|---|---|---|---|
| India | 7,453 | India | 19,780 | India | 18,159 |
| Nigeria | 1,639 | Nigeria | 4,305 | Federal Republic of Cameroon | 5,081 |
| People's Republic of China | 1,241 | People's Republic of China | 3,066 | Nigeria | 4,105 |
| Federal Republic of Cameroon | 656 | Federal Republic of Cameroon | 2,243 | People's Republic of China | 1,985 |
| Philippines | 540 | Philippines | 1,547 | Philippines | 1,680 |
| France | 515 | Iran | 1,260 | Morocco | 1,082 |
| Lebanon | 507 | Morocco | 1,002 | Algeria | 1,012 |
| Iran | 498 | Pakistan | 973 | Iran | 972 |
| Morocco | 498 | Algeria | 821 | France | 845 |
| United States of America | 423 | France | 746 | Pakistan | 845 |
| Other | 5,474 | Other | 11,881 | Other | 10,690 |
| Total | 19,444 | Total | 47,624 | Total | 46,456 |
Source: MBR_FACT_EE_ITA as of February 03, 2025
Data is operational and as such should be considered preliminary and subject to change.
Who was eligible for category-based selection categories among the eligible profiles submitted to Express Entry?
As seen in Table 16, there were 339,621 eligible profiles submitted to Express Entry in 2024.
Table 16a and 16b display the number and percentages of eligible profiles submitted by candidates who qualify for CBS criteria, disaggregated by gender and age. As seen in Table 16a, there were 153,069 individuals, representing 45% of all eligible profiles submitted, who qualified for CBS criteria. Among the eligible profiles submitted to Express Entry, 19% qualified for the STEM category, 9% qualified for the French-language proficiency category, around 10% qualified for the healthcare category, 3% for the transport category, 4% for the trade category, and around 1% for the agriculture category. It is important to note that there are overlaps in the number of profiles eligible to more than one category.
While the proportion of men (9%) and women (9%) who qualified for French-language proficiency and the agriculture category (1% for men and 1% for women) were the same, the proportion of men qualifying for the STEM (24%), trades (6%), and transport (5%) categories was higher than the proportion of women (12%, 1%, and 1%, respectively).. On the other hand, a higher proportion of women (14%) qualified for the healthcare category compared to men (5%)).
| CBS Category | Men # | Men % | Women # | Women % | Total |
|---|---|---|---|---|---|
| CBS Agriculture | 1,946 | 1% | 2,069 | 1% | 4,015 |
| CBS French Speakers | 15,593 | 9% | 15,133 | 9% | 30,726 |
| CBS Health Care | 9,046 | 5% | 23,283 | 14% | 32,329 |
| CBS STEM | 43,271 | 24% | 20,041 | 12% | 63,312 |
| CBS Trade | 10,638 | 6% | 2,389 | 1% | 13,027 |
| CBS Transport | 8,062 | 5% | 1,598 | 1% | 9,660 |
| CBS Total | 88,556 | 64,513 | 153,069 | ||
| Grand TotalTable footnote * (CBS+Other) |
178,370 | 100% | 161,172 | 100% | 339,621 |
Source: MBR_FACT_EE_MAIN_CBS as of February 03, 2025
Data is operational and as such should be considered preliminary and subject to change.
As seen in Table 16b, the highest demographic share for category eligibility was seen in those who were aged between 20-29, followed by those aged between 30-34. This was a common trend across all categories. Similarly, the share of those in the age groups 20-29 was substantially higher ranging from 36% for French-language to a share of 69% for the trades category relative to other age groups. The age group 30-34 years of age came in second place ranging from 18% in trade to 30% in French-language proficiency.
| Age group | CBS Agriculture | CBS French Speaker | CBS Health Care | CBS STEM | CBS Trade | CBS Transport | ||||||
|---|---|---|---|---|---|---|---|---|---|---|---|---|
| # | % | # | % | # | % | # | % | # | % | # | % | |
| <20 | 1 | <1% | 10 | <1% | 9 | <1% | 3 | <1% | 2 | <1% | 1 | <1% |
| 20-29 | 1,740 | 43% | 11,214 | 36% | 13,977 | 43% | 27,873 | 44% | 8,952 | 69% | 5,905 | 61% |
| 30-34 | 1,177 | 29% | 9,260 | 30% | 9,473 | 29% | 18,533 | 29% | 2,285 | 18% | 1,953 | 20% |
| 35-39 | 734 | 18% | 6,731 | 22% | 5,888 | 18% | 10,493 | 17% | 1,033 | 8% | 1026 | 11% |
| 40-44 | 271 | 7% | 2,589 | 8% | 2,114 | 7% | 4,883 | 8% | 473 | 4% | 508 | 5% |
| 45+ | 90 | 2% | 921 | 3% | 869 | 3% | 1,532 | 2% | 267 | 2% | 256 | 3% |
| Unspecified | 3 | <1% | 4 | <1% | 8 | <1% | 14 | <1% | 17 | <1% | 11 | <1% |
| Total | 4,016 | 100% | 30,729 | 100% | 32,338 | 100% | 63,331 | 100% | 13,029 | 100% | 9,660 | 100% |
Source: MBR_FACT_EE_MAIN_CBS as of February 03, 2025
Data is operational and as such should be considered preliminary and subject to change.
Who in the pool qualified for category-based selection in Express Entry?
Table 17a and Table 17b display the number and percentages of male and female candidates in the pool who qualified for CBS criteria. As seen in Table 17a, there were a total of 87,341 candidates in the pool who qualified for CBS criteria. A higher proportion of men candidates in the pool qualified for the STEM category (25% for men and 13% for women), the trades category (5% for men and 1% for women) and the transport category (4% for men and <1% for women). On the other hand, a higher proportion of women in the pool qualified for the French-language proficiency category (4% for women and 3% for men), healthcare category (6% for women and 1% for men) and agriculture category (2% for women and 1% for men). It is important to note here that there are overlaps in the number of profiles eligible to more than one category.
| CBS Category | Men # | Men % | Women # | Women % | Total |
|---|---|---|---|---|---|
| CBS Agriculture | 1,528 | 1% | 1,596 | 2% | 3,124 |
| CBS French Speakers | 4,981 | 4% | 4,875 | 5% | 9,856 |
| CBS Health Care | 4,601 | 4% | 12,465 | 12% | 17,066 |
| CBS STEM | 28,433 | 25% | 13,447 | 13% | 41,880 |
| CBS Trade | 6,287 | 5% | 1,455 | 1% | 7,742 |
| CBS Transport | 6,442 | 6% | 1,231 | 1% | 7,673 |
| CBS Total | 52,272 | 35,069 | 87,341 | ||
| All Candidates in the PoolTable footnote * | 114,587 | 100% | 103,672 | 100% | 218,291 |
Source: MBR_FACT_EE_MAIN_CBS as of February 03, 2025
Data is operational and as such should be considered preliminary and subject to change.
In regard to the age groups, a majority of candidates who qualify for CBS criteria were between 20-34 years of age, with a greater proportion of those being between 20-29 years of age. The proportion of candidates between 20-29 was disproportionally high in the trade (68%) and transport (61%) categories, compared to other categories (37%-43%). It is important to note that there are overlaps in the number of profiles eligible to more than one category.
| Age Group | CBS Agriculture | CBS French Speaker | CBS Health Care | CBS STEM | CBS Trade | CBS Transport | ||||||
|---|---|---|---|---|---|---|---|---|---|---|---|---|
| # | % | # | % | # | % | # | % | # | % | # | % | |
| <20 | 1 | <1% | 3 | <1% | 3 | <1% | 1 | <1% | 1 | <1% | 1 | <1% |
| 20-29 | 1,330 | 43% | 2,822 | 29% | 6,392 | 37% | 16,247 | 39% | 5,274 | 68% | 4,672 | 61% |
| 30-34 | 903 | 29% | 2,795 | 28% | 4,944 | 29% | 12,758 | 30% | 1,266 | 16% | 1,583 | 21% |
| 35-39 | 564 | 18% | 2,666 | 27% | 3,726 | 22% | 7,753 | 19% | 641 | 8% | 787 | 10% |
| 40-44 | 237 | 8% | 1,194 | 12% | 1,417 | 8% | 3,870 | 9% | 340 | 4% | 415 | 5% |
| 45+ | 90 | 3% | 377 | 4% | 587 | 3% | 1,256 | 3% | 218 | 3% | 215 | 3% |
| Unspecified | 2 | <1% | ||||||||||
| Total | 3,125 | 100% | 9,857 | 100% | 17,069 | 100% | 41,885 | 100% | 7,742 | 100% | 7,673 | 100% |
Source: MBR_FACT_EE_MAIN_CBS as of February 03, 2025
Data is operational and as such should be considered preliminary and subject to change.
Who was invited to apply for permanent residence through category-based selection in Express Entry?
There were a total of 42,475 candidates invited to apply for permanent residence through category-based selection rounds in 2024. Note that category eligible candidates can be invited in multiple round types, hence disaggregate reporting by category exceeds the total number of ITAs (42, 475) due to overlapping categories. For example, a candidate can meet the agriculture category and be a French-speaker.
In regard to the age groups, across all categories, except for French-language proficiency category, the highest proportion of category eligibility among eligible profiles was seen in those who were aged between 20-29 years of age, followed by those between 30-34 years old. For STEM category, the share of age groups between 20-29 years of age where disproportionately higher at 69% and 64% respectively. This is followed by STEM at 51% and Healthcare at 48% and Agriculture at 42%. The french-language proficiency category had the highest share of candidates aged between 30-34 at 63%.
| Age Group | CBS Agriculture | CBS French Speaker | CBS Health Care | CBS STEM | CBS Trade | CBS Transport | ||||||
|---|---|---|---|---|---|---|---|---|---|---|---|---|
| # | % | # | % | # | % | # | % | # | % | # | % | |
| <20 | 1 | <1% | ||||||||||
| 20-29 | 159 | 42% | 9,162 | 37% | 7,309 | 48% | 10,310 | 51% | 3,590 | 69% | 1,168 | 64% |
| 30-34 | 117 | 31% | 15,455 | 63% | 4,150 | 27% | 5,960 | 29% | 843 | 16% | 344 | 19% |
| 35-39 | 53 | 14% | 5,843 | 24% | 1,745 | 12% | 2,704 | 13% | 275 | 5% | 124 | 7% |
| 40-44 | 18 | 5% | 2,415 | 10% | 668 | 4% | 1,004 | 5% | 128 | 2% | 76 | 4% |
| 45+ | 10 | 3% | 742 | 3% | 263 | 2% | 342 | 2% | 60 | 1% | 32 | 2% |
| Unspecified | 1 | <1% | ||||||||||
| Total | 378 | 100% | 24,686 | 100% | 15,164 | 100% | 20,320 | 100% | 5,176 | 100% | 1,834 | 100% |
Source: MBR_FACT_EE_ITA_CBS as of February 03, 2025
Data is operational and as such should be considered preliminary and subject to change.
Data includes PNP
As seen in Table 18b, men received a higher proportion of ITAs than women for the STEM category (27% for men and 13% for women), the trades category (8% for men and 2% for women) and the transport category (3% for men and 1% for women). On the other hand, women received a higher proportion of ITAs than men for the healthcare category (8% for men and 23% for women). While both genders received an equal proportion of ITAs for agriculture category (<1%), women received a slightly higher proportion of ITAs under the French-language proficiency category (24% for men and 26% for women). Overall, women received nearly 46% share of ITAs who qualify for CBS relative to men at 54%.
| ITA Category | Men # | Men % | Women # | Women % |
|---|---|---|---|---|
| CBS Agriculture | 183 | <1% | 195 | <1% |
| CBS French Speakers | 12,443 | 24% | 12,242 | 26% |
| CBS Health Care | 4,273 | 8% | 10,890 | 23% |
| CBS STEM | 14,142 | 27% | 6,172 | 13% |
| CBS Trade | 4,224 | 8% | 951 | 2% |
| CBS Transport | 1,547 | 3% | 287 | 1% |
| CBS Total | 36,812 | 30,737 | ||
| Grand TotalTable footnote * (CBS+Other Rounds) |
52,436 | 100% | 46,456 | 100% |
Source: MBR_FACT_EE_ITA_CBS as of February 03, 2025
Data is operational and as such should be considered preliminary and subject to change.
Table 19a demonstrates the number of ITAs issued to candidates by program who qualify for CBS categories in 2024, but did not necessarily get invited through a CBS invitation round. In other words, candidates could be invited through general or program specific rounds. Accordingly, for the agriculture and agri-food category, a great portion of the candidates received an ITA through FSWP (65%) followed by CEC (27%), PNP (8%) and FSTP (<1%). A similar trend was also seen for French-language proficiency as a significant portion of the candidates received an ITA through FSWP (84%), followed by CEC (14%), PNP (2%) and FSTP (1%) and healthcare category as a great portion of candidates received an ITA through FSWP (41%), followed by CEC (38%), and PNP (21%). On the other hand, a significant portion of candidates who received ITAs under CEC were eligible for the STEM, trade, and transport categories;. 49% of the ITAs were issued to candidates who qualified for CEC, followed by 32% for PNP, and 19% for FSWP. For the transport category, a great portion of the candidates received ITAs through CEC (51%), followed by FSWP (22%), PNP (27%) and FSTP (<1%). Lastly, similar trend was seen for the trades category as 64% of the candidates received ITAs through CEC, followed by PNP (25%), FSWP (11%) and FSTP (<1%).
| Program | CBS Agriculture | CBS French Speaker | CBS Health Care | CBS STEM | CBS Trade | CBS Transport | Total | ||||||
|---|---|---|---|---|---|---|---|---|---|---|---|---|---|
| # | % | # | % | # | % | # | % | # | % | # | % | ||
| Canadian Experience Class | 101 | 27% | 3,450 | 14% | 5,800 | 38% | 10,016 | 49% | 3,303 | 64% | 944 | 51% | 47,749 |
| Provincial/Territorial Nominees | 30 | 8% | 383 | 2% | 3,188 | 21% | 6,523 | 32% | 1,289 | 25% | 492 | 27% | 24,038 |
| Federal Skilled Workers | 246 | 65% | 20,850 | 84% | 6,176 | 41% | 3,781 | 19% | 582 | 11% | 396 | 22% | 27,110 |
| Skilled Trades | 1 | <1% | 3 | <1% | 2 | <1% | 2 | <1% | 6 | ||||
| Total | 378 | 100% | 24,686 | 100% | 15,164 | 100% | 20,320 | 100% | 5,176 | 100% | 1,834 | 100% | 98,903 |
Source: MBR_FACT_EE_ITA_CBS as of February 03, 2025
Data is operational and as such should be considered preliminary and subject to change.
In 2024 there were 98,903 invitations to apply issued through Express Entry. Of those, 42,475 ITAs were issued to candidates who qualified for CBS categories, of these, 14,445 ITAs were issued to candidates through general rounds and 15,483 ITAs were issued to candidates through PNP rounds (Table 19b). A significant portion of the ITAs were issued through CBS rounds (43%) followed by CEC rounds (27%) to facilitate francophone immigration targets, address long-term labour market shortages, and support the transition of temporary residents in Canada to permanent residence.
| CBS and Other Round Type | # of Rounds | 2024 |
|---|---|---|
| CBS Healthcare | 3 | 10,250 |
| CBS STEM | 1 | 4,500 |
| CBS Fr Speakers | 11 | 23,000 |
| CBS Agriculture | 1 | 150 |
| CBS Trades | 2 | 3,600 |
| CBS Transport | 1 | 975 |
| Total CBS Rounds | 19 | 42,475 |
| General | 9 | 14,445 |
| Canadian Experience Class | 10 | 26,500 |
| PNP | 14 | 15,483 |
| Total (General, CEC and PNP) | 56,428 | |
| Grand Total (General, CEC, PNP and CBS) | 52 | 98,903 |
Source: MBR_FACT_EE_ITA_CBS as of February 03, 2025
Data is operational and as such should be considered preliminary and subject to change.
Table 19c captures the Department’s 2024 ITA targets for category-based selection and its progress against the targets, along with the average total CRS points for CBS ITA rounds. Candidates contribute to a category target as long as they meet the category criteria, regardless of which round type they were invited under to apply for permanent residence. Some candidates may qualify for more than one category if they meet the criteria of each category. Hence, total ITA’s would be inflated in table 19c due to double-counting in categories where candidates qualify for more than one category. This would also affect country of residence. Furthermore, PNP ITA counts are also excluded from being counted towards CBS targets.
In 2024, the Department had varying ITA targets for each category, which included 30% for French-language proficiency, 25% for STEM, 11% for healthcare, 5% for trades, 3% for transport, and 0.5% for agriculture and agri-food categories. As seen in the table (19c), the Department achieved its 2024 ITA targets for all categories, with the exception of transport that was slightly below target. Targets for the French-language proficiency, healthcare, trades, and agriculture categories were surpassed. The average total CRS points for CBS ITA rounds ranged from 450 to 500.
| CBS Category | Avg Total CRS Points | ITA’s IssuedTable footnote * | % of All FHS ITAs | 2024 Target |
|---|---|---|---|---|
| CBS Agriculture | 464 | 348 | 1% | 0.50% |
| CBS French-speakers | 450 | 24,303 | 44% | 30% |
| CBS Healthcare | 468 | 11,976 | 22% | 11% |
| CBS STEM | 500 | 13,797 | 25% | 25% |
| CBS Trades | 461 | 3,887 | 7% | 5% |
| CBS Transport | 465 | 1,342 | 2% | 3% |
Source: MBR_FACT_EE_ITA_CBS as of February 03, 2025
Data is operational and as such should be considered preliminary and subject to change.
As displayed in Table 20a, the top 10 most common countries of citizenship slightly varied in ranking across the categories. However, India was the most common country of citizenship by a significant margin for all categories, except for agriculture where it was surpassed by Nigeria. Nigeria remained among the top most common countries of citizenship for five categories; agriculture, healthcare, STEM, trade, and transport. For the agriculture and agri-food category, the top three countries of citizenship were Nigeria (38%), Cameroon (18%), and India (18%). Similarly, India and Nigeria were among the top two most common country of citizenship for trade, transport, and healthcare. For STEM category, the top three countries of citizenship included India (48%), China (7%) and Cameroon (7%). For the trades and transport category, India was the most common country of citizenship by a significant margin: 73% for trades and 66% for transport.
For the French-language proficiency category, the top 10 most common countries of citizenship were represented by countries where there is a common use of the French language. The top three most common countries of citizenship for this category included the Federal Republic of Cameroon (41%), Morocco (9%) and Algeria (8%).
| Top 10 COCs | CBS Agriculture | Top 10 COCs | CBS Fr Speaker | Top 10 COCs | CBS Health Care | |||
|---|---|---|---|---|---|---|---|---|
| # | % | # | % | # | % | |||
| Nigeria | 142 | 38% | Federal Republic of Cameroon | 10,049 | 41% | India | 5,101 | 34% |
| Federal Republic of Cameroon | 67 | 18% | Morocco | 2,204 | 9% | Nigeria | 3,194 | 21% |
| India | 67 | 18% | Algeria | 1,971 | 8% | Philippines | 941 | 6% |
| Pakistan | 16 | 4% | France | 1,670 | 7% | Federal Republic of Cameroon | 911 | 6% |
| Mexico | 9 | 2% | Republic of Ivory Coast | 1,129 | 5% | Pakistan | 712 | 5% |
| Bangladesh | 6 | 2% | Mauritius | 805 | 3% | Iran | 360 | 2% |
| Iran | 6 | 2% | Tunisia | 668 | 3% | United Kingdom and Overseas Territories | 337 | 2% |
| People's Republic of China | 4 | 1% | India | 463 | 2% | People's Republic of China | 283 | 2% |
| France | 4 | 1% | Congo, Democratic Republic of the | 447 | 2% | Ghana | 192 | 1% |
| Philippines | 4 | 1% | Lebanon | 385 | 2% | United States of America | 166 | 1% |
| Other | 53 | 14% | Other | 4,895 | 20% | Other | 2,967 | 20% |
| Total | 378 | 100% | Total | 24,686 | 100% | Total | 15,164 | 100% |
| Top 10 COCs | CBS STEM | Top 10 COCs | CBS Trade | Top 10 COCs | CBS Transport | |||
|---|---|---|---|---|---|---|---|---|
| # | % | # | % | # | % | |||
| India | 9,765 | 48% | India | 3,795 | 73% | India | 1,210 | 66% |
| People's Republic of China | 1,340 | 7% | Nigeria | 312 | 6% | Nigeria | 195 | 11% |
| Federal Republic of Cameroon | 1,334 | 7% | Federal Republic of Cameroon | 130 | 3% | Pakistan | 43 | 2% |
| Nigeria | 1,043 | 5% | People's Republic of China | 127 | 2% | Federal Republic of Cameroon | 36 | 2% |
| Iran | 506 | 2% | Iran | 98 | 2% | Ukraine | 31 | 2% |
| Pakistan | 443 | 2% | Philippines | 92 | 2% | France | 29 | 2% |
| Morocco | 384 | 2% | Republic of Ireland | 48 | 1% | Iran | 21 | 1% |
| France | 333 | 2% | Brazil | 48 | 1% | People's Republic of China | 20 | 1% |
| Algeria | 332 | 2% | Mexico | 43 | 1% | Morocco | 20 | 1% |
| Brazil | 325 | 2% | United Kingdom and Overseas Territories | 35 | 1% | Korea, Republic of | 15 | 1% |
| Other | 4,515 | 22% | Other | 448 | 9% | Other | 214 | 12% |
| Total | 20,320 | 100% | Total | 5,176 | 100% | Total | 1,834 | 100% |
Source: MBR_FACT_EE_ITA_CBS as of February 03, 2025
Data is operational and as such should be considered preliminary and subject to change.
Data includes PNP
As seen in Table 20b, the top 10 most common countries of residence varied across the categories. Nevertheless, Canada was the most common country of residence by a significant margin for all categories, except for the French-language proficiency rounds where Cameroon was the most common country of residence
| Top 10 CORs | CBS Agriculture | Top 10 CORs | CBS Fr Speaker | Top 10 CORs | CBS Health Care | |||
|---|---|---|---|---|---|---|---|---|
| # | % | # | % | # | % | |||
| Canada | 151 | 40% | Federal Republic of Cameroon | 8,963 | 36% | Canada | 8,016 | 53% |
| Nigeria | 110 | 29% | Canada | 4,757 | 19% | Nigeria | 1,758 | 12% |
| Federal Republic of Cameroon | 65 | 17% | Morocco | 1,769 | 7% | India | 1137 | 7% |
| Pakistan | 11 | 3% | Algeria | 1,619 | 7% | United Kingdom and Overseas Territories | 818 | 5% |
| India | 10 | 3% | Republic of Ivory Coast | 982 | 4% | Federal Republic of Cameroon | 808 | 5% |
| United Kingdom and Overseas Territories | 6 | 2% | France | 813 | 3% | Pakistan | 544 | 4% |
| Morocco | 4 | 1% | Mauritius | 559 | 2% | United States of America | 187 | 1% |
| United Arab Emirates | 3 | 1% | Tunisia | 404 | 2% | United Arab Emirates | 140 | 1% |
| United States of America | 3 | 1% | Nigeria | 283 | 1% | Iran | 140 | 1% |
| Congo, Democratic Republic of the | 2 | 1% | People's Republic of China | 266 | 1% | Algeria | 121 | 1% |
| Other | 13 | 3% | Other | 4,271 | 17% | Other | 1,495 | 10% |
| Total | 378 | 100% | Total | 24,686 | 100% | Total | 15,164 | 100% |
| Top 10 CORs | CBS STEM | Top 10 CORs | CBS Trade | Top 10 CORs | CBS Transport | |||
|---|---|---|---|---|---|---|---|---|
| # | % | # | % | # | % | |||
| Canada | 14,805 | 73% | Canada | 4,595 | 89% | Canada | 1,489 | 81% |
| Federal Republic of Cameroon | 1,156 | 6% | Nigeria | 216 | 4% | Nigeria | 135 | 7% |
| India | 794 | 4% | Federal Republic of Cameroon | 119 | 2% | India | 41 | 2% |
| United States of America | 569 | 3% | India | 99 | 2% | Pakistan | 31 | 2% |
| Nigeria | 370 | 2% | Iran | 23 | <1% | Federal Republic of Cameroon | 28 | 2% |
| Morocco | 295 | 1% | Pakistan | 19 | <1% | Morocco | 18 | 1% |
| France | 270 | 1% | United Kingdom and Overseas Territories | 13 | <1% | United Kingdom and Overseas Territories | 14 | 1% |
| Algeria | 268 | 1% | Algeria | 9 | <1% | Algeria | 12 | 1% |
| People's Republic of China | 176 | 1% | Burkina-Faso | 8 | <1% | Iran | 10 | 1% |
| United Kingdom and Overseas Territories | 144 | 1% | United Arab Emirates | 8 | <1% | France | 5 | <1% |
| Other | 1,473 | 7% | Other | 67 | 1% | Other | 51 | 3% |
| Total | 20,320 | 100% | Total | 5,176 | 100% | Total | 1,834 | 100% |
Source: MBR_FACT_EE_ITA_CBS as of February 03, 2025
Data is operational and as such should be considered preliminary and subject to change.
Data includes PNP
When considering the first official language proficiency of candidates who received an ITA and who qualified for CBS criteria in 2024 (Table 21), most candidates were at CLB/NCLC level of 9 (17,131 candidates) and CLB/NCLC level of 7 (16,259 candidates). STEM, healthcare and French-language proficiency categories had a higher level of proficiency in the first official language when compared to other CBS categories. French-language proficiency candidates had higher number of candidates being at CLB/NCLC level of 10, 9, and 8 in first official language proficiency than all other categories.
On the other hand, both trades and transport categories had the highest number of candidates who were at CLB/NCLC level of 7.
| CBS Category | CLB 4 | CLB 5 | CLB 6 | CLB 7 | CLB 8 | CLB 9 | CLB 10 |
|---|---|---|---|---|---|---|---|
| CBS Agriculture | 9 | 9 | 78 | 69 | 156 | 57 | |
| CBS French-speakers | 7 | 6 | 6,289 | 7,491 | 5,807 | 5,086 | |
| CBS Healthcare | 56 | 275 | 3,962 | 3,344 | 5,227 | 2,300 | |
| CBS STEM | 10 | 25 | 4,570 | 5,502 | 6,432 | 3,781 | |
| CBS Trades | 4 | 220 | 695 | 2,327 | 1,044 | 625 | 261 |
| CBS Transport | 1 | 90 | 239 | 651 | 321 | 399 | 133 |
| Total | 5 | 385 | 1,232 | 16,259 | 15,901 | 17,131 | 10,243 |
Source: MBR_FACT_EE_ITA_CBS as of February 03, 2025
Data is operational and as such should be considered preliminary and subject to change.
Although the order slightly varied, Ontario, British Columbia and Alberta were the most common provinces of intended destination among candidates who received an ITA and who qualified for the healthcare, STEM, trades, transportation, and agriculture and agri-food occupation categories (Table 22). For the French-language proficiency category, the top three provinces of intended destination were Ontario (61%), New Brunswick (12%) and Alberta (12%).
| Provinces and Territories | CBS Agriculture | CBS French Speaker | CBS Health Care | CBS STEM | CBS Trade | CBS Transport | ||||||
|---|---|---|---|---|---|---|---|---|---|---|---|---|
| # | % | # | % | # | % | # | % | # | % | # | % | |
| Newfoundland and Labrador | 1 | <1% | 89 | <1% | 47 | <1% | 65 | <1% | 2 | <1% | 6 | <1% |
| Prince Edward Island | 100 | <1% | 53 | <1% | 26 | <1% | 7 | <1% | 11 | 1% | ||
| Nova Scotia | 10 | 3% | 291 | 1% | 226 | 1% | 528 | 3% | 27 | 1% | 24 | 1% |
| New Brunswick | 13 | 3% | 3,047 | 12% | 389 | 3% | 608 | 3% | 28 | 1% | 41 | 2% |
| Ontario | 201 | 53% | 15,017 | 61% | 9,955 | 66% | 13,234 | 65% | 3,854 | 74% | 993 | 54% |
| Manitoba | 13 | 3% | 959 | 4% | 417 | 3% | 346 | 2% | 56 | 1% | 341 | 19% |
| Saskatchewan | 23 | 6% | 436 | 2% | 262 | 2% | 312 | 2% | 32 | 1% | 31 | 2% |
| Alberta | 71 | 19% | 2,985 | 12% | 2,197 | 14% | 2,007 | 10% | 277 | 5% | 176 | 10% |
| Northwest Territories | 31 | <1% | 4 | <1% | 9 | <1% | 1 | <1% | 5 | <1% | ||
| British Columbia | 45 | 12% | 1,598 | 6% | 1,590 | 10% | 3,151 | 16% | 884 | 17% | 199 | 11% |
| Yukon | 64 | <1% | 11 | <1% | 18 | <1% | 6 | <1% | 6 | <1% | ||
| Nunavut | 69 | <1% | 13 | <1% | 16 | <1% | 2 | <1% | 1 | <1% | ||
| Total | 378 | 100% | 24,686 | 100% | 15,164 | 100% | 20,320 | 100% | 5,176 | 100% | 1,834 | 100% |
Source: MBR_FACT_EE_ITA_CBS as of February 03, 2025
Data is operational and as such should be considered preliminary and subject to change.
Data includes PNP
Who applied for permanent residence through Express Entry?
Excluding accompanying family members (i.e., considering only principal applicants), total applications sourced through EE in 2024 (85,120) was similar to year 2023 (80,470) but significantly higher than 2022 (34,976), as seen in Table 23. The proportion of the applications somewhat remained the same over the last three years between men and women, with a greater distribution of applications submitted by men (55%) than women (45%). As Table 23 displays, there were some differences in the breakdown of application by program between men and women. The number of applications submitted by men under the CEC (23,610) was higher than those submitted by women (18,385) for all three years. The same trend was seen for the PNP under EE with more applications being made by men (14,225) compared to applications submitted by women (9,470) for the last three years. On the other hand, women (10,200) submitted higher proportion of application for the FSWP than men (9,220) in the last three years. There was fewer than 5 applications submitted for Another gender for CEC and fewer than 5 applications CEC and for PNP for Unknown.
| Gender - Express Entry | 2022 | 2023 | 2024 | Grand Total |
|---|---|---|---|---|
| Female | ||||
| Canadian Experience Class (EE) | 4,915 | 15,920 | 18,385 | 39,220 |
| Federal Skilled Workers (EE) | 2,535 | 11,545 | 10,200 | 24,280 |
| Provincial/Territorial Nominees (EE) | 7,175 | 7,940 | 9,470 | 24,585 |
| Skilled Trades (EE) | -- | -- | -- | -- |
| Total | 14,620 | 35,410 | 38,060 | 88,085 |
| Male | ||||
| Canadian Experience Class (EE) | 7,360 | 21,915 | 23,610 | 52,885 |
| Federal Skilled Workers (EE) | 2,235 | 9,970 | 9,220 | 21,425 |
| Provincial/Territorial Nominees (EE) | 10,760 | 13,175 | 14,225 | 38,160 |
| Skilled Trades (EE) | -- | -- | 5 | 5 |
| Total | 20,355 | 45,060 | 47,060 | 112,475 |
| Another gender | ||||
| Canadian Experience Class (EE) | -- | -- | ||
| Total | -- | -- | ||
| Unknown | ||||
| Canadian Experience Class (EE) | -- | -- | ||
| Provincial/Territorial Nominees (EE) | -- | -- | ||
| Total | -- | -- | ||
| Grand Total | 34,975 | 80,470 | 85,120 | 200,565 |
Data source: Cognos (CBR) as of April 3, 2025
Data compiled by: OPP-DART
Data is operational and subject to change.
As displayed in Table 24, in 2024, Ontario (54,880) remained the most popular province of intended destination, followed by British Columbia (14,060), and Alberta (7,275). These have been the top provinces of destination over the past three years. There was a significant and continuous increase in the number of applications received through EE for candidates intending to settle in Ontario, from 16,920 in 2022 to 48,415 in 2023, to 54,880 in 2024 while British Columbia rose from 6,960 in 2022 to 15,165 in 2023 but decreased in 2024 to 14,060. Alberta nearly doubled in 2023 (8,365) compared to 2022 (4,365) but decreased in 2024 (7,275).
| Province of Destination | 2022 | 2023 | 2024 | Grand Total |
|---|---|---|---|---|
| Alberta | 4,365 | 8,365 | 7,275 | 20,000 |
| British Columbia | 6,960 | 15,165 | 14,060 | 36,180 |
| Manitoba | 2,040 | 2,290 | 3,120 | 7,455 |
| New Brunswick | 870 | 1,930 | 2,525 | 5,320 |
| Newfoundland and Labrador | 305 | 230 | 260 | 795 |
| Northwest Territories | 30 | 45 | 85 | 160 |
| Nova Scotia | 1,785 | 2,025 | 1,525 | 5,330 |
| Nunavut | 5 | 10 | 15 | 30 |
| Ontario | 16,920 | 48,415 | 54,880 | 120,215 |
| Prince Edward Island | 390 | 450 | 335 | 1,175 |
| Saskatchewan | 1,265 | 1,490 | 975 | 3,730 |
| Yukon | 40 | 55 | 75 | 170 |
| Grand Total | 34,975 | 80,470 | 85,120 | 200,565 |
Data source: Cognos (CBR) as of April 3, 2025
Data compiled by: OPP-DART
Data is operational and subject to change.
How long did it take to process Express Entry applications?
Table 25 displays the time, in months, that IRCC took to process 80% of applications under each program. While in 2022, IRCC did not meet the processing standard of finalizing 80% of all applications sourced via EE within six months, in 2023 the Department met its processing standard of 6 months for CEC and FSW, while in 2024 the Department met its processing standard time for CEC, FSW, and PNP. Overall, there was a significant improvement from 2022 (22 months) to 2024 (5 months) surpassing the Department’s processing standard timeline by 1 month, demonstrating IRCC’s operations and processing capacity’s recovery from the impacts of COVID-19. The processing times for all EE programs except FSTP decreased from 2022 to 2024.
| Immigration Category | 6 Months Processing Times (in Months) | ||
|---|---|---|---|
| Ending December 2022 | Ending December 2023 | Ending December 2024 | |
| Canadian Experience Class (EE) | 19 | 5 | 5 |
| Federal Skilled Workers (EE) | 30 | 6 | 6 |
| Provincial/Territorial Nominees (EE) | 12 | 7 | 6 |
| Skilled Trades (EE) | 62 | 84 | 92 |
| Grand Total | 22 | 6 | 5 |
Data source: Cognos (CBR) as of April 3, 2025
Data compiled by: OPP-DART
Data is operational and subject to change.
'- All values between 0 and 5 are shown as “--”. This is done to prevent individuals from being identified when IRCC data is compiled and compared to other publicly available statistics. All other values are rounded to the closest multiple of 5 for the same reason; as a result of rounding, data may not sum to the totals indicated.
What were the economic outcomes of applicants?
Figure 4 compares Canadian median employment earnings with the median employment earnings for EE Federal High Skilled principal applicants admitted to Canada between 2017 and 2021. As seen, there is an increasing income trend line for all EE Federal High Skilled admission cohorts for most years, demonstrating an annual increase in employment surpassing the income of average Canadian born workers. At one year since being admitted to Canada, applicants in the 2017 admission cohort had median employment earnings of $58,700 in 2018 and reached a high of $82,000 at five years since admission in 2022. Following a similar pattern, those who were admitted in 2018 had median employment earnings of $58,900 at one year since being admitted to Canada in 2019 which increased to $82,300 at four years since admission in 2022. Applicants in the 2019 admission cohort had median employment earnings of $55,600 at one year since admission in 2020, which increased to $74,400 in 2022. The 2019 admission cohort has slightly lower than the median employment earnings at one and two year since admission for the 2017 and 2018 admission cohorts. COVID-19 and the associated impacts on the labour market may be the potential cause of the difference in the median employment earnings at one and two years since admission for the 2019 admission cohort. For the 2020 admission cohort, the median employment earnings were $62,800 at one year since admission in 2021 and reached $72,000 in two years since admission in 2022. Lastly, for the 2021 admission cohort, the median employment earnings was $56,300 one year since admission in 2022. When compared to the Canadian median employment earnings, all EE admission cohorts have significantly higher median employment earnings.
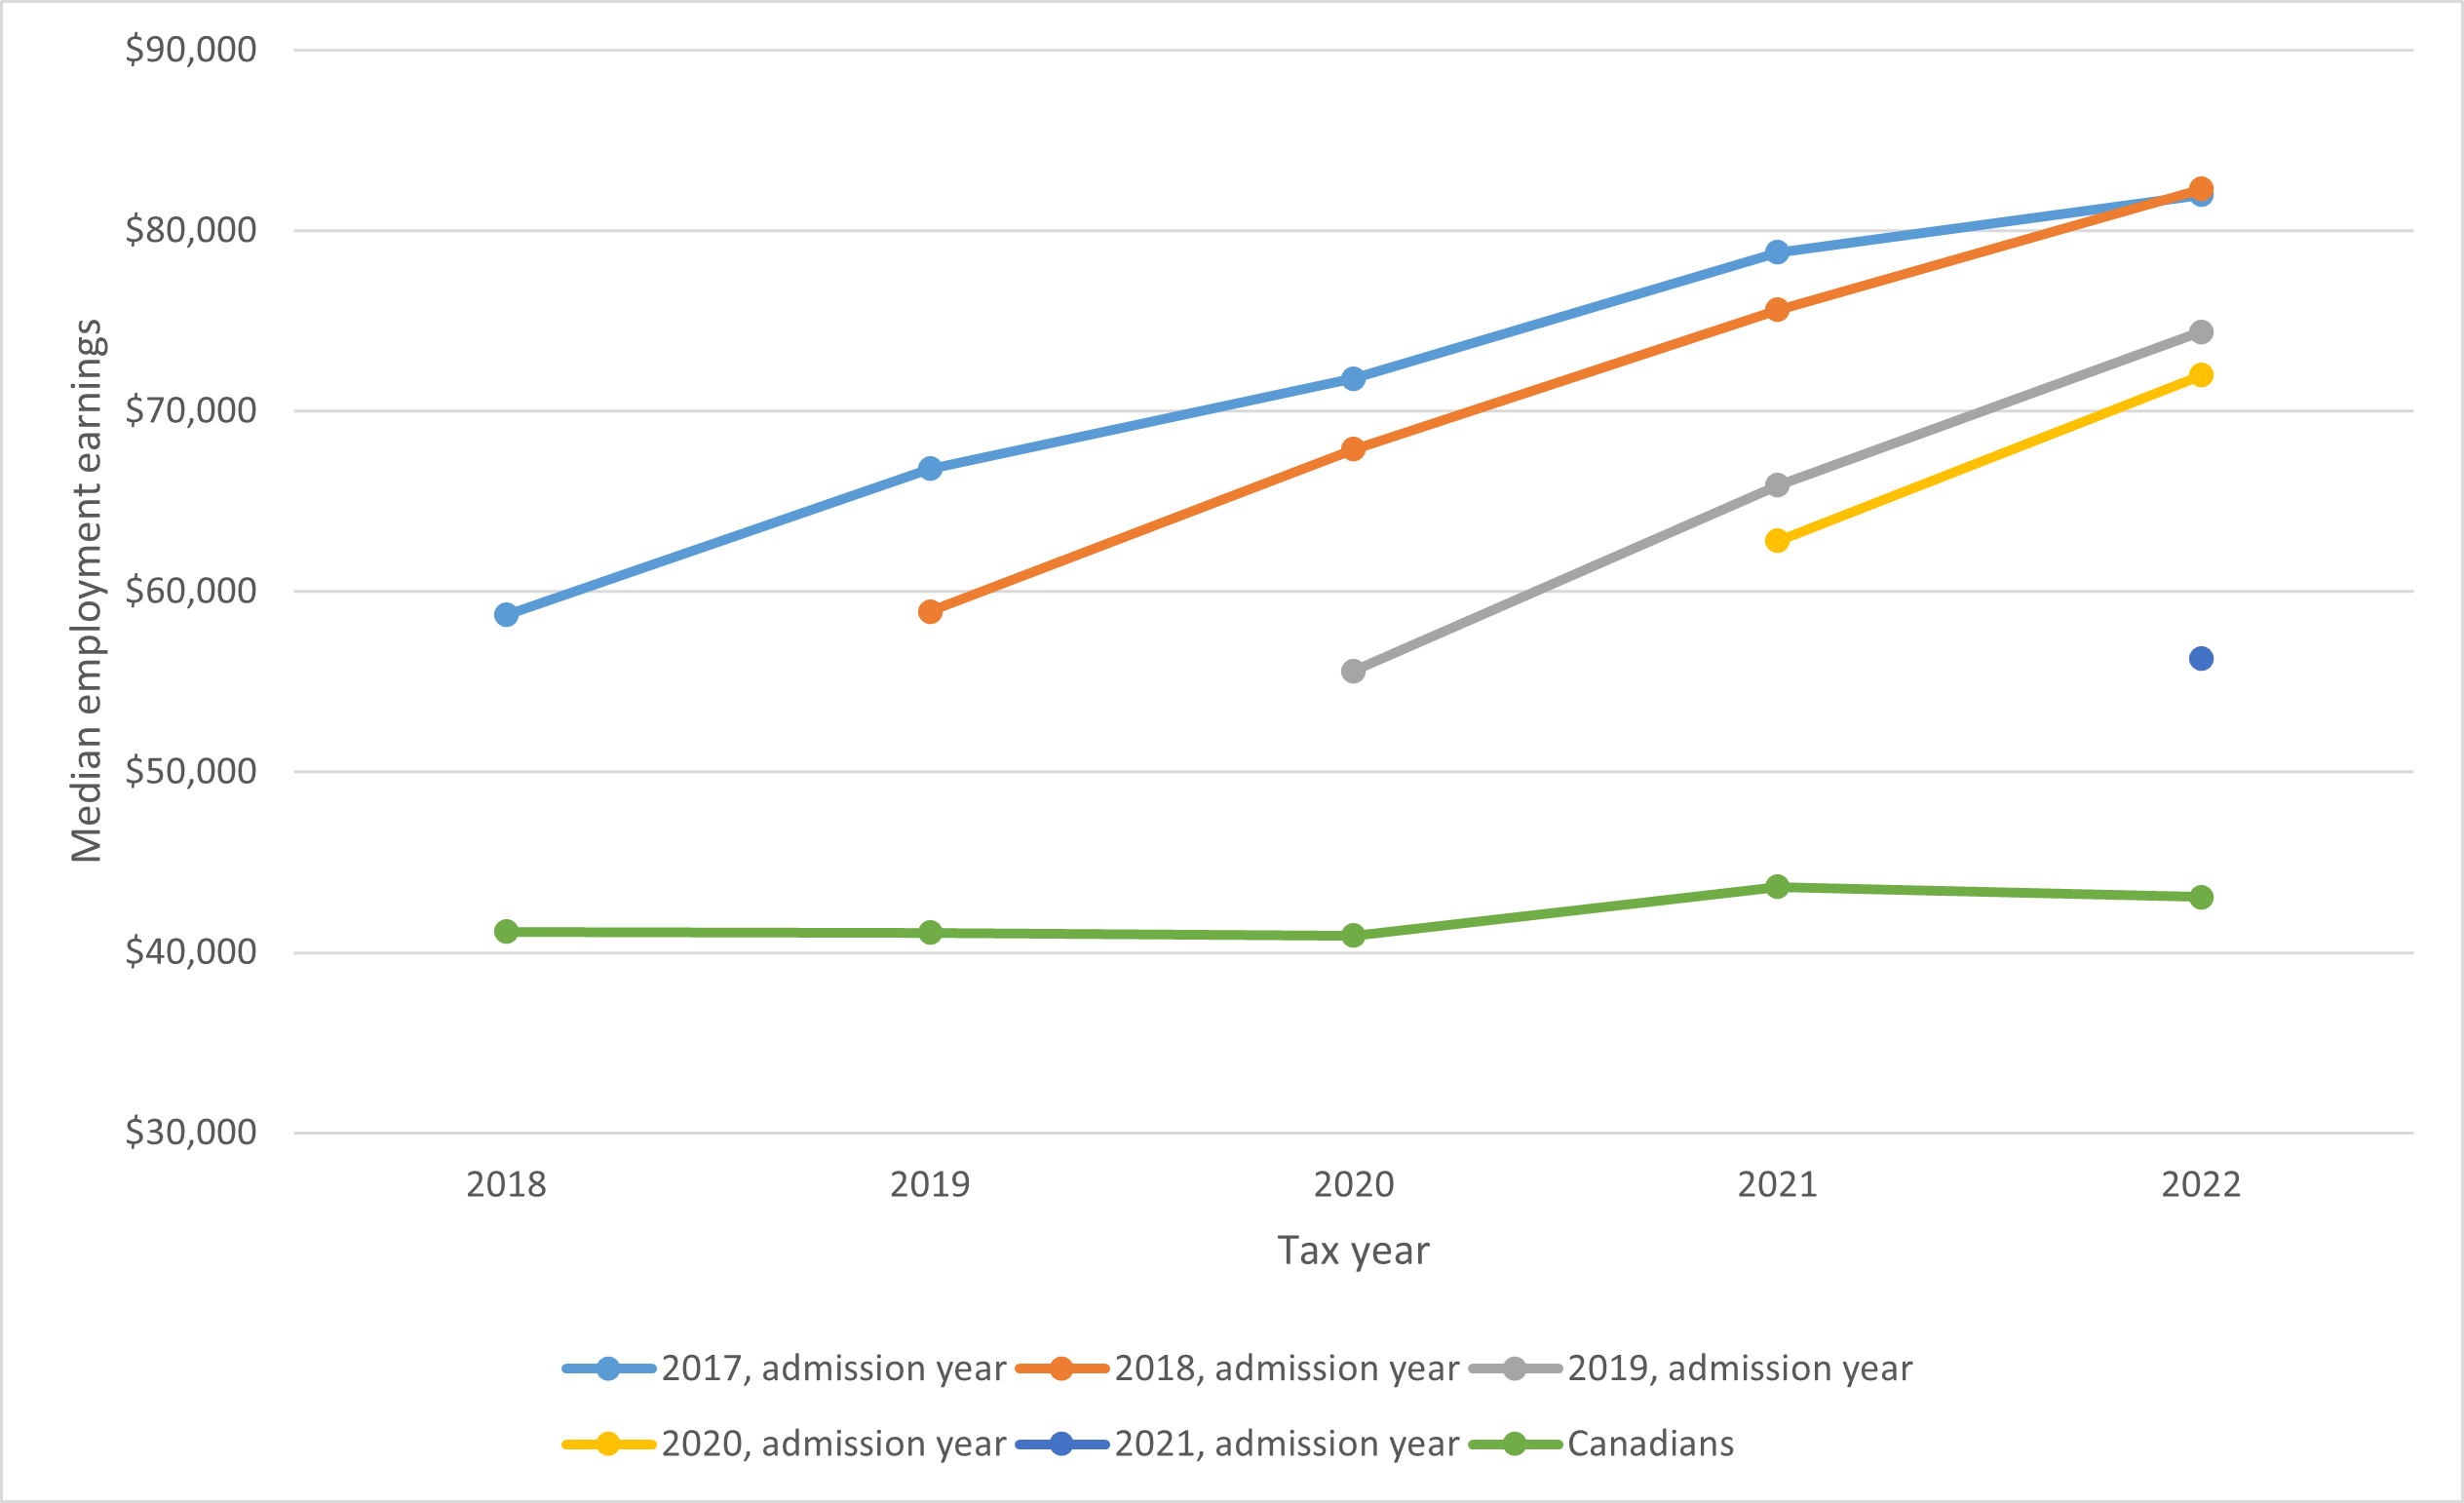
Source: IMDB, 2022 update
Figure 4 text version
Median employment earnings (in 2022$) for Federal High Skilled immigrants by admission year cohort and Canadians, 2017-2021
For the 2017 cohort, median employment income was $58,700 at one year since admission in 2018, $66,800 at two years since admission in 2019, $71,800 at three years since admission in 2020, $78,800 at four years since admission in 2021, and at $82,000 five years since admission in 2022. For the 2018 cohort, median employment income was $58,900 at one year since admission in 2019, $67,900 at two years since admission in 2020, $75,600 at three years since admission in 2021, and $82,300 at four years since admission in 2022. For the 2019 cohort, median employment income was $55,600 at one year since admission in 2020, $65,900 at two years since admission in 2021, and $74,400 at three years since admission in 2022. For the 2020 cohort, median employment was $62,800 at one year since admission in 2021, and $72,000 at two years since admission in 2022. For the 2021 cohort, the median employment earning was $56,300 at one year since admission in 2022. The Canadian median employment income was $41,144 in 2018, $41,091 in 2019, $40,923 in 2020, $43,641 in 2021, and $43,060 in 2022.
As Figure 5 displays, the median employment earnings for PNP admission cohorts ranged between $47,900 to $57,300 at one year since admission between the admission cohorts. It was seen that 2017 admission cohorts had median employment earnings at three years since admission, around $75,000. For the 2019 admission cohort, similar to those admitted under the FHS programs in EE, they had lower median employment earnings ($47,900) at one year since admission in 2020, which increased to $56,000 in 2021. The median employment earnings for the 2020 admission cohort were $55,200 at one year since admission in 2021 while the 2021 admission cohort had the highest employment earnings ($57,300) one year after admission compared to the same timeframe for other cohorts. In general, candidates admitted through the PNP had lower median employment earnings than those admitted under FHS programs in EE. Similar to FHS admission cohorts under EE, when compared to the Canadian median employment earnings, PNP admission cohorts under EE have a significantly higher median employment earnings.
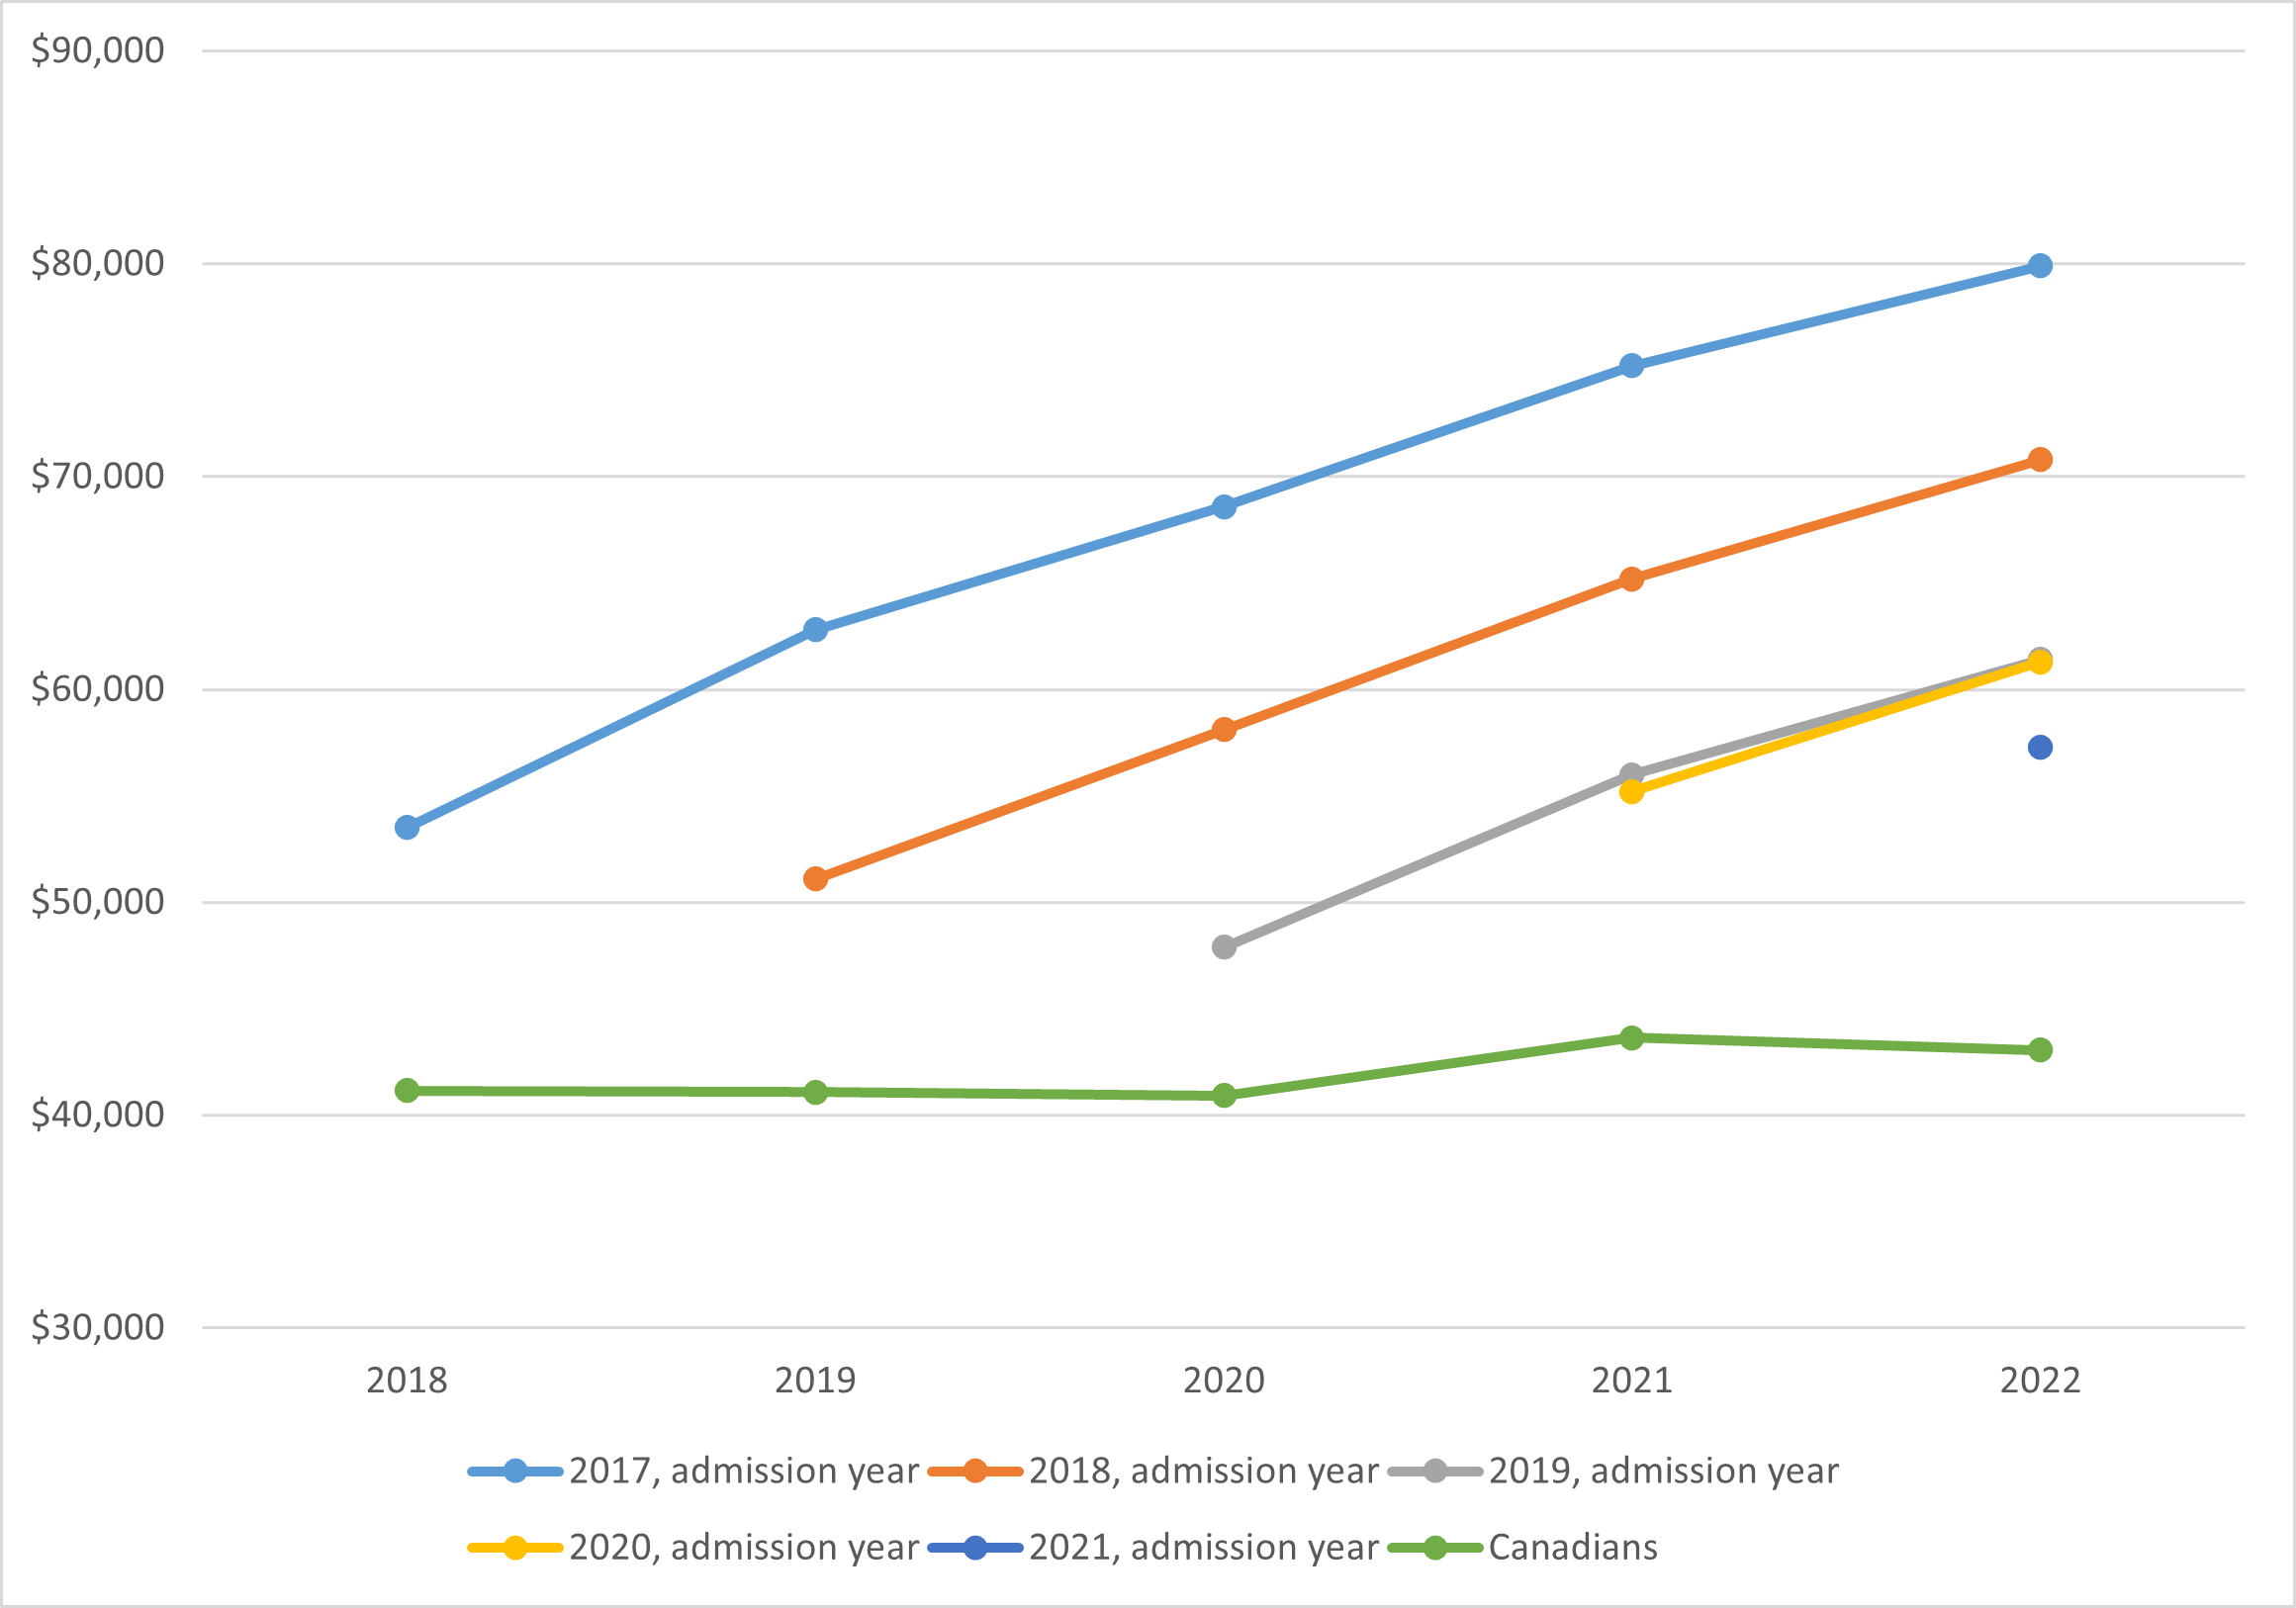
Figure 5 text version
Median employment earnings (in 2022$) for Provincial Nominees admitted under EE by admission year cohort and Canadians, 2017-2022
For the 2017 cohort, median employment income was $53,500 at one year since admission in 2018, $62,800 at two years since admission in 2019, $68,600 at three years since admission in 2020, $75,200 at four years since admission in 2021, and $79,900 five years since admission in 2022. For the 2018 cohort, median employment income was $51,100 at one year since admission in 2019, $58,100 at two years since admission in 2020, $65,200 at three years since admission in 2021, and $70,800 four years since admission in 2022. For the 2019 cohort, median employment income was $47,900 at one year since admission in 2020, $56,000 at two years since admission in 2021, and $61,400 three years since admission in 2022. For the 2020 cohort, median employment income was $55,200 one year since admission in 2021, and $61,300 two years since admission in 2022. Lastly, for the 2021 cohort, median employment income was $57,300 one year since admission in 2022. The Canadian median employment income was $41,144 in 2018, $41,091 in 2019, $40,923 in 2020, $43,641 in 2021, and $43,060 in 2022.
Table 26 demonstrates the median employment earnings two years after admission by Education in Canada attribute for the 2017, 2018, 2019, and 2020 admission cohort. Applicants admitted to Canada in 2020 who had three years or more post- secondary credential ($78,600) had slightly higher median employment earnings than those admitted in 2017 ($69,900), 2018 ($72,300), and 2019 ($73,600). Similar trend was seen among those applicants who had one or two years of post-secondary credential. On the other hand, applicants admitted to Canada in 2019 without a Canadian post-secondary credential ($65,200) had slightly lower median employment earnings when compared to 2017 ($72,100), 2018 ($69,100), and 2020 ($74,400) admission cohorts.
| Tax year | 1- or 2-year post-secondary credential | 3 years or more post-secondary credential | Without Canadian Post-secondary credential | Not applicableTable footnote * |
|---|---|---|---|---|
| 2017 | $54,000 | $69,900 | $72,100 | $68,200 |
| 2018 | $52,700 | $72,300 | $69,100 | $66,200 |
| 2019 | $54,500 | $73,600 | $65,200 | $56,500 |
| 2020 | $55,100 | $78,600 | $74,400 |
Source: IMDB, 2022 update
Although the Arranged Employment additional points were reduced from 600 points to 50 or 200 points in November 2016, due to processing times and lag between visa issuance and admission, there were small numbers of applicants who received 600 points for Arranged Employment for the 2017 and 2018 admission cohorts. As Table 27 demonstrates, applicants in senior manager roles admitted to Canada in 2017 ($258,400), 2018 ($288,100), 2019 ($230,900) and 2020 ($182,000) with arranged employment had a significantly higher median employment earnings two years after their arrival than those applicants with arranged employment in other occupations. Among the applicants with arranged employment, those admitted to Canada in 2016 ($59,300) and 2017 ($57,500) had higher median employment earnings than those admitted in 2018 ($52,500). Lastly, the 2019 admission cohort ($63,100) has the lowest median employment earnings among the admission cohorts that did not have Arranged Employment.
| Tax year | Arranged Employment - Senior manager (Rule 2)Table footnote * | Arranged Employment - Other occupation (Rule 2)Table footnote * | Arranged Employment (Rule 1)Table footnote * | Without Arranged Employment |
|---|---|---|---|---|
| 2016 | $59,300 | $71,600 | ||
| 2017 | $258,400 | $87,000 | $57,500 | $66,100 |
| 2018 | $288,100 | $90,200 | $52,500 | $64,800 |
| 2019 | $230,900 | $82,600 | $63,100 | |
| 2020 | $182,000 | $84,700 | $68,600 |
Source: IMDB, 2022 update
As seen in Table 28, lower French language proficiency, language results below CLB 7, reported the highest employment earnings among all cohorts in 2018, 2019, and 2020. Bilingual applicants in the 2018 to 2020 admission cohorts had similar incomes to unilingual French language speakers two years after admission. Moreover, it was also seen that applicants without siblings in Canada (Table 29) had a higher median employment earnings two years after admission than their counterparts with siblings in Canada.
| Tax year | CLB 7 or more in French and CLB 4 or less in English | CLB 7 or more in French and CLB 5 or more in English | No French test result or less than CLB 7 in French | Not ApplicableTable footnote * |
|---|---|---|---|---|
| 2018 | $62,000 | $61,300 | $65,700 | $68,300 |
| 2019 | $62,700 | $61,800 | $64,400 | $62,900 |
| 2020 | $59,700 | $62,800 | $70,600 |
Source: IMDB, 2022 update
| Tax year | With Siblings in Canada | Without Siblings in Canada | Not ApplicableTable footnote * |
|---|---|---|---|
| 2017 | $60,800 | $65,200 | $66,300 |
| 2018 | $57,800 | $66,300 | $68,400 |
| 2019 | $56,700 | $65,400 | $62,800 |
| 2020 | $61,900 | $71,100 |
Source: IMDB, 2022 update
Conclusion
In 2024, in the ninth year of its operation, the EE application management system continued to provide a pathway to permanent residence for a range of highly-skilled candidates who demonstrated the potential to successfully integrate into and contribute to Canada’s economy. The EE system continued to be a key component of IRCC’s plan to expand permanent residence pathways for international students and temporary foreign workers, and to help address a range of labour market needs in occupations facing long-term shortages.
The Department will continue to monitor EE and category-based selection and to explore ways the system could be used to derive maximum benefit from economic immigration in a rapidly evolving world.
Annex: Category-Based Selection Occupations by Category
| Occupation | 2016 NOC code | 2016 Skill Level | Occupation | 2021 NOC Code | 2021 TEER |
|---|---|---|---|---|---|
| Engineering managers | 0211 | A | Engineering managers | 20010 | 0 |
| Architecture and science managers | 0212 | A | Architecture and science managers | 20011 | 0 |
| Computer and information systems managers | 0213 | A | Computer and information systems managers | 20012 | 0 |
| Architects | 2151 | A | Architects | 21200 | 1 |
| Landscape Architects | 2152 | A | Landscape Architects | 21201 | 1 |
| Urban and land use planners | 2153 | A | Urban and land use planners | 21202 | 1 |
| Land surveyors | 2154 | A | Land surveyors | 21203 | 1 |
| Mathematicians, statisticians and actuaries | 2161 | A | Mathematicians, statisticians and actuaries | 21210 | 1 |
| Information systems analysts and consultants/ Data scientists | 2171 | A | Data scientists | 21211 | 1 |
| Information systems analysts and consultants/ Cybersecurity specialists | 2171 | A | Cybersecurity specialists | 21220 | 1 |
| Information systems analysts and consultants/ Business systems specialists | 2171 | A | Business systems specialists | 21221 | 1 |
| Information systems analysts and consultants/Information systems specialists | 2171 | A | Information systems specialists | 21222 | 1 |
| Database analysts and data administrators | 2172 | A | Database analysts and data administrators | 21223 | 1 |
| Computer programmers and interactive media developers | 2174 | A | Computer systems developers and programmers | 21230 | 1 |
| Software engineers and designers | 2173 | A | Software engineers and designers | 21231 | 1 |
| Computer programmers and interactive media developers | 2174 | A | Software developers and programmers | 21232 | 1 |
| Information systems analysts and consultants/ Web designers | 2171 | A | Web designers | 21233 | 1 |
| Computer programmers and interactive media developers | 2174 | A | Web developers and programmers | 21234 | 1 |
| Civil Engineers | 2131 | A | Civil Engineers | 21300 | 1 |
| Electrical and electronics engineers | 2133 | A | Electrical and electronics engineers | 21310 | 1 |
| Computer engineers (except software engineers and designers) | 2147 | A | Computer engineers (except software engineers and designers) | 21311 | 1 |
| Industrial and manufacturing engineers | 2141 | A | Industrial and manufacturing engineers | 21321 | 1 |
| Metallurgical and materials engineers | 2142 | A | Metallurgical and materials engineers | 21322 | 1 |
| Natural and applied science policy researchers, consultants and program officers | 4161 | A | Natural and applied science policy researchers, consultants and program officers | 41400 | 1 |
| Occupation | 2016 NOC code | 2016 Skill Level | Occupation | 2021 NOC Code | 2021 TEER |
|---|---|---|---|---|---|
| Specialist physicians | 3111 | A | Specialists in clinical and laboratory medicine | 31100 | 1 |
| Specialist physicians | 3111 | A | specialists in surgery | 31101 | 1 |
| General practitioners and family physicians | 3112 | A | General practitioners and family physicians | 31102 | 1 |
| Veterinarians | 3114 | A | Veterinarians | 31103 | 1 |
| Dentists | 3113 | A | Dentists | 31110 | 1 |
| Optometrists | 3121 | A | Optometrists | 31111 | 1 |
| Audiologists and speech language pathologists | 3141 | A | Audiologists and speech language pathologists | 31112 | 1 |
| Dieticians and nutritionists | 3132 | A | Dieticians and nutritionists | 31121 | 1 |
| Psychologists | 4151 | A | Psychologists | 31200 | 1 |
| Chiropractors | 3122 | A | Chiropractors | 31201 | 1 |
| Physiotherapists | 3142 | A | Physiotherapists | 31202 | 1 |
| Occupational therapists | 3143 | A | Occupational therapists | 31203 | 1 |
| Other professional occupations in therapy and assessment | 3144 | A | Kinesiologists and other professional occupations in therapy and assessment | 31204 | 1 |
| Other health diagnosing and treating professionals | 3125 | A | Other professional occupations in health diagnosing and treating | 31209 | 1 |
| Nursing co-ordinators and supervisors | 3011 | A | Nursing co-ordinators and supervisors | 31300 | 1 |
| Registered nurses and registered psychiatric nurses | 3012 | A | Registered nurses and registered psychiatric nurses | 31301 | 1 |
| Allied primary health practitioners | 3124 | A | Nurse practitioners | 31302 | 1 |
| Other health diagnosing and treating professionals | 3125 | A | Physician assistants, midwives and allied health professionals | 31303 | 1 |
| Licensed practical nurses | 3233 | B | Licensed practical nurses | 32101 | 2 |
| Paramedical occupations | 3234 | B | Paramedical occupations | 32102 | 2 |
| Respiratory therapists, clinical perfusionists and cardiopulmonary technologists | 3214 | B | Respiratory therapists, clinical perfusionists and cardiopulmonary technologists | 32103 | 2 |
| Other occupations in support of health services | 3237 | B | Other technical occs. in therapy and assessment | 32109 | 2 |
| Medical laboratory technologists | 3211 | B | Medical laboratory technologists | 32120 | 2 |
| Medical radiation technologists | 3215 | B | Medical radiation technologists | 32121 | 2 |
| Medical sonographers | 3216 | B | Medical sonographers | 32122 | 2 |
| Practitioners of natural healing | 3232 | B | Traditional Chinese medicine practitioners and acupuncturists | 32200 | 2 |
| Massage therapists | 3236 | B | Massage therapists | 32201 | 2 |
| Practitioners of natural healing | 3232 | B | Other practitioners of natural healing | 32209 | 2 |
| Medical laboratory technician and pathologists' assistants | 3212 | B | Medical laboratory assistants and related technical occupations | 33101 | 3 |
| Nurse aides, orderlies and patient service associates | 3413 | C | Nurse aides, orderlies and patient service associates | 33102 | 3 |
| Other assisting occupations in support of health services | 3414 | C | Pharmacy technical assistants and pharmacy assistants | 33103 | 3 |
| Other technical occs. in therapy and assessment | 3237 | B | Other assisting occupations in support of health services | 33109 | 3 |
| Other professional occupations in therapy and assessment | 3144 | A | Therapists in counselling and related specialized therapies | 41301 | 1 |
| Education counsellors | 4033 | A | Education counsellors | 41320 | 1 |
| Instructors of persons with disabilities | 4215 | B | Instructors of persons with disabilities | 42203 | 2 |
| Occupation | 2016 NOC code | 2016 Skill Level | Occupation | 2021 NOC Code | 2021 TEER |
|---|---|---|---|---|---|
| Butchers, meat cutters and fishmongers - retail and wholesale/ | 6331 | B | Butchers- retail and wholesale | 63201 | 3 |
| Agricultural service contractors and farm supervisors | 8252 | B | Agricultural service contractors and farm supervisors | 82030 | 2 |
| Contractors and supervisors, landscaping, grounds maintenance and horticulture services | 8255 | B | Contractors and supervisors, landscaping, grounds maintenance and horticulture services | 82031 | 2 |
| Occupation | 2016 NOC code | 2016 Skill Level | Occupation | 2021 NOC Code | 2021 TEER |
|---|---|---|---|---|---|
| Contractors and supervisors, other construction trades, installers, repairers and servicers | 7205 | B | Contractors and supervisors, other construction trades, installers, repairers and servicers | 72014 | 2 |
| Welders and related machine operators | 7237 | B | Welders and related machine operators | 72106 | 2 |
| Electricians (except industrial and power system) | 7241 | B | Electricians (except industrial and power system) | 72200 | 2 |
| Plumbers | 7251 | B | Plumbers | 72300 | 2 |
| Carpenters | 7271 | B | Carpenters | 72310 | 2 |
| Construction millwrights and industrial mechanics | 7311 | B | Construction millwrights and industrial mechanics | 72400 | 2 |
| Heating, refrigeration and air conditioning mechanics | 7313 | B | Heating, refrigeration and air conditioning mechanics | 72402 | 2 |
| Machine fitters | 7316 | B | Machine fitters | 72405 | 2 |
| Elevator constructors and mechanics | 7318 | B | Elevator constructors and mechanics | 72406 | 2 |
| Residential and commercial installers and servicers | 7441 | C | Residential and commercial installers and servicers | 73200 | 3 |
| Occupation | 2016 NOC code | 2016 Skill Level | Occupation | 2021 NOC Code | 2021 TEER |
|---|---|---|---|---|---|
| Managers in transportation | 0731 | A | Managers in transportation | 70020 | 0 |
| Railway carmen/women | 7314 | B | Railway carmen/women | 72403 | 2 |
| Aircraft mechanics and aircraft inspectors | 7315 | B | Aircraft mechanics and aircraft inspectors | 72404 | 2 |
| Air pilots, flight engineers and flying instructors | 2271 | B | Air pilots, flight engineers and flying instructors | 72600 | 2 |
| Air traffic controllers and related occupations | 2272 | B | Air traffic controllers and related occupations | 72601 | 2 |
| Deck officers, water transport | 2273 | B | Deck officers, water transport | 72602 | 2 |
| Engineer officers, water transport | 2274 | B | Engineer officers, water transport | 72603 | 2 |
| Railway traffic controllers and marine traffic regulators | 2275 | B | Railway traffic controllers and marine traffic regulators | 72604 | 2 |
| Transport Truck Drivers | 7511 | C | Transport Truck Drivers | 73300 | 3 |
| Aircraft assemblers and aircraft assembly inspectors | 9521 | C | Aircraft assemblers and aircraft assembly inspectors | 93200 | 3 |