
The Parents and Grandparents Program: Intake Report 2014 to 2019
Glossary of Terms
| Term | Definition |
|---|---|
| Admissions target | The planned annual target of admissions for a specific immigration program. |
| Application target | The number of applications the Department aims to receive in a given intake year under the parents and grandparents program. |
| Application window | The time prospective sponsors and applicants have to submit an application. |
| Intake model | The type of selection system used to determine who can submit an application and whose application will be accepted into processing. |
| Intake year | The year that an intake opens to new applications. |
| Interest to Sponsor (ITS) | A form that prospective sponsors submit to show their interest in sponsoring their parent(s) and/or grandparent(s). |
| Inventory | Applications in processing, expressed in applications or in persons (applicants). |
| Invitation to Apply (ITA) | An invitation issued to a selected prospective sponsor to submit an application. |
| ITA window | The time the Department takes to issue Invitations to Apply. |
| ITS window | The time prospective sponsors have to submit an Interest to Sponsor form. |
| Levels Plan | The planned immigration target and range for each immigration program for a specific calendar year. |
| Ministerial Instructions | Authorities that allow the Minister to issue special Instructions to immigration officers to enable the Government of Canada to best attain its immigration goals. |
| Processing time | The time from when a complete application is received into processing to when a final decision is rendered. |
Regions of Residence
| Region of Residence | Provinces and Territories |
|---|---|
| Eastern Maritime Provinces | New Brunswick, Newfoundland and Labrador, Nova Scotia, Prince Edward Island |
| Quebec | - |
| Ontario | - |
| Western and Prairie Provinces | Alberta, British Columbia, Manitoba, Saskatchewan |
| Territories | Northwest Territories, Nunavut, Yukon |
Section 1: Overview
What is included in the Intake Report
The Intake Report presents an overview of the application intake process and statistics related to application intakes from 2014 to 2019. It also presents data from across the intake continuum, including inventory levels, processing times, admissions targets, and admissions. Proportions in the report may not add up to 100% due to rounding to the nearest whole number and statistics from different sections may not be identical due to different reporting times.
Background
The admissions targets under the Levels Plan informs the planned number of applications to be finalized for each program in a year. Prior to November 2011, the parents and grandparents program used a first-in application intake model and had no limit on the submission of applications. Since the number of applicants and their family members was much greater than the admissions targets, a long inventory developed. By the end of 2011, the inventory had grown to over 79,000 applications, which included over 167,000 persons.
To reduce the inventory, a moratorium on new applications was established from November 5, 2011 to December 31, 2013. By the end of 2013, the inventory was reduced to less than 41,500 applications, equaling a little over 86,000 persons. When the program opened to new applications on January 2, 2014, a limit on the number of applications to be accepted into processing was introduced.
Intake Process
Beginning in 2014, Ministerial Instructions were published specifying the intake model and the number of applications to be accepted into processing for the intake year (application target). Importantly, applications can consist of more than one person since the principal applicant lists their spouse or common-law partner and/or dependent children as part of the application.
The application target (input) is set at the discretion of the Minister in consideration of the inventory size and the number of applications needed to meet admissions targets (output). The application target is the backbone of the application management system since calibrating the number of applications accepted into processing helps manage the inventory and processing times.
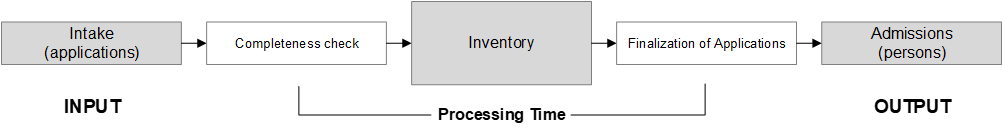
Text version: Intake and admissions process
- Input: Intake of applications after completeness check
- Inventory: Applications added to the end of the existing inventory
- Output: Finalization of applications to meet admissions targets (in persons)
- Processing time is the time from completeness check to finalization of applications
Section 2: Intake Periods
For the purpose of this report, intake years will be grouped into ‘intake periods’ based on the intake selection model used. From 2014 to 2019, three types of intake models were used:
- Intake Period 1: 2014 to 2016
- Intake Period 2: 2017 to 2018
- Intake Period 3: 2019
First Intake Period (1): 2014 to 2016
The Department used a first-in application intake model to manage the receipt of new applications each year. Once the application window opened, interested sponsors submitted their applications and the Department closed the application window once the application target was estimated to have been reached. Since intake was subject to a limit based on the application target, there was a “rush” to submit applications via mail or courier.
| 2014 | 2015 | 2016 | |
|---|---|---|---|
| Opening Date | January 2 | January 2 | January 4 |
| Closing Date | February 3 | January 16 | January 7 |
Second Intake Period (2): 2017 to 2018
In 2017 and 2018, the Department used a randomized selection model to manage the intake of applications. First, prospective sponsors were able to express their interest by submitting an ITS form. After the ITS window closed and all duplicate submissions were removed, all remaining unique ITS submissions were randomized into a queue. A predetermined number of ITAs per round were issued in the order of the randomized list to target receiving the planned number of complete applications (application target). Since not all prospective sponsors who are issued an ITA submit an application, the Department issued a number of ITAs greater than the application target based on the estimated ITA uptake rate. Those who received an ITA were required to submit their application(s) within the application window.
| 2017 | 2018 | ||
|---|---|---|---|
| ITS window | 33 days (January 3 to February 2) |
31 days (January 2 to February 1) |
|
| ITA window | Round 1 | 2 days (April 25 to April 26) |
4 days (March 19 to March 22) |
| Round 2 | 2 days (September 6 to 7) |
2 days (July 31 to August 1) |
|
| Application window | 90 days | 60 days | |
ITA Uptake Rate and Probability of Selection
Table 3 shows statistics related to the ITS and ITA periods, including the ITA uptake rate by intake year. This uptake rate improved significantly from 2017 to 2018 due to enhancements made to the ITS form. It is important to note that a low ITA uptake rate does not inhibit the Department’s ability to meet the application target nor does it impact an individual prospective sponsor’s probability of being selected (a lower anticipated ITA uptake rate results in the issuance of more ITAs in order to meet the application target). The probability of selection for individual prospective sponsors can be determined by dividing the number of ITAs issued by the number of unique ITS forms received.
| 2017 | 2018 | ||
|---|---|---|---|
| Total ITS submissions | 100,211 | 99,895 | |
| Unique ITS submissions | 95,098 | 93,836 | |
| Total ITAs issued | 16,500 | 23,500 | |
| Round 1 | 10,000 | 15,000 | |
| Round 2 | 6,500 | 8,500 | |
| ITA uptake rate | 56% | 74% | |
| Probability of selection | 17% | 25% | |
Data Source: Internal source
Estimated demand
Under a random selection model, it is possible to estimate the demand to sponsor parents and grandparents. While prospective sponsors may submit an ITS form, a proportion who are invited to apply do not submit an application. Therefore, sponsor demand can be estimated by multiplying the ITA uptake rate by the number of unique ITS submissions received. Given that a sponsor is able to sponsor multiple persons on an application, the demand in parents and grandparents is estimated by multiplying sponsor demand by the average number of persons per application submitted in that year. Table 4 shows the estimated demand in 2017 and 2018. Using this methodology, estimated demand grew by over 30% from 2017 to 2018.
| 2017 | 2018 | |
|---|---|---|
| Sponsors | 52,788 | 69,323 |
| Parents and Grandparents | 83,405 | 110,917 |
Note: These data only consider demand to submit a complete application and does consider the final decision of those applications.
Third Intake Period (3): 2019
For the 2019 intake, a new intake model was introduced. While the 2019 process continued to manage the intake of applications in two steps, prospective sponsors were invited based on the order in which they submitted their ITS form.
First, the ITS window opened allowing prospective sponsors to express their interest in sponsoring their parent(s) and/or grandparent(s) by completing an online ITS form with a maximum of 27,000 ITS forms to be accepted. After the maximum was reached, the ITS window closed and all duplicate ITS submissions were removed. A total of 26,376 unique ITS submissions were received in 2019.
Second, ITAs were issued based on the order ITS forms were submitted until the predetermined number of invitations were issued. In 2019, all persons who successfully submitted an ITS form were invited to apply and had 60 days to submit an application. The ITA uptake rate in 2019 was 92%.
| ITS window | Less than 8 minutes (January 28) |
|---|---|
| ITA window | 4 days (April 24 to April 27) |
| Application window | 60 days |
Section 3: Complete Applications Received from 2014 to 2019
The following section compares complete applications received by year in relation to the application target as well as the profile of the sponsors who submitted applications across intake periods. Statistics for this section are also presented by intake period based on the intake model used: Intake Period 1 (2014 to 2016); Intake Period 2 (2017 to 2018); and Intake Period 3 (2019).
How many applications were accepted into processing?
Table 6 shows the application target and number of complete applications accepted in each year whereas Table 7 shows the combined numbers by intake period. The Department accepted more applications than the target every year except 2017 and the combined number of applications accepted was greater than the target for the entire period (2014 to 2019).
| 2014 | 2015 | 2016 | 2017 | 2018 | 2019 | |
|---|---|---|---|---|---|---|
| Application target | 5,000 | 5,000 | 10,000 | 10,000 | 17,000 | 20,000 |
| Applications received | 5,933 | 5,687 | 10,461 | 9,159 | 17,361 | 24,292 |
| Relative difference | +18.7% | +13.7% | +4.6% | -8.4% | +2.1% | +21.5% |
Data source: COGNOS (MBR) extracted as of February 4, 2021
| 1 | 2 | 3 | Total | |
|---|---|---|---|---|
| Application target | 20,000 | 27,000 | 20,000 | 67,000 |
| Applications received | 22,081 | 26,520 | 24,292 | 72,970 |
| Relative difference | +10.4% | -1.8% | +21.5% | +8.9% |
Note: The ‘total’ column includes an additional 77 applications where the received date on the file is recorded as 2020, however, they are applications received from prior intake years.
Data source: COGNOS (MBR) extracted as of February 4, 2021
Principal applicants must include their family members (spouse/common-law partner and/or dependent children) on their application. Table 8 shows the number of persons (whether accompanying or not) associated with all complete applications received by intake period.
| Persons / Intake Year | 2014 | 2015 | 2016 | 2017 | 2018 | 2019 |
|---|---|---|---|---|---|---|
| Number of persons | 9,626 | 9,221 | 16,957 | 14,476 | 27,818 | 40,154 |
| Average per application | 1.62 | 1.62 | 1.62 | 1.58 | 1.60 | 1.65 |
Data source: COGNOS (MBR) extracted as of February 4, 2021
| Persons / Intake Period | 1 | 2 | 3 | Total |
|---|---|---|---|---|
| Number of persons | 35,804 | 42,294 | 40,154 | 118,367 |
| Average per application | 1.62 | 1.59 | 1.65 | 1.62 |
Note: The ‘total’ column includes an additional 77 applications where the received date on the file is recorded as 2020, however, they are applications received from prior intake years.
Data source: COGNOS (MBR) extracted as of February 4, 2021
Who submitted a complete application to sponsor parents and grandparents?
This section details the profile of the sponsors who submitted complete applications across intake periods. Importantly, the totals may not equal number of complete applications received since sponsors can submit multiple applications (e.g. when sponsoring divorced parents).
Sex
As Table 10 shows, female sponsors represented a majority of sponsors who submitted an application in every intake period with the proportion declining over time.
| Sex / Intake Period | 1 | 2 | 3 | Total |
|---|---|---|---|---|
| Female | 58% | 55% | 51% | 54% |
| Male | 42% | 45% | 49% | 46% |
| Other | 0% | 0% | 0% | 0% |
Data source: COGNOS (MBR) extracted as of January 5, 2021
Age
Sponsors must be 18 or older to sponsor their parents or grandparents. As Table 11 shows, the majority of sponsors were between 31 and 40 years old at the time they submitted their application for all intake periods. Approximately a quarter were between 41 and 50 years of age. A sizable proportion were under 31 years of age with only a small proportion being 51 or above.
| Age Grouping / Intake Period | 1 | 2 | 3 | Total |
|---|---|---|---|---|
| 30 Years or Less | 15% | 14% | 17% | 15% |
| 31 to 40 Years Old | 56% | 55% | 58% | 56% |
| 41 to 50 Years Old | 25% | 26% | 21% | 24% |
| 51 Years or More | 4% | 5% | 4% | 4% |
Data source: COGNOS (MBR) extracted as of January 5, 2021
Lag Time
Sponsors must be a Canadian permanent resident or Canadian citizen at the time they submit their application in order to be eligible to sponsor their parents and grandparents. As Table 12 shows, for the first two intake periods the majority (54% and 52% respectively) of sponsors obtained permanent residence in Canada seven or more years prior to the submission of their application to sponsor their parents or grandparents; however; this declined to 48% in the third intake period.
| Lag Time / Intake Period | 1 | 2 | 3 | Total |
|---|---|---|---|---|
| 3 years or less | 18% | 23% | 28% | 23% |
| 4 to 6 years | 29% | 26% | 24% | 26% |
| 7 to 9 years | 23% | 23% | 21% | 22% |
| 10 years or more | 31% | 29% | 27% | 29% |
Note: Lag time refers to the time from when a new immigrant receives permanent residence to when they submit an application to sponsor a member of the family class.
Data source: COGNOS (MBR) extracted as of January 5, 2021
Immigration Class
The vast majority of sponsors (99%) immigrated to Canada as permanent residents. As Table 13 shows, the majority of immigrant sponsors arrived under the Economic Class with approximately a quarter arriving under the Family Class. Only a small proportion arrived under other immigration categories.
| Immigration Class / Intake Period | 1 | 2 | 3 | Total |
|---|---|---|---|---|
| Economic Class | 70% | 71% | 76% | 72% |
| Family Class | 27% | 24% | 21% | 24% |
| Other | 2% | 4% | 2% | 3% |
Data source: COGNOS (MBR) extracted as of January 5, 2021
Use of a Co-signer
A sponsor’s spouse or common-law partner can co-sign the undertaking to count their income towards the income requirement. As Table 14 shows, a sizable majority of sponsors had a spouse or common-law partner co-sign their application to sponsor their parents and grandparents across all intake period; however, the use of a co-signer declined over time.
| Co-signer Use / Intake Period | 1 | 2 | 3 | Total |
|---|---|---|---|---|
| Did not Use Co-Signer | 30% | 33% | 37% | 34% |
| Used Co-Signer | 70% | 67% | 63% | 66% |
Data source: COGNOS (MBR) extracted as of January 5, 2021
Persons per Application
The principal applicant, who must be the biological or adoptive parent or grandparent of the sponsor, must list their spouse or common-law partner and/or dependent children on the application whether they are accompanying them to Canada or not. As Table 15 shows, the majority of applications included two persons with a sizable portion to sponsor a single person. Only a small portion of applications consisted of more than two persons.
| Persons per Application / Intake Period | 1 | 2 | 3 | Total |
|---|---|---|---|---|
| 1 person | 38% | 40% | 35% | 38% |
| 2 persons | 58% | 55% | 61% | 58% |
| 3 or more persons | 4% | 5% | 4% | 4% |
Data source: COGNOS (MBR) extracted as of January 5, 2021
Region of Residence
Table 16 shows the proportion of sponsors by region of residence. Approximately half of sponsors resided in the province of Ontario, followed by the Western and Prairie provinces, Quebec, the Eastern Maritime provinces, and the Territories.
| Intended Region of Residence / Intake Period | 1 | 2 | 3 | Total |
|---|---|---|---|---|
| Eastern Maritime Provinces | 1% | 1% | 1% | 1% |
| Quebec | 10% | 14% | 10% | 11% |
| Ontario | 50% | 42% | 51% | 48% |
| Western and Prairie Provinces | 39% | 42% | 39% | 40% |
| Territories | 0% | 0% | 0% | 0% |
Note: For sponsors who use an immigration representative, the province or territory of the representative's address may have been captured in these statistics, which may or may not be the same as the sponsor.
Data source: COGNOS (MBR) extracted as of March 2, 2021
Source Country
In general, the country of citizenship of the principal applicant corresponds to the country of origin (country of birth or citizenship) of the sponsor. Table 17 shows complete applications received by the country of citizenship of the principal applicant based on the top five countries over the entire period.
| Country of Citizenship / Intake Period | 1 | 2 | 3 | Total |
|---|---|---|---|---|
| People's Republic of China | 35% | 17% | 28% | 26% |
| India | 20% | 25% | 31% | 26% |
| Philippines | 5% | 11% | 4% | 7% |
| Iran | 3% | 4% | 5% | 4% |
| Pakistan | 3% | 3% | 4% | 3% |
| Other | 34% | 39% | 28% | 34% |
Data source: COGNOS (MBR) extracted as of January 5, 2021
Section 4: Processing of Applications from 2014 to 2019
Finalized applications and decisions on applications received from 2014 to 2019
As of January 5, 2021, the vast majority of applications received from 2014 to 2018 had been finalized, while less than a quarter from the 2019 intake had been finalized. The vast majority of finalized applications received from all intake periods were approved.
| Applications Finalized / Intake Period | 1 | 2 | 3 | Total |
|---|---|---|---|---|
| Finalized | 20,299 | 20,762 | 5,255 | 46,316 |
| In Processing | 1,778 | 5,756 | 19,037 | 26,571 |
| Finalized | 92% | 78% | 22% | 64% |
| In Processing | 8% | 22% | 78% | 36% |
Data source: COGNOS (MBR) extracted as of January 5, 2021
| Final Decisions / Intake Period | 1 | 2 | 3 | Total |
|---|---|---|---|---|
| Approved | 92% | 89% | 98% | 92% |
| Refused | 6% | 9% | 2% | 7% |
| Withdrawn | 2% | 1% | 1% | 1% |
Data source: COGNOS (MBR) extracted as of January 5, 2021
Section 5: Processing by Year
Inventory and Processing Times
The primary variable affecting processing times is the size of the inventory. The inventory grows when the input (total persons for complete applications received) exceeds the output (total persons from finalized applications to meet admissions targets). New applications received are placed at the end of the inventory and are typically processed in the order they are received. Processing times in a given year are calculated based on applications finalized in the last 12 months and are not necessarily applications received in that year. As Figure 1 shows, processing times for applications finalized in 2019 reached a decade low of 19 months.
Figure 1. Inventory (in persons and applications) and processing times (in months), by year
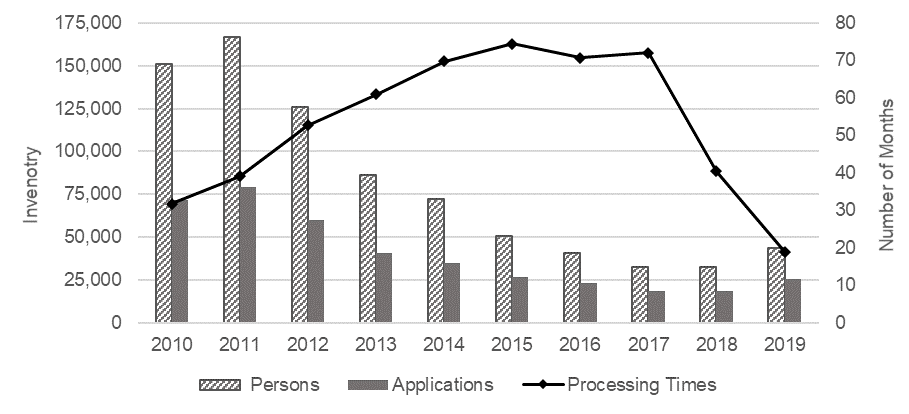
Note: Data are preliminary estimates and subject to change. Data more recent than September 30, 2022 has not been publically released.
Data source: COGNOS (MBR) extracted as of June 26, 2020
Text version: Inventory (in persons and applications) and processing times (in months), by year
| Year | Persons | Applications | Processing Times |
|---|---|---|---|
| 2010 | 150,951 | 71,704 | 32 |
| 2011 | 167,007 | 79,183 | 39 |
| 2012 | 125,599 | 59,804 | 53 |
| 2013 | 86,027 | 40,482 | 61 |
| 2014 | 72,007 | 34,800 | 70 |
| 2015 | 50,661 | 26,572 | 74 |
| 2016 | 40,511 | 22,910 | 71 |
| 2017 | 32,165 | 18,480 | 72 |
| 2018 | 32,411 | 18,505 | 40 |
| 2019 | 43,666 | 25,145 | 19 |
How many parent and grandparent applications were finalized?
Table 20 and Table 21 show applications and persons finalized from 2014 to 2019 by final decision. Finalizations in a given year are typically applications received in previous years.
| Final Decisions / Year | 2014 | 2015 | 2016 | 2017 | 2018 | 2019 |
|---|---|---|---|---|---|---|
| Total | 10,826 | 10,562 | 11,811 | 11,357 | 16,833 | 12,888 |
| Approved | 87% | 87% | 92% | 90% | 90% | 89% |
| Refused | 11% | 10% | 6% | 8% | 8% | 10% |
| Withdrawn | 3% | 2% | 2% | 2% | 2% | 1% |
Data source: COGNOS (MBR) extracted as of February 4, 2021
| Final Decisions / Year | 2014 | 2015 | 2016 | 2017 | 2018 | 2019 |
|---|---|---|---|---|---|---|
| Total | 18,021 | 17,747 | 19,269 | 18,093 | 27,011 | 20,703 |
| Approved | 87% | 87% | 92% | 90% | 90% | 89% |
| Refused | 11% | 11% | 6% | 8% | 8% | 10% |
| Withdrawn | 2% | 2% | 1% | 2% | 1% | 1% |
Data source: COGNOS (MBR) extracted as of February 4, 2021
How many parents and grandparents were admitted as permanent residents?
The targeted number of admissions for the parents and grandparents program is based on the Levels Plan which sets out the Department’s planned immigration levels. Admissions includes the principal applicant and accompanying family members (spouse/partner and/or dependent children). It is important to note that due to processing times and the time lag between approval of an application and admission of its applicants, admissions in a given year are typically from applications received under intakes from previous years.
The admissions target and range remained relatively stable from 2014 to 2019 with the admissions target increasing by 500 persons in 2019. The Department fell short of the low admission range in 2015 and 2016. In all other years (2014, 2017, 2018, 2019), the Department admitted a number of parents and grandparents above the low admissions range.
| Admissions Targets | Actual Admissions |
Within Range |
|||
|---|---|---|---|---|---|
| Year | Low | Target | High | ||
| 2014 | 18,000 | 20,000 | 20,000 | 18,205 | - |
| 2015 | 18,000 | - | 20,000 | 15,491 | Arrow down |
| 2016 | 18,000 | 20,000 | 20,000 | 17,045 | Arrow down |
| 2017 | 18,000 | 20,000 | 20,000 | 20,495 | Arrow up |
| 2018 | 17,000 | 20,000 | 21,000 | 18,030 | - |
| 2019 | 17,000 | 20,500 | 22,000 | 22,011 | Arrow up |
| Total | 106,000 | 100,500 | 123,000 | 111,277 | - |
Note: ‘-’= within range; ‘Arrow up’= above range; ‘Arrow down’= below range.
Data Source: Targets from Immigration Levels Plans. Admissions data from Netezza_DM2 - RDM, Permanent Residents, April 30, 2022.
Section 6: Conclusion
Several important changes to the parent and grandparent application intake management system began in late 2011 that played a positive role in reducing the inventory and processing times for parent and grandparent applications. This included increased admissions, a temporary moratorium on new applications, and the introduction of an annual application target beginning in 2014.
Beginning in 2014, while a long inventory remained, the collective annual intakes from 2014 to 2017 added fewer persons to the inventory than number finalized to meet admissions targets. The result was a continued reduction in the inventory and a reduction in processing times for applications finalized in 2018.
The 2018 and 2019 intakes represented the first intakes since the program reopened where the input was greater than the output. These intakes added a number of persons to the inventory greater than the number of persons finalized to meet admissions targets. While this caused the inventory to grow slightly, resulting in longer processing times, overall the inventory remained significantly lower than it had been prior to 2016.