
Statistical Portrait of the French-speaking Immigrant Population Outside Quebec (1991-2011)
Statistics Canada
Ottawa, June 2014
René Houle, Daniel Pereira and Jean-Pierre Corbeil
This project was funded by the Research and Evaluation Branch at Citizenship and Immigration Canada that receives funding from the Roadmap for Canada's Official Languages 2013-2018: Education, Immigration, Communities to support research on immigration in official language minority communities.
The views and opinions expressed in this document are those of the author(s) and do not necessarily reflect those of Citizenship and Immigration Canada or the Government of Canada.
Ref. No.: R8-2014
Table of contents
- Summary
- Introduction
- 1. French-speaking immigrants living outside Quebec
- 2. Geographic origins of French-speaking immigrants
- 3. Age structure
- 4. Interprovincial migration
- 5. Linguistic behaviours at home and at work
- 6. Couples in which at least one partner is a francophone immigrant and the intergenerational transmission of language
- 7. Education and diplomas
- 8. Labour force participation
- 9. Conclusion
Summary
This report examines French-language immigration outside Quebec and its recent evolution, focusing on its numbers, its geographic distribution and its demographic and socioeconomic characteristics. This is an update of the analytical report published by Statistics Canada in 2010, with the financial support of Citizenship and Immigration Canada. This new version uses the most recent statistics on the subject, drawn from the 2011 National Household Survey.Footnote 1 As in the 2010 version, this statistical portrait of French-language immigration is primarily based on the concept of first official language spoken (FOLS), which has been increasingly used in recent years as a criterion of linguistic definition in studies on official-language minorities. The francophone immigrant population outside Quebec comprises two groups: those with only French as their first official language spoken (French FOLS immigrants) and those whose first official language spoken is both French and English (French-English FOLS immigrants).
The francophone immigrant population living outside Quebec is fairly small, both in absolute numbers and in relation to the number of French-speaking persons overall or the immigrant population as a whole. However, the relative weight of francophone immigrants within the French-speaking population as a whole has increased from 6.2% to 11.7% between 1991 and 2011, whereas their weight within the immigrant population varied more moderately, standing at 2% in 2011.
While the 2006 Census enumerated 60,900 immigrants with French as their FOLS in the provinces and territories excluding Quebec and 76,100 immigrants whose FOLS was both French and English, the 2011 National Household Survey found that within those provinces and territories, there were 74,470 French FOLS immigrants and 79,400 with a French-English FOLS.
It is worth noting that of the immigrants who were living in provinces and territories outside Quebec in 2011 and who had come to Canada between 2006 and the 2011 NHS, 18,450 had French as their FOLS and 17,600 were French-English FOLS. Of the recent immigrants enumerated in the 2006 Census, the corresponding numbers were 12,940 and 18,570 respectively.
As seen in the earlier version of this study, the majority—nearly 70%—of francophone immigrants outside Quebec are concentrated in Ontario. Two-thirds of French-speaking immigrants live in three urban centres: Toronto, Ottawa and Vancouver.
In some cities, particularly Toronto, Vancouver and Calgary, there are one-and-a-half times more French-English FOLS immigrants than French FOLS immigrants. These two FOLS groups have sometimes very different demographic and socioeconomic characteristics.
The geographic origin of international immigration to Canada has rapidly changed over recent decades. Immigrants of European origin have tended to give way to immigrants from Asia, Africa and Latin America. In this regard, French FOLS immigrants stand out from other immigrants in that a sizable proportion of them come from the African continent. One of the consequences of this trend has been that the composition of the French FOLS immigrant population has changed; Blacks accounted for 34% of that population in 2011, compared with 10% in the other two immigrant groups.
The francophone immigrant population appears to be fairly young (characterized by a large proportion in the 0-to-19 age group) when compared with non-francophone immigrants. This characteristic is partly due to the quite distinctive age composition of the French-English FOLS immigrant population, which includes a large proportion of young persons aged 10 to 24, a much higher proportion than for French FOLS immigrants and non-francophone immigrants.
Interprovincial migration varies greatly depending on whether one is a francophone or a non-francophone living in a province or territory outside Quebec. Whereas francophones tend to settle in Quebec when they migrate within Canada, non-francophones tend to choose one of the other nine provinces, especially Ontario, British Columbia and Alberta. In Quebec, the trends are completely opposite: Quebec francophones, whether Canadian-born or immigrants, migrate relatively little to the other provinces, while a much higher proportion of non-francophones leave the province. Overall, the migratory movement of francophone immigrants from the rest of Canada to Quebec is not sufficient to offset the inverse migratory movement from Quebec to the rest of Canada, and the net interprovincial migration of francophone immigrants markedly favours Canada outside Quebec. In relative terms, the net migration of francophone immigrants is even much greater than that of Canadian-born francophones and non-francophone immigrants.
A review of the linguistic behaviours of francophone immigrants at home and at work who have settled outside Quebec reveals that French and English are in competition as languages spoken at home and in the workplace. Among French FOLS immigrants, just under half (48%) report speaking French most often at home, while 30% report speaking English and 10% a non-official language. Among French-English FOLS immigrants, the use of French at home is not very widespread, even when those who report speaking French at home on a regular basis (rather than most often) are included.
In the workplace, the presence of English is very widespread. For all groups defined by the first official language spoken (FOLS) and immigrant status, English is largely dominant as the language spoken most often at work. Among immigrants with French as their FOLS, 64% report using English most often at work.
Regional trends show that the use of French diminishes from east to west: it is greatest in the Atlantic region, especially New Brunswick; it remains high in northern Ontario and in Ottawa; and it reaches its lowest level in Toronto (and in southern Ontario in general) and the two provinces of Alberta and British Columbia.
The transmission of French depends on both the type of couple in the household in which the children are living and the context in which French is used. French is primarily transmitted by couples in which both partners have only French as their FOLS. In such households, the majority of children have French as their mother tongue and their first official language spoken and speak it most often at home. The situation is completely different for other types of couples who transmit English or a non-official language. The context is also important. As a mother tongue, French is transmitted to 28% of children living in households comprising couples in which at least one partner is a francophone immigrant; it is transmitted to 38% of children as a home language (language spoken at least on a regular basis at home); and to 41% of children as a first official language spoken (FOLS). Furthermore, the competition of English is very strong in all contexts: as a mother tongue, English (excluding cases where French and English are transmitted simultaneously) is passed on to 29% of children; as a home language, it is transmitted to 61% of children; and as an FOLS, to 54% of children. In the three types of intergenerational transmission, English outranks French in terms of the number of children to whom the language is transmitted. As for non-official languages, their transmission to children is significant and more widespread than French: 43% of children have a non-official language as their only mother tongue, and nearly the same proportion, 47%, use a non-official language at least on a regular basis at home (excluding cases where a non-official language is transmitted simultaneously with French or English).
Immigrants with French as their first official language spoken (FOLS) stand out from both Canadian-born francophones and the rest of immigrants (those having both French and English as their FOLS as well as non-francophones) with regard to their highest level of education and the characteristics of the diplomas earned. Both males and females in this group have a level of education similar to French-English FOLS immigrants, but a higher level than Canadian-born persons and non-francophone immigrants. Immigrants with French as their FOLS differ from other immigrant groups in that a larger proportion of them earned their diploma or certificate in Canada. Furthermore, among those who earned their diploma or certificate abroad, a larger proportion got it in Western Europe, in most cases in a francophone country, primarily France.
Also, a smaller proportion of French FOLS immigrants than other immigrants (both those with a double French-English FOLS and non-francophones) acquired a university-level diploma or certificate in engineering.
There are few differences between immigrant groups with regard to their participation in the labour force, although non-francophone immigrants have a lower level of unemployment than French FOLS immigrants, and especially French-English FOLS immigrants. Instead, socioeconomic characteristics determine the degree of integration into the labour market. The period of arrival in Canada is key in this regard, as is the continent of birth—African immigrants appear to be at a particular disadvantage.
Introduction
International immigration is one of the factors that contribute the most to the growth of the Canadian population and the evolution of the linguistic situation in Canada. At the time of the 2011 National Household Survey (NHS), one in five Canadians, or 6.8 million persons, were foreign-born. Between 2006 and 2011, there were approximately 1.2 million newcomers to Canada, representing a 16.7% increase in its immigrant population, compared with a 3.4% increase in the Canadian-born population.
This report focuses on French-language immigration outside Quebec. In general, francophone minority communities outside Quebec have benefitted little from the demographic contribution of international immigration, due to the strong propensity of these immigrants to integrate into communities with an English-speaking majority. Moreover, the phenomenon of French-language immigration outside Quebec has become a matter of interest fairly recently, as has the question of its contribution to the development and growth of official language minorities.
In 2011, whereas 95.3% of the Canadian-born population outside Quebec had English as its first official language spoken, this was the case for 92% of the immigrant population. Conversely, while French was the first official language spoken for 4.6% of the Canadian-born population, the corresponding proportion for the immigrant population was no more than 2.7%, including 1.4% who had both French and English as their first official language spoken.
On March 28, 2013, the Minister of Canadian Heritage and Official Languages announced the Roadmap for Canada's Official Languages 2013-2018: Education, Immigration, Communities, a five-year plan that brings together 14 federal departments and agencies with the objective of promoting the official languages and enhancing the vitality of official-language minorities communities (OLMCs). Citizenship and Immigration Canada (CIC) receives $149.4 million from this Roadmap, $29.4 million of which is for the ‘Immigration to OLMCs’ initiative.
The CIC-Francophone Minority Communities Committee (CIC-FMCs Committee) was created as part of a new and simplified joint governance structure to promote francophone immigration to FMCs under the ‘Immigration to OLMCs’ initiative. The CIC-FMCs Committee builds on the work accomplished by the former CIC-FMCs Steering Committee. Under the leadership of the CIC-FMCs Committee, the initiative’s objectives are to foster the recruitment and integration of immigrants into FMCs, to increase the proportion of francophone economic immigrants in FMCs from 1.1% (2011) to 4% in 2018, and to improve the settlement and integration of francophone immigrants.
The initiative has four main components: coordinate activities and consult with key stakeholders; conduct promotional and recruitment activities in Canada and abroad; provide settlement services to French-speaking clients (immigrants); and conduct strategic data development as well as research, and develop knowledge-sharing projects for immigration to official-language minority communities. Research activities aim to shed light on the challenges associated with the vitality of both official language minority communities.
This report is an update of the 2010 report released by Statistics Canada, and like that earlier report, provides information on the demographic, linguistic, social and economic characteristics of French-language immigrants to francophone minority communities. The analyses provided are based on Canadian census data since 1991 as well as data from the 2011 National Household Survey (NHS). In 2011, the NHS had no fewer than six questions or sub-questions on official languages, dealing with knowledge of official languages, language spoken most often at home, other languages spoken on a regular basis at home, mother tongue, language used most often at work and other languages used on a regular basis at work.
This analytical report first looks at how the size and relative share of the French-speaking immigrant population outside Quebec have changed since 1991. It also provides information on the geographic distribution of that population in 2011, with particular emphasis on census metropolitan areas. The second section provides information on the geographic origins of French-speaking immigrants and their so-called visible minority status. The third and fourth sections examine the age structure of this population and the importance of interprovincial migration as factors likely to affect the evolution of these populations. Linguistic behaviours at home and at work and the phenomenon of intergenerational transmission are examined in subsequent sections. Finally, two major sections of this report provide information on these immigrants’ education and the different aspects of their participation in the labour market.
Criteria used to define a French-speaking immigrant outside Quebec
Before we present the results contained in this report, it is important to focus on how this analytical document defines the linguistic groups discussed. The question, then, is what criteria were used to define a French-speaking immigrant. For example, how is a francophone defined? The fact is that there is no standard definition of a francophone. For historical reasons,Footnote 2 Statistics Canada has generally used the criterion of mother tongue, or the first language learned at home in childhood and still understood at the time of the census. However, other criteria are also used and help to develop definitions of French-speaking persons that may be either more inclusive or more restrictive. Thus, the question arises as to whether the definition of francophone should refer to persons who have French as their mother tongue, who have French as their first official language spoken, or who speak French either most often or on a regular basis at home. Or should a broader definition be considered that includes all French speakers, or more individuals if we add young children who do not speak French but have at least one parent for whom French is the first language learned and still understood.
Additionally, in choosing a strategy for estimating a linguistic group, it is important to take at least two main factors into account. First, if the goal is to enumerate the population considering all linguistic groups on the same basis, treating them symmetrically and creating mutually exclusive categories to estimate them (e.g., English, French, others), this implies an appropriate distribution of multiple responses. Second, if the goal is to focus on a single linguistic group (e.g., francophones), the criteria for belonging can be broadened without concern for implicit overlaps between linguistic groups.
In this statistical portrait of French-speaking immigrants residing outside Quebec, the main concept used will be the first official language spoken (FOLS), which is now widely used as a linguistic definition criterion in studies on official-language minorities. Changes in the composition of the Canadian population over the years call for the concept of francophone group or community to be redefined or expanded, given that a significant number of people whose mother tongue is neither French nor English use French predominantly or on a regular basis in their daily lives.
The decision to create the concept of first official language spoken was based on a number of considerations. First, the substantial increase in international immigration since the mid-1980s has led to an increase in the population with an “other” mother tongue across Canada (20% in 2011), such persons often being designated by the term “allophones.”
Since an allophone cannot become a francophone based on mother tongue, but can become one by adopting French as the language spoken most often at home or in the public sphere, the question arises as to how to designate individuals’ first official language or, more specifically, how to distribute allophones between French and English based on their reported knowledge of either official language.
It was this line of questioning that led to different definitions of the concept of first official language spoken (Statistics Canada 1989). This concept echoes the spirit of the new version of the Official Languages Act (1988), which stipulates, in section 32(2), that the government may have regard to “the number of persons composing the English or French linguistic minority population of the area served by an office or facility, the particular characteristics of that population and the proportion of that population to the total population of that area.”
The concept of first official language was chosen by the federal government in December 1991 in the Official Languages (Communications with and Services to the Public) Regulations. Section 2 of the Regulations describes the method used to determine the “first official language spoken,” namely the first of the two variants presented in Statistics Canada (1989), a method that successively takes account of the responses to the questions on knowledge of official languages, mother tongue and language spoken most often at home. The “first official language spoken” variable is thus not a census question, but rather, is derived from three questions in the linguistic module of the census.
This report therefore draws a statistical portrait of French-speaking immigrants outside Quebec, who will also be referred to generally as francophone immigrants, using the “first official language spoken” variable. In keeping with the practice of the Treasury Board Secretariat, the population with French as its first official language spoken (FOLS) includes people with only French as their FOLS and half of the individuals with both French and English as their FOLS; the latter category covers people to whom neither French nor English can be assigned based on the responses to the three variables mentioned above. However, on more than one occasion, we will present the categories “French” FOLS and “French-English” FOLS separately, since these two sub-populations differ in their sociodemographic characteristics and linguistic practices.
1 French-speaking immigrants living outside Quebec
This section examines the demographic weight and geographic distribution, by province and census metropolitan area (CMA), of francophone immigrants who reside in provinces and territories of Canada outside Quebec.
1.1 Demographic weight
French-speaking immigrants (that is, immigrants whose first official language spoken is French) living outside Quebec constitute a small population compared with the total number of immigrants or the total French-speaking population. In Canada, most French-speaking immigrants live in the province of Quebec. Of the approximately 700,000 francophone immigrants living in Canada at the time of the 2011 National Household Survey (NHS) (including those with both French and English as their FOLS), more than 650,000 or 81% were living in Quebec. The remaining 153,000 immigrants, or 19% of the Canadian total, were distributed among the nine other provinces and three territories, including a large proportion living in Ontario.
In the 2011 NHS, there were nearly 74,500 immigrants outside Quebec for whom French was the first official language spoken and 79,400 who were assigned both French and English as first official languages spoken (French-English FOLS) (Table 1.1). In relation to the 2006 Census, this was a sizable increase in the population of the first group, which grew by 16,000 (representing a five-year growth rate of 22.3%), while the increase in the second group was only 3,000 (4.3% growth rate). In general, a substantial share of persons with a double official language (French-English FOLS), among both native-born Canadians and immigrants, live outside Quebec. In Canada in 2011, 12% of native-born Canadians and immigrants whose first official language was French were living outside Quebec, compared with 32% of French-English FOLS native-born Canadians and immigrants. These percentages have remained stable over the past 20 years. If French-English FOLS persons are redistributed equally between the French and English groups, as stipulated in the 1991 Official Language (Communications with and Services to the Public) Regulations, there are 115,000 immigrants living outside Quebec with French as their first official language, representing nearly 17% of all French-speaking immigrants living in Canada (see table in Appendix A).
The changing numbers indicate continuous growth between 1991 and 2011 for almost all groups defined by first official language spoken (FOLS) and immigrant status and all periods, both before and after redistribution of the French-English category. However, we observe that the population of non-permanent residents declined between 1991 and 1996, but increased between 1996 and 2011, both in Canada as a whole and in Quebec. The decrease in the weight of the Canadian-born French FOLS population continued in 2011 compared with 2006 (13.0% in 2006 and 12.3% in 2011), a phenomenon mainly attributable to the increase in francophone immigration (Table 1.1). Also, there was a slight decrease from 2006 to 2011 in the proportion of French-English FOLS persons outside Quebec, which stood at 32.2% in 2011.
Table 1.1: Population according to immigrant status and first official language spoken (FOLS), Canada, Quebec and Canada less Quebec, 1991 to 2011
| Population (in thousands) | 1991 | 1996 | 2001 | 2006 | 2011 |
|---|---|---|---|---|---|
| French FOLS native-born | 6,399 | 6,534 | 6,594 | 6,705 | 6,806 |
| French-English FOLS native-born | 78 | 88 | 88 | 98 | 92 |
| French FOLS immigrant | 288 | 337 | 379 | 473 | 572 |
| French-English FOLS immigrant | 131 | 161 | 188 | 226 | 246 |
| Immigrants FOLS other | 3,924 | 4,473 | 4,881 | 5,488 | 5,957 |
| Native-born FOLS other | 15,951 | 16,769 | 17,309 | 17,985 | 18,822 |
| Non-permanent resident | 223 | 167 | 199 | 265 | 356 |
| Population (in thousands) | 1991 | 1996 | 2001 | 2006 | 2011 |
|---|---|---|---|---|---|
| French FOLS native-born | 5,507 | 5,654 | 5,714 | 5,830 | 5,969 |
| French-English FOLS native-born | 51 | 58 | 58 | 63 | 59 |
| French FOLS immigrant | 250 | 293 | 327 | 412 | 498 |
| French-English FOLS immigrant | 88 | 105 | 118 | 150 | 167 |
| Immigrants FOLS other | 254 | 266 | 262 | 290 | 310 |
| Native-born FOLS other | 617 | 627 | 606 | 642 | 662 |
| Non-permanent resident | 44 | 41 | 40 | 49 | 67 |
| Population (in thousands) | 1991 | 1996 | 2001 | 2006 | 2011 |
|---|---|---|---|---|---|
| French FOLS native-born | 892 | 880 | 880 | 875 | 837 |
| French-English FOLS native-born | 27 | 30 | 30 | 35 | 33 |
| French FOLS immigrant | 38 | 44 | 53 | 61 | 74 |
| French-English FOLS immigrant | 43 | 55 | 70 | 76 | 79 |
| Immigrants FOLS other | 3,670 | 4,207 | 4,619 | 5,198 | 5,647 |
| Native-born FOLS other | 15,334 | 16,141 | 16,703 | 17,344 | 18,160 |
| Non-permanent resident | 179 | 125 | 158 | 216 | 289 |
| Population | 1991 | 1996 | 2001 | 2006 | 2011 |
|---|---|---|---|---|---|
| French FOLS native-born | 13.9% | 13.5% | 13.3% | 13.0% | 12.3% |
| French-English FOLS native-born | 34.4% | 33.8% | 34.4% | 35.2% | 35.4% |
| French FOLS immigrant | 13.3% | 13.1% | 13.9% | 12.9% | 13.0% |
| French-English FOLS immigrant | 32.9% | 34.4% | 37.1% | 33.7% | 32.2% |
| Immigrants FOLS other | 93.5% | 94.1% | 94.6% | 94.7% | 94.8% |
| Native-born FOLS other | 96.1% | 96.3% | 96.5% | 96.4% | 96.5% |
| Non-permanent resident | 80.3% | 75.2% | 79.8% | 81.6% | 81.2% |
FOLS = Population of groups defined according to first official language spoken.
The category 'FOLS other' includes FOLS groups 'English' and 'neither English nor French'.
Sources: Statistics Canada, 1991 to 2006 Censuses, and 2011 National Household Survey.
Outside Quebec, French-speaking immigrants accounted for 11.7% of the French-speaking population as a whole and 2.0% of all immigrants (Table 1.2). According to two other alternative estimates, either counting only immigrants with French as their only official language spoken or adding those with French and English as a double official language, the relative weight of immigrants within the overall French-speaking population varies considerably. Thus, the percentage of immigrants within the French-speaking population outside Quebec was 8.2% in 2011—not considering those with French and English as a double first official language—and 15.0% when including them. The same applies to their relative weight within the immigrant population: 1.3% in 2011 according to the first calculation and 2.7% when French-English FOLS immigrants are included.
Outside Quebec, the relative weight of francophone immigrants within the French-speaking population as a whole has steadily increased since the 1991 Census according to all three estimates. According to the estimate in which there is redistribution of the French-English category, the percentage of French-speaking immigrants rose from 6.2% to 11.7% between 1991 and 2011. However, the change in their relative weight within the overall immigrant population was more moderate. According to the estimate with redistribution, there was a much smaller increase, from 1.6% in 1991 to 2.0% in 2011.
Table 1.2: Percentage of French-speaking immigrants within the total French official language population and within the immigrant population according to three estimations, Canada less Quebec, 1991 to 2011
| Year | French FOLS only | French FOLS (after redistributing the French-English category) | French and French-English FOLS |
|---|---|---|---|
| 1991 | 4.1% | 6.2% | 8.1% |
| 1996 | 4.8% | 7.5% | 9.9% |
| 2001 | 5.6% | 8.9% | 11.9% |
| 2006 | 6.5% | 10.0% | 13.1% |
| 2011 | 8.2% | 11.7% | 15.0% |
| Year | French FOLS only | French FOLS (after redistributing the French-English category) | French and French-English FOLS |
|---|---|---|---|
| 1991 | 1.0% | 1.6% | 2.2% |
| 1996 | 1.0% | 1.7% | 2.3% |
| 2001 | 1.1% | 1.8% | 2.6% |
| 2006 | 1.1% | 1.9% | 2.6% |
| 2011 | 1.3% | 2.0% | 2.7% |
FOLS = Population of groups defined according to first official language spoken.
Sources: Statistics Canada, 1991 to 2006 Censuses, and 2011 National Household Survey.
1.2 Geographic distribution
The francophone immigrant population is unequally distributed among the provinces and territories outside Quebec. The largest pool is found in Ontario, which accounts for almost 70% of all French-speaking immigrants living outside Quebec. Ontario is also the province with the majority of Canadian-born francophones outside Quebec, as well as the majority of immigrants residing outside Quebec (51.9% and 62.2% respectively) (Table 1.3). In the 2011 NHS, the French-speaking immigrant population in that province was 76,600, a much higher figure than in British Columbia, which had the second- largest francophone immigrant population (15,500). Alberta, which saw its share of the French FOLS immigrant population increase (from 8.0% in 2006 to 10.3% in 2011), ranked third with almost 12,000 individuals. The other provinces and territories fell well below this number. In New Brunswick, for example, the 2011 NHS enumerated only 3,500 French-speaking immigrants, or 3.1% of all francophone immigrants in Canada (outside Quebec), although that province accounts for more than 25% of all Canadian-born francophones outside Quebec.
The francophone immigrant population, as a proportion of the entire francophone population, was more than 25% In British Columbia and over 10% in three other provinces: Newfoundland and Labrador (10.9%), Ontario (14.8%) and Alberta (17.5%). After relative stability between 1991 and 2006, with proportions ranging between 3.0% and 5.0%, the Prairie provinces, more specifically Manitoba and Saskatchewan, posted an increase of more than 3 percentage points in the proportion of French FOLS immigrants between 2006 and 2011, from 5.1% to 8.3% in Manitoba and from 4.9% to 8.3% in Saskatchewan.
In New Brunswick—the province with the second largest number of francophones outside Quebec—French-speaking immigrants accounted for only 1.5% of the overall French-speaking population in the 2011 NHS (Chart 1.1, panel A).
Of all the provinces and territories excluding Quebec, New Brunswick has the highest relative share of francophone immigrants in the overall immigrant population at 12.2%. However, this share is smaller than the relative weight of the francophone population in that province, namely one-third. In the other provinces and territories, the corresponding percentage is much lower, mostly under 3%, particularly in Ontario (2.1%) and British Columbia (1.3%), the two provinces with the largest proportion of immigrants in their total population.
Table 1.3: Population and percentage distribution according to immigrant status and first official language spoken (FOLS) after redistribution of the French-English category for Canada, provinces (excluding Quebec) and the territories, 2011
| Province and territory (thousands) | Native-born French | Immigrants-French | Immigrants-Other |
|---|---|---|---|
| Newfoundland and Labrador | 1.5 | 0.2 | 9.0 |
| Prince Edward Island | 4.6 | 0.1 | 7.0 |
| Nova Scotia | 28.3 | 1.4 | 46.9 |
| New Brunswick | 227.6 | 3.5 | 25.0 |
| Ontario | 442.5 | 76.6 | 3,534.8 |
| Manitoba | 35.2 | 3.2 | 181.3 |
| Saskatchewan | 11.7 | 1.1 | 67.7 |
| Alberta | 55.4 | 11.7 | 632.4 |
| British Columbia | 43.7 | 15.5 | 1,176.4 |
| Yukon | 1.0 | 0.2 | 3.6 |
| Northwest Territories | 1.0 | 0.1 | 2.8 |
| Nunavut | 0.4 | 0.0 | 0.6 |
| Total | 852.9 | 113.5 | 5,687.3 |
| Province and territory (Percentage) | Native-born French | Immigrants-French | Immigrants-Other |
|---|---|---|---|
| Newfoundland and Labrador | 0.2% | 0.2% | 0.2% |
| Prince Edward Island | 0.5% | 0.1% | 0.1% |
| Nova Scotia | 3.3% | 1.2% | 0.8% |
| New Brunswick | 26.7% | 3.1% | 0.4% |
| Ontario | 51.9% | 67.5% | 62.2% |
| Manitoba | 4.1% | 2.8% | 3.2% |
| Saskatchewan | 1.4% | 0.9% | 1.2% |
| Alberta | 6.5% | 10.3% | 11.1% |
| British Columbia | 5.1% | 13.7% | 20.7% |
| Yukon | 0.1% | 0.2% | 0.1% |
| Northwest Territories | 0.1% | 0.1% | 0.0% |
| Nunavut | 0.1% | 0.0% | 0.0% |
| Total | 100.0% | 100.0% | 100.0% |
The category ‘FOLS other’ includes FOLS groups ‘English’ and ‘neither English nor French’.
Sources: Statistics Canada, 2011 National Household Survey
The change observed since the 1991 Census accounts for the interprovincial contrasts observed in 2011. This change over time reflects the increase in the proportion of francophone immigrants both in the French-speaking population and in the immigrant population. The trend is more marked in the former. For example, in British Columbia, where francophone immigrants made up 18% of the French-speaking population in 1991, that percentage rose to over 26% in 2011. A similar evolution is observed in Ontario, Alberta and the territories, which saw increases, respectively, from 8% to 15%, from 9% to 17.5% and from 5% to 11% between 1991 and 2011.
Chart 1.1: Proportion of French-speaking immigrants in the population for whom French is the first official language spoken and proportion of French FOLS immigrants in the immigrant population (after redistribution of the French-English category), provinces and territories excluding Quebec, 1991 to 2011
Panel A: Proportion of French-speaking immigrants in the population for whom French is the first official language spoken

Text version: Proportion of French-speaking immigrants in the population for whom French is the first official language spoken
| Province and territories | 1991 | 1996 | 2001 | 2006 | 2011 |
|---|---|---|---|---|---|
| N.L. | 6.2% | 11.1% | 10.2% | 10.9% | 10.9% |
| P.E.I. | 1.3% | 1.7% | 1.7% | 2.4% | 2.4% |
| N.S. | 3.4% | 3.1% | 3.8% | 4.0% | 4.6% |
| N.B. | 1.1% | 1.1% | 1.1% | 1.4% | 1.5% |
| Ont. | 7.9% | 9.5% | 11.6% | 12.8% | 14.8% |
| Man. | 3.8% | 3.7% | 4.2% | 5.1% | 8.3% |
| Sask. | 4.3% | 3.9% | 4.0% | 4.9% | 8.3% |
| Alta. | 8.6% | 9.6% | 10.2% | 12.7% | 17.5% |
| B.C. | 17.4% | 21.1% | 23.2% | 23.9% | 26.2% |
| TerritoriesChart 1.1 footnote * | 5.2% | 6.2% | 8.6% | 9.9% | 12.4% |
| Canada excluding Quebec | 6.2% | 7.5% | 8.9% | 10.0% | 13.3% |
Panel B: Proportion of French FOLS immigrants in the immigrant population

Text version: Proportion of French FOLS immigrants in the immigrant population
| Province and territories | 1991 | 1996 | 2001 | 2006 | 2011 |
|---|---|---|---|---|---|
| N.L. | 1.9% | 2.9% | 2.6% | 2.5% | 2.0% |
| P.E.I. | 1.6% | 2.0% | 2.2% | 2.6% | 1.6% |
| N.S. | 3.1% | 2.5% | 3.1% | 2.9% | 2.8% |
| N.B. | 10.9% | 11.3% | 11.9% | 12.8% | 12.2% |
| Ont. | 1.7% | 1.8% | 2.0% | 2.0% | 2.1% |
| Man. | 1.3% | 1.3% | 1.4% | 1.4% | 1.7% |
| Sask. | 1.5% | 1.3% | 1.4% | 1.5% | 1.5% |
| Alta. | 1.2% | 1.2% | 1.4% | 1.5% | 1.8% |
| B.C. | 1.2% | 1.3% | 1.3% | 1.3% | 1.3% |
| TerritoriesChart 1.1 footnote * | 2.0% | 2.5% | 3.2% | 4.1% | 4.3% |
| Canada excluding Quebec | 1.6% | 1.7% | 1.8% | 1.9% | 2.0% |
Sources: Statistics Canada, 1991 to 2006 censuses, and 2011 National Household Survey.
Immigrants are concentrated in Canada’s major metropolitan areas and the French-speaking immigrant population is no exception. Outside Quebec, the three urban areas with the largest population of French-speaking immigrants at the time of the 2011 NHS are, in descending order, Toronto, Ottawa and Vancouver. These three cities alone account for nearly three-quarters of francophone immigrants (after redistribution of the French-English category). Toronto has a population of 39,500 francophone immigrants compared with 52,000 French-speaking persons born in Canada (Table 1.4), accounting for 43% of that city’s francophone population. In Vancouver, more than one-third of French-speaking persons are immigrants. In Ottawa, there are 23,200 French-speaking immigrants compared with 131,500 Canadian-born French speakers, representing 15% of the francophone population. The other cities have much smaller populations of French-speaking immigrants. Calgary ranks fourth with close to 5,700 French-speaking immigrants and Edmonton ranks fifth with 4,900. The rest of the cities follow, none with more than 3,000 francophone immigrants. Some cities with a large francophone population, such as Moncton, Sudbury and Edmundston, have at most 1,500 French-speaking immigrants. These cities also receive relatively few immigrants in general.
Statistics from the 2011 NHS show that for all the provinces and territories excluding Quebec, the number of immigrants with a double official language (French-English FOLS) is larger than the number of immigrants whose first official language is French (79,400 versus 74,500). This is also the situation in British Columbia (11,600 versus 9,600), Ontario (55,200 versus 49,600) and Alberta (8,700 versus 7,500), as well as in some census metropolitan areas (CMAs), including Toronto and Vancouver (Table 1.4). Although this is an important characteristic described in the 2010 version of this study, the extent of the differences between the two sub-populations diminished between 2006 and 2011, especially in the CMAs. In 2011, there were 22,700 French FOLS immigrants and 33,600 French-English FOLS immigrants in Toronto. In Calgary, the gap narrowed to less than 1,000 persons, and in Hamilton, the French FOLS immigrant population was equal in size to the population of French-English FOLS immigrants.
As with the situation at the provincial level, the change since the 1991 Census accounts for the contrasts observed in 2011 between census metropolitan areas. It reflects the increase in the proportion of French-speaking immigrants in both the francophone population and the immigrant population. (Table 1.4; Charts 1.2-a and b). An increase is also seen in four large cities: Toronto, Ottawa, Calgary and Vancouver. Between the 1991 Census and the 2011 NHS, the relative weight of French-speaking immigrants within the total francophone population rose from 31% to 43% in the Toronto CMA, from 26% to 37% in Vancouver and from 8% to 15% in Ottawa. In Calgary, the percentage of francophone immigrants in the total francophone population grew from 16% to more than 25% between 1991 and 2011. When compared with 1991, Moncton and Winnipeg also saw their respective proportions of immigrants increase in 2011, to 2.6% and 10.3% respectively.
An analysis of how the percentage of these immigrants within the overall immigrant population has changed over time reveals great stability over the study period (Chart 1.2 b). However, whereas the 2006 Census showed an increase in the proportion of francophone immigrants within the immigrant population of Moncton, which rose from 15.3% in 1991 to 24.3% in 2006, the 2011 NHS shows a decrease in their proportion to 19.7%. This is due to a larger increase of non-francophone immigration to that city between 2006 and 2011. Steady growth was only seen in the Ottawa CMA. Elsewhere, especially in the largest urban centres such as Toronto and Vancouver, immigrants whose first official language is French make up less than 2% of the immigrant population.
Table 1.4: Population count according to immigrant status and first official language spoken (FOLS) (before and after equal redistribution of the French-English category), and the percentage of French-speaking immigrants within the total French-speaking population and within the total immigrant population, for selected census metropolitan areas, 2011
| Census metropolitan area (CMA) | CMA total population | Native-born French FOLS | Native-born French and English FOLS | Immigrants French FOLS | Immigrants French and English FOLS | Other immigrants |
|---|---|---|---|---|---|---|
| Toronto | 5,521.2 | 45.9 | 12.2 | 22.7 | 33.6 | 2,481.1 |
| Ottawa | 1,215.7 | 128.6 | 5.8 | 17.3 | 11.8 | 175.3 |
| Vancouver | 2,280.7 | 18.1 | 3.7 | 6.5 | 10.1 | 896.8 |
| Calgary | 1,199.1 | 15.3 | 1.0 | 3.5 | 4.4 | 306.0 |
| Edmonton | 1,139.6 | 20.0 | 1.1 | 3.2 | 3.4 | 225.6 |
| Hamilton | 708.2 | 8.2 | 0.6 | 2.0 | 2.0 | 162.7 |
| Winnipeg | 714.6 | 23.1 | 0.6 | 2.0 | 1.4 | 143.9 |
| Windsor | 315.5 | 8.6 | 0.6 | 1.0 | 1.5 | 67.8 |
| Kitchener | 469.9 | 5.4 | 0.5 | 0.7 | 1.6 | 106.3 |
| London | 467.3 | 5.3 | 0.5 | 0.8 | 1.2 | 85.7 |
| Victoria | 336.2 | 4.4 | 0.2 | 1.0 | 0.4 | 58.7 |
| Moncton | 135.5 | 44.6 | 0.2 | 1.1 | 0.2 | 4.7 |
| St. Catharines-Niagara | 384.0 | 10.6 | 0.3 | 0.9 | 0.6 | 62.9 |
| Halifax | 384.5 | 9.0 | 0.2 | 0.7 | 0.6 | 29.9 |
| Oshawa | 351.7 | 5.4 | 0.2 | 0.6 | 0.3 | 55.3 |
| Kingston | 153.9 | 4.3 | 0.1 | 0.4 | 0.2 | 17.5 |
| Greater Sudbury | 158.3 | 39.4 | 0.4 | 0.4 | 0.1 | 9.3 |
| Kelowna | 176.4 | 2.0 | 0.1 | 0.3 | 0.1 | 24.0 |
| Edmundston (CA) | 21.1 | 19.7 | 0.0 | 0.4 | 0.0 | 0.2 |
| Guelph | 139.7 | 1.8 | 0.1 | 0.1 | 0.2 | 27.2 |
| Census metropolitan area (CMA) | CMA total population | Native-born French FOLS | Immigrants French FOLS | Other immigrants |
|---|---|---|---|---|
| Toronto | 5,521.2 | 52.0 | 39.5 | 2,497.9 |
| Ottawa | 1,215.7 | 131.5 | 23.2 | 181.2 |
| Vancouver | 2,280.7 | 19.9 | 11.5 | 901.8 |
| Calgary | 1,199.1 | 15.8 | 5.7 | 308.2 |
| Edmonton | 1,139.6 | 20.6 | 4.9 | 227.3 |
| Hamilton | 708.2 | 8.5 | 3.0 | 163.7 |
| Winnipeg | 714.6 | 23.4 | 2.7 | 144.6 |
| Windsor | 315.5 | 8.9 | 1.8 | 68.5 |
| Kitchener | 469.9 | 5.6 | 1.6 | 107.2 |
| London | 467.3 | 5.5 | 1.4 | 86.3 |
| Victoria | 336.2 | 4.5 | 1.1 | 58.9 |
| Moncton | 135.5 | 44.7 | 1.2 | 4.8 |
| St. Catharines-Niagara | 384.0 | 10.7 | 1.2 | 63.2 |
| Halifax | 384.5 | 9.0 | 1.0 | 30.2 |
| Oshawa | 351.7 | 5.5 | 0.7 | 55.4 |
| Kingston | 153.9 | 4.4 | 0.5 | 17.6 |
| Greater Sudbury | 158.3 | 39.6 | 0.4 | 9.4 |
| Kelowna | 176.4 | 2.1 | 0.4 | 24.0 |
| Edmundston (CA) | 21.1 | 19.7 | 0.4 | 0.2 |
| Guelph | 139.7 | 1.8 | 0.2 | 27.3 |
| Census metropolitan area (CMA) | Immigrants French FOLS within the total French FOLS population | Immigrants French FOLS within the total immigrant population |
|---|---|---|
| Toronto | 43% | 2% |
| Ottawa | 15% | 11% |
| Vancouver | 37% | 1% |
| Calgary | 27% | 2% |
| Edmonton | 19% | 2% |
| Hamilton | 26% | 2% |
| Winnipeg | 10% | 2% |
| Windsor | 17% | 3% |
| Kitchener | 22% | 1% |
| London | 20% | 2% |
| Victoria | 20% | 2% |
| Moncton | 3% | 20% |
| St. Catharines-Niagara | 10% | 2% |
| Halifax | 10% | 3% |
| Oshawa | 12% | 1% |
| Kingston | 10% | 3% |
| Greater Sudbury | 1% | 4% |
| Kelowna | 16% | 2% |
| Edmundston (CA) | 2% | 64% |
| Guelph | 12% | 1% |
FOLS = Population according to first official language spoken.
CMA = Census metropolitan area.
The category 'FOLS other' includes FOLS groups 'English' and 'neither English nor French'.
Source: Statistics Canada, 2011 National Household Survey.
Chart 1.2: Proportion of immigrants for whom French is the first official language in the French-speaking population (after redistribution of the French-English category) and in the immigrant population, selected census metropolitan areas outside Quebec, 1991 to 2011
Panel A: Proportion of French-speaking immigrants in the French-speaking population
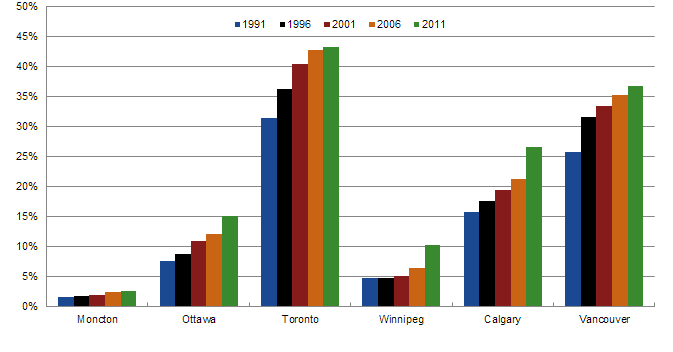
Text version: Proportion of French-speaking immigrants in the French-speaking population
| City | 1991 | 1996 | 2001 | 2006 | 2011 |
|---|---|---|---|---|---|
| Moncton | 1.5% | 1.7% | 1.8% | 2.4% | 2.6% |
| Ottawa | 7.5% | 8.7% | 10.9% | 12.0% | 15.0% |
| Toronto | 31.4% | 36.2% | 40.3% | 42.7% | 43.2% |
| Winnipeg | 4.6% | 4.6% | 5.1% | 6.4% | 10.3% |
| Calgary | 15.7% | 17.5% | 19.3% | 21.1% | 26.5% |
| Vancouver | 25.7% | 31.5% | 33.4% | 35.2% | 36.6% |
Sources: Statistics Canada, 1991 to 2006 censuses, and 2011 National Household Survey.
Panel B: Proportion of French-speaking immigrants in the immigration population

Text version: Proportion of French-speaking immigrants in the immigration population
| City | 1991 | 1996 | 2001 | 2006 | 2011 |
|---|---|---|---|---|---|
| Moncton | 15.3% | 16.6% | 21.4% | 24.3% | 19.7% |
| Ottawa | 8.1% | 8.5% | 9.5% | 10.3% | 11.3% |
| Toronto | 1.4% | 1.4% | 1.6% | 1.6% | 1.6% |
| Winnipeg | 1.3% | 1.2% | 1.3% | 1.5% | 1.8% |
| Calgary | 1.2% | 1.3% | 1.5% | 1.5% | 1.8% |
| Vancouver | 1.3% | 1.4% | 1.4% | 1.3% | 1.3% |
Sources: Statistics Canada, 1991 to 2006 censuses, and 2011 National Household Survey.
1.3 Distribution in four census metropolitan areas (CMAs)
The numbers and proportion of the francophone population in the provinces and territories outside Quebec vary greatly from one region to the next and from one CMA to another. Within a given area, francophone immigrants do not necessarily live in the same area as Canadian-born francophones. These immigrants tend to settle in the same places as most other immigrants, and not always in areas with the greatest concentrations of Canadian-born francophones. Consequently, close to three-quarters (74.3%) of francophone immigrants live in the five largest census metropolitan areas outside Quebec: Toronto, Vancouver, Calgary, Edmonton and Ottawa.
What is happening at a more specific geographic level? In the large cities, do francophone immigrants settle in the same areas as the Canadian-born francophone population? Four metropolitan areas with both a sizable Canadian-born francophone population and francophone immigrant population were selected to examine the distribution of the francophone population within them. These CMAs are Ottawa (Ontario side only), Toronto, Winnipeg and Vancouver. For each of these CMAs, two maps were produced at the census tract level, with one map showing the geographic distribution of the Canadian-born francophone population and the other showing the distribution of francophone immigrants.
According to the 2011 Census Dictionary, “Census tracts (CTs) are small, relatively stable geographic areas that usually have a population between 2,500 and 8,000 persons. They are located in census metropolitan areas and in census agglomerations that had a core population of 50,000 or more in the previous census.” CTs follow permanent and easily recognizable physical features, such as rivers and roads, as closely as possible; they are as homogeneous as possible in terms of socioeconomic characteristics; and they are as compact as possible. Toronto has 1,076 CTs, Ottawa (Ontario side) has 201, Winnipeg has 170 and Vancouver has 453.
The representation selected for the population distribution by census tract is as follows. The population of each francophone group (Canadian-born or immigrants) in each CT and each CMA was divided by the total population of the group living in the CMA, and the result was multiplied by 100 so that all the CTs for a given group in the same CMA sum to 100%. The percentages were grouped into four intervals specific to each CMA. An advantage of this representation is that the same scale can be used for each city. On the maps, the darker the colour, the higher the number of francophones living in the CT. The legend indicates the scale used, the number of CTs and the percentage of the total population corresponding to each interval of the scale.
Two maps are provided for each CMA. The first map shows the distribution of the Canadian-born francophone population, while the second shows the distribution of francophone immigrants. The maps are numbered 1.1 to 1.8. The first two maps (maps 1.1 and 1.2) are of Ottawa. A comparison of the two maps shows that Canadian-born francophones are primarily concentrated in the eastern part of the CMA, from Vanier to Rockland in the east and Embrun in the southeast. Francophone immigrants live primarily in the more highly populated areas, and very few of them have chosen the suburbs furthest from the centre.
Toronto’s situation is similar to that of Ottawa (maps 1.3 and 1.4). A significant proportion of Canadian-born francophones who have settled in this Canadian metropolis live in suburbs far from the city, in the region of Acton, Orangeville and Newmarket. Other concentrations can be seen in Oakville, Mississauga and Brampton in the south and in Pickering and Ajax in the north. The francophone immigrant population for the most part lives in Toronto itself, as well as in Mississauga and Brampton.
In Winnipeg, Canadian-born francophones are largely concentrated in St-Boniface on the eastern shore of the Red River and in the southern suburbs of the CMA, toward St-Norbert. The immigrants are more dispersed, although they tend to live in the most densely populated tracts (maps 1.5 and 1.6).
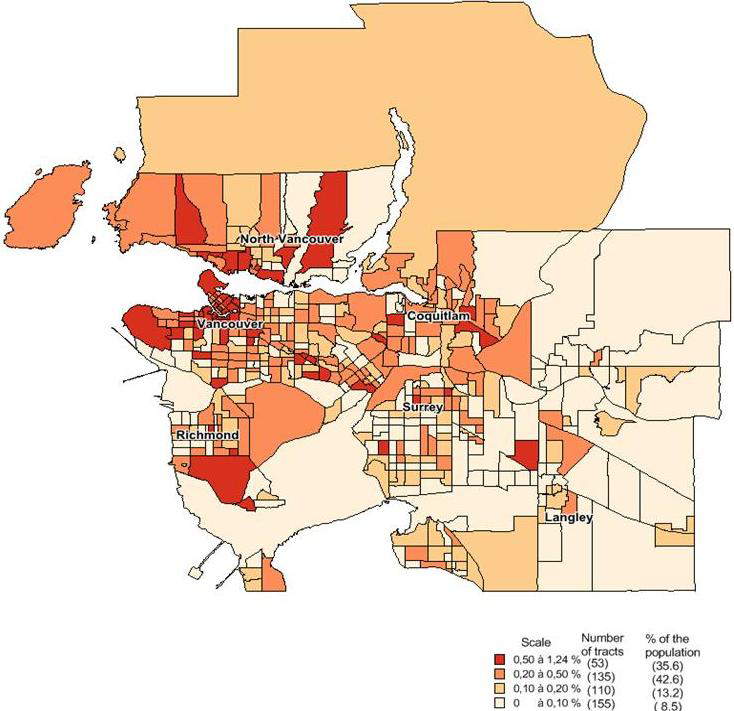
Vancouver is different from Ottawa, Toronto and Winnipeg. Unlike in those three cities, the distribution of the two francophone groups seems to be quite similar in Vancouver (maps 1.7 and 1.8). However, as can be seen, a higher proportion of Canadian-born francophones than immigrants are located in the southeastern part of the city, toward Coquitlam, Surrey and especially Langley and the surrounding areas. Francophone immigrants are more concentrated in North and West Vancouver, as well as in Vancouver itself.
In conclusion, an analysis of the types of occupation in the four urban areas studied reveals that Canadian-born francophones are more likely to settle in the remote suburbs than immigrants, which may mean that Canadian-born francophones settled there earlier. Francophones born in Canada tend to form settlement clusters in Ottawa and Winnipeg, and are more spread out throughout the CMA area in Toronto and Vancouver.
Francophone immigrants live primarily in the most densely populated areas of the cities. In this regard, only Vancouver is different from the other three urban centres, in that immigrants also live in the remote suburbs.
In summary, the francophone immigrant population living outside Quebec is relatively small, both in absolute numbers and in relation to the total French-speaking population or the total immigrant population. However, the relative weight of francophone immigrants within the French-speaking population increased from 6.2% to 11.7% between 1991 and 2011, while its weight within the immigrant population saw a more moderate change, at 2% in 2011.
The majority of francophone immigrants outside Quebec (67.5%) are concentrated in Ontario. Also, three-quarters of French-speaking immigrants live in three urban areas: Toronto, Ottawa and Vancouver.
We have seen that the francophone immigrant population outside Quebec consists of two groups: those with French only as their first official language spoken (French FOLS immigrants) and, based on the Method 1 algorithm used to determine the first official language spoken, those with both French and English as their FOLS (French-English FOLS immigrants). There are slightly more French-English FOLS immigrants than French FOLS immigrants (79,400 versus 74,500 in 2011). In some cities, particularly Toronto, Vancouver and Calgary, the bigger population of French-English FOLS immigrants is more pronounced. As the following sections will show, these two FOLS groups have demographic and socioeconomic characteristics that are sometimes quite different.
Map 1.1: Percentage distribution of the Francophone population born in Canada in the Ottawa census metropolitan area, by census tract
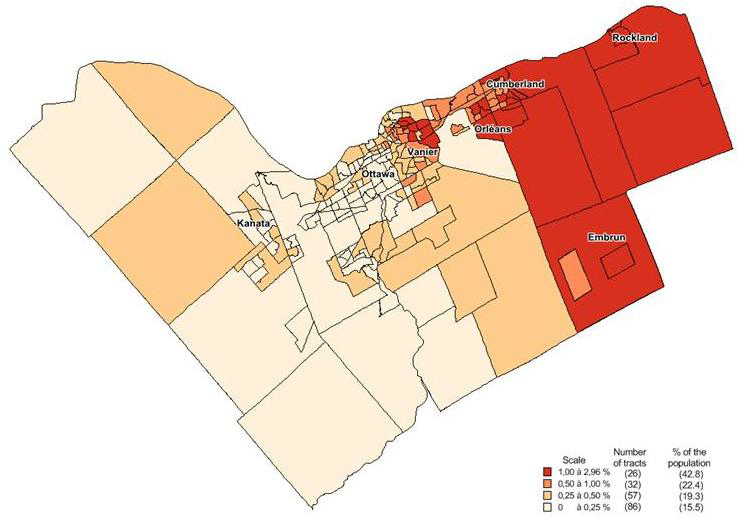
Text version: Percentage distribution of the Francophone population born in Canada in the Ottawa census metropolitan area, by census tract
Percentage distribution of the population of Canadian-born Francophones in the Ottawa census metropolitan area (CMA), Ontario side only, by census tract.
The map represents 201 census tracts. It illustrates the distribution of the population grouped into four categories.
There are 26 tracts, representing 42.8% of the population of Canadian-born Francophones, in which Canadian-born Francophones account for between 1% and 2.96% of the population.
There are 32 tracts, representing 22.4% of the population of Canadian-born Francophones, in which Canadian-born Francophones account for between 0.5% and 1% of the population.
There are 57 tracts, representing 19.3% of the population of Canadian-born Francophones, in which Canadian-born Francophones account for between 0.25% and 0.5% of the population.
There are 86 tracts, representing 15.5% of the population of Canadian-born Francophones, in which Canadian-born Francophones account for between 0% and 0.25% of the population.
The zones with the highest concentration of Canadian-born Francophones are found in the Vanier neighbourhood and in the eastern area of the CMA, including Orleans, Rockland, and Embrun.
Source(s): Statistics Canada, Census of 2011.
Map 1.2: Percentage distribution of the Francophone immigrant population in the Ottawa census metropolitan area, by census tract
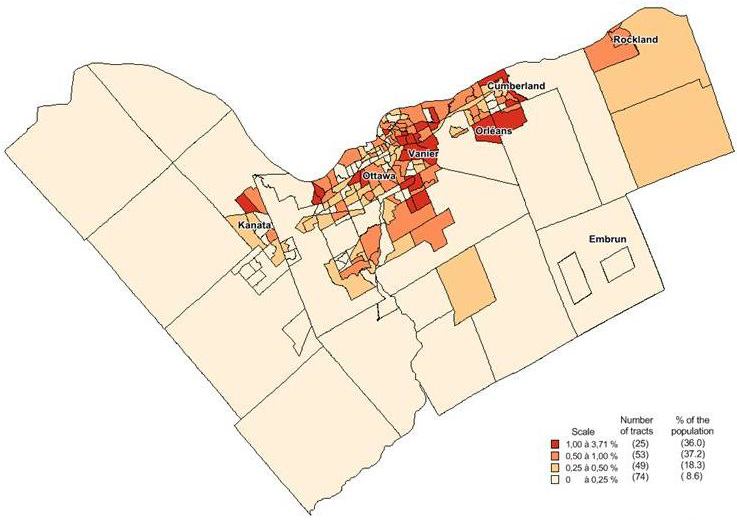
Text version: Percentage distribution of the Francophone immigrant population in the Ottawa census metropolitan area, by census tract
Percentage distribution of the population of immigrant Francophones in the Ottawa census metropolitan area (CMA), Ontario side only, by census tract.
The map represents 201 census tracts. It illustrates the distribution of the population grouped into four categories.
There are 25 tracts, representing 36.0% of the population of immigrant Francophones, in which immigrant Francophones account for between 1% and 3.71% of the population.
There are 53 tracts, representing 37.2% of the population of immigrant Francophones, in which immigrant Francophones account for between 0.5% and 1% of the population.
There are 49 tracts, representing 18.3% of the population of immigrant Francophones, in which immigrant Francophones account for between 0.25% and 0.5% of the population.
There are 74 tracts, representing 8.6% of the population of immigrant Francophones, in which immigrant Francophones account for between 0% and 0.25% of the population.
The zones with the highest concentration of immigrant Francophones are located in the most densely populated areas of Ottawa proper, including Vanier, Kanata, Orleans and Cumberland.
Source(s): Statistics Canada, Census of 2011.
Map 1.3: Percentage distribution of the Francophone population born in Canada in the Toronto census metropolitan area, by census tract
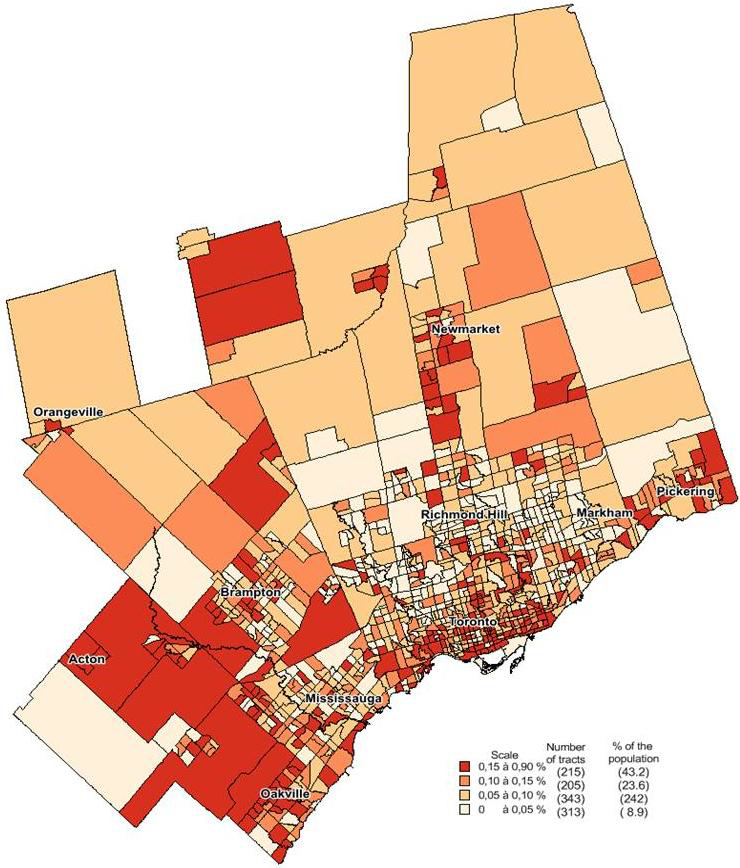
Text version: Percentage distribution of the Francophone population born in Canada in the Toronto census metropolitan area, by census tract
Percentage distribution of the population of Canadian-born Francophones in the Toronto census metropolitan area (CMA), by census tract.
The map represents 1076 census tracts. It illustrates the distribution of the population grouped into four categories.
There are 215 tracts, representing 43.2% of the population of Canadian-born Francophones, in which Canadian-born Francophones account for between 0.15% and 0.9% of the population.
There are 205 tracts, representing 23.6% of the population of Canadian-born Francophones, in which Canadian-born Francophones account for between 0.1% and 0.15% of the population.
There are 343 tracts, representing 24.2% of the population of Canadian-born Francophones, in which Canadian-born Francophones account for between 0.05% and 0.1% of the population.
There are 313 tracts, representing 8.9% of the population of Canadian-born Francophones, in which Canadian-born Francophones account for between 0% and 0.05% of the population.
The zones with the highest concentration of Canadian-born Francophones are in the belt around the City of Toronto: Mississauga, Oakville, Brampton, Acton, Orangeville, Newmarket and Pickering.
Source(s): Statistics Canada, Census of 2011.
Map 1.4: Percentage distribution of the Francophone immigrant population in the Toronto census metropolitan area, by census tract

Text version: Percentage distribution of the Francophone immigrant population in the Toronto census metropolitan area, by census tract
Percentage distribution of the population of immigrant Francophones in the Toronto census metropolitan area (CMA), by census tract.
The map represents 1076 census tracts. It illustrates the distribution of the population grouped into four categories.
There are 210 tracts, representing 46.4% of the population of immigrant Francophones, in which immigrant Francophones account for between 0.15% and 0.65% of the population.
There are 210 tracts, representing 24.1% of the population of immigrant Francophones, in which immigrant Francophones account for between 0.1% and 0.15% of the population.
There are 288 tracts, representing 19.7% of the population of immigrant Francophones, in which immigrant Francophones account for between 0.05% and 0.1% of the population.
There are 368 tracts, representing 9.8% of the population of immigrant Francophones, in which immigrant Francophones account for between 0% and 0.05% of the population.
The zones with the highest concentration of immigrant Francophones are in the central area of the CMA: Toronto, Mississauga, Brampton and Newmarket.
Source(s): Statistics Canada, Census of 2011.
Map 1.5: Percentage distribution of the Francophone population born in Canada in the Winnipeg census metropolitan area, by census tract

Text version: Percentage distribution of the Francophone population born in Canada in the Winnipeg census metropolitan area, by census tract
Percentage distribution of the population of Canadian-born Francophones in the Winnipeg census metropolitan area (CMA), by census tract.
The map represents 167 census tracts. It illustrates the distribution of the population grouped into four categories.
There are 28 tracts, representing 63.1% of the population of Canadian-born Francophones, in which Canadian-born Francophones account for between 1% and 6.57% of the population.
There are 19 tracts, representing 11.7% of the population of Canadian-born Francophones, in which Canadian-born Francophones account for between 0.5% and 1% of the population.
There are 45 tracts, representing 15.9% of the population of Canadian-born Francophones, in which Canadian-born Francophones account for between 0.25% and 0.5% of the population.
There are 75 tracts, representing 11.1% of the population of Canadian-born Francophones, in which Canadian-born Francophones account for between 0% and 0.25% of the population.
The zones with the highest concentration of Canadian-born Francophones are east of the Red River, as in St. Boniface, and in the south, as in St. Norbert.
Source(s): Statistics Canada, Census of 2011.
Map 1.6: Percentage distribution of the Francophone immigrant population in the Winnipeg census metropolitan area, by census tract

Text version: Percentage distribution of the Francophone immigrant population in the Winnipeg census metropolitan area, by census tract
Percentage distribution of the population of immigrant Francophones in the Winnipeg census metropolitan area (CMA), by census tract.
The map represents 170 census tracts. It illustrates the distribution of the population grouped into four categories.
There are 37 tracts, representing 67.3% of the population of immigrant Francophones, in which immigrant Francophones account for between 1% and 4.53% of the population.
There are 23 tracts, representing 16.7% of the population of immigrant Francophones, in which immigrant Francophones account for between 0.5% and 1% of the population.
There are 33 tracts, representing 11.9% of the population of immigrant Francophones, in which immigrant Francophones account for between 0.25% and 0.5% of the population.
There are 77 tracts, representing 4.3% of the population of immigrant Francophones, in which immigrant Francophones account for between 0% and 0.25% of the population.
The zones with the highest concentration of immigrant Francophones are on both sides of the Red River, which cuts through the CMA from south to north, including St. Boniface, Fort Richmond in the south, and River East in the north.
Source(s): Statistics Canada, Census of 2011.
Map 1.7: Percentage distribution of the Francophone population born in Canada in the Vancouver census metropolitan area, by census tract

Text version: Percentage distribution of the Francophone population born in Canada in the Vancouver census metropolitan area, by census tract
Percentage distribution of the population of Canadian-born Francophones in the Vancouver census metropolitan area (CMA), by census tract.
The map represents 453 census tracts. It illustrates the distribution of the population grouped into four categories.
There are 35 tracts, representing 21.9% of the population of Canadian-born Francophones, in which Canadian-born Francophones account for between 0.5% and 1.22% of the population.
There are 173 tracts, representing 53% of the population of Canadian-born Francophones, in which Canadian-born Francophones account for between 0.2% and 0.5% of the population.
There are 123 tracts, representing 18.1% of the population of Canadian-born Francophones, in which Canadian-born Francophones account for between 0.1% and 0.2% of the population.
There are 122 tracts, representing 7% of the population of Canadian-born Francophones, in which Canadian-born Francophones account for between 0% and 0.1% of the population.
The zones with the highest concentration of Canadian-born Francophones lie along an axis running from North Vancouver in the west through Surrey to Langley.
Source(s): Statistics Canada, Census of 2011.
Map 1.8: Percentage distribution of the Francophone immigrant population in the Vancouver census metropolitan area, by census tract
Text version: Percentage distribution of the Francophone immigrant population in the Vancouver census metropolitan area, by census tract
Percentage distribution of the population of immigrant Francophones in the Vancouver census metropolitan area (CMA), by census tract.
The map represents 453 census tracts. It illustrates the distribution of the population grouped into four categories.
There are 53 tracts, representing 35.6% of the population of immigrant Francophones, in which immigrant Francophones account for between 0.5% and 1.24% of the population.
There are 135 tracts, representing 42.6% of the population of immigrant Francophones, in which immigrant Francophones account for between 0.2% and 0.5% of the population.
There are 110 tracts, representing 13.2% of the population of immigrant Francophones, in which immigrant Francophones account for between 0.1% and 0.2% of the population.
There are 155 tracts, representing 8.5% of the population of immigrant Francophones, in which immigrant Francophones account for between 0% and 0.1% of the population.
The zones with the highest concentration of immigrant Francophones are in North Vancouver and Vancouver proper, extending as far as Coquitlam.
Source(s): Statistics Canada, Census of 2011.
2 Geographic origins of French-speaking immigrants
Where do French-speaking immigrants come from, and has there been a change in the source countries of immigration in recent years? In this report, geographic origin refers to the place of birth (a country, geographic area or continent), since the country of birth is the only information that the censuses and the National Household Survey provide on immigrants’ origins. Three themes are of interest here: origins as such, either immigrants’ country or region of birth; identification with visible minority groups; and the period when they received permanent residence (presumed period of arrival in Canada).
2.1 Country or region of birth
The geographic origin of immigrants has changed substantially in recent decades, as new waves of immigrants from Asia and Africa gradually replaced European immigrants. This trend is observed for immigrant groups defined according to French or English as the first official language spoken (FOLS). However, the immigrant population whose first official language spoken is French only (French FOLS) stands out because the same set of countries, led by France, fed this group in both 1991 and 2011 (Table 2.1). During this period, the same eight countries ranked among the 10 countries that contributed the most to the immigrant population with French as their first official language. In addition to France, there is Haiti, the United States,Footnote 3 Mauritius, Morocco, Belgium, Lebanon and Egypt. In 1991, Italy and Switzerland were part of this group, but they were replaced in 2011 by the Democratic Republic of Congo (formerly Zaire) and Algeria.
As for immigrants with a double official language spoken (French-English FOLS), five of the top 10 countries of origin in 1991 were in Europe (Italy, Poland, Portugal, West Germany and Romania); 20 years later, four of them were still a country of origin. While Romania ranked seventh in 1991, it was in first place in 2011 with 6,300 French-English FOLS immigrants. New—and large—source countries of immigration, such as the People’s Republic of China and India, joined the group of the top 10 countries. The geographic origins of other immigrants (non-francophones) also changed between the 1991 Census and the 2011 NHS. In 1991, the top four source countries were the United Kingdom, Italy, the United States and the reunified Germany, but in 2011, the People’s Republic of China, India and the Philippines climbed into the lead alongside the United Kingdom.
Another characteristic of the geographic origins of French-speaking immigrants is that the top 10 contributing countries account for a large portion of all immigrants in this linguistic group. In 2011, two-thirds of these immigrants came from those 10 countries, compared with 77% in 1991. This decrease in the relative weight of the top 10 immigration source countries in relation to all immigration source countries is due to the diversification of the origins of new immigrants from the Middle East, Africa and Latin America. This trend is also observed in the other two linguistic groups, in which the contribution of Asian countries is much greater. In 2011, 54% of non-francophone immigrants came from the top 10 immigration source countries, compared with 60% in 1991. In the French-English FOLS immigrant group, the corresponding percentages were respectively 40% and 56%.
Table 2.1: Top ten countries of birth for immigrants according to first official language spoken (FOLS) and percentage that the top ten countries represent in relation to the total immigrants in each group, Canada less Quebec, 1991 and 2011
| Country | Population |
|---|---|
| FranceTable 2.1 footnote * | 11,225 |
| United States | 4,230 |
| Belgium | 2,700 |
| Haiti | 2,225 |
| Lebanon | 1,740 |
| Mauritius | 1,665 |
| Morocco | 1,640 |
| Egypt | 1,450 |
| Italy | 1,250 |
| Switzerland | 1,235 |
| Top 10 countries represent in relation to the total | 76.8% |
| Country | Population |
|---|---|
| FranceTable 2.1 footnote * | 16,050 |
| Haiti | 7,220 |
| Congo (Democratic Republic) | 6,380 |
| Mauritius | 3,980 |
| United States | 3,630 |
| Morocco | 3,515 |
| Lebanon | 2,555 |
| Belgium | 2,340 |
| Algeria | 2,025 |
| Egypt | 1,905 |
| Top 10 countries represent in relation to the total | 66.6% |
| Country | Population |
|---|---|
| Lebanon | 4,045 |
| Italy | 3,780 |
| Poland | 3,095 |
| Portugal | 2,930 |
| Viet Nam | 2,535 |
| Germany (FRG) | 1,830 |
| Romania | 1,780 |
| Hong Kong | 1,605 |
| Iran | 1,485 |
| Egypt | 1,165 |
| Top 10 countries represent in relation to the total | 56.3% |
| Country | Population |
|---|---|
| Romania | 6,365 |
| China (People's Republic) | 4,520 |
| Lebanon | 4,360 |
| Iran | 3,235 |
| India | 3,125 |
| Colombia | 2,310 |
| Russia | 2,075 |
| Viet Nam | 2,065 |
| Italy | 1,945 |
| Poland | 1,940 |
| Top 10 countries represent in relation to the total | 40.2% |
| Country | Population |
|---|---|
| United Kingdom | 691,360 |
| Italy | 267,895 |
| United States | 216,790 |
| Germany (FRG) | 165,305 |
| India | 163,090 |
| Poland | 162,240 |
| China (People's Republic) | 146,275 |
| Hong Kong | 145,700 |
| Portugal | 133,325 |
| Netherlands | 125,390 |
| Top 10 countries represent in relation to the total | 60.4% |
| Country | Population |
|---|---|
| India | 527,455 |
| United Kingdom | 521,745 |
| China (People's Republic) | 496,725 |
| Philippines | 430,690 |
| United States | 232,375 |
| Hong Kong | 199,070 |
| Italy | 196,295 |
| Pakistan | 146,240 |
| Germany | 139,505 |
| Poland | 138,375 |
| Top 10 countries represent in relation to the total | 53.6% |
FOLS = Population of groups defined according to first official language spoken. The category 'FOLS other' includes FOLS groups 'English' and 'neither English nor French'.
Sources: Statistics Canada, 1991 Census, and 2011 National Household Survey.
As can be seen in Table 2.1, French FOLS immigrants come from countries where French is either the only official language of the country (France) or one of the official languages (Haiti, Belgium, Switzerland), or from countries where there are French speakers mainly on account of the colonial history of France and Belgium (Mauritius, Morocco, Democratic Republic of Congo, Lebanon, Algeria). The Organisation internationale de la francophonie (OIF) classifies its member countries into two major categories: those for which French is an official language (alone or with other languages) and those for which there are a certain number of French speakers. In total, the OIF has over 50 member states, including Canada. For the following analysis by geographic area of origin, we have added countries with a Romance language other than French to these two groups, since the knowledge of a Romance language (such as Italian, Spanish and Portuguese) tends to make it easier to learn French, also a Romance language. The list of countries in these three groups is provided in Appendix B.
Of francophone immigrants (French FOLS), 58% come from a country where French is the official language (Chart 2.1). This proportion steadily increased between 1991 and 2011. Just under 25% came from countries where French is present, and a smaller percentage (less than 10%) from countries with a Romance language (other than French). There was little change between 1991 and 2011 in the distribution of the immigrant population by geographic area of origin based on the status of French in the country (with a distinction made for countries with a Romance language other than French). However, the period between 2006 and 2011 is an exception, since it was characterized by an increase of more than five percentage points in the number of immigrants from countries where French is an official language, while the other three groups saw a decrease in percentage. Approximately 50% of immigrants with a double official language (French-English FOLS) come from countries where French has no status or where the official language is not a Romance language other than French. However, immigrants from countries where French is present (but without official status) constituted 30% of the French-English FOLS group between 1991 and 2011, while 17% came from Romance-language countries. This latter percentage declined during the period in question, except between 2006 and 2011, when a slight increase is observed. The majority of non-francophone immigrants came from non-francophone and non-Latin countries. Less than 1% of them came from a country where French is an official language, and 7% from a country where French is present.
As previously mentioned, the main change observed in recent decades was a considerable reduction in the proportion of immigrants born on the European continent. This trend prevailed in all three groups defined by first official language spoken. For each group, the relative weight of European immigrants decreased between 1991 and 2011, from approximately 50% to less than 35% (Charts 2.2-a, b, c).
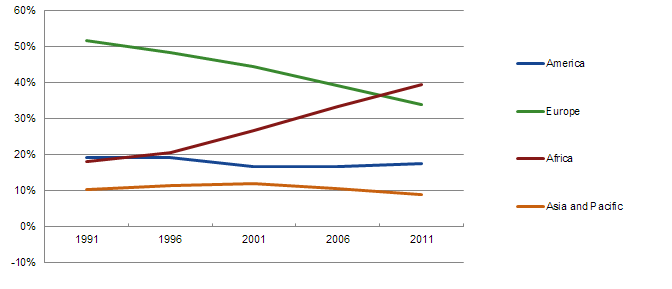
The trend for both French-English FOLS immigrants and non-francophone immigrants was marked by a steady increase in the proportion of immigrants from Asia and the Pacific region (from 20% to nearly 50%) and by a slight increase in the proportion of immigrants from the Americas and Africa (approximately 20% of all immigrants in 2011). The sub-population of French FOLS immigrants stands out from the other sub-populations. The weight of Europeans has naturally decreased, but this decrease was mainly in favour of immigrants from Africa. In 1991, Africans accounted for 20% of all French-speaking immigrants, and that percentage steadily rose to close to 40% in 2011, six percentage points more than at the time of the 2006 Census. During the same period, immigrants from Asia, the Pacific region and from the Americas saw their relative share decrease slightly.
Chart 2.1: Percentage of immigrants with first official language spoken (FOLS) according to country of origin, Canada excluding Quebec, 1991 to 2011
Immigrants French FOLS
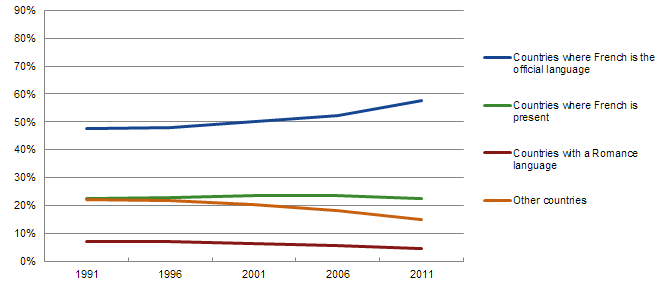
Text version: Immigrants French FOLS
| Category | 1991 | 1996 | 2001 | 2006 | 2011 |
|---|---|---|---|---|---|
| Countries where French is the official language | 48% | 48% | 50% | 52% | 58% |
| Countries where French is present | 23% | 23% | 23% | 23% | 23% |
| Countries with a Romance language | 7% | 7% | 6% | 6% | 5% |
| Other countries | 22% | 22% | 20% | 18% | 15% |
Immigrants French-English FOLS
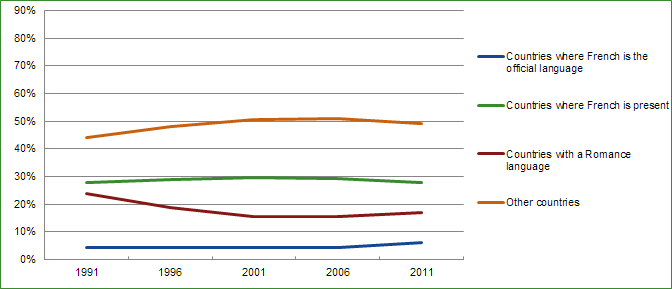
Text version: Immigrants French-English FOLS
| Category | 1991 | 1996 | 2001 | 2006 | 2011 |
|---|---|---|---|---|---|
| Countries where French is the official language | 4% | 4% | 4% | 4% | 6% |
| Countries where French is present | 28% | 29% | 29% | 29% | 28% |
| Countries with a Romance language | 24% | 19% | 16% | 15% | 17% |
| Other countries | 44% | 48% | 51% | 51% | 49% |
Other immigrants
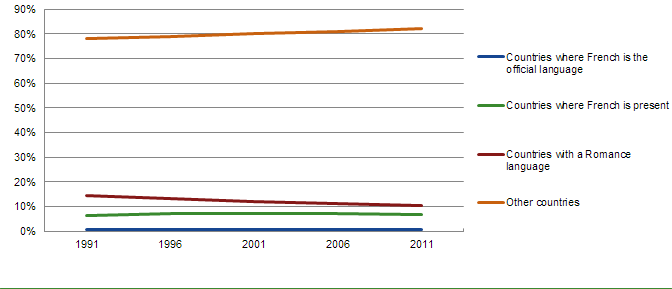
Text version: Other immigrants
| Category | 1991 | 1996 | 2001 | 2006 | 2011 |
|---|---|---|---|---|---|
| Countries where French is the official language | 1% | 1% | 1% | 1% | 1% |
| Countries where French is present | 7% | 7% | 7% | 7% | 7% |
| Countries with a Romance language | 15% | 13% | 12% | 11% | 10% |
| Other countries | 78% | 79% | 80% | 81% | 82% |
The category ‘FOLS other’ includes FOLS groups ‘English’ and ‘neither English nor French’.
Sources: Statistics Canada, 1991 to 2006 censuses, and 2011 National Household Survey.
Chart 2.2: Percentage of immigrants with first official language spoken (FOLS) according to continent of birth, Canada excluding Quebec, 1991 to 2011
Immigrants French FOLS
Text version: Immigrants French FOLS
| Continent | 1991 | 1996 | 2001 | 2006 | 2011 |
|---|---|---|---|---|---|
| America | 19% | 19% | 17% | 17% | 17% |
| Europe | 52% | 48% | 44% | 39% | 34% |
| Africa | 18% | 21% | 27% | 33% | 40% |
| Asia and Pacific | 10% | 11% | 12% | 11% | 9% |
Immigrants French-English FOLS

Text version: Immigrants French-English FOLS
| Continent | 1991 | 1996 | 2001 | 2006 | 2011 |
|---|---|---|---|---|---|
| America | 8% | 9% | 8% | 10% | 14% |
| Europe | 49% | 44% | 43% | 39% | 33% |
| Africa | 8% | 11% | 10% | 11% | 14% |
| Asia and Pacific | 35% | 36% | 39% | 40% | 39% |
Other immigrants

Text version: Other immigrants
| Continent | 1991 | 1996 | 2001 | 2006 | 2011 |
|---|---|---|---|---|---|
| America | 15% | 15% | 15% | 14% | 14% |
| Europe | 55% | 48% | 42% | 37% | 31% |
| Africa | 3% | 4% | 4% | 4% | 5% |
| Asia and Pacific | 26% | 34% | 39% | 44% | 49% |
The category ‘FOLS other’ includes FOLS groups ‘English’ and ‘neither English nor French’.
Sources: Statistics Canada, 1991 to 2006 censuses, and 2011 National Household Survey.
2.2 Visible minority groups
As a result of the steady growth of the immigrant population from Asia, Africa, Latin America and the Caribbean, the proportion of immigrants designated as visible minorities has increased. French FOLS and French-English FOLS immigrants are no exception to this trend (Table 2.2). Of the 74,500 French FOLS immigrants in 2011, more than half (55%) are classified as belonging to a visible minority. Within this group, the majority “identify” with the Black group, which makes up 34% of all French FOLS immigrants, compared with 26% in 2006. The other visible minority groups each accounted for less than 3% of the total in 2011, except for the Arab group, which represented 8% of the French FOLS immigrant population classified as a visible minority in 2011.
The French-English FOLS group has few Blacks (6.7%), but comprises more Asians, especially from East Asia (China, Korea, Japan) and South Asia (India, Pakistan, etc.). In all, 30.5% of French-English FOLS immigrants belonged to the group consisting of visible minorities of Asian origin, compared with less than 9% of French FOLS immigrants.
Among non-francophone immigrants, the weight of visible minorities of Asian origin, including many from East Asia and South Asia, is even greater at 47%. By contrast, Blacks account for only 6% of this group. In addition, persons not classified as visible minorities are slightly in the minority in all three immigrant groups.
Table 2.2: Immigrant population according to first official language spoken (FOLS) and visible minority group, Canada excluding Quebec, 2011
| Visible minority | French (thousands) | French (%) | French and English (thousands) | French and English (%) | Other (thousands) | Other (%) |
|---|---|---|---|---|---|---|
| East AsianTable 2.2 footnote * | 2.3 | 3.1% | 8.9 | 11.2% | 983.1 | 17.4% |
| South Asian | 2.3 | 3.1% | 8.1 | 10.1% | 985.3 | 17.4% |
| Southeast Asian | 1.3 | 1.7% | 3.2 | 4.1% | 561.4 | 9.9% |
| West Asian | 0.5 | 0.7% | 4.1 | 5.1% | 142.2 | 2.5% |
| Arab | 6.0 | 8.0% | 7.9 | 9.9% | 126.6 | 2.2% |
| Black | 25.0 | 33.6% | 5.3 | 6.7% | 333.8 | 5.9% |
| Latin American | 1.2 | 1.7% | 7.1 | 9.0% | 181.6 | 3.2% |
| Other visible minority | 2.3 | 3.0% | 1.2 | 1.5% | 133.0 | 2.4% |
| Not a visible minority | 33.6 | 45.1% | 33.6 | 42.3% | 2,199.9 | 39.0% |
The category 'FOLS other' includes FOLS groups 'English' and 'neither English nor French'.
Source: Statistics Canada, 2011 National Household Survey
There are considerable differences in the geographic distribution of francophone immigrants throughout Canada in terms of the composition of the population by visible minority group. Charts 2.3-a and b illustrate these differences for five major regions and a few urban centres. Visible minorities were grouped into four categories: Blacks, Asians, other visible minorities and those classified as not belonging to a visible minority. Of the five regions shown in Chart 2.3-a, the weight of so-called visible minorities is the lowest in the Atlantic region, where they make up only 34% of the total population of French-speaking immigrants. By contrast, in Ontario and Alberta and the two Prairie provinces, members of visible minorities represent 60% of immigrants whose first official language is French, while in British Columbia, their relative weight is 42%. With the exception of British Columbia, the proportion of visible minorities has increased considerably since 2006, by approximately 10 percentage points.
The relative share of Blacks in the francophone immigrant population in Ontario, the Prairie provinces and Alberta exceeds 25%. In the Atlantic region, it is just over 15%, while it is only 6% in British Columbia. In British Columbia, visible minorities are mainly of Asian origin (25% of all francophone immigrants, but two-thirds of the visible minority population). This is consistent with the general profile of immigration in that province, which is largely Asian-based. In the other regions, Blacks account for between 45% and more than 60% of French-speaking immigrants classified as visible minorities.
The proportion of the French-speaking immigrant population that belongs to a visible minority also varies considerably from one metropolitan area to another (Chart 2.3-b). The weight of visible minorities is greatest in Ottawa, representing 73% of the francophone immigrant population. In Moncton, Toronto, Winnipeg, Calgary and Vancouver, their relative share ranges between 50% and just over 60%. The French-speaking immigrant population of the Ottawa metropolitan area (Ontario side only) has a high proportion of Blacks (47%), much higher than in other cities (6% in Vancouver; 37% in Moncton). Toronto and Vancouver stand out for their high percentage of visible minority persons of Asian origin (23% and 30% respectively).
Overall, between 2006 and 2011, there was an increase in the number of francophone immigrants belonging to a visible minority, especially Blacks, in most regions and census metropolitan areas.
Chart 2.3: Population of French-speaking immigrants after redistribution of the French-English category according to visible minority group, Canada excluding Quebec, 2011
Panel A: By region

Text version: By region
| Category | Atlantic | Ontario | Prairies | Alberta | British Columbia |
|---|---|---|---|---|---|
| Black | 17% | 27% | 38% | 28% | 6% |
| Asian | 4% | 16% | 12% | 15% | 25% |
| Other visible minority | 13% | 16% | 11% | 19% | 12% |
| Not a visible minority | 66% | 41% | 39% | 38% | 58% |
The Atlantic region comprises the provinces of Newfoundland and Labrador, Nova Scotia, Prince Edward Island and New Brunswick.
The Prairies region comprises the provinces of Manitoba and Saskatchewan.
Source: Statistics Canada, National Household Survey 2011.
Panel B: Selected CMAs

Text version: Selected CMAs
| Category | Moncton | Ottawa | Totonto | Winnipeg | Calgary | Vancouver | Rest of the country |
|---|---|---|---|---|---|---|---|
| Black | 37% | 47% | 18% | 42% | 21% | 6% | 21% |
| Asian | 6% | 8% | 23% | 9% | 16% | 30% | 10% |
| Other visible minority | 15% | 18% | 15% | 13% | 21% | 13% | 14% |
| Not a visible minority | 42% | 27% | 44% | 36% | 41% | 50% | 56% |
Source: Statistics Canada, National Household Survey 2011.
2.3 Period when permanent residence was granted
French FOLS immigrants are very similar to the other two groups of immigrants as regards the period of immigration (permanent residence granted) in Canada. They tend to have arrived somewhat earlier than non-francophone immigrants, but later than French-English FOLS immigrants (Table 2.3). Nearly half (45%) of French-English FOLS immigrants were granted permanent residence between 2001 and 2011, compared with 40.5% for French FOLS immigrants and 30% for the other immigrants. In this regard, one of the reasons that explains the particular situation of French-English FOLS immigrants is the significant proportion of Romanians in the composition of this group, given that the tempo of immigration from Romania has increased since the fall of Communism in late 1989. Another reason lies in the age structure of this particular group, which is characterized by a much younger population than the other two immigrant groups.Footnote 4
Table 2.3: Proportion of immigrants according to first official language spoken (FOLS) and period of immigration, Canada less Quebec, 2011
| Immigration period | French | French and English | Other |
|---|---|---|---|
| 2006 – 2011 | 24.8% | 22.2% | 16.0% |
| 2001 – 2005 | 15.8% | 22.6% | 14.3% |
| 1996 – 2000 | 10.9% | 16.4% | 11.8% |
| 1986 – 1995 | 15.6% | 21.1% | 20.5% |
| 1976 – 1985 | 10.3% | 7.8% | 10.9% |
| 1975 and earlier | 22.7% | 9.9% | 26.6% |
| Total | 100.0% | 100.0% | 100.0% |
The category 'FOLS other' includes FOLS groups 'English' and 'neither English nor French'.
Source: Statistics Canada, 2011 National Household Survey.
In summary, international immigration to Canada has undergone a rapid transformation in recent decades. Among newcomers, the relative share of immigration from Europe has decreased considerably, giving way to immigration from Asia, Africa and Latin America. In this regard, French FOLS immigrants differ from other immigrants in that a large proportion of them come from Africa. One of the consequences of this trend has been to change the composition of the French FOLS immigrant population, which comprised 34% Blacks in 2011, compared with less than 10% for the other two immigrant groups. This pattern continues a trend already evident in the 2006 Census.
3 Age structure
This section looks at the different five-year age groups observed in 2011 and shows the recent evolution of the population, classified into three major age groups. The age structure of French-speaking immigrants is similar to other immigrants. One of its features is a relatively small population at the youngest ages. Among Canadian-born francophones, 0- to 9-year-olds made up 8.3% of the total population in 2011, while their relative weight was 3.4% among francophone immigrants and 2.4% among non-francophone immigrants (Chart 3.1-a). Conversely, the population is proportionally larger at the adult ages, both among immigrants and Canadian-born French speakers. However, the age structure of francophone immigrants differs from the other two groups in two respects. First, the age distribution curve rises in the 10-19 age range. At these ages, the percentage of francophone immigrants is much higher than other immigrants. Second, while the differences are less pronounced, the percentage of French-speaking immigrants at older ages (50 and over) is lower than among other immigrants and Canadian-born francophones. The explanation for these differences seems to lie in the quite specific age structure of the French-English FOLS immigrant population.
A comparison of the age structures of the French FOLS immigrant population and the French-English FOLS immigrant population reveals a very distinct characteristic in the latter group: a large proportion of youths aged 10 to 24 (Chart 3.1-b). More than 25% of the population of French-English FOLS immigrants fall into this age range, compared with 14% of French FOLS immigrants. However, this characteristic is not specific to French-English FOLS immigrants: the same phenomenon can be seen in the Canadian-born group, where it is even more marked, extending to the 0-4 and 20-24 age groups. Persons aged 0 to 24 represented 79% of the total population of Canadian-born, French-English FOLS persons in the 2011 NHS, whereas the corresponding percentage is 23% for their French FOLS counterparts, 17% for French FOLS immigrants and 28% for French-English FOLS immigrants. On the other hand, the percentage of the population aged 65 and over is 2% for the Canadian-born French-English FOLS group, and ranges around 15% to 20% for the other groups defined by first official language spoken. However, the consequences of this phenomenon are minimal after redistribution of the French-English category among the Canadian-born, since those with a double official language (French-English FOLS) make up only a very small proportion (less than 4%) of the Canadian-born francophone population. The situation is different for immigrants, because there are slightly more French-English FOLS immigrants outside Quebec than French FOLS immigrants.
Chart 3.1: Immigrant and non immigrant population according to the first official language spoken (after and before redistribution of the French-English category) by age group, Canada less Quebec, 2011
Panel A: After redistribution of the French-English category

Text version: After redistribution of the French-English category
| Age group | French FOLS native-born | French FOLS immigrant | Immigrants FOLS other |
|---|---|---|---|
| 0 to 4 | 4% | 1% | 1% |
| 5 to 9 | 4% | 3% | 2% |
| 10 to 14 | 4% | 6% | 3% |
| 15 to 19 | 5% | 6% | 4% |
| 20 to 24 | 5% | 6% | 5% |
| 25 to 29 | 5% | 7% | 6% |
| 30 to 34 | 6% | 8% | 7% |
| 35 to 39 | 6% | 10% | 8% |
| 40 to 44 | 7% | 10% | 10% |
| 45 to 49 | 9% | 9% | 10% |
| 50 to 54 | 10% | 7% | 9% |
| 55 to 59 | 9% | 7% | 8% |
| 60 to 64 | 8% | 6% | 8% |
| 65 to 69 | 6% | 5% | 6% |
| 70 to 74 | 4% | 4% | 5% |
| 75 to 79 | 3% | 3% | 4% |
| 80 and over | 4% | 4% | 5% |
FOLS = Population of groups defined according to first official language spoken.
The category FOLS other includes FOLS groups "English" and "neither English nor French".
Source: Statistics Canada, 2011 National Household Survey.
Panel B: Before redistribution of the French-English category

Text version: Before redistribution of the French-English category
| Age group | French FOLS immigrant | French-English FOLS immigrant |
|---|---|---|
| 0 to 4 | 1% | 0% |
| 5 to 9 | 3% | 2% |
| 10 to 14 | 4% | 8% |
| 15 to 19 | 4% | 10% |
| 20 to 24 | 5% | 7% |
| 25 to 29 | 6% | 7% |
| 30 to 34 | 8% | 8% |
| 35 to 39 | 10% | 10% |
| 40 to 44 | 11% | 10% |
| 45 to 49 | 10% | 8% |
| 50 to 54 | 7% | 7% |
| 55 to 59 | 7% | 6% |
| 60 to 64 | 7% | 4% |
| 65 to 69 | 5% | 4% |
| 70 to 74 | 4% | 3% |
| 75 to 79 | 3% | 2% |
| 80 and over | 4% | 2% |
FOLS = Population of groups defined according to first official language spoken.
Source: Statistics Canada, 2011 National Household Survey.
The change in the age structure between 1991 and 2011 varied by the major age group considered the first official language spoken (FOLS) and immigrant status. Owing to a fertility rate below the replacement level and incomplete parent-to-child transmission of French, there was a decrease in both the number and the percentage of the French-speaking population under 20 years of age (Table 3.1). This population decreased by approximately 48,000 in 20 years, while its relative weight within the total population went from 22% to 18%. The trend is reversed for the other two groups, especially francophone immigrants. Their population aged 0 to 19 more than doubled during the period, from 7,000 to 17,000, while its percentage rose from 12% to 15%. Among non-francophone immigrants, the relative weight of 0- to 19-year-olds within the total population remained stable at around 9%, despite the significant increase in their numbers, which rose by nearly 180,000 (an absolute increase of more than one-half).
The adult population aged 20 to 64 increased in absolute numbers in both immigrant groups, but decreased in the Canadian-born francophone group. The relative weight of persons in this age group within the total population declined in all three groups. In terms of numbers, the francophone immigrant population aged 20 to 64 rose by more than half between 1991 and 2011, while the non-francophone immigrant population grew by 48%. The Canadian-born population decreased by 8% during this period.
The population 65 years and older grew substantially in all three groups. Between 1991 and 2011, the number of Canadian-born francophones in this age group increased by 43%, compared with 87% for French-speaking immigrants and nearly 48% for non-francophone immigrants. As a result, there was an aging of the population (that is, an increase in the proportion of elderly persons within the total population) among Canadian-born francophones and non-francophone immigrants, but not among French-speaking immigrants, for whom the percentage of persons 65 years and older remained stable at approximately 15% between 1991 and 2011. The aging was most rapid among Canadian-born francophones, with the proportion of elderly persons rising from 12% in 1991 to 18% in 2011. However, of all three groups, non-francophone immigrants had the largest proportion of persons 65 and older in the last four censuses and the 2011 NHS: seniors represented 18% of that group in 1991 and 21% in 2011.
In summary, the francophone immigrant population appears to be fairly young (characterized by a large proportion of 0- to 19 year-olds) when compared with non-francophone immigrants. This characteristic may be explained in part by the quite particular age composition of the French-English FOLS immigrant population. That population has a large proportion of youths aged 10 to 24, and is much higher than the proportion among French FOLS immigrants and non-francophone immigrants. This characteristic is also observed among French-English FOLS persons born in Canada.
Table 3.1: Number and percentage distribution of the population by three major age groups, according to the first official language spoken (FOLS) (after redistribution of the French-English category) and immigrant status, Canada less Quebec, 1991 to 2011
| Year | Native-born French (thousands) | Native-born French (percentage) | Immigrants-French (thousands) | Immigrants-French (percentage) | Immigrants-Other (thousands) | Immigrants-Other (percentage) |
|---|---|---|---|---|---|---|
| 1991 | 201 | 22.3% | 7 | 11.9% | 323 | 8.8% |
| 1996 | 188 | 21.0% | 10 | 14.2% | 400 | 9.4% |
| 2001 | 175 | 19.5% | 13 | 15.0% | 451 | 9.7% |
| 2006 | 164 | 18.4% | 16 | 15.9% | 486 | 9.3% |
| 2011 | 153 | 17.9% | 17 | 15.4% | 502 | 8.8% |
| Year | Native-born French (thousands) | Native-born French (percentage) | Immigrants-French (thousands) | Immigrants-French (percentage) | Immigrants-Other (thousands) | Immigrants-Other (percentage) |
|---|---|---|---|---|---|---|
| 1991 | 597 | 65.9% | 44 | 73.0% | 2,703 | 73.2% |
| 1996 | 590 | 65.9% | 51 | 70.7% | 3,054 | 72.1% |
| 2001 | 591 | 66.0% | 62 | 70.6% | 3,312 | 71.2% |
| 2006 | 586 | 65.7% | 68 | 68.9% | 3,699 | 70.6% |
| 2011 | 547 | 64.1% | 79 | 69.8% | 4,009 | 70.5% |
| Year | Native-born French (thousands) | Native-born French (percentage) | Immigrants-French (thousands) | Immigrants-French (percentage) | Immigrants-Other (thousands) | Immigrants-Other (percentage) |
|---|---|---|---|---|---|---|
| 1991 | 107 | 11.8% | 9 | 15.0% | 666 | 18.0% |
| 1996 | 117 | 13.1% | 11 | 15.1% | 780 | 18.4% |
| 2001 | 130 | 14.5% | 13 | 14.5% | 891 | 19.2% |
| 2006 | 142 | 15.9% | 15 | 15.1% | 1,051 | 20.1% |
| 2011 | 153 | 18.0% | 17 | 14.9% | 1,176 | 20.7% |
The category 'FOLS other' includes FOLS groups 'English' and 'neither English nor French'.
Source: Statistics Canada, 1991 to 2006 Censuses, and 2011 National Household Survey
4 Interprovincial migration
Internal migration is one of the demographic factors that affects the evolution of linguistic groups in Canada. If we know the migratory patterns of French-speaking immigrants within Canada, we can better understand the demographic dynamics of francophone populations. In Canada, an examination of the migratory movements of francophone immigrants outside Quebec has two components. The first consists of the movements of these immigrants toward Quebec, while the second focuses on movements from Quebec to the rest of Canada. Do these exchanges balance out, or do they create demographic imbalances? That is the key question we are raising here.
Interprovincial migration is measured on the basis of answers to the question asked in censuses and the 2011 National Household Survey (NHS) on the place of residence five years earlier. The censuses and the NHS are therefore used to capture individuals’ migratory movements over a period of five years preceding the census.Footnote 5
4.1 Interprovincial migration of French-speaking immigrants living outside Quebec
The interprovincial migration of French-speaking immigrants living outside Quebec differs from that of other immigrants, but it similar to Canadian-born francophones. The general bell shape of the curve of interprovincial migration rates by age group is typical for all the linguistic groups, but for French FOLS immigrants, it peaks in the 30-to-34 age range, whereas for Canadian-born francophones and non-francophones, it peaks in the 25-to-29 age range (Chart 4.1-a). Thus, at its peak in the 30-34 age group, the migration rate for French-speaking immigrants is over 200 per thousand, while it is 175 per thousand for francophones aged 25 to 29 born in Canada. The migration rate of 25- to 29-year-old Canadian-born non-francophones is much lower (87 per thousand), while non-francophone immigrants post the lowest rate at 54 per thousand. Compared with 2006, the interprovincial migration rates of francophone immigrants are not only higher in 2011, but the shape of the curve is slightly different because the highest rate is for those in the 30-34 age group rather than the 25-29 age group, as was the case in 2006. Also, the interprovincial migration rates of francophone immigrants are higher than for Canadian-born francophones in all age groups, which was not the case in 2006.
A comparison of age-specific rates reveals a difference between the intensity of interprovincial migration of French FOLS immigrants and French-English FOLS immigrants. The two curves are similar in shape, except for the youngest individuals, for whom the migration rates of French-English FOLS immigrants are much lower than French FOLS immigrants (Chart 4.1-b).
In 2011, the interprovincial migration rate by age group for French FOLS immigrants remained higher than for French-English FOLS immigrants, but the gap did narrow.
The results in each census since 1991 are similar. For each five-year migration period observed, the order of the groups is the same, both after and before redistribution of the French-English category (Charts 4.2-a and b). In the first case, francophone immigrants have the highest interprovincial migration rate, followed by Canadian-born francophones (Chart 4.2-a). The rates of these two groups are very close between 1996 and 2006, but in 2011 there is a substantial gap. This gap is due to a significant increase in the overall interprovincial migration rate of francophone immigrants between 2006 and 2011, which went from 66 per thousand to nearly 92 per thousand, whereas the rate for Canadian-born francophones remained at approximately 60 per thousand. Well below these trends are the internal migration rates of non-francophones—both immigrant and Canadian-born—whose migration rates are nearly two times lower. The migration rate fell between 1991 and 2011 for non-francophone immigrants (from 34 to 28 per thousand) and for native-born Canadians (from 39 to 32 per thousand). The change over time in this migration of the French-speaking population (including both Canadian-born and immigrants) was marked by a considerable decrease between the 1991 and 1996 censuses, followed by a slight increase up to 2006. Between 2006 and 2011, the trends for the two groups diverged. Thus, for francophone immigrants, the migration rate, which was 84 per thousand in 1991, fell to 60 per thousand five years later, edged up to 66 per thousand in 2006 and then rose to more than 91 per thousand in 2011.
This trend is also seen in the interprovincial migration patterns of French FOLS and French-English FOLS immigrants between 1991 and 2011 (Chart 4.2-b). The gap between these two groups remained large throughout this period, with migration rates of the first group sometimes twice as high as the second group (particularly in 1996 and 2001).
Chart 4.1: Interprovincial migration rate (per thousand) of the immigrant and non immigrant population according to the first official language spoken (FOLS) (after and before redistribution of the French-English category) by age group, Canada less Quebec, 2011
Panel A: After redistribution of the French-English category

Text version: After redistribution of the French-English category
| Age group | French FOLS native-born | French FOLS immigrant | Immigrants FOLS other | Native-born FOLS other |
|---|---|---|---|---|
| 5 to 9 | 87 | 158 | 60 | 37 |
| 10 to 14 | 64 | 134 | 49 | 27 |
| 15 to 19 | 48 | 105 | 34 | 22 |
| 20 to 24 | 94 | 107 | 40 | 52 |
| 25 to 29 | 175 | 180 | 54 | 87 |
| 30 to 34 | 128 | 206 | 53 | 68 |
| 35 to 39 | 95 | 173 | 43 | 48 |
| 40 to 44 | 64 | 117 | 32 | 35 |
| 45 to 49 | 46 | 85 | 23 | 28 |
| 50 to 54 | 33 | 59 | 17 | 23 |
| 55 to 59 | 27 | 32 | 15 | 23 |
| 60 to 64 | 23 | 30 | 14 | 22 |
Panel B: Before redistribution of the French-English category
Text version: Before redistribution of the French-English category
| Age group | French FOLS immigrant | French-English FOLS immigrant |
|---|---|---|
| 5 to 9 | 211 | 66 |
| 10 to 14 | 171 | 94 |
| 15 to 19 | 121 | 84 |
| 20 to 24 | 146 | 87 |
| 25 to 29 | 186 | 148 |
| 30 to 34 | 229 | 191 |
| 35 to 39 | 183 | 162 |
| 40 to 44 | 126 | 103 |
| 45 to 49 | 96 | 58 |
| 50 to 54 | 58 | 56 |
| 55 to 59 | 30 | 44 |
| 60 to 64 | 24 | 45 |
FOLS = Population of groups defined according to first official language spoken.
The category FOLS other includes FOLS groups "English" and "neither English nor French".
Source: Statistics Canada, 2011 National Household Survey.
Chart 4.2: Total interprovincial migration rate (per thousand, standardised by age group) of the population according to immigrant status and first official language spoken (FOLS) (after and before redistribution of the French-English category), Canada less Quebec, 1991 to 2011
Panel A: After redistribution of the French-English category

Text version: After redistribution of the French-English category
| Year | French FOLS native-born | French FOLS immigrant | Immigrants FOLS other | Native-born FOLS other |
|---|---|---|---|---|
| 1991 | 64 | 84 | 34 | 39 |
| 1996 | 57 | 60 | 27 | 35 |
| 2001 | 57 | 60 | 24 | 35 |
| 2006 | 63 | 66 | 24 | 33 |
| 2011 | 57 | 91 | 28 | 32 |
Panel B: Before redistribution of the French-English category
Text version: Before redistribution of the French-English category
| Year | French FOLS immigrant | French-English FOLS immigrant |
|---|---|---|
| 1991 | 99 | 57 |
| 1996 | 76 | 41 |
| 2001 | 80 | 36 |
| 2006 | 80 | 46 |
| 2011 | 103 | 77 |
Standard used: native-born Canadians whose first official language is French (after redistribution of the French-English category) in 2006
FOLS = Population of groups defined according to first official language spoken. The category ‘FOLS other’ includes FOLS groups ‘English’ and ‘neither English nor French’.
Sources: Statistics Canada, 1991 to 2006 censuses, and 2011 National Household Survey.
For the populations outside Quebec, the magnitude of interprovincial migration is different for francophones and non-francophones. The same applies to the provinces of destination chosen. French-speaking persons (after redistribution of the French-English category), whether Canadian-born or immigrants, migrate mainly to Quebec, whereas non-francophones opt for much more diverse destinations. Among interprovincial francophone migrants in the 2006-2011 period (captured in the 2011 NHS), 57% of Canadian-born persons and 59% of francophone immigrants went to Quebec (Table 4.1). Between 2001 and 2006, 68% of francophone immigrants who migrated between provinces had chosen Quebec as their destination. Ontario and Alberta, which have a similar attraction as provinces of destination, each drew 11% of French-speaking interprovincial migrants. Among non-francophones (Canadian-born and immigrants), three provinces receive the majority of migrants: British Columbia, Alberta and Ontario. Together, these three provinces attracted 63.5% of Canadian-born non-francophones and 77% of immigrant non-francophones who migrated between provinces between 2006 and 2011. By comparison, these same three provinces received 34.5% of French-speaking immigrants and 26% of Canadian-born francophones living outside Quebec.
This specific structure of the francophone population living outside Quebec in 2006 and captured in the 2011 NHS was observed in all censuses between 1991 and 2006. Thus, Quebec’s share as a province of destination for French-speaking interprovincial migrants—both Canadian-born and immigrants—remained above 55% and peaked in the 2006 Census (Chart 4.3). Conversely, Quebec’s share remained below 10% for non-francophone interprovincial immigrants and below 5% for Canadian-born non-francophone interprovincial migrants during the period examined.
Table 4.1: Population of interprovincial migrants (2006 to 2011) according to the first official language spoken (FOLS) after redistribution of the French-English category according to region of destination, migrants from Canada outside Quebec, 2011
| Region of destination | French native-born (number) | French native-born (percentage) | French immigrant (number) | French immigrant (percentage) | Other native-born (number) | Other native-born (percentage) | Other immigrant (number) | Other immigrant (percentage) |
|---|---|---|---|---|---|---|---|---|
| Atlantic | 5,575 | 12.2% | 220 | 3.6% | 6,620 | 5.6% | 103,255 | 17.4% |
| Quebec | 25,840 | 56.7% | 3,590 | 58.6% | 8,695 | 7.3% | 24,080 | 4.1% |
| Ontario | 5,215 | 11.4% | 740 | 12.1% | 25,560 | 21.5% | 97,410 | 16.4% |
| Prairies | 1,485 | 3.3% | 150 | 2.4% | 10,710 | 9.0% | 80,115 | 13.5% |
| Alberta | 4,315 | 9.5% | 885 | 14.5% | 39,175 | 33.0% | 154,275 | 26.0% |
| British Columbia | 2,735 | 6.0% | 490 | 8.0% | 26,800 | 22.6% | 126,005 | 21.2% |
| Territories | 435 | 1.0% | 45 | 0.8% | 1,120 | 0.9% | 9,305 | 1.6% |
| Total | 45,590 | 100.0% | 6,120 | 100.0% | 118,685 | 100.0% | 594,445 | 100.0% |
FOLS = Population of groups defined according to first official language spoken. The category 'FOLS other' includes FOLS groups 'English' and 'neither English nor French'.
The Atlantic region comprises Newfoundland and Labrador, Nova Scotia, Prince Edward Island and New Brunswick. The Prairies region comprises Manitoba and Saskatchewan. The 'Territories' comprise Yukon, Northwest Territories and Nunavut.
Source: Statistics Canada, 2011 National Household Survey
Chart 4.3: Percentage of interprovincial migrants who settled in Quebec, immigrant and non immigrant population according to the first official language spoken (FOLS) after redistribution of the French-English category, migrants from outside Quebec, 1991 to 2011
Text version: Percentage of interprovincial migrants who settled in Quebec, immigrant and non immigrant population according to the first official language spoken (FOLS) after redistribution of the French-English category, migrants from outside Quebec, 1991 to 2011
| Category | 1991 | 1996 | 2001 | 2006 | 2011 |
|---|---|---|---|---|---|
| French FOLS native-born | 61.2% | 59.3% | 56.1% | 62.0% | 56.7% |
| French FOLS immigrant | 60.2% | 56.4% | 58.2% | 67.5% | 58.6% |
| Immigrants FOLS other | 7.3% | 7.2% | 7.1% | 8.6% | 7.3% |
| Native-born FOLS other | 4.3% | 4.1% | 3.7% | 4.3% | 4.1% |
FOLS = Population of groups defined according to first official language spoken. The category FOLS other includes FOLS groups "English" and "neither English nor French".
Sources: Statistics Canada, 1991 to 2006 censuses, and 2011 National Household Survey.
4.2 Interprovincial migration to Quebec and net migration
Differences in migratory behaviours between French-speaking individuals and the rest of the Canadian population outside Quebec also apply to Quebec, except that the behaviours in this case are reversed. Thus, the rates of interprovincial migration from Quebec, observed in each census from 1991 to 2006 and in the 2011 NHS, are much higher for non-francophones, both Canadian-born and immigrants, than for Canadian-born and immigrant francophones (Chart 4.4). The picture is the opposite of what was seen in Canada outside Quebec, and here the differences between the two groups are even greater.
Migratory exchanges between Quebec and the rest of Canada are generally favourable to the rest of Canada (Table 4.2). Between 1991 and 2011, net five-year migration for four of the five groups defined by first official language spoken (FOLS) and immigrant status was positive for Canada excluding Quebec. For Canadian-born francophones, interprovincial migration favoured Quebec in three periods (1986-1991, 1991-1996 and 2001-2006). For Canadian-born non-francophones, net migration was between 20,000 and just under 30,000 during the first three five-year periods, but fell to slightly more than 8,000 between 2001 and 2006 and just over 6,000 between 2006 and 2011. Between 8,000 and 16,000 non-francophone immigrants left Quebec to settle elsewhere in Canada in each period between 1991 and 2011.
Chart 4.4: Total interprovincial migration rate (per thousand, standardised by age group) of the population of selected groups defined according to first official language spoken (FOLS) and immigrant status (after redistribution of the French-English category), rate for migration from outside Quebec to rest of Canada, Canada less Quebec, 1991 to 2011
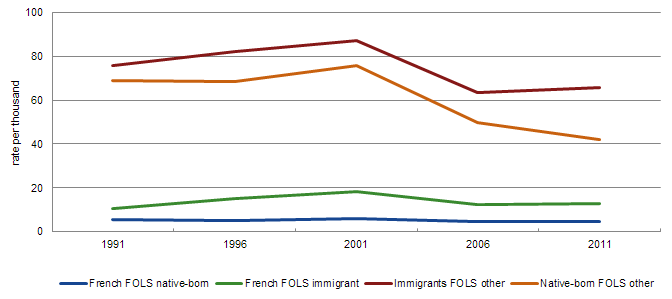
Text version: Total interprovincial migration rate (per thousand, standardised by age group) of the population of selected groups defined according to first official language spoken (FOLS) and immigrant status (after redistribution of the French-English category), rate for migration from outside Quebec to rest of Canada, Canada less Quebec, 1991 to 2011
| Year | French FOLS native-born | French FOLS immigrant | Immigrants FOLS other | Native-born FOLS other |
|---|---|---|---|---|
| 1991 | 5 | 10 | 76 | 69 |
| 1996 | 5 | 15 | 82 | 68 |
| 2001 | 6 | 18 | 87 | 76 |
| 2006 | 5 | 12 | 63 | 50 |
| 2011 | 4 | 13 | 66 | 42 |
Standard used: native-born Canadians whose first official language is French (after redistribution of the French-English category) in 2006
FOLS = Population of groups defined according to first official language spoken. The category FOLS other includes FOLS groups "English" and "neither English nor French".
Sources: Statistics Canada, 1991 to 2006 censuses, and 2011 National Household Survey.The net migration of French-speaking immigrants favours the rest of Canada as well, but to a lesser extent, peaking at 4,055 between 1996 and 2001. Conversely, migration of Canadian-born francophones favoured Quebec. Basically, net migration of the French-speaking population as a whole exhibited major fluctuations, reflecting those observed in both the Canadian-born and immigrant components of that population.
Overall, interprovincial migration outside Quebec played a fairly modest role in the relative evolution in the non-francophone population, mainly because it is a big population. Conversely, despite lower absolute numbers, net migration has greater demographic consequences on French-speaking populations. These populations are relatively small in the rest of Canada. Among immigrants in particular, net migration per 1,000 immigrants (the net migration rate) in Canada outside Quebec was 17.8 per thousand between 2001 and 2006, after posting higher levels in earlier censuses, such as 48 per thousand in 1991-1996 and 60 per thousand in 1996-2001 (Table 4.2). During the 2006-2011 period, the rate increased to 32 per thousand, which represents almost 3,000 migrants.
4.3 Origins of francophone immigrants who migrated between provinces
Francophone immigrants who lived outside Quebec in 2011 and had migrated between provinces between 2006 and 2011 came mostly from five large Canadian cities (census metropolitan areas), in particular Montréal. Overall, at least 35% of migrating francophone immigrants came from the Montréal CMA, although there were major variations by region of residence: 64% for Ontario, 50% for British Columbia, but 35% for the region consisting of the four Atlantic provinces (Table 4.3). The city of Québec contributed nearly 8% of such migrants in the latter region, and almost as much in the Prairie provinces (Manitoba and Saskatchewan). The other main cities that migrants left are Ottawa–Gatineau and Toronto. Only the region formed by the two Prairie provinces attracted a slightly larger percentage of such migrants (i.e., migrating francophone immigrants) from the Vancouver CMA. The rest of Canada (including the province of Quebec outside Montréal and Québec) contributed nearly one-third of such migrants, and Ontario just over 15%. Montréal was the main place of origin of interprovincial migrants to Ontario between 2006 and 2011 (64%).
Table 4.2: Net migration between Quebec and the rest of Canada of the population defined according to immigrant status and first official language spoken (FOLS) after redistribution of the French-English category, 1991 to 2011
| Period | French Native-born | French Immigrant | Other Immigrant | Other Native-born | Total French |
|---|---|---|---|---|---|
| 1986 to 1991 | 36,205 | 2,785 | 17,905 | 49,845 | 38,990 |
| 1991 to 1996 | 31,720 | 4,795 | 20,970 | 48,360 | 36,515 |
| 1996 to 2001 | 37,485 | 6,495 | 22,360 | 52,695 | 43,980 |
| 2001 to 2006 | 28,765 | 5,105 | 16,505 | 33,855 | 33,870 |
| 2006 to 2011 | 26,685 | 6,570 | 19,870 | 30,115 | 33,250 |
| Period | French Native-born | French Immigrant | Other Immigrant | Other Native-born | Total French |
|---|---|---|---|---|---|
| 1986 to 1991 | 41,925 | 2,425 | 7,615 | 29,730 | 44,350 |
| 1991 to 1996 | 33,960 | 2,065 | 7,005 | 25,375 | 36,025 |
| 1996 to 2001 | 29,875 | 2,445 | 6,490 | 23,305 | 32,320 |
| 2001 to 2006 | 35,055 | 3,680 | 8,625 | 25,700 | 38,735 |
| 2006 to 2011 | 25,840 | 3,590 | 8,695 | 24,080 | 29,425 |
| Period | French Native-born | French Immigrant | Other Immigrant | Other Native-born | Total French |
|---|---|---|---|---|---|
| 1986 to 1991 | -520 | 360 | 10,295 | 20,110 | -5,360 |
| 1991 to 1996 | -2,230 | 2,735 | 13,965 | 22,990 | 505 |
| 1996 to 2001 | 7,610 | 4,055 | 15,875 | 29,390 | 11,665 |
| 2001 to 2006 | -6,290 | 1,425 | 7,880 | 8,160 | -4,865 |
| 2006 to 2011 | 840 | 2,980 | 11,170 | 6,025 | 3,820 |
| Period | French Native-born | French Immigrant | Other Immigrant | Other Native-born | Total French |
|---|---|---|---|---|---|
| 1986 to 1991 | -6.6% | 7.7% | 3.3% | 1.4% | -5.9% |
| 1991 to 1996 | -2.6% | 48.1% | 3.9% | 1.6% | 0.6% |
| 1996 to 2001 | 9.0% | 60.1% | 4.0% | 1.9% | 12.7% |
| 2001 to 2006 | -7.3% | 17.8% | 1.7% | 0.5% | -5.2% |
| 2006 to 2011 | 1.0% | 31.7% | 2.2% | 0.4% | 4.2% |
The category 'FOLS other' includes FOLS groups 'English' and 'neither English nor French'.
Source: Statistics Canada, 1991 to 2006 Censuses, and 2011 National Household Survey.
Table 4.3: Region of residence in 2011 of immigrants whose first official language spoken (FOLS) is French (after redistribution of the French-English category) and who did an interprovincial migration between 2006 and 2011, according to place of origin, 2011
| Place of origin | Atlantic | Ontario | Prairies | Alberta | British Columbia |
|---|---|---|---|---|---|
| Québec | 8.0% | 5.2% | 7.9% | 4.2% | 4.1% |
| Montréal | 35.0% | 63.7% | 50.4% | 46.4% | 41.4% |
| Ottawa-Gatineau | 11.1% | 11.3% | 3.3% | 7.3% | 7.8% |
| Toronto | 7.5% | … | 3.1% | 11.9% | 9.2% |
| Vancouver | 1.3% | 3.8% | 4.5% | 2.0% | … |
| Rest of the country | 37.1% | 16.0% | 30.8% | 28.2% | 37.4% |
| Total | 100.0% | 100.0% | 100.0% | 100.0% | 100.0% |
The Atlantic region comprises Newfoundland and Labrador, Nova Scotia, Prince Edward Island and New Brunswick. The Prairies region comprises Manitoba and Saskatchewan.
Source: Statistics Canada, 2011 National Household Survey.
The patterns for six cities of destination for migrants are similar (Table 4.4). Montréal is still the main pool for francophone immigrant migrants in Canada outside Quebec. In Toronto, for example, 70% of such interprovincial migrants come from Montréal. It is also the main source for four other cities: Ottawa (59%), Winnipeg (47%), Calgary (49%) and Vancouver (54%). Considerable mobility is also observed between Ottawa and Gatineau. Nearly one-quarter of francophone immigrant migrants who settled in Ottawa had come from Gatineau, on the other side of the Ottawa River.
In comparison with the previous period (2001-2006), two changes are noteworthy. The first is that the Toronto CMA, which contributed substantially to the interprovincial migration of francophone immigrants between 2001 and 2006 (23% to Moncton, 19% to Calgary and 15% to Vancouver), saw these percentages decline to no more than 12%. The second change is the increase in the proportion of francophone immigrants living in Moncton and Winnipeg who had migrated from the “rest of the country”: between 2001 and 2006, the “rest of the country” contributed 28% of the migration of francophone immigrants to Moncton and 16% to Winnipeg, compared with 50% and 40%, respectively, between 2006 and 2011.
Table 4.4: Percentage distribution of the place of origin and place of residence of French-speaking immigrants (whose FOLS is French after redistribution of the French-English category) who migrated to another province between 2006 and 2011, for selected metropolitan areas of residence in 2011, Canada less Quebec, 2011
| Place of origin | Moncton | Ottawa | Toronto | Winnipeg | Calgary | Vancouver |
|---|---|---|---|---|---|---|
| Québec | 4.3% | 3.4% | 7.8% | 7.4% | 4.5% | 3.3% |
| Montréal | 31.8% | 58.7% | 69.8% | 46.7% | 49.3% | 54.3% |
| Ottawa-Gatineau | 4.6% | 22.7% | 1.1% | 5.5% | 8.5% | 7.3% |
| Toronto | 9.2% | … | … | 0.0% | 8.9% | 11.9% |
| Vancouver | 0.0% | 3.5% | 3.9% | 0.0% | 1.0% | … |
| Rest of the country | 50.1% | 11.7% | 17.5% | 40.5% | 27.9% | 23.2% |
| Total | 100.0% | 100.0% | 100.0% | 100.0% | 100.0% | 100.0% |
Source: Statistics Canada, 2011 National Household Survey.
In summary, francophones and non-francophones living in Canada outside Quebec exhibit quite different interprovincial migration patterns. Whereas francophones tend to settle in Quebec when they migrate within Canada, non-francophones choose one of the other nine provinces, especially Ontario, British Columbia and Alberta. In Quebec, exactly the opposite is observed: very few Quebec francophones, either native-born or immigrants, migrate to other provinces, while a much higher proportion of non-francophones leave the province. Overall, the movement of francophone immigrants from elsewhere in Canada to Quebec fails to offset the opposite flow from Quebec to the rest of Canada, and the net interprovincial migration of francophone immigrants markedly favours Canada outside Quebec. In relative terms, the net migration of francophone immigrants is greater than the net migration of Canadian-born francophones and non-francophones (both immigrant and Canadian-born). Between 2006 and 2011, the net migration of francophone immigrants was 32 per thousand in favour of the rest of Canada, compared with less than 2.5 per thousand for the other three groups.
5 Linguistic behaviours at home and at work
This section will examine the distribution of the French-speaking population by language spoken at home and, for those in the labour force,Footnote 6 the language used at work. In each case, the NHS provides two measures. As regards language spoken at home, a distinction is made between the language used most often and those used on a regular basis. The same applies to the language of work: the language used most often is set apart from other languages used on a regular basis at work. The regional dimension of linguistic behaviours at home and at work is also discussed.
5.1 Language spoken at home
Major differences are noted in the use of languages at home between the groups defined by first official language spoken (FOLS) and immigrant status. In 2011, among native-born Canadians with French as their first official language, 61% reported speaking French most often at home, while 37% reported speaking English (Table 5.1). A very small proportion reported speaking either both official languages or a non-official language (either exclusively or with an official language). Among French FOLS immigrants, 48% reported speaking French most often at home, 30% reported speaking English and 20% at least one non-official language.
Among French-English FOLS persons born in Canada, 77% reported speaking at least one non-official language, while 20% reported speaking both official languages. The great majority (97%) of French-English FOLS immigrants reported speaking a non-official language only. Non-francophone immigrants were divided almost equally into the categories “English only” and “non-official language” (with or without an official language).
Table 5.1: Population according to immigrant status, first official language spoken (FOLS) and language most often spoken at home, Canada less Quebec, 2011
| Native-born French (population) | Native-born French (percentage) | Native-born French and English (population) | Native-born French and English (percentage) | Immigrant French (population) | Immigrant French (percentage) | Immigrant French and English (population) | Immigrant French and English (percentage) | Other (population) | Other (percentage) | |
|---|---|---|---|---|---|---|---|---|---|---|
| English only | 306,540 | 36.6% | 0 | 0.0% | 22,560 | 30.3% | 0 | 0.0% | 2,781,165 | 49.3% |
| French only | 511,895 | 61.2% | 0 | 0.0% | 35,725 | 48.0% | 0 | 0.0% | 2,040 | 0.0% |
| English and French | 14,650 | 1.8% | 6,570 | 20.1% | 1,740 | 2.3% | 1,060 | 1.3% | 750 | 0.0% |
| Non-official only | 1,470 | 0.2% | 25,200 | 77.3% | 7,360 | 9.9% | 76,925 | 96.9% | 2,393,355 | 42.4% |
| Non-official and official | 2,115 | 0.3% | 845 | 2.6% | 7,080 | 9.5% | 1,425 | 1.8% | 469,685 | 8.3% |
| Total | 836,665 | 100.0% | 32,620 | 100.0% | 74,465 | 100.0% | 79,410 | 100.0% | 5,646,995 | 100.0% |
The category 'FOLS other' includes FOLS groups 'English' and 'neither English nor French'.
Source: Statistics Canada, 2011 National Household Survey.
To get a more complete picture of francophone immigrants’ use of French in the home, information on the language spoken most often at home was combined with data from the question on languages spoken on a regular basis at home, which the census has provided since 2001 (as does the 2011 NHS). Adding this dimension increases the frequency of use of French in the home, but it does not radically alter the trend that emerged from the information solely concerning French as the language spoken most often at home. The difference between French FOLS persons and French-English FOLS persons remains sizable (Chart 5.1). Taking account of the second part of the question on the language(s) used at home results in an increase in the number of persons who report using French at least on a regular basis at home, but in numbers and proportions that differ greatly from one group to another. In both absolute and relative terms, francophones (both Canadian-born and immigrants) increase the most—by nearly 140,300 (or 21%) for persons born in Canada and by 12,000 (or 22%) for immigrants. In all, for both groups, the total proportion of persons who report speaking French at least on a regular basis at home is 80% and 73% respectively.
Less visible is the effect of taking into consideration the information on French as a language spoken on a regular basis at home among French-English FOLS persons. Among French-English FOLS persons born in Canada, the number who report speaking French at least on a regular basis at home scarcely increases (by fewer than 2,500 speakers). The increase is greater among French-English FOLS immigrants (8,000), but in both cases, the percentage of those who report using French at least on a regular basis at home is low, at no more than 10%.
Chart 5.1: Population according to immigrant status and first official language spoken (FOLS) having French as the language most often or regularly spoken at home, Canada less Quebec, 2011
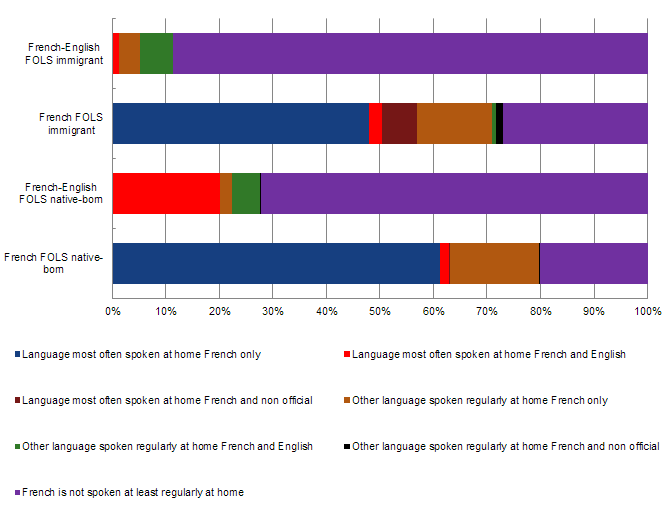
Text version: Population according to immigrant status and first official language spoken (FOLS) having French as the language most often or regularly spoken at home, Canada less Quebec, 2011
| Category | Language most often spoken at home - French only | Language most often spoken at home - French and English | Language most often spoken at home - French and non official | Other language spoken regularly at home - French only | Other language spoken regularly at home - French and English | Other language spoken regularly at home - French and non official | French is not spoken at least regularly at home |
|---|---|---|---|---|---|---|---|
| French FOLS native-born | 61% | 2% | 0% | 17% | 0% | 0% | 20% |
| French-English FOLS native-born | 0% | 20% | 0% | 2% | 5% | 0% | 72% |
| French FOLS immigrant | 48% | 2% | 7% | 14% | 1% | 1% | 27% |
| French-English FOLS immigrant | 0% | 1% | 0% | 4% | 6% | 0% | 89% |
FOLS = Population of groups defined according to first official language spoken.
Source: Statistics Canada, 2011 National Household Survey.
5.2 Language used at work
English dominates as the main language used at work outside Quebec, even for persons whose first official language spoken (FOLS) is French. However, the use of English is the most widespread among non-francophone immigrants, at 92% (Table 5.2). For French-English FOLS Canadian-born and immigrants, the corresponding proportions are 79.6% and 83.4% respectively. English is also used at work by French FOLS Canadian-born and immigrants, though to a lesser extent (58% and 64% respectively). For both of these groups, French ranks second at 34% and 22% respectively. For French-English FOLS persons and non-francophone immigrants, the use of French as the main language at work is marginal. A certain number of persons also reported using both official languages most often at work: 12% of French FOLS immigrants and French-English FOLS persons born in Canada.
Table 5.2: Population distribution according to the use of French at home as the language most often or regularly spoken and by the first official language spoken (FOLS) and immigrant status, Canada less Quebec, 2011
| Native-born French (population) | Native-born French (percentage) | Native-born French and English (population) | Native-born French and English (percentage) | Immigrant French (population) | Immigrant French (percentage) | Immigrant French and English (population) | Immigrant French and English (percentage) | Other (population) | Other (percentage) | |
|---|---|---|---|---|---|---|---|---|---|---|
| English only | 291,075 | 57.9% | 8,090 | 79.6% | 30,650 | 64.1% | 41,120 | 83.4% | 3,229,420 | 92.4% |
| French only | 172,045 | 34.2% | 520 | 5.1% | 10,675 | 22.3% | 2,225 | 4.5% | 3,985 | 0.1% |
| English and French | 39,415 | 7.8% | 1,225 | 12.1% | 5,625 | 11.8% | 3,180 | 6.4% | 7,305 | 0.2% |
| Non-official only | 190 | 0.0% | 195 | 1.9% | 295 | 0.6% | 1,410 | 2.9% | 178,985 | 5.1% |
| Non-official and official | 185 | 0.0% | 135 | 1.3% | 560 | 1.2% | 1,355 | 2.8% | 74,125 | 2.1% |
| Total | 502,905 | 100.0% | 10,170 | 100.0% | 47,810 | 100.0% | 49,285 | 100.0% | 3,493,830 | 100.0% |
The category 'FOLS other' includes FOLS groups 'English' and 'neither English nor French'.
Source: Statistics Canada, 2011 National Household Survey.
Unlike for the language spoken at home, when information on the use of French at work on a regular basis is taken into account, this significantly increases the observed level of use of this language at work for the four groups defined by first official language spoken (FOLS) and immigrant status (Chart 5.2). In the French FOLS population, more than half of the total number in each group report using French at least on a regular basis at work. These proportions are 70% for persons born in Canada and 56% for immigrants. The distribution of users of French at work favours those who report using it most often rather than those who report using it on a regular basis. As such, 42% of native-born Canadians reported using French most often, versus 28% who reported using it regularly. Similarly, 34% of French FOLS immigrants said they used French most often, compared with 21% who claimed to use it on a regular basis. The others, or 30% of French FOLS persons born in Canada and 44% of French FOLS immigrants, use only English or a non-official language in the workplace.
Chart 5.2: Active population according to the use of French at work as the language most often or regularly used for four defined groups by the first official language spoken (FOLS) and immigrant status, Canada less Quebec, 2011
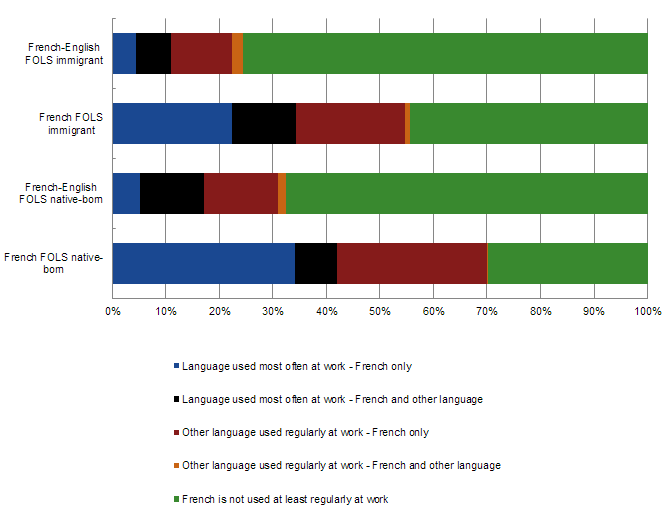
Text version: Active population according to the use of French at work as the language most often or regularly used for four defined groups by the first official language spoken (FOLS) and immigrant status, Canada less Quebec, 2011
| Category | Language used most often at work - French only | Language used most often at work - French and other language | Other language used regularly at work - French only | Other language used regularly at work - French and other language | French is not used at least regularly at work |
|---|---|---|---|---|---|
| French FOLS native-born | 34% | 8% | 28% | 0% | 30% |
| French-English FOLS native-born | 5% | 12% | 14% | 2% | 67% |
| French FOLS immigrant | 22% | 12% | 20% | 1% | 44% |
| French-English FOLS immigrant | 5% | 6% | 11% | 2% | 76% |
FOLS = Population of groups defined according to first official language spoken.
Source: Statistics Canada, 2011 National Household Survey.
The contributions of French-English FOLS persons who report using French on a regular basis at work is also sizable—double the number of users of French in the workplace. Thus, among French-English FOLS immigrants in the labour force, the proportion of those who use French on a regular basis at work (13%) is even slightly higher than those who use it most often (11%). A similar pattern is observed among French-English FOLS persons born in Canada: 15% report using French on a regular basis at work and 17% report using it most often.
5.3 Regional differences
Because Canada’s francophone communities have quite diverse characteristics, it is to be expected that linguistic behaviours at home and at work will also vary. We are interested here in the use of French as the language spoken most often or on a regular basis at home and as the language used most often or on a regular basis at work by francophones born in Canada and francophone immigrants (after redistribution of the French-English category) in 2011 in Canada’s major regions and in a few metropolitan areas (CMAs). Attention will be focused solely on the use of French (at home or at work); we will not consider situations where other languages are used. In other words, the use of French includes the simultaneous use of French and English, or French along with other languages.
Generally speaking, Canadian-born francophones’ use of French in the home decreases from east to west (Charts 5.3-a and b). For example, 93% reported speaking French at least on a regular basis at home in the Atlantic region (especially New Brunswick), compared with 52% in British Columbia. The phenomenon is the same with respect to the use of French at work (Charts 5.4-a and b), with nearly 90% of Canadian-born francophones reporting using French most often at work in the Atlantic region, versus just over 30% in Alberta and British Columbia.
Francophone immigrants are an exception to this characteristic of the use of French. Unlike francophones born in Canada, the percentage of such persons who speak French at least on a regular basis at home is lower in Ontario than in the two Prairie provinces by approximately eight percentage points. The main reason for this phenomenon is that a considerable number of Ontario’s francophone immigrants live in Toronto.Footnote 7 A significant proportion of Toronto’s francophones have both French and English as their FOLS, and many of them make little use of French in their daily lives. Toronto is therefore an exception in this province, especially when compared with Ottawa, the second-ranking centre for Ontario’s francophone immigrants, where French FOLS immigrants outnumber French-English FOLS immigrants (see Table 1.4). Toronto is more comparable to Calgary and Vancouver than to Ottawa. Like in Calgary and Vancouver, Toronto has a large population of French-English FOLS immigrants that is one and a half times the population of immigrants with only French as their first official language spoken.
In Winnipeg, Manitoba, 67% of Canadian-born francophones and 62% of immigrants reported speaking French at least on a regular basis at home. With regard to users of French at least on a regular basis at work, the proportions are smaller, at 50% of Canadian-born Francophones and 47% of immigrants. In Toronto, the corresponding percentages are much lower, with 60% of Canadian-born persons and 43% of French-speaking immigrants speaking French at least on a regular basis at home, and 40% each of Canadian-born francophones and immigrants speaking it regularly at work. In Moncton and Ottawa, the percentages of use of French among Canadian-born and immigrant francophones are much higher than in the other cities.
In summary, an analysis of the linguistic behaviours, both at home and at work, of francophone immigrants living outside Quebec reveals that there is competition between French and English spoken at home and in the workplace. Among French FOLS immigrants, slightly more than half reported speaking French most often at home, while 30% reported speaking English and 10% a non-official language. As for French-English FOLS immigrants, French spoken at home is not very widespread, even including the number of speakers who reported speaking French on a regular basis (rather than most often).
In the workplace, the presence of English is very widespread. For all groups defined by first official language spoken (FOLS) and immigrant status, English largely dominates as the language used most often at work. Among French FOLS immigrants, 64% reported using English most often at work. However, if users of French in the workplace include individuals who reported using French on a regular basis, the number of individuals in the labour force who reported using this language at least on a regular basis increases substantially.
Lastly, regional patterns show that the use of French diminishes from east to west. It is highest in the Atlantic region (especially New Brunswick), remains high in northern Ontario and Ottawa, and reaches its lowest level in Toronto (and in southern Ontario in general), as well as in Alberta and British Columbia.
Chart 5.3: Percentage of the population who speaks French most often (alone or with another language) at home in two defined groups according to the first official language spoken (FOLS) (after redistribution of the French-English category) and immigrant status, Canada less Quebec, 2011
Panel A: Regions
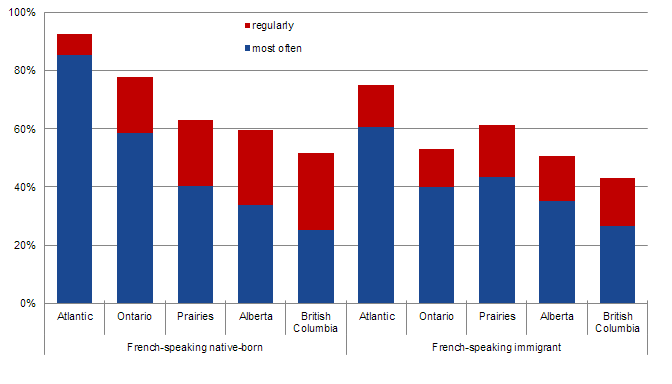
Text version: Regions
| most often | regularly | ||
|---|---|---|---|
| French-speaking native-born | Atlantic | 85% | 7% |
| Ontario | 58% | 19% | |
| Prairies | 40% | 23% | |
| Alberta | 34% | 26% | |
| British Columbia | 25.1% | 26.4% | |
| French-speaking immigrant | Atlantic | 60.6% | 14.6% |
| Ontario | 40.0% | 13.1% | |
| Prairies | 43.5% | 17.7% | |
| Alberta | 35.3% | 15.5% | |
| British Columbia | 26.5% | 16.5% |
Panel B: Selected CMA

Text version: Selected CMA
| most often | regularly | ||
|---|---|---|---|
| French-speaking native-born | Moncton | 83% | 10% |
| Ottawa | 71% | 15% | |
| Toronto | 34% | 26% | |
| Winnipeg | 43% | 24% | |
| Calgary | 34% | 27% | |
| Vancouver | 27.2% | 28.0% | |
| French-speaking immigrant | Moncton | 63.2% | 22.1% |
| Ottawa | 59.4% | 13.0% | |
| Toronto | 30.2% | 13.0% | |
| Winnipeg | 45.5% | 17.0% | |
| Calgary | 32.0% | 14.7% | |
| Vancouver | 24.8% | 15.5% |
The Atlantic region comprises the provinces of Newfoundland and Labrador, Nova Scotia, Prince Edward Island and New Brunswick. The Prairies region comprises the provinces of Manitoba and Saskatchewan.
Source: Statistics Canada, 2011 National Household Survey.
Chart 5.4: Percentage of the French-speaking immigrant and non immigrant population after redistribution of the French-English category who uses French most often (alone or with another language) at work by region, Canada less Quebec, 2011
Panel A: Regions
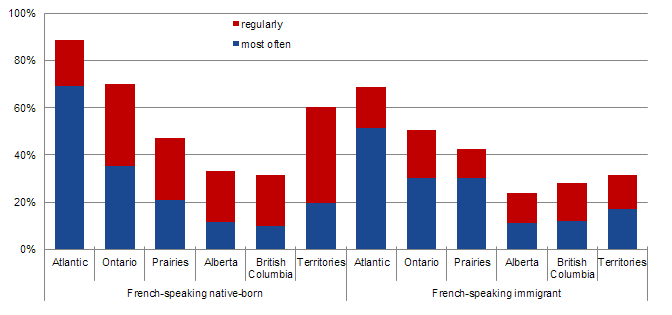
Text version: Regions
| most often | regularly | ||
|---|---|---|---|
| French-speaking native-born | Atlantic | 69% | 19% |
| Ontario | 36% | 35% | |
| Prairies | 21% | 26% | |
| Alberta | 12% | 22% | |
| British Columbia | 10% | 22% | |
| Territories | 19.6% | 40.6% | |
| French-speaking immigrant | Atlantic | 51.4% | 17.5% |
| Ontario | 30.1% | 20.5% | |
| Prairies | 30% | 13% | |
| Alberta | 11.1% | 12.7% | |
| British Columbia | 11.9% | 16.0% | |
| Territories | 17.2% | 14.5% |
Panel B: Selected CMAs
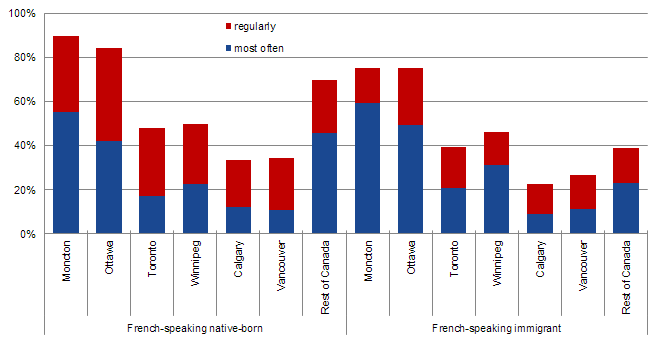
Text version: Selected CMAs
| most often | regularly | ||
|---|---|---|---|
| French-speaking native-born | Moncton | 55% | 34% |
| Ottawa | 42% | 43% | |
| Toronto | 17% | 31% | |
| Winnipeg | 23% | 27% | |
| Calgary | 12% | 21% | |
| Vancouver | 11% | 23% | |
| Rest of Canada | 45.9% | 24.0% | |
| French-speaking immigrant | Moncton | 59.3% | 15.9% |
| Ottawa | 49.5% | 25.8% | |
| Toronto | 20.6% | 18.6% | |
| Winnipeg | 31.3% | 15.0% | |
| Calgary | 8.9% | 13.6% | |
| Vancouver | 11% | 15% | |
| Rest of Canada | 23.2% | 15.6% |
The Atlantic region comprises the provinces of Newfoundland and Labrador, Nova Scotia, Prince Edward Island and New Brunswick. The Prairies region comprises the provinces of Manitoba and Saskatchewan.
Source: Statistics Canada, 2011 National Household Survey.
6 Couples in which at least one partner is a francophone immigrant and the intergenerational transmission of language
‘Francophone immigrant couple’ refers here to a couple in which at least one partner is a French FOLS or French-English FOLS immigrant. Both the number of such couples and their relative weight among couples living in Canada outside Quebec are fairly modest. Without regard to the presence of children under 18 years of age, there were approximately 61,800 of these couples in 2011. The 2011 NHS also enumerated 29,900 francophone couples with at least one minor child. Lastly, in 2011, there were 55,100 children under 18 years of age living with a couple in which at least one partner is a francophone.
This section examines the composition of couples with at least one francophone partner and with children under 18 years of age. It will consider these couples from the perspective of whether they are homogamous or mixed. However, the central focus of this section is the intergenerational transmission of language from parents to minor children in terms of mother tongue, language spoken in the parental home and first official language spoken (FOLS).
6.1 Couples in which at least one partner is a francophone immigrant
Data on couples in which at least one partner is a francophone immigrant were constructed in two stages. First, for all couples, we cross-tabulated the group defined by first official language spoken (FOLS) and the immigrant status of each partner. The groups defined by first official language spoken and immigrant status are as follows:
- French FOLS, Canadian-born
- French-English FOLS, Canadian-born
- French FOLS, immigrants
- French-English FOLS, immigrants
- Non-francophone immigrants and non-permanent residents
- Non-francophones, Canadian-born
We then selected only those couples in which at least one partner is both francophone (either French FOLS or French-English FOLS) and an immigrant. This cross-tabulation produced 11 types of couples, without regard to the sex of that partner.Footnote 8 Of these 11 couple types, five had small numbers and were therefore grouped into a residual category (other types of couples made up of at least one francophone immigrant) for purposes of the analyses presented below. We will therefore focus on the other six couple types with the largest numbers. The number and percentage distribution of the couple types are shown in Table 6.1.
The six main couple types alone account for more than 96% of all couples with at least one francophone immigrant partner that may or may not have minor children. The same is true for the children: nearly 95% of them live in families in which the parents form one of the six main types of couples. The largest type, accounting for more than one-third of couples, consists of a French-English FOLS immigrant and a non-francophone immigrant or non-permanent resident (NPR). Four other types each account for between 10% and 20% of couples; in three of them, at least one partner is French FOLS. The couple type consisting of two French FOLS partners, one of whom is an immigrant and the other is Canadian-born, represents 5.5% of couples with children under 18 years of age and 7.1% of all couples in which at least one partner is a francophone immigrant.
Table 6.1: Francophone opposite-sex couples with children under 18 years of age according to type of couple, Canada less Quebec, 2011
| Type of couple | Couples with children under 18 years old | Children under 18 years old | All couples |
|---|---|---|---|
| FOLS French immigrant plus FOLS French native-born | 5.5% | 5.2% | 7.1% |
| Two FOLS French immigrants | 18.2% | 20.4% | 15.0% |
| FOLS French immigrant plus native-born FOLS other | 10.3% | 10.2% | 12.6% |
| FOLS French immigrant plus immigrant FOLS other or non-permanent resident | 10.9% | 11.2% | 12.9% |
| Two FOLS French-English immigrants | 15.8% | 15.6% | 15.2% |
| FOLS French-English immigrant plus immigrant FOLS other or non-permanent resident | 33.6% | 31.8% | 33.0% |
| Other types | 5.7% | 5.6% | 4.3% |
| Total | 100.0% | 100.0% | 100.0% |
| Couples or children | 29,875 | 55,080 | 61,800 |
FOLS = Population of groups defined according to first official language spoken. The category 'FOLS other' includes FOLS groups 'English' and 'neither English nor French'.
Source: Statistics Canada, 2011 National Household Survey
6.2 Homogamy and mixed couples
Here we will examine the homogamous or mixed nature of couples with children under 18 years of age in which at least one partner is a francophone immigrant. The criterion of being either homogamous or mixed refers to the mother tongue of each spouse. As a result, a homogamous couple is defined as one in which both spouses have the same mother tongue(s), whereas a mixed couple comprises two spouses with one or more different mother tongues. We could have chosen another criterion for defining the homogamous or mixed nature of couples, such as the language spoken most often at home or the first official language spoken (FOLS), but we chose mother tongue because it is usually this language that parents pass on to their children. This brief foray into the heart of a complex subject will shed light on the nature of intergenerational transmission of a language that occurs within families in which one parent is a francophone immigrant.
There are many types of homogamous and mixed couples with children under 18 in which at least one parent is a francophone immigrant (Chart 6.1). With one exception, each type of couple tends to be characterized by a dominant form of homogamy or mixedness. Couples with two French FOLS partners make up the majority of homogamous francophone couples, that is, couples in which the mother tongue of both partners is French. Among couples consisting of a Canadian-born French FOLS person and a French FOLS immigrant, just over one-third (34%) are mixed, with one partner having French as a mother tongue and the other a mother tongue that is not an official language. Among couples of two French FOLS immigrants, 23% are homogamous couples with an ‘other’ mother tongue.
Of couples in which one partner is a French FOLS immigrant and the other is a non-francophone (Canadian-born or immigrant) or a non-permanent resident, the vast majority are mixed. Almost all unions (98.6%) between a French FOLS immigrant and a non-francophone Canadian-born person are mixed couples, mainly ‘French + English.’ Where the other partner is a non-francophone immigrant or non-permanent resident, 35% of such couples are mixed ‘French + English’ and 43% are ‘French + a non-official language.’
Furthermore, more than 90% of homogamous couples who share the same non-official language comprise two French-English FOLS immigrants (94%) or a French-English FOLS immigrant and a non-francophone immigrant or a non-permanent resident (91%).
In all, 53% of opposite-sex couples with minor children in which one partner is a francophone immigrant (French FOLS or French-English FOLS) are homogamous couples with the same non-official language. This tends to hinder the transmission of French as the mother tongue to the children of couples in which at least one immigrant partner is francophone. However, 30% are mixed unions, primarily ‘French + English’ and ‘French + non-official language’.
Chart 6.1: Opposite-sex couples with at least one Francophone immigrant partner with children under 18 years of age according to the homogamous or mixed nature of the couple and the mother tongue of both partners, by type of couple, Canada less Quebec, 2011
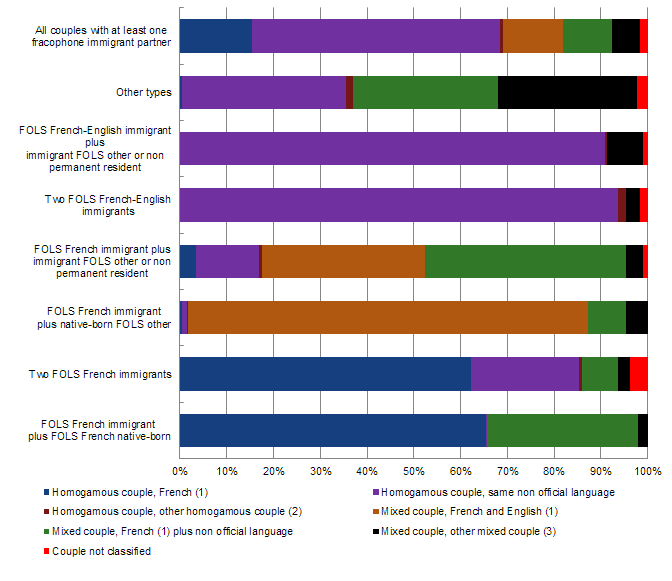
Text version: Opposite-sex couples with at least one Francophone immigrant partner with children under 18 years of age according to the homogamous or mixed nature of the couple and the mother tongue of both partners, by type of couple, Canada less Quebec, 2011
| Category | Homogamous couple, FrenchChart 6.1 footnote 1 | Homogamous couple, same non official language | Homogamous couple, other homogamous coupleChart 6.1 footnote 2 | Mixed couple, French and EnglishChart 6.1 footnote 1 | Mixed couple, FrenchChart 6.1 footnote 1 plus non official language | Mixed couple, other mixed coupleChart 6.1 footnote 3 | Couple not classified |
|---|---|---|---|---|---|---|---|
| FOLS French immigrant plus FOLS French native-born |
66% | 0% | 0% | 0% | 32% | 2% | 0% |
| Two FOLS French immigrants | 62% | 23% | 1% | 0% | 8% | 2% | 4% |
| FOLS French immigrant plus native-born FOLS other |
1% | 1% | 0% | 86% | 8% | 5% | 0% |
| FOLS French immigrant plus immigrant FOLS other or non permanent resident |
3% | 13% | 1% | 35% | 43% | 4% | 1% |
| Two FOLS French-English immigrants | 0% | 94% | 2% | 0% | 0% | 3% | 2% |
| FOLS French-English immigrant plus immigrant FOLS other or non permanent resident |
0% | 91% | 0% | 0% | 0% | 8% | 1% |
| Other types | 0% | 35% | 2% | 0% | 31% | 30% | 2% |
| All couples with at least one fracophone immigrant partner |
15% | 53% | 1% | 13% | 10% | 6% | 2% |
FOLS = Population of groups defined according to first official language spoken.
The category FOLS other includes FOLS groups "English" and "neither English nor French".
Source: Statistics Canada, 2011 National Household Survey.
6.3 Intergenerational transmission of French
Intergenerational language transmission (language transmitted from parents to their children) is influenced by a number of factors, such as the linguistic characteristics of each parent, their place of origin and residence, their socioeconomic profile and the children’s characteristics. These factors combine to determine which language(s) the children will inherit and which language(s) they are likely to use in their daily lives.
6.4 Mother tongue
Overall, 43% of children brought up in a francophone immigrant family (in which a least one partner in the couple is a francophone immigrant) have a language other than French or English as their mother tongue (Table 6.2). French is transmitted as a mother tongue to only 28% of children (includes transmission of both French and English), which is similar to the proportion of those to whom only English is transmitted (29%). There is considerable variation from one type of couple to another. However, as regards the transmission of French to children, two types of couples stand out from the others: in both types, French is the first official language of each partner (French FOLS). Couples consisting of a French FOLS Canadian-born person and a French FOLS immigrant seem best to ensure (91%) that French is transmitted to the children (includes transmission of French and English). Conversely, the transmission of French to children under 18 years of age is low or very low for two types of couples: two French-English FOLS immigrants, and one French-English FOLS immigrant and a non-francophone immigrant or non-permanent resident.
Table 6.2: Percentage distribution of children under 18 years of age living with opposite-sex Francophone couples according to mother tongue by type of couple, Canada less Quebec, 2011
| Type of parents' couple | English alone or with another language | French alone or with another language |
English and French, with or without another language | Other language alone | Total |
|---|---|---|---|---|---|
| FOLS French immigrant plus FOLS French native-born | 5.2% | 90.8% | 0.3% | 3.6% | 100.0% |
| Two FOLS French immigrants | 16.7% | 69.0% | 2.8% | 11.6% | 100.0% |
| FOLS French immigrant plus native-born FOLS other | 73.4% | 20.2% | 4.9% | 1.6% | 100.0% |
| FOLS French immigrant plus immigrant FOLS other or non-permanent resident | 58.1% | 21.1% | 4.1% | 16.8% | 100.0% |
| Two FOLS French-English immigrants | 19.3% | 6.1% | 2.7% | 71.9% | 100.0% |
| FOLS French-English immigrant plus immigrant FOLS other or non-permanent resident | 21.3% | 0.8% | 0.5% | 77.4% | 100.0% |
| Other types | 22.3% | 26.2% | 5.0% | 46.5% | 100.0% |
| All couples | 28.7% | 25.9% | 2.4% | 43.0% | 100.0% |
FOLS = Population of groups defined according to first official language spoken. The category 'FOLS other' includes FOLS groups 'English' and 'neither English nor French'.
Source: Statistics Canada, 2011 National Household Survey
English is transmitted more commonly than French by two types of couples. First, 73% of couples consisting of a French FOLS immigrant and a non-francophone native-born Canadian transmit English to their children under the age of 18, compared with 20% who transmit French only. Second, 58% of couples made up of a French FOLS immigrant and a non-francophone immigrant or a non-permanent resident transmit English to their children, compared with 21% for French transmission only.
In most cases (43%), non-official mother tongues are found to be transmitted to children for all types of couples with at least one francophone immigrant partner. A non-official language is transmitted to children in a majority of cases for two types of couples (disregarding the residual category “other types”): couples with two French-English FOLS immigrants (72%) and those made up of a French-English FOLS immigrant and a non-francophone immigrant or a non-permanent resident (77%).
6.5 Language spoken at home
With regard to the language spoken at home by the children of couples in which at least one partner is a francophone immigrant, a comparable percentage of children under the age of 18 speak English (37%) or a non-official language (36%) most often at home (Table 6.3). Furthermore, 24% of children speak French most often at home, and this percentage rises to 27% if children who speak both French and English are added. Among couples with two French FOLS partners, a majority of children speak French most often at home: 86% of children of couples consisting of a Canadian-born person and an immigrant, and 69% of children of two immigrants. These percentages rise to 88% and 73% if the use of French and English are included.
In the other types of couples, most children tend to speak either English or a non-official language. In three types of couples in particular, French ranks third among the languages spoken most often at home, behind English and a non-official language.
Data on language spoken most often at home was combined with data on language spoken on a regular basis at home to paint a more complete picture of the use of French at home by children under the age of 18 who have at least one francophone immigrant as a parent (Table 6.4). The degree of use of French at home barely increases, since only 11% of children speak French on a regular basis at home. If the four categories of use of French at home shown in Table 6.4 are totalled, slightly more than one-third (38%) of children speak French either most often or on a regular basis at home.
Table 6.3: Percentage distribution of children under 18 years of age living with opposite-sex Francophone couples according to language most often spoken at home by type of couple, Canada less Quebec, 2011
| Type of parents' couple | English alone or with another language | French alone or with another language |
English and French, with or without another language | Other language alone | Total |
|---|---|---|---|---|---|
| FOLS French immigrant plus FOLS French native-born | 11.2% | 86.4% | 1.3% | 1.1% | 100.0% |
| Two FOLS French immigrants | 21.9% | 69.3% | 3.8% | 5.0% | 100.0% |
| FOLS French immigrant plus native-born FOLS other | 81.5% | 13.9% | 3.6% | 1.0% | 100.0% |
| FOLS French immigrant plus immigrant FOLS other or non-permanent resident | 71.9% | 16.2% | 3.3% | 8.6% | 100.0% |
| Two FOLS French-English immigrants | 25.7% | 4.7% | 4.4% | 65.3% | 100.0% |
| FOLS French-English immigrant plus immigrant FOLS other or non-permanent resident | 32.1% | 0.5% | 1.6% | 65.8% | 100.0% |
| Other types | 27.6% | 17.0% | 9.1% | 46.2% | 100.0% |
| All couples | 37.2% | 23.7% | 3.3% | 35.9% | 100.0% |
FOLS = Population of groups defined according to first official language spoken. The category 'FOLS other' includes FOLS groups 'English' and 'neither English nor French'.
Source: Statistics Canada, 2011 National Household Survey
Table 6.4: Percentage distribution of children under 18 years of age living with opposite-sex Francophone couples according to the level of French use at home by type of couple, Canada less Quebec
| Type of parents' couple | Most often - French alone or with another language | Most often - French and English alone or with another language | Regularly - French alone or with another language | Regularly - French and English alone or with another language | Total French |
|---|---|---|---|---|---|
| FOLS French immigrant plus FOLS French native-born | 86.4% | 1.3% | 6.6% | 0.0% | 94.3% |
| Two FOLS French immigrants | 69.3% | 3.8% | 7.5% | 0.5% | 81.1% |
| FOLS French immigrant plus native-born FOLS other | 13.9% | 3.6% | 24.6% | 0.1% | 42.2% |
| FOLS French immigrant plus immigrant FOLS other or non-permanent resident | 16.2% | 3.3% | 15.8% | 0.3% | 35.6% |
| Two FOLS French-English immigrants | 4.7% | 4.4% | 9.5% | 5.6% | 24.1% |
| FOLS French-English immigrant plus immigrant FOLS other or non-permanent resident | 0.5% | 1.6% | 2.1% | 3.0% | 7.1% |
| Other types | 17.0% | 9.1% | 13.4% | 5.3% | 44.9% |
| All couples | 23.7% | 3.3% | 9.0% | 2.2% | 38.3% |
FOLS = Population of groups defined according to first official language spoken. The category 'FOLS other' includes FOLS groups 'English' and 'neither English nor French'.
Source: Statistics Canada, 2011 National Household Survey
6.6 First official language spoken
We examined the transmission of languages according to the criterion of the first official language spoken (FOLS) by children of a couple in which at least one partner is a francophone immigrant. These results differ from those based on mother tongue and language spoken at home. In 54% of cases, children’s first official language spoken is English, compared with 29% for French (Table 6.5). French is the first official language spoken of most children of the same two types of French FOLS couples here as well: couples made up of an immigrant and a Canadian-born individual (94%) and two immigrants (76%). English is the dominant language of children under 18 years living with one of three types of couples in which at least one partner is a francophone immigrant. Also, nearly one-third of children of couples composed of two French-English FOLS immigrants have both English and French as their first official language spoken.
Table 6.5: Percentage distribution of children under 18 years of age living with opposite-sex Francophone couples according to first official language spoken (FOLS) by type of couple, Canada less Quebec
| Type of parents' couple | English only | French only | English and French | Neither English nor French | Total |
|---|---|---|---|---|---|
| FOLS French immigrant plus FOLS French native-born | 6.0% | 93.9% | 0.1% | 0.0% | 100.0% |
| Two FOLS French immigrants | 20.4% | 76.2% | 2.1% | 1.3% | 100.0% |
| FOLS French immigrant plus native-born FOLS other | 78.4% | 19.3% | 2.3% | 0.1% | 100.0% |
| FOLS French immigrant plus immigrant FOLS other or non-permanent resident | 71.6% | 22.7% | 3.8% | 1.9% | 100.0% |
| Two FOLS French-English immigrants | 49.2% | 9.1% | 32.0% | 9.7% | 100.0% |
| FOLS French-English immigrant plus immigrant FOLS other or non-permanent resident | 73.8% | 1.5% | 16.0% | 8.7% | 100.0% |
| Other types | 43.3% | 31.7% | 17.7% | 7.3% | 100.0% |
| All couples | 54.1% | 28.6% | 12.1% | 5.2% | 100.0% |
FOLS = Population of groups defined according to first official language spoken. The category 'FOLS other' includes FOLS groups 'English' and 'neither English nor French'.
Source: Statistics Canada, 2011 National Household Survey
In summary, we see that the transmission of French depends both on the type of couple with whom the children live and the context in which that language is used. French is primarily transmitted by couples with French as their only first official language. The majority of children under the age of 18, with parents in this category, have French as their mother tongue and as their first official language, and speak French most often at home. For other types of couples, the situation is completely different, with English or a non-official language being primarily transmitted. The context is also important. French is transmitted to 28% of children as a mother tongue, to 38% of children as a language spoken at home (at least on regular basis), and to 41% of children as the first official language spoken (FOLS). Moreover, competition from English is strong in all contexts: English (excluding cases of simultaneous transmission of French and English) is transmitted to 29% of children as a mother tongue, to 61% of children as a language spoken at home, and to 54% of children as an FOLS. In all three cases of intergenerational transmission, English outperforms French in terms of the number of children to whom the language is transmitted. Lastly, the transmission of non-official languages to children under the age of 18 is considerable and more widespread than French: 43% of children have a non-official language as their mother tongue, and nearly the same proportion (47%) use a non-official language at least on a regular basis at home (not including cases where a non-official language is transmitted simultaneously with French or English).
7 Education and diplomas
Along with work experience acquired over the course of a lifetime, education and diplomas are fundamental components of an individual’s human or intellectual capital. How the human capital of immigrants can be transferred from one jurisdiction to another is a matter involving a number of factors, including the field of study or experience associated with this human capital, the country where it was acquired, the host country’s institutional and legal framework governing the recognition of qualifications, and the individual characteristics of the persons involved in the process. The outcome of the process to recognize foreign credentials and work experience clearly plays a role in determining how successfully immigrants integrate into the labour market.
Neither the censuses nor the NHS provide any direct information on the recognition of foreign credentials or work experience. However, some questions can help determine the highest certificate or diploma earned by the degree level, the country in which it was earned and the main field of study.
7.1 Diploma or degree by highest level of education
Immigrants have a higher level of education than persons born in Canada. The reason behind this is the selection process for independent immigrants, who are chosen based on the points system, which favours education and other personal characteristics conducive to integration into Canadian society. In the 2011 NHS, 45% of male French FOLS and French-English FOLS immigrants had a bachelor’s degree or higher (master’s, doctorate), compared with 15% of Canadian-born francophones (Table 7.1) and roughly 20% for Canadian-born French-English FOLS persons. Among non-francophone immigrants, 30% had a university diploma at or above the bachelor’s level.
The number of French FOLS immigrant males with no diploma or certificate (2,900) is smaller than those with a post-graduate degree, such as a master’s or doctorate (60,285). The same applies to French-English FOLS immigrants. However, in the other three groups, the population of persons with no certificate or diploma exceeds the population with a post-graduate degree. Among non-francophone immigrants, 415,000 had no diploma or certificate, compared with 269,400 who had a master’s degree or doctorate. In terms of relative weight, 25% of the Canadian-born francophone population aged 15 and over in 2011 had no diploma, compared with 9% of French FOLS immigrants, 13% of male French-English FOLS immigrants, and 16% of non-francophone immigrants.
The distribution of the female population by highest diploma or certificate earned is similar to that of males. We observe that female immigrants—both francophone and non-francophone—have a higher education level than Canadian-born female francophones, but the differences are smaller than for males (Table 7.2). Differences may be noted between linguistic groups within the immigrant population. Like males, francophone female immigrants tend to have higher-level diplomas than their non-francophone counterparts, while more non-francophone female immigrants than French-speaking female immigrants have no certificate or diploma.
Table 7.1: Male population aged 15 and over according to immigrant status, first official language spoken (FOLS) and highest certificate, diploma or degree, Canada less Quebec, 2011
| Highest certificate, diploma or degree | Native-born - French | Native-born - French and English | Immigrant - French | Immigrant - French and English | Other |
|---|---|---|---|---|---|
| No certificate or diploma | 88,950 | 1,990 | 2,905 | 4,230 | 415,035 |
| High school graduation certificate or equivalency certificate | 80,300 | 2,035 | 5,550 | 5,675 | 551,500 |
| Trade, apprenticeship certificate or diploma | 55,775 | 420 | 3,215 | 2,105 | 262,115 |
| College, CEGEP and university certificate below bachelor level | 73,675 | 1,010 | 6,665 | 5,955 | 531,415 |
| Bachelor's degree | 39,820 | 975 | 7,440 | 8,840 | 504,275 |
| University degree above bachelor's level | 14,195 | 325 | 6,285 | 6,900 | 269,395 |
| Total | 352,710 | 6,760 | 32,060 | 33,705 | 2,533,740 |
| Highest certificate, diploma or degree | Native-born - French | Native-born - French and English | Immigrant - French | Immigrant - French and English | Other |
|---|---|---|---|---|---|
| No certificate or diploma | 25% | 30% | 9% | 13% | 16% |
| High school graduation certificate or equivalency certificate | 23% | 30% | 17% | 17% | 22% |
| Trade, apprenticeship certificate or diploma | 16% | 6% | 10% | 6% | 10% |
| College, CEGEP and university certificate below bachelor level | 21% | 15% | 21% | 18% | 21% |
| Bachelor's degree | 11% | 14% | 23% | 26% | 20% |
| University degree above bachelor's level | 4% | 5% | 20% | 21% | 11% |
| Total | 100.0% | 100.0% | 100.0% | 100.0% | 100.0% |
The category 'FOLS other' includes FOLS groups 'English' and 'neither English nor French'.
Source: Statistics Canada, 2011 National Household Survey
Table 7.2: Female population aged 15 and over according to immigrant status, first official language spoken (FOLS) and highest certificate, diploma or degree, Canada less Quebec
| Highest certificate, diploma or degree | Native-born - French | Native-born - French and English | Immigrant - French | Immigrant - French and English | Other |
|---|---|---|---|---|---|
| No certificate or diploma | 88,435 | 2,270 | 4,880 | 4,865 | 550,170 |
| High school graduation certificate or equivalency certificate | 91,560 | 2,585 | 6,900 | 6,830 | 684,960 |
| Trade, apprenticeship certificate or diploma | 29,160 | 235 | 2,520 | 1,515 | 148,705 |
| College, CEGEP and university certificate below bachelor level | 98,920 | 1,180 | 9,785 | 7,105 | 671,810 |
| Bachelor's degree | 59,620 | 2,050 | 7,805 | 10,730 | 560,505 |
| University degree above bachelor's level | 15,300 | 555 | 4,570 | 6,010 | 206,700 |
| Total | 383,000 | 8,885 | 36,455 | 37,060 | 2,822,840 |
| Highest certificate, diploma or degree | Native-born - French | Native-born - French and English | Immigrant - French | Immigrant - French and English | Other |
|---|---|---|---|---|---|
| No certificate or diploma | 23% | 26% | 13% | 13% | 20% |
| High school graduation certificate or equivalency certificate | 24% | 29% | 19% | 18% | 24% |
| Trade, apprenticeship certificate or diploma | 8% | 3% | 7% | 4% | 5% |
| College, CEGEP and university certificate below bachelor level | 26% | 13% | 27% | 19% | 24% |
| Bachelor's degree | 16% | 23% | 21% | 29% | 20% |
| University degree above bachelor's level | 4% | 6% | 13% | 16% | 7% |
| Total | 100.0% | 100.0% | 100.0% | 100.0% | 100.0% |
The category 'FOLS other' includes FOLS groups 'English' and 'neither English nor French'.
Source: Statistics Canada, 2011 National Household Survey
The differences between males and females vary by group defined by first official language spoken (FOLS) and immigrant status and by level of diploma or certificate. Among Canadian-born francophones, the percentage of males with no diploma or degree is slightly higher than the percentage of females (25% versus 23%). Conversely, the proportion of female immigrants with no diploma or certificate is greater than that of male immigrants. At the other end of the education spectrum, the proportion of males with a degree above the bachelor level is greater than that of females in all groups, except the Canadian-born French FOLS group (4% for both males and females). At the other levels, the differences between males and females can be explained by the fact that relatively few women have a trade school certificate or diploma or an apprenticeship certificate. This results in stronger representation in the category immediately above (the population with a college diploma or certificate or a university certificate below bachelor’s level). A similar proportion of male and female immigrants hold a bachelor’s degree, while among Canadian-born francophones, more females (16%) earned a bachelor’s than males (11%).
7.2 Place where highest diploma or degree was earned
It might be expected that the vast majority of immigrants earned their highest certificate or diploma abroad, in light of the selection process that many immigrants go through. However, as may be seen in Table 7.3, 45% to 60% of immigrants, both francophone and non-francophone, male and female, earned their highest diploma or certificate in Canada. This partly reflects the fact that many immigrants came to Canada when they were in their teens or younger. A slightly higher proportion of male than female immigrants earned their highest diploma or degree abroad. Variations among groups defined by first official language spoken (FOLS) are significant. For example, 48% of the entire French FOLS immigrant population earned their highest diploma or degree abroad, which means that a slight majority of them earned it in Canada. Conversely, a minority of French-English FOLS immigrants and non-francophone immigrants earned their highest certificate or diploma in Canada, compared with 59% of French-English FOLS immigrants and 53% of non-francophone immigrants who received it from a foreign institution.
Table 7.3: Immigrants aged 15 and over with a certificate or a diploma according to first official language spoken (FOLS) and the place where the certificate or diploma was obtained, Canada less Quebec, 2011
| Place where the certificate or diploma was obtained | French | French and English | Other |
|---|---|---|---|
| Men: Canadian diploma or grade | 11,465 | 9,310 | 730,935 |
| Men: Foreign diploma or grade | 12,140 | 14,485 | 836,270 |
| Women: Canadian diploma or grade | 13,590 | 10,835 | 750,090 |
| Women: Foreign diploma or grade | 11,085 | 14,525 | 837,620 |
| Total: Canadian diploma or grade | 25,055 | 20,150 | 1,481,025 |
| Total: Foreign diploma or grade | 23,225 | 29,010 | 1,673,890 |
| Men: Foreign diploma or grade (percentage) | 51% | 61% | 53% |
| Women: Foreign diploma or grade (percentage) | 45% | 57% | 53% |
| Total: Foreign diploma or grade (percentage) | 48.1% | 59.0% | 53.1% |
The category 'FOLS other' includes FOLS groups 'English' and 'neither English nor French'.
Source: Statistics Canada, 2011 National Household Survey.
Two main factors explain the high proportion of immigrants who received their highest academic qualification in Canada. First, a number of immigrants arrived in Canada or were granted permanent residence status at too young an age to have had the opportunity to study or complete their education abroad. In the 2011 NHS, nearly 28% of immigrants living in Canada outside Quebec came to Canada before 15 years of age, and 23% did so between 15 and 24 years. Some studiesFootnote 9 find that immigrants who came to Canada (and who were granted permanent residence status) before the age of 28 have a low likelihood of having the opportunity to do their university studies abroad. Also, a number of foreign students decide to stay in Canada at the end of their studies, and therefore receive permanent residence status after completing their education in Canada. However, the NHS does not reveal which permanent residents had foreign student status in Canada at some point in their life.
The age at which permanent residence is granted directly affects the percentage of immigrants who earned their diploma or degree abroad. A minority of immigrants who came to Canada before the age of 25 earned their highest diploma abroad (Chart 7.1). Among those who arrived before the age of 15, 94% earned that diploma in Canada, compared with just under 65% of those who arrived between 15 and 24 years of age. Starting at age 25, the majority of immigrants acquired their highest certificate or diploma abroad. Even at these ages, we note that the higher the age at which permanent residence is received, the larger the proportion of those who earned their highest academic qualification abroad (with percentages ranging between 70% and 90%) and the smaller the proportion of those who did so in Canada. These findings confirm that French FOLS immigrants are the group with the lowest proportion of those who earned their highest academic qualification abroad, especially among those who came to Canada as an adult (25 years of age or older).
Chart 7.1: Percentage of immigrants aged 15 and over with a certificate or a diploma obtained abroad according to first official language spoken (FOLS) and age at which permanent residence was obtained, Canada less Quebec, 2011

Text version: Percentage of immigrants aged 15 and over with a certificate or a diploma obtained abroad according to first official language spoken (FOLS) and age at which permanent residence was obtained, Canada less Quebec, 2011
| Age | French FOLS immigrant | French-English FOLS immigrant | Immigrant FOLS other |
|---|---|---|---|
| 0 to 14 | 5.6% | 8.7% | 6.3% |
| 15 to 24 | 33% | 32% | 37% |
| 25 to 34 | 60% | 71% | 71% |
| 35 to 44 | 75% | 87% | 84% |
| 45 to 54 | 81% | 93% | 89% |
| 55 and over | 87% | 96% | 94% |
FOLS = Population of groups defined according to first official language spoken.
The category FOLS other includes FOLS groups "English" and "neither English nor French".
Sources: Statistics Canada, 1991 to 2006 censuses, and 2011 National Household Survey.
For immigrants who earned their highest credential abroad, it is valuable to provide results based on the country or region where education was completed (Canadian-born francophones are included here for comparison purposes). Five geographic entities (two countries, three regions) have been identified: the United States, the United Kingdom, francophone Europe, the rest of Western Europe with Australia and New Zealand,Footnote 10 and the rest of the world, where the educational institutions are known to be less prestigious than in the first four geographic entities. Francophone Europe was identified as a separate entity because French-speaking immigrants are a population of interest. Francophone Europe includes the following countries: France (excluding its overseas departments and territories), Belgium, Switzerland, Luxembourg and Monaco. The contribution of the latter two countries to the European Francophonie group is very minor.
Among those who earned their highest diploma or degree abroad, there are major differences by country or region of study when we compare the four groups defined by first official language spoken (FOLS) and immigrant status. Firstly, 53% of Canadian-born francophones (French FOLS) who earned their highest certificate or diploma abroad earned it in the United States; the rest are distributed among the other four geographic entities (Chart 7.2). For immigrants, the distributions are completely different. For instance, a considerable share of French FOLS immigrants (just over 30%) acquired their highest diploma or degree in francophone Europe, especially in France, while 60% earned it elsewhere in the world. Furthermore, over 70% of the rest of the immigrants (including French-English FOLS) earned their diploma and certificate elsewhere in the world, meaning a country where the educational institutions are less prestigious than in the United States and Western Europe.
Chart 7.2.: Population of four groups defined by the first official language spoken (FOLS) and immigrant status, by country or region where the certificate or diploma was obtained, population aged 15 and over with a certificate or a diploma obtained abroad, Canada less Quebec, 2011
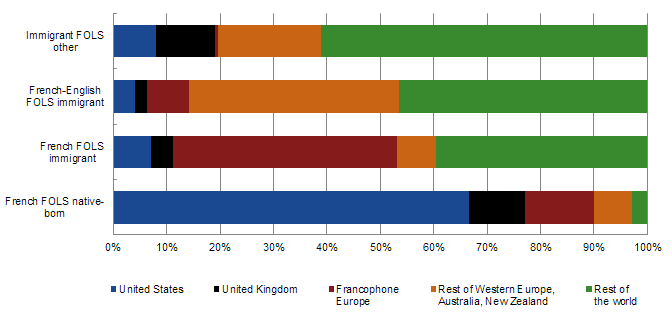
Text version: Population of four groups defined by the first official language spoken (FOLS) and immigrant status, by country or region where the certificate or diploma was obtained, population aged 15 and over with a certificate or a diploma obtained abroad, Canada less Quebec, 2011
| Country/Region | French FOLS native-born | French FOLS immigrant | French-English FOLS immigrant | Immigrant FOLS other |
|---|---|---|---|---|
| United States | 67% | 7% | 4% | 8% |
| United Kingdom | 11% | 4% | 2% | 11% |
| Francophone Europe |
13% | 42% | 8% | 1% |
| Rest of Western Europe, Australia, New Zealand |
7% | 7% | 39% | 19% |
| Rest of the world |
3% | 40% | 47% | 61% |
FOLS = Population of groups defined according to first official language spoken.
The category FOLS other includes FOLS groups "English" and "neither English nor French".
Source : Statistics Canada, 2011 National Household Survey
7.3 Field of study
Data from the 2011 NHS are used to examine the field of study for the highest certificate or diploma earned in Canada or abroad. Here, the analysis is limited to academic fields of study, thereby excluding certificates and diplomas for trades, in which women are poorly represented. Ten major fields of study were identified based on a detailed classification of the different categories (of which there were more than one thousand) offered in the NHS.
From the outset, the most striking differences are between men and women. This is a result of the differences in the sexes’ choice of education and career that continue to prevail to this day (Charts 7.3-a and b). For example, a much larger proportion of men than women studied engineering, while women are overrepresented compared with their male counterparts in the health care, education and social science.
There are also major differences between groups defined by first official language spoken (FOLS) and immigrant status. French-speaking persons born in Canada stand out from their immigrant counterparts firstly because a small proportion have a university degree in engineering, or, to a lesser extent, a university degree in natural sciences. By contrast, they are more likely to have a certificate or diploma in education. Similarly, French FOLS immigrants stand out from the other immigrants (both French-English FOLS and non-francophones) by the small percentage who have a university degree in engineering. However, they are more highly represented in education, especially women.
Chart 7.3: Population of four groups defined by the first official language spoken (FOLS) and immigrant status, aged 15 and over with a university certificate or diploma according to the field of study, immigrant status and first official language spoken, Canada less Quebec, 2011
Panel A: Men

Text version: Men
| Field of study | French FOLS native-born | French FOLS immigrant | French-English FOLS immigrant | Immigrant FOLS other |
|---|---|---|---|---|
| Engineering | 13% | 22% | 33% | 30% |
| Natural & applied science |
7% | 8% | 9% | 9% |
| Health | 8% | 7% | 8% | 8% |
| Computer science |
5% | 8% | 8% | 9% |
| Education | 17% | 6% | 3% | 4% |
| Social & behavioral science |
15% | 14% | 12% | 10% |
| Humanities | 9% | 9% | 7% | 6% |
| Arts, entertainment, communication |
2% | 2% | 1% | 2% |
| Business & commerce |
22% | 22% | 17% | 19% |
| Trades | 2% | 2% | 2% | 3% |
Panel B: Women
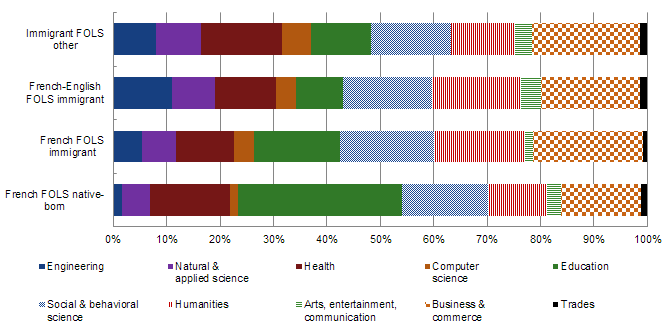
Text version: Women
| Field of study | French FOLS native-born | French FOLS immigrant | French-English FOLS immigrant | Immigrant FOLS other |
|---|---|---|---|---|
| Engineering | 2% | 5% | 11% | 8% |
| Natural & applied science |
5% | 6% | 8% | 8% |
| Health | 15% | 11% | 11% | 15% |
| Computer science |
1% | 4% | 4% | 5% |
| Education | 31% | 16% | 9% | 11% |
| Social & behavioral science |
16% | 18% | 17% | 15% |
| Humanities | 11% | 17% | 17% | 12% |
| Arts, entertainment, communication |
3% | 1% | 4% | 3% |
| Business & commerce |
15% | 20% | 19% | 20% |
| Trades | 1% | 1% | 1% | 1% |
FOLS = Population of groups defined according to first official language spoken.
The category FOLS other includes FOLS groups "English" and "neither English nor French".
Source : Statistics Canada, 2011 National Household Survey
Non-francophone immigrants and French-English FOLS immigrants have similar distributions according to the field of study for the highest university certificate or diploma. They are much more likely to have an engineering degree than French-speaking native-born Canadians and immigrants, but are not well represented in education. In other fields, especially those related to health and to business and commerce, the four groups have similar proportions.
French FOLS immigrants differ from Canadian-born francophones and the rest of immigrants (French-English FOLS and non-francophones) with respect to their education level and characteristics of the diplomas earned.
7.4 Regional variations in university education levels
Regional variations are examined based on the proportion of persons who completed a university diploma or certificate. In light of the large variations in education levels by age (or birth cohort) and sex within the population, the proportions were standardized by age and sex to neutralize the effects of the age-sex composition of each group on the proportions calculated.
The results show that between 40% and 55% of francophone immigrants outside Quebec have a university certificate or diploma, which is much higher than for the other two groups (Charts 7.4-a and b), except in the Atlantic region, where this proportion is slightly higher for non-francophone immigrants (43.4% compared with 42%), and in Ottawa, where these two groups have almost identical proportions. Of the three groups, the proportions are lowest for native-born Canadians (between 15% and 40%). There is nothing surprising in this finding, considering that the selection process that some immigrants wanting to settle in Canada go through takes education level into account.
From 2006 to 2011, there was a general increase in the proportion of persons with a university diploma or degree, regardless of their linguistic group or region. The only exception was for French FOLS immigrants in the Prairies region, whose proportion declined from 47.1% in 2006 to 41.7% in 2011. The size of the increase in the proportion of persons with a university diploma or degree differed from one region to another. The largest increase was for French FOLS immigrants in Alberta, 40.6% of whom held a university diploma or degree in 2006 and 49.7% in 2011. However, the increase was not as pronounced among Canadian-born French FOLS persons in Alberta, who went from 19.9% in 2006 to 22.4% in 2011. Consequently, the difference between Canadian-born French FOLS persons and French FOLS immigrants in Alberta was greater in 2011, with a gap of 21 percentage points in 2006 compared with 27 percentage points in 2011. The proportion of persons with a university diploma or degree in British Columbia increased by 4 to 5 percentage points in the three linguistic groups between 2006 and 2011.
In the CMAs, the difference between the proportion of French FOLS immigrants and the proportion of Canadian-born French FOLS persons and non-francophone immigrants with a university diploma or degree was smaller in 2011 than in 2006. For example, in Moncton, 49.2% of French FOLS immigrants, 28.5% of non-francophone immigrants and 23.2% of Canadian-born francophones held a university diploma or degree in 2006. In 2011, these proportions were 46.9%, 37.7% and 27.9%, respectively. The gap of 20 percentage points between francophone and non-francophone immigrants observed in 2006 narrowed to less than 10 percentage points in 2011. A similar change occurred in Winnipeg: a gap of 21 percentage points between these two groups in 2006 fell to 9 percentage points five years later.
It was only in Calgary that French FOLS immigrants with a university diploma or degree registered a larger increase (10 percentage points) than French FOLS persons born in Canada and non-francophone immigrants.
In summary, the education level of French FOLS immigrants is similar to that of French-English FOLS immigrants, but higher than that of Canadian-born persons and non-francophone immigrants, for both males and females. French FOLS immigrants differ from other immigrant groups in that a large proportion of them earned their diploma or certificate in Canada. Also, a larger proportion of those who earned their diploma or certificate abroad did so in Western Europe, especially in a francophone country, with France at the top of the list.
A smaller proportion of French FOLS immigrants than other immigrants (French-English FOLS and non-francophone) earned a university diploma or certificate in engineering.
On the basis of these findings, it is difficult to predict the chances of positive labour market outcomes for French FOLS immigrants compared with other immigrants. On the one hand, the level of education and the place where the diploma or certificate was earned would tend to favour their integration into the Canadian labour market. On the other, the small proportion who have a diploma or certificate in engineering—an occupation in demand on the Canadian labour market—could have the opposite effect.
Chart 7.4: Proportion (standardised by age and sex) of the population aged 25 to 64 with a university certificate or diploma according to immigrant status and first official language spoken (FOLS) (after redistribution of the French-English category), Canada less Quebec
Panel A: By region
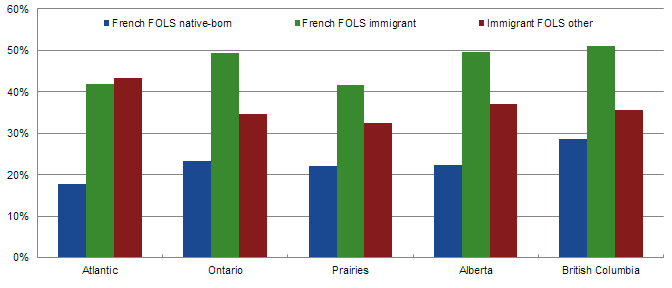
Text version: By region
| Region | French FOLS native-born | French FOLS immigrant | Immigrant FOLS other |
|---|---|---|---|
| Atlantic | 18% | 42% | 43% |
| Ontario | 23% | 49% | 35% |
| Prairies | 22% | 42% | 32% |
| Alberta | 22% | 50% | 37% |
| British Columbia | 29% | 51% | 36% |
Panel B: For selected census metropolitan areas (CMA)
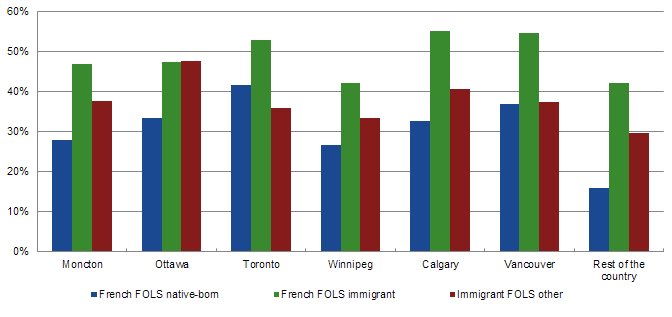
Text version: For selected census metropolitan areas (CMA)
| City | French FOLS native-born | French FOLS immigrant | Immigrant FOLS other |
|---|---|---|---|
| Moncton | 28% | 47% | 38% |
| Ottawa | 33% | 47% | 48% |
| Toronto | 42% | 53% | 36% |
| Winnipeg | 27% | 42% | 33% |
| Calgary | 33% | 55% | 41% |
| Vancouver | 37% | 55% | 37% |
| Rest of the country | 16% | 42% | 30% |
Standard used: native-born with first official language spoken French (after redistribution of the French-English category) living in Ontario.
FOLS = Population of groups defined according to first official language spoken.
The category FOLS other includes FOLS groups "English" and "neither English nor French".
Source: Statistics Canada, 2011 National Household Survey.
8 Labour force participation
Participation in the labour force is an essential marker of the economic integration of immigrants into Canadian society. The analysis below includes a descriptive study of labour force participation and unemployment rates captured in the 2011 NHS, as well as a more complex study in which a number of factors are introduced simultaneously to explain variations in labour force participation rates and unemployment rates between groups of immigrants defined by first official language spoken (FOLS).
8.1 Labour force participation rate and unemployment rate
An initial overview of the labour force participation of French FOLS immigrants at the time of the 2011 NHSFootnote 11 shows that the situation of the males in this group differs from that of Canadian-born francophone males and non-francophone immigrant males. Their overall participation rate (all working ages combined) is 73.1%, compared with 68.3% for both francophone Canadian-born and non-francophone immigrant males (Table 8.1). At 9%, the unemployment rate of male French FOLS immigrants is slightly higher than for Canadian-born males (8.7%) and non-francophone immigrant males (7%), but lower than for male French-English FOLS immigrants, who have the highest rate for males.
For females too, there are differences between the groups. While the participation rate of French FOLS immigrant females (60.9%) is almost the same as for French FOLS females born in Canada (59.5%), it is much higher than the rate for non-francophone immigrant females (56.4%). However, the unemployment rates of female French FOLS immigrants (10.5%) and French-English FOLS immigrants (11.4%) are higher than the rates for Canadian-born French FOLS females (6.2%) and non-francophone immigrant females (8.7%).
These indicators are quite sensitive to the age structure of the population. Both labour force participation and the probability of being unemployed and looking for work largely depend on one’s place in the life cycle. Youths are particularly affected by unemployment because of their lack of experience on the labour market. Also, there are gender-related differences, due in part to the fact that women must often interrupt their employment for family reasons, particularly when their children are born.
Table 8.1: Employment status of population aged 15 and over for four groups defined by the first official language spoken (FOLS) and immigrant status, by gender, Canada less Quebec, 2011
| Population | Employed | Unemployed | Not in the labour force | Total | Participation rate % | Unemployment rate % |
|---|---|---|---|---|---|---|
| French FOLS native-born | 219,795 | 21,040 | 111,870 | 352,710 | 68.3% | 8.7% |
| French FOLS immigrant | 21,330 | 2,105 | 8,630 | 32,060 | 73.1% | 9.0% |
| French-English FOLS immigrant | 21,485 | 2,460 | 9,760 | 33,710 | 71.0% | 10.3% |
| Immigrant FOLS other | 1,607,625 | 121,690 | 804,420 | 2,533,735 | 68.3% | 7.0% |
| Population | Employed | Unemployed | Not in the labour force | Total | Participation rate % | Unemployment rate % |
|---|---|---|---|---|---|---|
| French FOLS native-born | 213,785 | 14,210 | 155,005 | 383,000 | 59.5% | 6.2% |
| French FOLS immigrant | 19,885 | 2,340 | 14,235 | 36,455 | 60.9% | 10.5% |
| French-English FOLS immigrant | 20,480 | 2,630 | 13,955 | 37,060 | 62.3% | 11.4% |
| Immigrant FOLS other | 1,454,930 | 137,945 | 1,229,975 | 2,822,845 | 56.4% | 8.7% |
FOLS = Population of groups defined according to first official language spoken. The category ‘FOLS other’ includes FOLS groups ‘English’ and ‘neither English nor French’
Source: Statistics Canada, 2011 National Household Survey
An analysis of participation rates and unemployment rates by age enhances the results already provided for the population as a whole. With regard to participation rates, Canadian-born francophones—both male and female—stand out from other groups with higher rates at younger ages (ages 15 to 34 for males, 15 to 44 for females) and lower rates for persons aged 55 to 64 (Chart 8.1-a). The age curves of the three immigrant groups are similar.
The unemployment curves reveal more variability according to age, especially for females (Chart 8.1-b). The high unemployment rate for youths is borne out in all four groups for both sexes. It peaks at 28% among French-English FOLS immigrant males, while for females, the highest rate is observed among French FOLS immigrants (26%). The unemployment rate remains high, above 10%, for French FOLS and French-English FOLS immigrant males aged 25 to 34. By contrast, the unemployment rate of women remains high in all three immigrant groups, in all age groups except the 55-to-64 group.
In comparison with May 2006, the most noteworthy change is the almost generalized increase in the unemployment rate. However, it should be kept in mind that unemployment is especially sensitive to economic conditions. Changes in relation to 2006 show an increase in the unemployment rate of up to more than 14 percentage points. For example, the unemployment rate of French-English FOLS immigrant males aged 15 to 24 doubled in five years, rising from 13% in 2006 to 28% in 2011.Footnote 12
Chart 8.1: Participation rate and unemployment rate according to immigrant status, first official language spoken (FOLS) and age group and gender, Canada less Quebec, 2011
Panel A: Participation rate - Men
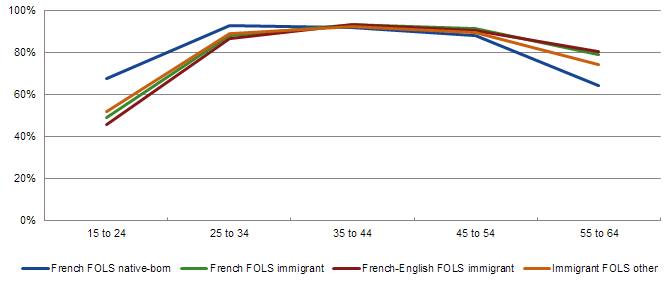
Text version: Participation rate - Men
| Age group | French FOLS native-born | French FOLS immigrant | French-English FOLS immigrant | Immigrant FOLS other |
|---|---|---|---|---|
| 15 to 24 | 67% | 49% | 45% | 52% |
| 25 to 34 | 93% | 88% | 86% | 89% |
| 35 to 44 | 92% | 93% | 93% | 92% |
| 45 to 54 | 88% | 92% | 91% | 90% |
| 55 to 64 | 64% | 79% | 80% | 74% |
Panel B: Participation rate - Women
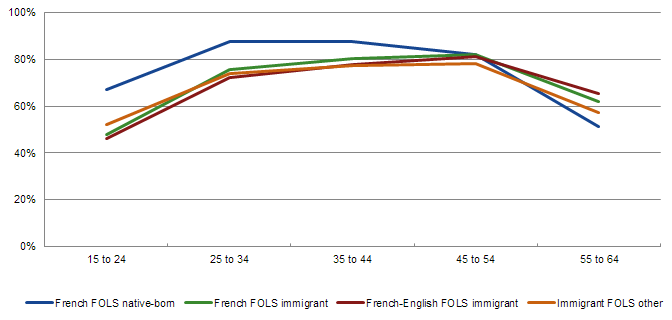
Text version: Participation rate - Women
| Age group | French FOLS native-born | French FOLS immigrant | French-English FOLS immigrant | Immigrant FOLS other |
|---|---|---|---|---|
| 15 to 24 | 67% | 48% | 46% | 52% |
| 25 to 34 | 88% | 76% | 72% | 74% |
| 35 to 44 | 88% | 80% | 78% | 77% |
| 45 to 54 | 82% | 82% | 81% | 78% |
| 55 to 64 | 51% | 62% | 65% | 57% |
FOLS = Population of groups defined according to first official language spoken.
The category FOLS other includes FOLS groups "English" and "neither English nor French".
Source: Statistics Canada, 2011 National Household Survey.
Panel C: Unemployment rate - Men
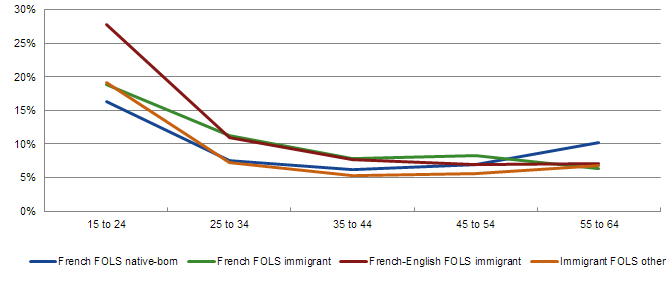
Text version: Unemployment rate - Men
| Age group | French FOLS native-born | French FOLS immigrant | French-English FOLS immigrant | Immigrant FOLS other |
|---|---|---|---|---|
| 15 to 24 | 16% | 19% | 28% | 19% |
| 25 to 34 | 7% | 11% | 11% | 7% |
| 35 to 44 | 6% | 8% | 8% | 5% |
| 45 to 54 | 7% | 8% | 7% | 6% |
| 55 to 64 | 10% | 6% | 7% | 7% |
Panel D: Unemployment rate - Women

Text version: Unemployment rate - Women
| Age group | French FOLS native-born | French FOLS immigrant | French-English FOLS immigrant | Immigrant FOLS other |
|---|---|---|---|---|
| 15 to 24 | 15% | 26% | 23% | 19% |
| 25 to 34 | 6% | 12% | 10% | 11% |
| 35 to 44 | 4% | 12% | 10% | 8% |
| 45 to 54 | 5% | 7% | 9% | 7% |
| 55 to 64 | 6% | 5% | 6% | 7% |
FOLS = Population of groups defined according to first official language spoken.
The category FOLS other includes FOLS groups "English" and "neither English nor French".
Source: Statistics Canada, 2011 National Household Survey.
8.2 Regional variations in participation and unemployment
This subsection examines regional variations in labour force participation rates and unemployment rates among three groups defined by first official language spoken (FOLS) and immigrant status. Since significant variations by age (or birth cohort) and sex within the population are observed for these two indicators, the rates were standardized by age and sex.
Participation rates vary little among regions or among the six urban centres included in the analysis, and the differences among the three groups are minimal.
Variations in the unemployment rate are another matter. In four of the five regions and in five CMAs, the unemployment rate of francophone immigrants is higher than that of Canadian-born francophones (which is generally the lowest of the three groups) and that of non-francophone immigrants (Charts 8.3-a and b). The unemployment rate of francophone immigrants ranges between 7% and 11% (10.5% in Winnipeg). Among Canadian-born francophones, the unemployment rate does not exceed 6%, except in the Atlantic region (10.6%).
Chart 8.2: Participation rate (standardised by age and sex) of the population aged 15 to 64 according to immigrants status and first official language spoken (FOLS) (after redistribution of the French-English category), Canada less Quebec
Panel A: By region
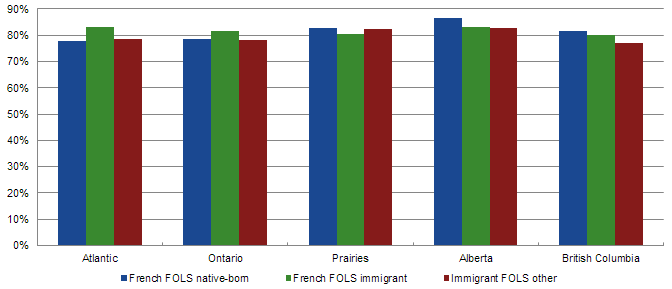
Text version: By region
| Region | French FOLS native-born | French FOLS immigrant | Immigrant FOLS other |
|---|---|---|---|
| Atlantic | 78% | 83% | 79% |
| Ontario | 78% | 82% | 78% |
| Prairies | 83% | 80% | 83% |
| Alberta | 86% | 83% | 83% |
| British Columbia | 82% | 80% | 77% |
Panel B: For selected census metropolitan areas (CMA)

Text version: For selected census metropolitan areas (CMA)
| City | French FOLS native-born | French FOLS immigrant | Immigrant FOLS other |
|---|---|---|---|
| Moncton | 81% | 82% | 78% |
| Ottawa | 80% | 78% | 76% |
| Toronto | 82% | 78% | 76% |
| Winnipeg | 83% | 84% | 80% |
| Calgary | 87% | 81% | 81% |
| Vancouver | 80% | 77% | 73% |
| Rest of the country | 76% | 77% | 77% |
Standard used: native-born with first official language spoken French (after redistribution of the French-English category) living in Ontario.
FOLS = Population of groups defined according to first official language spoken. The category FOLS other includes FOLS groups "English" and "neither English nor French".
The Atlantic region comprises Newfoundland and Labrador, Nova Scotia, Prince Edward Island and New Brunswick. The Prairies region comprises Manitoba and Saskatchewan.
Source: Statistics Canada, 2011 National Household Survey.
Chart 8.3: Unemployment rate (standardised by age and sex) of the population aged 15 to 64 according to immigrants status and first official language spoken (FOLS) (after redistribution of the French-English category), Canada less Quebec, 2011
Panel A: By region
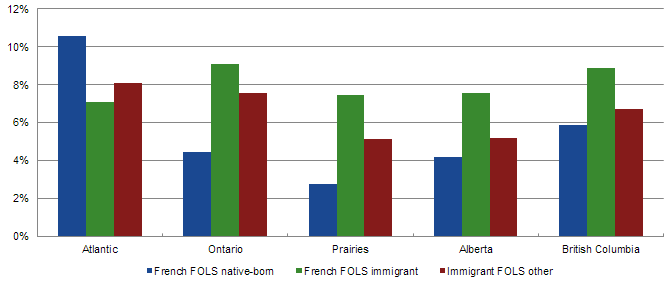
Text version: By region
| Region | French FOLS native-born | French FOLS immigrant | Immigrant FOLS other |
|---|---|---|---|
| Atlantic | 11% | 7% | 8% |
| Ontario | 4% | 9% | 8% |
| Prairies | 3% | 7% | 5% |
| Alberta | 4% | 8% | 5% |
| British Columbia | 6% | 9% | 7% |
Panel B: For selected census metropolitan areas (CMA)
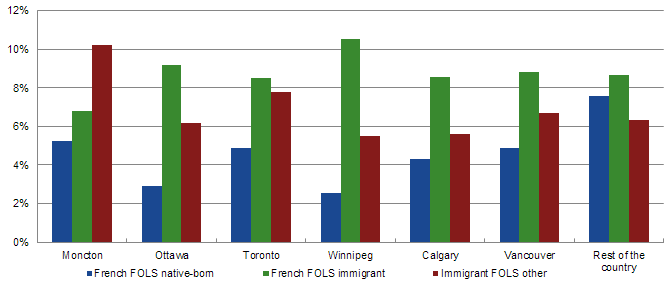
Text version: For selected census metropolitan areas (CMA)
| City | French FOLS native-born | French FOLS immigrant | Immigrant FOLS other |
|---|---|---|---|
| Moncton | 5% | 7% | 10% |
| Ottawa | 3% | 9% | 6% |
| Toronto | 5% | 8% | 8% |
| Winnipeg | 3% | 11% | 5% |
| Calgary | 4% | 9% | 6% |
| Vancouver | 5% | 9% | 7% |
| Rest of the country | 8% | 9% | 6% |
Standard used: native-born with first official language spoken French (after redistribution of the French-English category) living in Ontario.
FOLS = Population of groups defined according to first official language spoken. The category FOLS other includes FOLS groups "English" and "neither English nor French".
The Atlantic region comprises Newfoundland and Labrador, Nova Scotia, Prince Edward Island and New Brunswick. The Prairies region comprises Manitoba and Saskatchewan.
Source: Statistics Canada, 2011 National Household Survey.
8.3 Multivariate analysis of labour force participation and unemployment
To get a better understanding of the factors that influence immigrants’ labour force participation, multivariate analysis was used to measure the effect of a given characteristic on the participation rate and the unemployment rate, while controlling for the effect of other characteristics. Given the nature of the independent variables that take the binary form 0/1, logistic regression was chosen to carry out the analyses. Ten models were developed: five for participation rates and five for unemployment rates.
A limited number of explanatory variables (covariates) were selected, since the NHS has various limitations for the purposes of causal analysis, one being that it offers few variables that refer to a time prior to the phenomenon under study or retrospective variables. Such variables are essential for causal analysis.Footnote 13 The explanatory variables included in the models are grouped into three categories. First, there are control variables whose relationship with the phenomenon studied is well known, but which are essential to modelling. If they were omitted, this could lead to model misspecification and invalidate the results. Sex and age are control variables. Second are variables measured at the same time as the independent variables: knowledge of English and French, place of residence at the time of the census and category of immigrants defined by first official language spoken (FOLS). The causal effect of these four variables on participation and unemployment rates is uncertain, since they may be either the cause or the result of the phenomenon under study, or both. This is the problem of endogeneity, which is well known to econometricians. The models can provide information on the relationship between these variables and the independent variable, but any causal interpretation would be a riskier matter. Finally, three variables are retrospective in nature, meaning that they refer to a point in time preceding the day of the NHS, making causal inference possible. These are the period in which permanent residence was granted, university graduation and continent of birth.
The same five models were developed for each phenomenon, namely the participation rate and the unemployment rate. The first three models are specific to each group of immigrants: French FOLS immigrants, French-English FOLS immigrants, and non-francophone immigrants. The other two models are specific to the sexes, but include a variable for the immigrant category, which makes it possible to compare the participation rate and the unemployment rate for these three groups controlling for the effect of the other independent variables on the explanatory variable.
Tables 8.2 to 8.5 show the results of the logistic regressions, or odds ratios, the statistical significance level of the coefficients and the rates predicted by the model. The odds ratio measures the rate level (for participation or unemployment, as the case may be) expressed in relation to a reference category (identified by ref. in the tables). The value of the significance tests is informative, since in models with a large number of observations, the significance tests are generally positive (we do not reject the hypothesis of a statistically significant difference between the category of interest and the reference category for the categorical variable examined). The rates or probabilities predicted by the models are especially useful because they are directly comparable to the rates calculated on the basis of descriptive statistics, and are therefore easy to interpret. We will discuss these predicted rates below.
8.4 Participation rates
There are generally few surprises in the variations of participation rates within the population. Females are fewer in the labour market than males, as are younger persons (ages 15 to 24) and older persons (ages 55 to 64) in relation to the core age groups (Table 8.2). The gap between males and females is 13 percentage points for French FOLS immigrants and French-English FOLS immigrants, and is 16 percentage points for non-francophone immigrants. The shape of the age curves for participation rates is entirely comparable to those shown in Chart 8.1, with a plateau between ages 30 and 54 that is similar for the three immigrant groups.
Knowledge of the official languages among French FOLS immigrants and non-francophone immigrants is associated with greater participation in the labour force. The difference between those who know English and those who do not is significant: among French FOLS immigrants, the participation rate is 80.9% for those who reported knowing English and 71% for those who reported not knowing it. The corresponding percentages among non-francophone immigrants are 77.9% and 62.8% respectively. With regard to knowledge of French, there is indeed a difference for non-francophone immigrants, but it is small (roughly 1.5 percentage points).
The period in which permanent residence was granted affects labour market participation. Recent acquisition (i.e., between 2006 and 2011) of permanent residence status is associated with a lower participation rate for all three immigrant groups, although the effect is not statistically significant at the 0.05 level for French FOLS immigrants. Among immigrants who arrived earlier, variations in participation rates are less pronounced, although length of residence is seen to have an effect on participation. The longer ago they were granted residence, the greater the immigrants’ participation in the labour market, although this duration effect levels out for immigrants who arrived in 1975 or earlier.
Having a university diploma increases the participation rate, but the difference between the three immigrant groups is small. For French FOLS immigrants, the participation rate of persons who have a university diploma or certificate is almost 85.6%, compared with 78.2% for those who have no such qualification. This differential is borne out in the other two immigrant groups.
Immigrants’ continent of birth affects participation rates, and the effect varies slightly from one immigrant group to another. At less than 75%, labour market participation is lowest among French-English FOLS immigrants and non-francophone immigrants born in Asia and the Pacific region. For French FOLS immigrants, the predicted participation rate of those from Africa is 75.3%, compared with 81.4% for immigrants from the Americas. The participation rate of French-English FOLS immigrants and non-francophone immigrants born in Africa is only a little higher than that of immigrants from Asia and the Pacific region, while in the French FOLS immigrant population, Africans’ participation rate is slightly lower than that of persons from the other three continents.
The region of residence has no statistically significant effects on the participation rate for francophone immigrants (French FOLS and French-English FOLS). For non-francophone immigrants, the predicted rates are above 80% in the Prairie provinces, Alberta and the territories, and below 80% in the other three regions.
Differences in participation rates in the population are generally greater for females than for males (Table 8.3). For example, the difference between those who speak English and those who do not is more than 10 percentage points for males (84.5% versus 73%), but nearly 18 percentage points for females (72.3% versus 54.6%). The same applies to university graduates. For males, the participation rate of university graduates is no different from that of non-graduates (83.7%), while for females, the rates are 73.1% and 70.8% respectively, representing an absolute difference of more than 2 percentage points. The pattern is the same for all three immigrant groups: the participation rate is fairly similar for males, with values ranging between 83% and 85%, while for females, the gap between the two extreme values is 6 percentage points.
We observe that the period when permanent residence was granted, the continent of birth and the region of residence significantly affect participation rates for both males and females. Recent immigrants, immigrants born in Africa or the Asia-Pacific region and those living in the Atlantic region, Ontario and British Columbia have the lowest participation rates. In addition, a knowledge of French is associated with higher participation for females (73.1% for those who reported speaking French, compared with 70.8% for the others), while this characteristic has no effect on the participation rate of males.
8.5 Unemployment rates
As with participation rates, the unemployment rates by age predicted by the regression models confirm the results calculated on the basis of descriptive statistics: for the three immigrant groups, the unemployment rate for youths aged 15 to 24 is considerably higher than for the other age groups (Table 8.4). In the 15-19 age group in particular, it was over 20% for the three groups, with a rate of more than 25% for French-English FOLS immigrants. Gender has no significant effect except for non-francophone immigrants, whose rates are 9.1% for males and 11.1% for females. A lack of knowledge of English is associated with a higher unemployment rate. To illustrate, the unemployment rate of French FOLS immigrants and non-francophone immigrants who reported not knowing English is four percentage points higher than for those who reported knowing it. There is no significant difference in unemployment rates based on a knowledge of French for non-francophone immigrants.
In all three immigrant groups, immigrants who received their permanent residence status between 2006 and 2011 have unemployment rates above 12%. The unemployment rate of French FOLS immigrants who came to Canada between 2001 and 2006 is over 9%.
Having a university degree has no significant effect on unemployment except for non-francophone immigrants. It slightly reduces the probability of being unemployed, but the difference with those who do not have such a degree is small, at less than two percentage points (7.3% compared with 8.9%).
The continent of birth plays has a considerable influence on immigrants’ unemployment rate. Africans and Asians are most affected by unemployment, while Europeans are least affected. Immigrants from the Americas have a lower unemployment rate than those from Africa, but higher than that of immigrants from the other two continents. The exception is French-English FOLS immigrants, as immigrants from Europe have an unemployment rate of 7.4%, compared with 10.5% for the rest.
An analysis of unemployment rates by region of residence clearly shows that residents of Alberta (and the Prairies, in the case of non-francophone immigrants) are less affected by unemployment than residents of other regions. Employment is higher for females than for males in all sociodemographic subgroups, including the immigrant groups (Table 8.5), with only one exception. The unemployment rate of young people aged 15-24 is higher for males (15% for 15- to 19-year-olds and 11% for the 20-24 age group) than for females (13% for the 15-19 age group and 10% for 20- to 24-year-olds). Between immigrant groups, French-English FOLS immigrants have a higher unemployment rate than non-francophone immigrants, for both males and females, but there is no significant difference between French FOLS immigrants and non-francophone immigrants. Table 8.5 shows that a knowledge of English is associated with lower unemployment rates for both males and females, but a knowledge of French has no effect on the unemployment rate. Recent immigrants—who arrived between 2006 and 2011—have a higher predicted unemployment rate, and in general, the unemployment rate tends to decline the longer the immigrant resides in Canada. Having a university diploma reduces the likelihood of unemployment, while being born in Africa increases it. Immigrants who live in Alberta, the Prairies or the territories have predicted rates below 7%, while in the other regions, the unemployment rate can go above 10%, as with females living in the Atlantic region or Ontario. Finally, the two models presented in Table 8.5 show that there is no significant difference between French FOLS immigrants and non-francophone immigrants. By contrast, French-English FOLS immigrants have significantly higher predicted rates than the other two groups.
In summary, an analysis of participation and unemployment rates by and large reveals that there are few differences between immigrant groups. Socioeconomic characteristics determine the extent to which immigrants integrate into the Canadian labour market. The period of arrival in Canada is critical in this regard, as is the continent of birth; African nationals seem to be at a particular disadvantage. A knowledge of English and the region of residence also seem to have a major effect on immigrants’ economic integration, but as mentioned at the beginning of this section, there is uncertainty as to the direction of the causal relationship between these two characteristics and the participation and unemployment rates.
This multivariate analysis has limitations. One is related to the cyclical nature of these two indicators—especially the unemployment rate—which are sensitive to economic cycles. Secondly, the models presented have a limited number of variables and do not consider unobserved heterogeneity, such as the one resulting from the fact that the models do not include the immigrant category, age on arrival, marital status, etc. Furthermore, it does not take into account the effect of the local situation itself (presence of other francophones or immigrants of the same origin) on the indicators. Finally, it is reasonable to consider whether it might be more appropriate to use income as a variable for measuring the economic integration of francophone immigrants, as in other studies.
Obviously, the results of the regression analyses are only a starting point; much remains to be done to gain a better understanding of the factors associated with the economic success of these francophone immigrants who have chosen to settle outside Quebec.
Table 8.2: Odds-ratio and participation rate predicted by a logistic regression model on the participation rate of the immigrant population according to the first official language spoken (FOLS) for selected characteristics, Canada less Quebec, 2011 (Number of observations: French = 10,964; French and English = 11,889; Other = 832,436)
| Sex | Odds-ratio | Level of significance | Predicted participation rate % |
|---|---|---|---|
| Female (ref.) | 2.007 | 0.000 | 63% |
| Male | ... | ... | 76% |
| Age | Odds-ratio | Level of significance | Predicted participation rate % |
|---|---|---|---|
| 15 to 19 | 0.107 | 0.000 | 38% |
| 20 to 24 | ... | ... | 70% |
| 25 to 29 | 0.445 | 0.000 | 83% |
| 30 to 34 (ref.) | 0.949 | 0.732 | 84% |
| 35 to 39 | 1.127 | 0.389 | 85% |
| 40 to 44 | 1.554 | 0.002 | 89% |
| 45 to 49 | 1.287 | 0.087 | 87% |
| 50 to 54 | 1.319 | 0.083 | 87% |
| 55 to 59 | 0.673 | 0.015 | 78% |
| 60 to 64 | 0.332 | 0.000 | 64% |
| Knowledge of English | Odds-ratio | Level of significance | Predicted participation rate % |
|---|---|---|---|
| No (ref.) | ... | ... | 71% |
| Yes | 1.860 | 0.000 | 81% |
| Knowledge of French | Odds-ratio | Level of significance | Predicted participation rate % |
|---|---|---|---|
| No (ref.) | ... | ... | ... |
| Yes | ... | ... | ... |
| Period at which permanent residence was obtained | Odds-ratio | Level of significance | Predicted participation rate % |
|---|---|---|---|
| 1980 or before (ref.) | ... | ... | 78% |
| 1981 to 1990 | 1.510 | 0.004 | 84% |
| 1991 to 1995 | 1.372 | 0.019 | 82% |
| 1996 to 2000 | 1.265 | 0.114 | 81% |
| 2001 to 2005 | 1.306 | 0.074 | 82% |
| 2006 to 2011 | 0.855 | 0.266 | 76% |
| University diploma | Odds-ratio | Level of significance | Predicted participation rate % |
|---|---|---|---|
| No (ref.) | ... | ... | 78% |
| Yes | 1.744 | 0.000 | 86% |
| Continent of birth | Odds-ratio | Level of significance | Predicted participation rate % |
|---|---|---|---|
| America | 1.017 | 0.892 | 81% |
| Europe (ref.) | ... | ... | 81% |
| Africa | 0.673 | 0.000 | 75% |
| Asia and Pacific | 0.874 | 0.253 | 79% |
| Region of residence | Odds-ratio | Level of significance | Predicted participation rate % |
|---|---|---|---|
| Atlantic | 1.206 | 0.291 | 83% |
| Ontario (ref.) | ... | ... | 80% |
| Prairies | 1.152 | 0.412 | 82% |
| Alberta | 1.131 | 0.238 | 82% |
| British Columbia | 0.856 | 0.180 | 78% |
| Territories | 1.267 | 0.517 | 83% |
| Sex | Odds-ratio | Level of significance | Predicted participation rate % |
|---|---|---|---|
| Female (ref.) | 1.932 | 0.000 | 59% |
| Male | ... | ... | 72% |
| Age | Odds-ratio | Level of significance | Predicted participation rate % |
|---|---|---|---|
| 15 to 19 | 0.135 | 0.000 | 37% |
| 20 to 24 | ... | ... | 69% |
| 25 to 29 | 0.555 | 0.000 | 76% |
| 30 to 34 (ref.) | 0.789 | 0.087 | 80% |
| 35 to 39 | 1.284 | 0.069 | 83% |
| 40 to 44 | 1.439 | 0.011 | 85% |
| 45 to 49 | 1.470 | 0.009 | 85% |
| 50 to 54 | 1.167 | 0.323 | 82% |
| 55 to 59 | 0.862 | 0.356 | 77% |
| 60 to 64 | 0.329 | 0.000 | 58% |
| Knowledge of English | Odds-ratio | Level of significance | Predicted participation rate % |
|---|---|---|---|
| No (ref.) | ... | ... | ... |
| Yes | ... | ... | ... |
| Knowledge of French | Odds-ratio | Level of significance | Predicted participation rate % |
|---|---|---|---|
| No (ref.) | ... | ... | ... |
| Yes | ... | ... | ... |
| Period at which permanent residence was obtained | Odds-ratio | Level of significance | Predicted participation rate % |
|---|---|---|---|
| 1980 or before (ref.) | ... | ... | 77% |
| 1981 to 1990 | 1.166 | 0.421 | 79% |
| 1991 to 1995 | 1.347 | 0.084 | 81% |
| 1996 to 2000 | 1.008 | 0.966 | 77% |
| 2001 to 2005 | 0.906 | 0.586 | 75% |
| 2006 to 2011 | 0.682 | 0.038 | 70% |
| University diploma | Odds-ratio | Level of significance | Predicted participation rate % |
|---|---|---|---|
| No (ref.) | ... | ... | 75% |
| Yes | 1.550 | 0.000 | 81% |
| Continent of birth | Odds-ratio | Level of significance | Predicted participation rate % |
|---|---|---|---|
| America | 0.961 | 0.700 | 81% |
| Europe (ref.) | ... | ... | 82% |
| Africa | 0.580 | 0.000 | 73% |
| Asia and Pacific | 0.551 | 0.000 | 72% |
| Region of residence | Odds-ratio | Level of significance | Predicted participation rate % |
|---|---|---|---|
| Atlantic | 1.097 | 0.743 | 78% |
| Ontario (ref.) | ... | ... | 76% |
| Prairies | 1.317 | 0.194 | 80% |
| Alberta | 1.152 | 0.182 | 79% |
| British Columbia | 0.977 | 0.786 | 76% |
| Territories | 1.123 | 0.907 | 78% |
First official language spoken: Other - Number of observations: 832,436
| Sex | Odds-ratio | Level of significance | Predicted participation rate % |
|---|---|---|---|
| Female (ref.) | 2.196 | 0.000 | 55% |
| Male | ... | ... | 71% |
| Age | Odds-ratio | Level of significance | Predicted participation rate % |
|---|---|---|---|
| 15 to 19 | 0.109 | 0.000 | 36% |
| 20 to 24 | ... | ... | 69% |
| 25 to 29 | 0.472 | 0.000 | 80% |
| 30 to 34 (ref.) | 0.899 | 0.000 | 82% |
| 35 to 39 | 1.096 | 0.000 | 83% |
| 40 to 44 | 1.203 | 0.000 | 84% |
| 45 to 49 | 1.177 | 0.000 | 84% |
| 50 to 54 | 0.984 | 0.337 | 82% |
| 55 to 59 | 0.604 | 0.000 | 74% |
| 60 to 64 | 0.246 | 0.000 | 55% |
| Knowledge of English | Odds-ratio | Level of significance | Predicted participation rate % |
|---|---|---|---|
| No (ref.) | ... | ... | 63% |
| Yes | 2.323 | 0.000 | 78% |
| Knowledge of French | Odds-ratio | Level of significance | Predicted participation rate % |
|---|---|---|---|
| No (ref.) | ... | ... | 77% |
| Yes | 1.116 | 0.000 | 78% |
| Period at which permanent residence was obtained | Odds-ratio | Level of significance | Predicted participation rate % |
|---|---|---|---|
| 1980 or before (ref.) | ... | ... | 76% |
| 1981 to 1990 | 1.311 | 0.000 | 80% |
| 1991 to 1995 | 1.272 | 0.000 | 80% |
| 1996 to 2000 | 1.036 | 0.017 | 77% |
| 2001 to 2005 | 0.930 | 0.000 | 75% |
| 2006 to 2011 | 0.708 | 0.000 | 71% |
| University diploma | Odds-ratio | Level of significance | Predicted participation rate % |
|---|---|---|---|
| No (ref.) | ... | ... | 75% |
| Yes | 1.569 | 0.000 | 82% |
| Continent of birth | Odds-ratio | Level of significance | Predicted participation rate % |
|---|---|---|---|
| America | 0.989 | 0.410 | 79% |
| Europe (ref.) | ... | ... | 79% |
| Africa | 0.807 | 0.000 | 76% |
| Asia and Pacific | 0.755 | 0.000 | 75% |
| Region of residence | Odds-ratio | Level of significance | Predicted participation rate % |
|---|---|---|---|
| Atlantic | 0.991 | 0.780 | 76% |
| Ontario (ref.) | ... | ... | 76% |
| Prairies | 1.487 | 0.000 | 82% |
| Alberta | 1.379 | 0.000 | 81% |
| British Columbia | 1.025 | 0.005 | 76% |
| Territories | 2.739 | 0.000 | 88% |
The Atlantic region comprises the provinces of Newfoundland and Labrador, Nova Scotia, Prince Edward Island and New Brunswick. The Prairies region comprises the provinces of Manitoba and Saskatchewan.
The category FOLS other includes FOLS groups "English" and "neither English nor French".
The odds ratio (or risk ratio) measures the relative variation of the effect of the category on the independent variable in relation to the reference category (indicated by “ref”). This is a ratio whose value varies between 0 and infinity.
The level of significance indicates the probability that the effect of a given category on the independent variable is the same as the reference category. It varies between 0 and 1.
Sources: Statistics Canada, 2011 National Household Survey
Table 8.3: Odds-ratio and participation rate predicted by a logistic regression model on the activity rate of the immigrant population of first official language spoken (FOLS) for selected characteristics by sex, Canada less Quebec, 2011 (Number of observations: Men = 405,622, Women = 449,667)
| Age | Odds-ratio (Men) | Level of significance (Men) | Predicted participatioin rate % (Men) | Odds-ratio (Women) | Level of significance (Women) | Predicted participatioin rate % (Women) |
|---|---|---|---|---|---|---|
| 15 to 19 | 0.048 | 0.000 | 33% | 0.214 | 0.000 | 40% |
| 20 to 24 | 0.228 | 0.000 | 69% | 0.744 | 0.000 | 69% |
| 25 to 29 | 0.638 | 0.000 | 86% | 1.024 | 0.273 | 75% |
| 30 to 34 (ref.) | ... | ... | 90% | ... | ... | 75% |
| 35 to 39 | 1.222 | 0.000 | 92% | 1.056 | 0.006 | 76% |
| 40 to 44 | 1.048 | 0.155 | 91% | 1.261 | 0.000 | 79% |
| 45 to 49 | 0.910 | 0.003 | 90% | 1.290 | 0.000 | 79% |
| 50 to 54 | 0.772 | 0.000 | 88% | 1.069 | 0.001 | 76% |
| 55 to 59 | 0.465 | 0.000 | 82% | 0.662 | 0.000 | 67% |
| 60 to 64 | 0.194 | 0.000 | 66% | 0.269 | 0.000 | 46% |
| Knowledge of English | Odds-ratio (Men) | Level of significance (Men) | Predicted participatioin rate % (Men) | Odds-ratio (Women) | Level of significance (Women) | Predicted participatioin rate % (Women) |
|---|---|---|---|---|---|---|
| No (ref.) | ... | ... | 73% | ... | ... | 55% |
| Yes | 2.287 | 0.000 | 85% | 2.329 | 0.000 | 72% |
| Knowledge of French | Odds-ratio (Men) | Level of significance (Men) | Predicted participatioin rate % (Men) | Odds-ratio (Women) | Level of significance (Women) | Predicted participatioin rate % (Women) |
|---|---|---|---|---|---|---|
| No (ref.) | ... | ... | 84% | ... | ... | 71% |
| Yes | 0.997 | 0.924 | 84% | 1.138 | 0.000 | 73% |
| Period at which permanent residence was obtained | Odds-ratio (Men) | Level of significance (Men) | Predicted participatioin rate % (Men) | Odds-ratio (Women) | Level of significance (Women) | Predicted participatioin rate % (Women) |
|---|---|---|---|---|---|---|
| 1980 or before (ref.) | ... | ... | 82% | ... | ... | 72% |
| 1981 to 1990 | 1.391 | 0.000 | 86% | 1.251 | 0.000 | 76% |
| 1991 to 1995 | 1.446 | 0.000 | 86% | 1.177 | 0.000 | 75% |
| 1996 to 2000 | 1.300 | 0.000 | 85% | 0.917 | 0.000 | 70% |
| 2001 to 2005 | 1.250 | 0.000 | 84% | 0.793 | 0.000 | 68% |
| 2006 to 2011 | 0.915 | 0.000 | 81% | 0.603 | 0.000 | 62% |
| University diploma | Odds-ratio (Men) | Level of significance (Men) | Predicted participatioin rate % (Men) | Odds-ratio (Women) | Level of significance (Women) | Predicted participatioin rate % (Women) |
|---|---|---|---|---|---|---|
| No (ref.) | ... | ... | 83% | ... | ... | 68% |
| Yes | 1.417 | 0.000 | 87% | 1.654 | 0.000 | 77% |
| Continent of birth | Odds-ratio (Men) | Level of significance (Men) | Predicted participatioin rate % (Men) | Odds-ratio (Women) | Level of significance (Women) | Predicted participatioin rate % (Women) |
|---|---|---|---|---|---|---|
| America | 1.002 | 0.943 | 85% | 0.980 | 0.206 | 73% |
| Europe (ref.) | ... | ... | 85% | ... | ... | 74% |
| Africa | 0.797 | 0.000 | 83% | 0.788 | 0.000 | 69% |
| Asia and Pacific | 0.747 | 0.000 | 82% | 0.757 | 0.000 | 69% |
| Region of residence | Odds-ratio (Men) | Level of significance (Men) | Predicted participatioin rate % (Men) | Odds-ratio (Women) | Level of significance (Women) | Predicted participatioin rate % (Women) |
|---|---|---|---|---|---|---|
| Atlantic | 0.922 | 0.118 | 82% | 1.066 | 0.113 | 71% |
| Ontario (ref.) | ... | ... | 83% | ... | ... | 70% |
| Prairies | 1.542 | 0.000 | 88% | 1.431 | 0.000 | 76% |
| Alberta | 1.587 | 0.000 | 88% | 1.265 | 0.000 | 74% |
| British Columbia | 0.980 | 0.155 | 83% | 1.048 | 0.000 | 71% |
| Territories | 2.379 | 0.000 | 91% | 2.848 | 0.000 | 86% |
| Immigrant group | Odds-ratio (Men) | Level of significance (Men) | Predicted participatioin rate % (Men) | Odds-ratio (Women) | Level of significance (Women) | Predicted participatioin rate % (Women) |
|---|---|---|---|---|---|---|
| French FOLS | 1.131 | 0.058 | 85% | 1.123 | 0.014 | 73% |
| French-English FOLS | 0.909 | 0.108 | 83% | 0.818 | 0.000 | 67% |
| FOLS other (ref.) | ... | ... | 84% | ... | ... | 71% |
The Atlantic region comprises the provinces of Newfoundland and Labrador, Nova Scotia, Prince Edward Island and New Brunswick. The Prairies region comprises the provinces of Manitoba and Saskatchewan.
The category FOLS other includes FOLS groups "English" and "neither English nor French".
The odds ratio (or risk ratio) measures the relative variation of the effect of the category on the independent variable in relation to the reference category (indicated by “ref”). This is a ratio whose value varies between 0 and infinity.
The level of significance indicates the probability that the effect of a given category on the independent variable is the same as the reference category. It varies between 0 and 1.
Sources: Statistics Canada, 2011 National Household Survey
Table 8.4: Odds-ratio and unemployment rate predicted by a logistic regression model on the unemployment rate of the immigrant population according to the first official language spoken (FOLS) for selected characteristics, Canada less Quebec, 2011 (Number of observations: French = 8,654; French and English = 8,776; Other = 633,036)
| Sex | Odds-ratio | Level of significance | Predicted unemployment rate % |
|---|---|---|---|
| Female (ref.) | ... | ... | 10% |
| Male | 0.875 | 0.175 | 9% |
| Age | Odds-ratio | Level of significance | Predicted unemployment rate % |
|---|---|---|---|
| 15 to 19 | 3.422 | 0.000 | 23% |
| 20 to 24 | 1.724 | 0.010 | 13% |
| 25 to 29 | 1.064 | 0.777 | 9% |
| 30 to 34 (ref.) | ... | ... | 8% |
| 35 to 39 | 0.956 | 0.814 | 8% |
| 40 to 44 | 0.966 | 0.857 | 8% |
| 45 to 49 | 0.767 | 0.192 | 6% |
| 50 to 54 | 0.926 | 0.721 | 8% |
| 55 to 59 | 0.666 | 0.087 | 6% |
| 60 to 64 | 0.764 | 0.338 | 6% |
| Knowledge of English | Odds-ratio | Level of significance | Predicted unemployment rate % |
|---|---|---|---|
| No (ref.) | ... | ... | 12% |
| Yes | 0.651 | 0.001 | 8% |
| Knowledge of French | Odds-ratio | Level of significance | Predicted unemployment rate % |
|---|---|---|---|
| No (ref.) | ... | ... | ... |
| Yes | ... | ... | ... |
| Period at which permanent residence was obtained | Odds-ratio | Level of significance | Predicted unemployment rate % |
|---|---|---|---|
| 1980 or before (ref.) | ... | ... | 8% |
| 1981 to 1990 | 0.570 | 0.012 | 5% |
| 1991 to 1995 | 0.799 | 0.318 | 6% |
| 1996 to 2000 | 1.090 | 0.700 | 8% |
| 2001 to 2005 | 1.250 | 0.284 | 10% |
| 2006 to 2011 | 1.924 | 0.001 | 14% |
| University diploma | Odds-ratio | Level of significance | Predicted unemployment rate % |
|---|---|---|---|
| No (ref.) | ... | ... | 9% |
| Yes | 0.824 | 0.059 | 8% |
| Continent of birth | Odds-ratio | Level of significance | Predicted unemployment rate % |
|---|---|---|---|
| America | 1.599 | 0.004 | 10% |
| Europe (ref.) | ... | ... | 7% |
| Africa | 1.856 | 0.000 | 12% |
| Asia and Pacific | 1.266 | 0.241 | 9% |
| Region of residence | Odds-ratio | Level of significance | Predicted unemployment rate % |
|---|---|---|---|
| Atlantic | 0.660 | 0.072 | 6% |
| Ontario (ref.) | ... | ... | 9% |
| Prairies | 0.932 | 0.780 | 8% |
| Alberta | 0.705 | 0.036 | 6% |
| British Columbia | 1.028 | 0.851 | 9% |
| Territories | 1.415 | 0.460 | 12% |
| Sex | Odds-ratio | Level of significance | Predicted unemployment rate % |
|---|---|---|---|
| Female (ref.) | ... | ... | 11% |
| Male | 0.946 | 0.554 | 10% |
| Age | Odds-ratio | Level of significance | Predicted unemployment rate % |
|---|---|---|---|
| 15 to 19 | 3.961 | 0.000 | 27% |
| 20 to 24 | 2.889 | 0.000 | 21% |
| 25 to 29 | 1.285 | 0.187 | 11% |
| 30 to 34 (ref.) | ... | ... | 9% |
| 35 to 39 | 1.150 | 0.441 | 10% |
| 40 to 44 | 0.775 | 0.196 | 7% |
| 45 to 49 | 1.056 | 0.796 | 9% |
| 50 to 54 | 0.918 | 0.690 | 8% |
| 55 to 59 | 1.077 | 0.776 | 9% |
| 60 to 64 | 0.716 | 0.293 | 6% |
| Knowledge of English | Odds-ratio | Level of significance | Predicted unemployment rate % |
|---|---|---|---|
| No (ref.) | ... | ... | ... |
| Yes | ... | ... | ... |
| Knowledge of French | Odds-ratio | Level of significance | Predicted unemployment rate % |
|---|---|---|---|
| No (ref.) | ... | ... | ... |
| Yes | ... | ... | ... |
| Period at which permanent residence was obtained | Odds-ratio | Level of significance | Predicted participation rate % |
|---|---|---|---|
| 1980 or before (ref.) | ... | ... | 10% |
| 1981 to 1990 | 0.471 | 0.034 | 5% |
| 1991 to 1995 | 0.770 | 0.405 | 8% |
| 1996 to 2000 | 0.885 | 0.712 | 9% |
| 2001 to 2005 | 1.110 | 0.746 | 11% |
| 2006 to 2011 | 1.861 | 0.057 | 17% |
| University diploma | Odds-ratio | Level of significance | Predicted participation rate % |
|---|---|---|---|
| No (ref.) | ... | ... | 11% |
| Yes | 0.855 | 0.131 | 9% |
| Continent of birth | Odds-ratio | Level of significance | Predicted participation rate % |
|---|---|---|---|
| America | 1.530 | 0.002 | 11% |
| Europe (ref.) | ... | ... | 7% |
| Africa | 1.591 | 0.001 | 11% |
| Asia and Pacific | 1.703 | 0.000 | 12% |
| Region of residence | Odds-ratio | Level of significance | Predicted participation rate % |
|---|---|---|---|
| Atlantic | 1.452 | 0.145 | 15% |
| Ontario (ref.) | ... | ... | 11% |
| Prairies | 0.588 | 0.104 | 7% |
| Alberta | 0.436 | 0.000 | 6% |
| British Columbia | 0.852 | 0.245 | 10% |
| Territories | 0.155 | 0.087 | 2% |
| Sex | Odds-ratio | Level of significance | Predicted participation rate % |
|---|---|---|---|
| Female (ref.) | ... | ... | 11% |
| Male | 0.798 | 0.000 | 9% |
| Age | Odds-ratio | Level of significance | Predicted participation rate % |
|---|---|---|---|
| 15 to 19 | 3.382 | 0.000 | 21% |
| 20 to 24 | 2.191 | 0.000 | 15% |
| 25 to 29 | 1.203 | 0.000 | 9% |
| 30 to 34 (ref.) | ... | ... | 8% |
| 35 to 39 | 0.903 | 0.000 | 7% |
| 40 to 44 | 0.862 | 0.000 | 7% |
| 45 to 49 | 0.841 | 0.000 | 6% |
| 50 to 54 | 0.841 | 0.000 | 6% |
| 55 to 59 | 0.966 | 0.237 | 7% |
| 60 to 64 | 1.121 | 0.000 | 8% |
| Knowledge of English | Odds-ratio | Level of significance | Predicted participation rate % |
|---|---|---|---|
| No (ref.) | ... | ... | 12% |
| Yes | 0.611 | 0.000 | 8% |
| Knowledge of French | Odds-ratio | Level of significance | Predicted participation rate % |
|---|---|---|---|
| No (ref.) | ... | ... | 8% |
| Yes | 0.962 | 0.221 | 8% |
| Period at which permanent residence was obtained | Odds-ratio | Level of significance | Predicted participation rate % |
|---|---|---|---|
| 1980 or before (ref.) | ... | ... | 7% |
| 1981 to 1990 | 1.042 | 0.161 | 7% |
| 1991 to 1995 | 1.180 | 0.000 | 8% |
| 1996 to 2000 | 1.300 | 0.000 | 8% |
| 2001 to 2005 | 1.498 | 0.000 | 10% |
| 2006 to 2011 | 1.958 | 0.000 | 12% |
| University diploma | Odds-ratio | Level of significance | Predicted participation rate % |
|---|---|---|---|
| No (ref.) | ... | ... | 9% |
| Yes | 0.809 | 0.000 | 7% |
| Continent of birth | Odds-ratio | Level of significance | Predicted participation rate % |
|---|---|---|---|
| America | 1.241 | 0.000 | 9% |
| Europe (ref.) | ... | ... | 7% |
| Africa | 1.676 | 0.000 | 11% |
| Asia and Pacific | 1.279 | 0.000 | 9% |
| Region of residence | Odds-ratio | Level of significance | Predicted participation rate % |
|---|---|---|---|
| Atlantic | 1.079 | 0.173 | 10% |
| Ontario (ref.) | ... | ... | 9% |
| Prairies | 0.541 | 0.000 | 5% |
| Alberta | 0.601 | 0.000 | 6% |
| British Columbia | 0.812 | 0.000 | 8% |
| Territories | 0.334 | 0.000 | 3% |
The Atlantic region comprises the provinces of Newfoundland and Labrador, Nova Scotia, Prince Edward Island and New Brunswick. The Prairies region comprises the provinces of Manitoba and Saskatchewan.
The category other includes froups "English" and "neither English nor French".
The odds ratio (or risk ratio) measures the relative variation of the effect of the category on the independent variable in relation to the reference category (indicated by “ref”). This is a ratio whose value varies between 0 and infinity.
The level of significance indicates the probability that the effect of a given category on the independent variable is the same as the reference category. It varies between 0 and 1.
Sources: Statistics Canada, 2011 National Household Survey
Table 8.5: Odds-ratio and unemployment rate predicted by a logistic regression model on the unemployment rate of the immigrant population of first official language spoken (FOLS) for selected characteristics by sex, Canada less Quebec, 2011 (Number of observations: Men = 333,585; Women = 316,881)
| Age | Odds-ratio (Men) | Level of significance (Men) | Predicted unemployment rate % (Men) | Odds-ratio (Women) | Level of significance (Women) | Predicted unemployment rate % (Women) |
|---|---|---|---|---|---|---|
| 15 to 19 | 4.835 | 0.000 | 23% | 2.544 | 0.000 | 20% |
| 20 to 24 | 3.033 | 0.000 | 16% | 1.689 | 0.000 | 14% |
| 25 to 29 | 1.452 | 0.000 | 8% | 1.049 | 0.174 | 9% |
| 30 to 34 (ref.) | ... | ... | 6% | ... | ... | 9% |
| 35 to 39 | 0.920 | 0.044 | 5% | 0.911 | 0.005 | 8% |
| 40 to 44 | 0.928 | 0.068 | 6% | 0.833 | 0.000 | 8% |
| 45 to 49 | 0.998 | 0.957 | 6% | 0.758 | 0.000 | 7% |
| 50 to 54 | 1.004 | 0.923 | 6% | 0.757 | 0.000 | 7% |
| 55 to 59 | 1.179 | 0.000 | 7% | 0.839 | 0.000 | 8% |
| 60 to 64 | 1.431 | 0.000 | 8% | 0.879 | 0.006 | 8% |
| Knowledge of English | Odds-ratio (Men) | Level of significance (Men) | Predicted unemployment rate % (Men) | Odds-ratio (Women) | Level of significance (Women) | Predicted unemployment rate % (Women) |
|---|---|---|---|---|---|---|
| No (ref.) | ... | ... | 10% | ... | ... | 14% |
| Yes | 0.670 | 0.000 | 7% | 0.571 | 0.000 | 9% |
| Knowledge of French | Odds-ratio (Men) | Level of significance (Men) | Predicted unemployment rate % (Men) | Odds-ratio (Women) | Level of significance (Women) | Predicted unemployment rate % (Women) |
|---|---|---|---|---|---|---|
| No (ref.) | ... | ... | 8% | ... | ... | 9% |
| Yes | 0.978 | 0.636 | 7% | 0.976 | 0.563 | 9% |
| Period at which permanent residence was obtained | Odds-ratio (Men) | Level of significance (Men) | Predicted unemployment rate % (Men) | Odds-ratio (Women) | Level of significance (Women) | Predicted unemployment rate % (Women) |
|---|---|---|---|---|---|---|
| 1980 or before (ref.) | ... | ... | 7% | ... | ... | 6% |
| 1981 to 1990 | 0.944 | 0.161 | 6% | 1.137 | 0.002 | 7% |
| 1991 to 1995 | 1.077 | 0.037 | 7% | 1.285 | 0.000 | 8% |
| 1996 to 2000 | 1.098 | 0.017 | 7% | 1.516 | 0.000 | 9% |
| 2001 to 2005 | 1.210 | 0.000 | 8% | 1.816 | 0.000 | 11% |
| 2006 to 2011 | 1.574 | 0.000 | 10% | 2.450 | 0.000 | 14% |
| University diploma | Odds-ratio (Men) | Level of significance (Men) | Predicted unemployment rate % (Men) | Odds-ratio (Women) | Level of significance (Women) | Predicted unemployment rate % (Women) |
|---|---|---|---|---|---|---|
| No (ref.) | ... | ... | 8% | ... | ... | 10% |
| Yes | 0.799 | 0.000 | 7% | 0.819 | 0.000 | 8% |
| Continent of birth | Odds-ratio (Men) | Level of significance (Men) | Predicted unemployment rate % (Men) | Odds-ratio (Women) | Level of significance (Women) | Predicted unemployment rate % (Women) |
|---|---|---|---|---|---|---|
| America | 1.254 | 0.000 | 8% | 1.272 | 0.000 | 9% |
| Europe (ref.) | ... | ... | 7% | ... | ... | 7% |
| Africa | 1.613 | 0.000 | 10% | 1.763 | 0.000 | 12% |
| Asia and Pacific | 1.219 | 0.000 | 8% | 1.352 | 0.000 | 10% |
| Region of residence | Odds-ratio (Men) | Level of significance (Men) | Predicted unemployment rate % (Men) | Odds-ratio (Women) | Level of significance (Women) | Predicted unemployment rate % (Women) |
|---|---|---|---|---|---|---|
| Atlantic | 1.083 | 0.317 | 9% | 1.044 | 0.541 | 11% |
| Ontario (ref.) | ... | ... | 8% | ... | ... | 10% |
| Prairies | 0.518 | 0.000 | 5% | 0.573 | 0.000 | 6% |
| Alberta | 0.593 | 0.000 | 5% | 0.604 | 0.000 | 7% |
| British Columbia | 0.847 | 0.000 | 7% | 0.786 | 0.000 | 8% |
| Territories | 0.368 | 0.000 | 3% | 0.358 | 0.000 | 4% |
| Immigrant group | Odds-ratio (Men) | Level of significance (Men) | Predicted unemployment rate % (Men) | Odds-ratio (Women) | Level of significance (Women) | Predicted unemployment rate % (Women) |
|---|---|---|---|---|---|---|
| French FOLS | 1.158 | 0.091 | 9% | 0.988 | 0.870 | 9% |
| French-English FOLS | 1.429 | 0.000 | 10% | 1.211 | 0.010 | 11% |
| FOLS other (ref.) | ... | ... | 8% | ... | ... | 9% |
The Atlantic region comprises the provinces of Newfoundland and Labrador, Nova Scotia, Prince Edward Island and New Brunswick
The Prairies region comprises the provinces of Manitoba and Saskatchewan.
The category FOLS other includes FOLS groups "English" and "neither English nor French".
The odds ratio (or risk ratio) measures the relative variation of the effect of the category on the independent variable in relation to the reference category (indicated by “ref”). This is a ratio whose value varies between 0 and infinity.
The level of significance indicates the probability that the effect of a given category on the independent variable is the same as the reference category. It varies between 0 and 1.
Sources: Statistics Canada, 2011 National Household Survey
9 Conclusion
This study, entitled “Statistical Portrait of the French-speaking Immigrant Population Outside Quebec (1991 to 2011)” was conducted under the Government of Canada’s Roadmap for Official Languages 2013-2018.
On March 28, 2013, the Minister of Canadian Heritage and Official Languages announced the Roadmap for Canada's Official Languages 2013-2018: Education, Immigration, Communities, a five-year plan that brings together 14 federal agencies and departments with the objective of advancing official languages and the vitality of official-language minority communities (OLMCs). Citizenship and Immigration Canada (CIC) receives $149.4 million from this Roadmap, including $29.4 million for the Immigration to OLMCs initiative.
The CIC-FMC (Francophone Minority Community) Committee was created as part of a new and simplified joint governance structure to promote francophone immigration to FMCs under the Immigration to OLMCs initiative. The CIC-FMC Committee builds on the work accomplished by the former CIC-FMC Steering Committee. Under the leadership of the CIC-FMC Committee, the objectives of the initiative are to promote the recruitment and integration of immigrants into FMCs, to increase the proportion of francophone economic immigrants in FMCs from 1.1% (2011) to 4% in 2018, and to improve the settlement and integration of francophone immigrants.
The initiative has four main components: coordinate activities and consult with key stakeholders; conduct promotional and recruitment activities in Canada and abroad; provide settlement services to French-speaking clients (immigrants); and conduct strategic data development as well as research, and develop knowledge-sharing projects for immigration to official-language minority communities. Research activities aim to shed light on the challenges associated with the vitality of both official-language minority communities.
This report is an update of the one released by Statistics Canada in 2010, and like that earlier report, provides information on the demographic, linguistic, social and economic characteristics of French-language immigrants to francophone minority communities. The analyses provided are based on Canadian census data since 1991 as well as data from the 2011 National Household Survey (NHS). In this endeavour, it is important to try to answer the question on the characteristics of French-speaking immigrants, in particular the criteria for defining this population. From the outset, the definition adopted should be a fairly broad definition of the French-speaking immigrant population, that is, the population whose first official language spoken (FOLS) is French, either alone or together with English.
The question of the criterion for defining French-speaking immigrants is important, since the sociodemographic characteristics and linguistic practices of these immigrants vary greatly depending on the definition adopted.
This study shows that the criteria for defining the French-speaking immigrant population directly affect the challenges surrounding their integration and their contribution to the vitality of French-language minority communities.
This study distinguished between immigrants for whom French is the only official language spoken and those who cannot be assigned either French or English as their first official language. It also redistributed the French-English category, similar to the Treasury Board Secretariat in applying the Official Languages (Communications with and Services to the Public) Regulations. Regardless of the variants used in the different parts of this study, it is difficult not to conclude, following a comparison of these two immigrant sub-populations, that those with French and English as their first official language spoken (FOLS) have different characteristics and behaviours than immigrants with French as their only first official language. In fact, French-English FOLS immigrants share many more behaviours and characteristics with non-francophone immigrants than with French FOLS immigrants.
Therefore, it would not be incorrect to say that including immigrants with a double first official language spoken (FOLS) in the francophone immigrant population is an issue and poses quite different challenges from those related to the integration of immigrants for whom French is the only first official language spoken.
Some of the findings presented in this study are quite eloquent in this regard. For example, we know that a large majority of French-English FOLS immigrants reported speaking a non-official language most often at home (77%) and using English most often at work (80%), which is an important area of the public sphere. If, as our reference point, we use couples in which both partners are French-English FOLS, we observe that less than 10% of the children living in families headed by these couples have French as their mother tongue, 24% speak French at least on a regular basis at home (9% reported using it most often) and 9% have French as their first official language spoken. By comparison, among couples consisting of two French FOLS immigrant partners, 72% of the children have French as their mother tongue, 81% reported using French at least on a regular basis at home (73% most often) and 76% are French FOLS.
With regard to sociodemographic characteristics, we observed that French FOLS immigrants and French-English FOLS immigrants have a different geographic distribution. In some urban centres such as Toronto, Calgary and Vancouver, French-English FOLS immigrants greatly outnumber French FOLS immigrants, whereas in other centres, such as Ottawa, Sudbury and Moncton, the opposite is true.
In 2011, there were nearly 74,500 French-speaking (French FOLS) immigrants and 79,400 immigrants with a double first official language (French-English FOLS) outside Quebec. Data from the 2011 NHS show a significant change since 2006, and this is perhaps the most important finding of this update to the 2010 study: the strong increase in French FOLS immigrants (60,900 in 2006), and the weak increase in French-English FOLS immigrants (76,100 in 2006).
More than 50% of these immigrants lived in Ottawa and Toronto, a figure that rises to 66% if we include Vancouver. Also, Toronto and Vancouver had many more immigrants with a double first official language than immigrants with only French as their FOLS. By comparison, Ottawa had close to 50% more immigrants for whom French was the only FOLS than immigrants with a double official language. These considerations are important when the focus of the study is on French-language immigration outside Quebec.
French-English FOLS immigrants tend to settle in the same places as the majority of immigrants, whereas the results presented in this report suggest that French FOLS immigrants often choose francophone communities (defined on the basis of French FOLS) as their place of residence.
The geographic origins of French FOLS immigrants are quite different from those of French-English FOLS immigrants. French FOLS immigrants come from countries where French is the official language, and are mostly from Europe or Africa. French-English FOLS immigrants have more diverse origins. A small proportion come from countries where French is an official language, and nearly 30% come from a country where French is present. In general, these French-English FOLS immigrants were born in Asia (China, India) or in non-francophone Europe.
The results presented in this study seem to confirm the concerns highlighted in Citizenship and Immigration Canada’s Strategic Plan about the implementation of English- and French language training adapted to the needs of French-speaking immigrants. They also validate the initiative of language training for immigrants outlined in the Roadmap for Canada’s Official Languages 2013-2018. Furthermore, these results revealed that, all things being otherwise equal, the unemployment rate in 2011 for French FOLS immigrants and immigrants who reported not knowing English was four percentage points higher than that of immigrants who reported having a knowledge of English. With regard to the labour force participation rate, the difference between French FOLS immigrants who know English and those who cannot conduct a conversation in that language is considerable (80% versus 71%).
Of course, the statistical portrait presented in this report is a general one. Nevertheless, it suggests a number of avenues of research that would be worth pursuing in future studies, particularly by triangulating methodological approaches. Since the size of French-speaking immigrant populations is fairly small as is their share of the total immigrant population, this clearly poses a number of methodological challenges in getting a better understanding of the dynamics that influence the integration of these immigrants into French-speaking communities outside Quebec. However, the statistics presented in this report, which are drawn from Canadian census and the National Household Survey, are a very useful source of information. When combined with other data sources on the subject, they are a good baseline for orienting future studies on this topic.
Appendix A: Population (in thousands) according to immigrant status and first official language spoken (FOLS) (after redistribution of the French-English category), Canada, Quebec and Canada less Quebec, 1991 to 2011
| 1991 | 1996 | 2001 | 2006 | 2011 | |
|---|---|---|---|---|---|
| French FOLS native-born | 6,438 | 6,578 | 6,638 | 6,754 | 6,851 |
| French FOLS immigrant | 353 | 418 | 474 | 586 | 696 |
| Immigrants FOLS other | 3,990 | 4,553 | 4,975 | 5,601 | 6,080 |
| Native-born FOLS other | 15,990 | 16,812 | 17,354 | 18,034 | 18,869 |
| Non-permanent resident | 223 | 167 | 199 | 265 | 356 |
| 1991 | 1996 | 2001 | 2006 | 2011 | |
|---|---|---|---|---|---|
| French FOLS native-born | 5,532 | 5,683 | 5,743 | 5,862 | 5,999 |
| French FOLS immigrant | 294 | 346 | 386 | 487 | 582 |
| Immigrants FOLS other | 298 | 319 | 321 | 364 | 393 |
| Native-born FOLS other | 643 | 656 | 635 | 673 | 692 |
| Non-permanent resident | 44 | 41 | 40 | 49 | 67 |
| 1991 | 1996 | 2001 | 2006 | 2011 | |
|---|---|---|---|---|---|
| French FOLS native-born | 905 | 895 | 895 | 892 | 853 |
| French FOLS immigrant | 60 | 72 | 88 | 99 | 115 |
| Immigrants FOLS other | 3,692 | 4,235 | 4,654 | 5,236 | 5,686 |
| Native-born FOLS other | 15,347 | 16,156 | 16,718 | 17,361 | 18,177 |
| Non-permanent resident | 179 | 125 | 158 | 216 | 289 |
| 1991 | 1996 | 2001 | 2006 | 2011 | |
|---|---|---|---|---|---|
| French FOLS native-born | 14% | 14% | 14% | 13% | 12% |
| French FOLS immigrant | 17% | 17% | 19% | 17% | 17% |
| Immigrants FOLS other | 93% | 93% | 94% | 94% | 94% |
| Native-born FOLS other | 96% | 96% | 96% | 96% | 96% |
| Non-permanent resident | 80% | 75% | 80% | 82% | 81% |
FOLS = Population of groups defined according to first official language spoken.
The category FOLS other includes FOLS groups "English" and "neither English nor French".
Sources: Statistics Canada, 1991 to 2006 censuses, and 2011 National Household Survey.
Note to reader:
The table in Appendix A provides the population counts of groups defined according to first official language spoken (FOLS) and immigrant status between 1991 and 2011 for Canada as a whole, for Quebec and for Canada outside Quebec. The fourth panel in the table (percentage Canada less Quebec) shows the number of persons outside Quebec as a percentage of the total population in each group at each census, that is, the numbers in the third panel divided by those in the first panel and expressed as a percentage
Appendix B: List of countries with French or romance language
French, official language
- Haiti
- Belgium
- France and DOM/TOM
- Luxembourg
- Monaco
- Switzerland
- Benin
- Burkina Faso
- Ivory Coast
- Guinea
- Mali
- Niger
- Senegal
- Togo
- Burundi
- Comoros
- Djibouti
- Madagascar
- Rwanda
- Seychelles
- Cameroon
- Central African Republic
- Chad
- Congo DR
- Congo R
- Equatorial Guinea
- Gabon
- Vanuatu
French, language present
- Dominica
- St. Lucia
- Bulgaria
- Romania
- Moldova
- Albania
- Andorra
- Greece
- Macedonia
- Cape Verde
- Ghana
- Guinea-Bissau
- Mauritania
- Mauritius
- Algeria
- Egypt
- Morocco
- Tunisia
- Western Sahara
- Sao Tome and Principe
- Cyprus
- Lebanon
- Armenia
- Cambodia
- Laos
- Viet Nam
Romance language
- Belize
- Costa Rica
- El Salvador
- Guatemala
- Honduras
- Mexico
- Nicaragua
- Panama
- Cuba
- Dominican Republic
- Puerto Rico
- Argentina
- Bolivia
- Brazil
- Chile
- Colombia
- Ecuador
- Paraguay
- Peru
- Uruguay
- Venezuela
- Italy
- Malta
- Portugal
- San Marino
- Spain
- Mozambique
- Angola
Appendix C: Note on the quality and comparability of the National Household Survey data
From the start of collection to approval for release, NHS data undergo many analyses, and a number of quality indicators are produced. In this assessment process, the indicators are analyzed so that the quality of the NHS estimates can be assessed and users can be informed of any potential limitations in the estimates.
Non-response bias
The National Household Survey is a voluntary survey and it is affected by a non-response biasFootnote 14. There is non-response bias when a survey's non-respondents are different from its respondents. In that case, the higher a survey's non-response is, the greater the risk of non-response bias. The quality of the estimates can be affected if such a bias is present. Several different methods can be used during data collection or processing to minimize non-response bias. NHS non-response follow-up was planned in such a way as to maximize the survey's response rate and control potential non-response bias due to the survey's voluntary nature.
It is impossible to definitively determine how the NHS was affected by a non-response bias. Nevertheless, based on information from other data sources, we know that this bias exists for certain sub-populations and geographic regions. In general, the risk of error increases for smaller levels of geography and for smaller populations.
For more information, please refer to the National Household Survey User Guide
Comparability of the NHS estimates and the 2006 Census
The content of the NHS is similar to that of the 2006 Census long questionnaire. However, a number of changes were made to some questions and sections of the questionnaire. For example, the NHS measures a new component of income (capital gains or losses) and child care and support expenses; the questions used to measure Aboriginal identity were altered slightly; and the universe for determining generational status was expanded to include the entire population, not just the population aged 15 and over. In addition, the unpaid work section was not asked in the 2011 NHS.
Any significant change in survey method or content can affect the comparability of the data over time, and that applies to the NHS as well. It is impossible to determine with certainty whether, and to what extent, differences in a variable are attributable to an actual change or to non-response bias. Consequently, at every stage of processing, verification and dissemination, considerable effort was made to produce data that are as precise in their level of detail, and to ensure that the NHS's published estimates are of good quality in keeping with Statistics Canada standards.
Caution must be exercised when NHS estimates are compared with estimates produced from the 2006 Census long form, especially when the analysis involves small geographies. Users are asked to use the NHS's main quality indicator, the global non-response rate, in assessing the quality of the NHS estimates and determining the extent to which the estimates can be compared with the estimates from the 2006 Census long form. Users are also asked to read any quality notes that may be included in dissemination products.
For more information, please refer to the NHS User guide - Chapter 7 – Appendices.