
A pan-Canadian comparison of coverage for hospital and take-home oncology medicines
Cancer is a life-threatening and increasingly prevalent condition with expensive emerging treatments that patients often cannot afford and payers struggle to fund, and there are unique complexities when it comes to the coverage of these medicines. As per the provisions of the Canada Health Act, oncology medicines administered in hospitals are fully covered by public budgets and provided at no cost to patients, while take-home medicines, an emerging standard treatment for many cancers, are covered through a mix of public and private reimbursement, with the potential for interprovincial variations in the listing and source of funding.
In Canada, there are several public funding options for cancer medicines through hospital drug budgets, the provincial drug plans, and/or the provincial cancer agencies. This study compares provincial formulary listing rates and examines agreement in listing decisions between pairs of provinces for 40 hospital and 47 take-home oncology medicines. Of the total selected market, hospital medicines represented 55% of sales while take-home accounted for 45%. Programs were considered to be in agreement if both provinces had the same listing decision: either to list or not to list the given medicine. The analysis also considers differences in provincial spending and payer split between jurisdictions.
The oncology medicines included in this analysis were reviewed from March 1, 2007, through March 31, 2019, by the interim Joint Oncology Drug Review (iJODR; 2007-2010) or the pan-Canadian Oncology Drug Review (pCODR; 2010-2019), with listings on public formularies for the pCODR-participating provinces, as well as the public programs in Quebec, as of March 31, 2020. A list of medicines reimbursed by private drug plans was obtained for 2019. Spending and weighted listing rates were based on Canadian national retail and hospital sales in 2019.
1. The coverage rates of hospital and take-home medicines are comparable across many Canadian provinces.
Formulary listing rates for hospital and take-home medicines were nearly identical in the western provinces, which have universal programs for oncology medicines, and were also very similar in provinces with different funding mechanisms, with some interprovincial variability within both segments.
The average public listing rate for hospital medicines was 82%, ranging from 60% in Prince Edward Island to 90% in British Columbia, Saskatchewan, and Manitoba. Take-home medicines had a slightly higher average listing rate, at 86%, with Prince Edward Island on the low end at 64% and Saskatchewan on the high end at 94%. The weighted average listing rates were consistently high for both hospital and take-home medicines in the majority of the provincial drug programs, at an average of 98% and 96%, respectively.
Private drug plans reimbursed patients for 68% of the hospital medicines and all take-home medicines.
Figure 1. Hospital and take-home oncology medicine* formulary listing rates by province
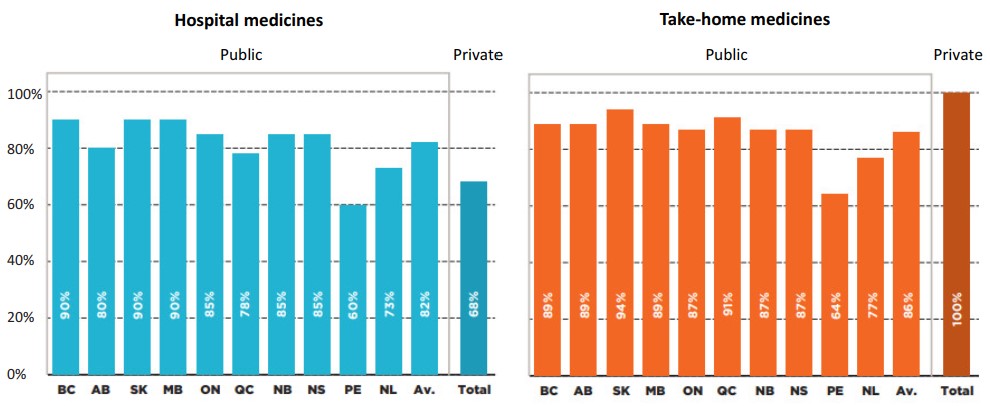
Figure description
Two bar graphs give the formulary listing rates by province for a) hospital oncology medicines and b) take-home oncology medicines as of March 31, 2020. In each case, an average across all provinces is shown, as well as the listing rates for private plans.
Hospital medicines
| Listing rates | |
|---|---|
British Columbia |
90% |
Alberta |
80% |
Saskatchewan |
90% |
Manitoba |
90% |
Ontario |
85% |
Quebec |
78% |
New Brunswick |
85% |
Nova Scotia |
85% |
Prince Edward Island |
60% |
Newfoundland and Labrador |
73% |
Average for all public programs |
82% |
Private plans |
68% |
Take-home medicines
| Listing rates | |
|---|---|
British Columbia |
89% |
Alberta |
89% |
Saskatchewan |
94% |
Manitoba |
89% |
Ontario |
87% |
Quebec |
91% |
New Brunswick |
87% |
Nova Scotia |
87% |
Prince Edward Island |
64% |
Newfoundland and Labrador |
77% |
Average for all public programs |
86% |
Private plans |
100% |
2. In both the hospital and take-home market segments, most oncology medicines are listed in at least six provinces.
A vast majority (85%) of hospital medicines were listed on six or more of the 10 provincial formularies, with 48% listed in all provinces and 38% listed in six to nine. These medicines accounted for 99% of Canadian sales for the select hospital oncology medicines in 2019.
Take-home medicines showed a similar distribution: 89% were listed on six or more provincial formularies, with 51% in all provinces and 38% in six to nine. These medicines accounted for 97% of sales for the select take-home medicines in 2019.
Figure 2. Distribution of hospital and take-home oncology medicines* by number of provincial formulary listings
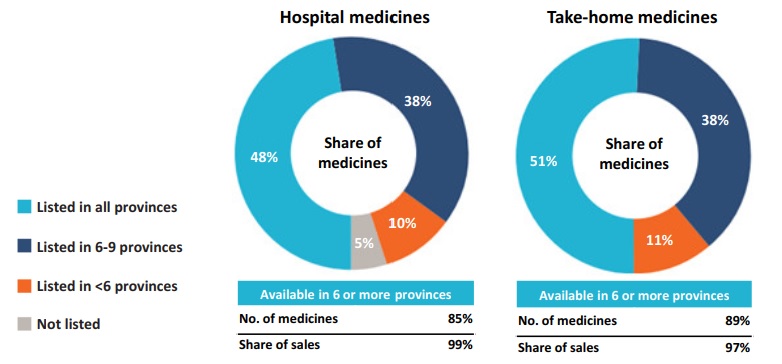
Figure description
This figure is composed of two pie charts that compare the number of provincial formulary listings for hospital medicines and take-home medicines. Each graph gives the percentage of select oncology medicines that were listed in all provinces; six to nine provinces; fewer than six provinces; and in none of the provinces as of March 31, 2020. For hospital medicines, 85% were listed in six or more provinces and accounted for 99% of sales. For take-home medicines, 89% were listed in six or more provinces and accounted for 97% of sales.
| Share of hospital medicines | Share of take-home medicines | |
|---|---|---|
Listed in all provinces |
48% |
51% |
Listed in 6 to 9 provinces |
38% |
38% |
Listed in fewer than 6 provinces |
10% |
11% |
Not listed |
5% |
0% |
3. Interprovincial formulary agreement rates for hospital and take-home medicines are uniformly high.
The bilateral agreement rates between pairs of provinces, both in terms of the number of medicines covered (unweighted) and their corresponding national sales (weighted), were nearly the same for hospital and take-home oncology medicines.
In terms of the number of medicines, the agreement rates for hospital medicines ranged from a low of 59% to a high of 97%, with average and median rates of 84% and 85%, respectively. The average and median agreement rates for take-home medicines were relatively unchanged, with a range from 64% to 100%. When sales were considered, the average and median agreement rates increased for both segments, suggesting that while some medicines were not consistently listed across the plans, they accounted for a small share of national sales.
Figure 3. Formulary agreement rates in public drug programs by hospital and take-home oncology medicines*
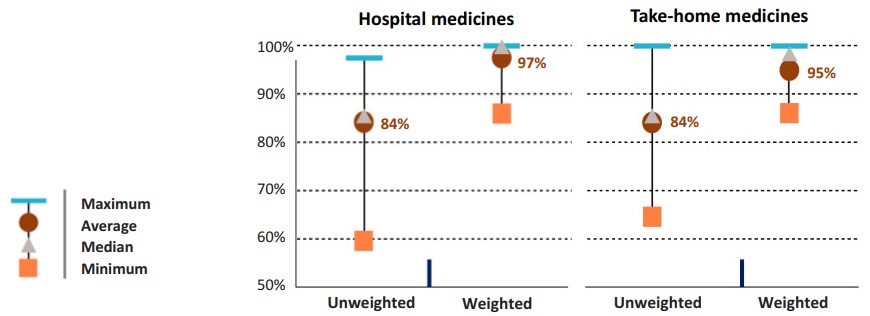
Figure description
This graph gives the range of formulary listing agreement rates for the selected hospital and take-home medicines by market segment across all pairs of provincial drug programs. The minimum, maximum, average, and median listing rates are given, both in terms of the number of medicines covered (unweighted) and their corresponding national sales (weighted).
| Maximum | Average | Median | Minimum | |
|---|---|---|---|---|
Hospital (unweighted) |
97% |
84% |
85% |
59% |
Hospital (weighted) |
100% |
97% |
99% |
86% |
Take-home (unweighted) |
100% |
84% |
85% |
64% |
Take-home (weighted) |
100% |
95% |
97% |
87% |
4. Per capita spending varies across provinces for both hospital and take-home medicines.
Overall, spending on hospital medicines was consistently higher than take-home medicines in 2019, with a national average of 55% versus 45%.
The top provinces in per capita spending on hospital medicines were also at the top for spending on take-home medicines. New Brunswick and Quebec ranked first and second, respectively, for both categories, while the Prince Edward Island and Newfoundland and Labrador were third for hospital medicines and sixth for take-home medicines. Western provinces, apart from British Columbia, spent significantly less per capita for both segments.
These variations may be influenced by jurisdictional differences in the model of cancer care, drug plan designs, policies, clinical practice, demographics, and disease profiles of the provincial population.
Figure 4. Provincial sales per 100,000 population for hospital and take-home medicines, 2019
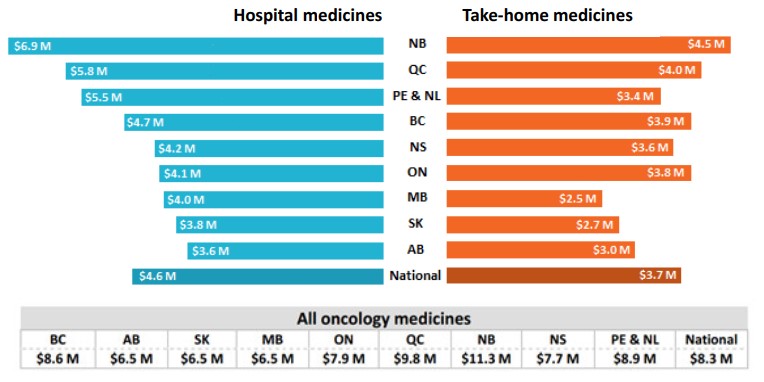
Figure description
This bar graph gives the provincial sales for hospital and take-home oncology medicines per 100,000 population in the jurisdiction. A national total is also given. Prince Edward Island and Newfoundland and Labrador are reported together in the IQVIA Canadian Drugstore and Hospital Purchases Audit (CDH) database and have therefore been combined for this analysis.
| Sales for hospital medicines (in millions of dollars) | Sales for take-home medicines (in millions of dollars) | All oncology medicines | |
|---|---|---|---|
New Brunswick |
$6.9 |
$4.5 |
$11.3 |
Quebec |
$5.8 |
$4.0 |
$9.8 |
Prince Edward Island and Newfoundland and Labrador |
$5.5 |
$3.4 |
$8.9 |
British Columbia |
$4.7 |
$3.9 |
$8.6 |
Nova Scotia |
$4.2 |
$3.6 |
$7.7 |
Ontario |
$4.1 |
$3.8 |
$7.9 |
Manitoba |
$4.0 |
$2.5 |
$6.5 |
Saskatchewan |
$3.8 |
$2.7 |
$6.5 |
Alberta |
$3.6 |
$3.0 |
$6.5 |
National |
$4.6 |
$3.7 |
$8.3 |
* Prince Edward Island and Newfoundland and Labrador are reported together in the IQVIA Canadian Drugstore and Hospital Purchases Audit (CDH) database and have therefore been combined for this analysis.
5. While hospital medicines are financed consistently across the country, the payer split for take-home medicines differs significantly between provinces.
Oncology medicines administered in hospitals are universally covered by hospital budgets in Canada, though there may be medicines from our selection that the hospital formularies do not list. For this reason, an average of 96% of the selected medicines were paid by public budgets in 2019 and only 4% by private payers.
The data shows greater variability in the reimbursement of take-home oncology medicines. Public drug programs in the western provinces, where provincial cancer agencies offer universal and first dollar coverage for all cancer medicines, paid 83% to 88% of take-home oncology medicines in 2019. Quebec, which offers universal coverage but requires premiums, paid for 70% of the medicines from public budgets, while Ontario and the Atlantic provinces are not as comprehensive in terms of coverage, resulting in greater contributions from private insurers.
Figure 5. Payer split† for hospital and take-home oncology medicines by province*, 2019
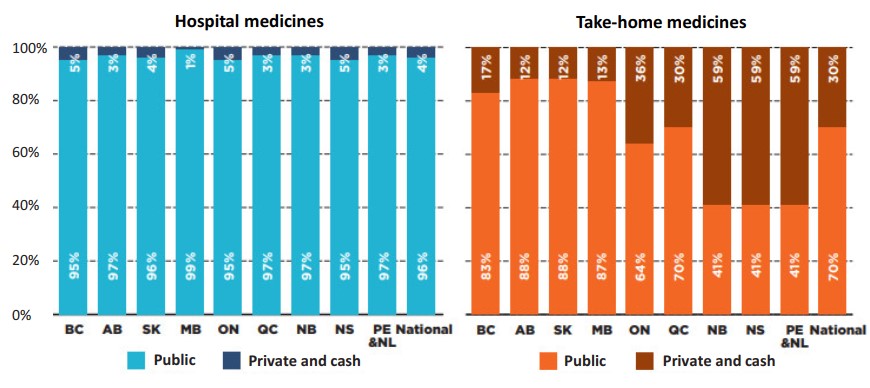
Figure description
Two stacked bar graphs give the distribution of spending by payer for a) hospital and b) take-home oncology medicines. The public payer and private or cash share is provided for each province as well as a national total. Prince Edward Island & Newfoundland and Labrador are reported together in the IQVIA Canadian Drugstore and Hospital Purchases Audit (CDH) Database and have therefore been combined for this analysis.
Hospital oncology medicines
| Public plan share of spending | Private plan and cash share of spending | |
|---|---|---|
British Columbia |
95% |
5% |
Alberta |
97% |
3% |
Saskatchewan |
96% |
4% |
Manitoba |
99% |
1% |
Ontario |
95% |
5% |
Quebec |
97% |
3% |
New Brunswick |
97% |
3% |
Nova Scotia |
95% |
5% |
Prince Edward Island and Newfoundland and Labrador |
97% |
3% |
Total |
96% |
4% |
Take-home oncology medicines
| Public plan share of spending | Private plan and cash share of spending | |
|---|---|---|
British Columbia |
83% |
17% |
Alberta |
88% |
12% |
Saskatchewan |
88% |
12% |
Manitoba |
87% |
13% |
Ontario |
64% |
36% |
Quebec |
70% |
30% |
New Brunswick |
41% |
59% |
Nova Scotia |
41% |
59% |
Prince Edward Island and Newfoundland and Labrador |
41% |
59% |
Total |
70% |
30% |
* Prince Edward Island & Newfoundland and Labrador are reported together in the IQVIA Canadian Drugstore and Hospital Purchases Audit (CDH) Database and have therefore been combined for this analysis.
† The payer split is a PMPRB estimate based on various data sources. Private payers include both private insurers and cash-paying patients.
Note:
Quebec listing statuses were based on the available data published by the Régie de l'assurance maladie du Québec (RAMQ) on April 29, 2020.
Data source:
Coverage status - Publicly available data including the pCODR and RAMQ websites, March/April 2020;
Sales - IQVIA Canadian Drugstore and Hospital Purchases Audit (CDH) database, 2019;
Private plans - IQVIA Private Drug Plan (PDP) database, 2019;
Payer split - Above-mentioned data, CIHI NPDUIS database, IQVIA Payer Insights, 2019.
Limitations:
Sales weights are based on overall national retail and hospital sales. Medicines not commonly reimbursed or reimbursed by smaller plans may have lower related sales and sales data for some of the selected medicines may not be available in the IQVIA CDH database; this may have a slight impact on some of the results.
Disclaimer: Although based in part on data provided by the IQVIA and Canadian Institute for Health Information (CIHI), the statements, findings, conclusions, views and opinions expressed in this report are exclusively those of the PMPRB and are not attributable to IQVIA or CIHI.