
Market Intelligence Report: Antidiabetic Drugs, 2012-2021
Table of Contents
- Executive Summary
- Introduction
- Methods
- 1. Diabetes Backgrounder
- 2. Canada’s Regulatory and Reimbursement Landscape
- 3. Cost Drivers
- 4. A Look into the Future
- References
- Bibliography
- Appendix A: Methodology Notes
- Appendix B: Assessments, Recommendations, Negotiation Status, and Reimbursement Decisions
Acknowledgements
This report was prepared by the PMPRB as part of the NPDUIS initiative.
The PMPRB wishes to acknowledge and thank the members of the NPDUIS Advisory Committee for their expert oversight and guidance in the preparation of this report. Please note that the statements, findings, and conclusions do not necessarily reflect those of the members or their organizations.
Appreciation goes to Joan Fearnley and Allison Carey for leading this project and to Jared Berger, Kevin Pothier and Tanya Potashnik for their oversight in the development of the report. The PMPRB also wishes to acknowledge the contribution of the analytical staff Jun Yu and Yvonne Zhang; and editorial staff Shirin Paynter.
Disclaimer
NPDUIS operates independently of the regulatory activities of the Board of the PMPRB. The research priorities, data, statements, and opinions expressed or reflected in NPDUIS reports do not represent the position of the PMPRB with respect to any regulatory matter. NPDUIS reports do not contain information that is confidential or privileged under sections 87 and 88 of the Patent Act, and the mention of a medicine in a NPDUIS report is not and should not be understood as an admission or denial that the medicine is subject to filings under sections 80, 81, or 82 of the Patent Act or that its price is or is not excessive under section 85 of the Patent Act.
Although this information is based in part on data obtained from the NPDUIS Database of the Canadian Institute for Health Information (CIHI) and under license from IQVIA’s MIDAS® Database, Payer Insights database, and Private Pay Direct Drug Plan database, the statements, findings, conclusions, views, and opinions expressed in this report are exclusively those of the PMPRB and are not attributable to CIHI or IQVIA.
Contact Information
Patented Medicine Prices Review Board
Standard Life Centre
Box L40
333 Laurier Avenue West
Suite 1400
Ottawa, ON K1P 1C1
Tel.: 1-877-861-2350
TTY 613-288-9654
Email: PMPRB.Information-Renseignements.CEPMB@pmprb-cepmb.gc.ca
Suggested Citation
Patented Medicine Prices Review Board. (2023). Market Intelligence Report: Antidiabetic Drugs, 2012-2021. Ottawa: PMPRB.
Executive Summary
One hundred years ago in 1923, the Nobel Prize for Physiology or Medicine was awarded to Frederick Grant Banting and Professor John James Rickard Macleod for the discovery of insulin, a milestone in the treatment for diabetes that has saved countless lives. Today, diabetes remains a common cause of illness and shortened life expectancy, putting pressure on health care budgets. In 2021, Canada ranked 9th in diabetes prevalence among the Organization for Economic Co-operation and Development (OECD) member countries and 2nd among the PMPRB’s 11 comparator countries. Diabetes will continue to be an ongoing concern for Canadian health care as the population ages.
This report explores the market dynamics affecting spending on antidiabetic drugs with an emphasis on new-generation/non-insulin drugs that experienced substantial growth over the course of the last decade. Trends in market shares and utilization are analysed at both the national and international levels. Foreign-to-Canadian price ratios and the impact of provincial biosimilar switching policies are also explored.
Key Findings
1. Antidiabetic drug growth outpaced the overall drug market
Growth in spending on antidiabetic drugs in Canada has continued to outpace spending in the overall drug market, effectively doubling the market share for these drugs from 4.2% to 7.9% (2012 to 2021). This growth reflects a shift to new classes of drugs for the treatment of diabetes resulting in a similar increase in the cost per capita for antidiabetic drugs from $26 to $71 (2012 to 2021). While OECD countries, particularly PMPRB11 comparators, faced similar spending trends and shifting utilization patterns, Canada ranked among those with higher costs and steeper increases.
2. New-generation treatments were the main driver of growth
In 2021, nearly three quarters (71%) of antidiabetic drug sales in Canada were for the new-generation/non-insulin subclasses. These drugs were responsible for almost all of Canada’s increase in cost per capita of antidiabetic drugs since 2012. The uptake of new-generation/non-insulin treatments began in late 2007 with the launch of the first DPP-4, Januvia. After a strong early growth, spending on DPP-4’s slowed following the launch of SGLT-2’s in the mid-2010’s suggesting a shift from DPP-4’s to SGLT-2’s. By 2021, DPP-4’s and SGLT-2’s accounted for 24% and 22% of spending on antidiabetic drugs, respectively. While GLP-1’s had little impact on spending in the early 2010’s, by 2021, GLP-1’s accounted for 25% of all antidiabetic drug spending due to the substantial growth of semaglutide (Ozempic) launched in 2018. In addition to changing prescribing guidelines for antidiabetics, additional indications for the treatment of heart failure and weight management have contributed to the uptake of the new-generation/non-insulin drugs.
3. Canadian prices were higher than PMPRB11 countries
Canada has higher prices for top-selling antidiabetic drugs compared to prices in the PMPRB11 comparator countries, which were roughly half to two-thirds of Canadian prices in 2021. It is estimated that these higher prices could represent additional spending of up to $703M in Canada, all payers (public, private, cash) and segments (retail and hospital) combined. It is possible that some payers have already achieved savings through confidential pricing agreements, which are not reported in the data and list prices.
4. Biosimilar policies led to more switching
Drugs in the new-generation/non-insulin market in Canada were still patented during the study period and generic competition will be gradual as the first DPP-4’s face competition in the future. Rather, during the study period, it is the biosimilars in the insulin market that offered opportunity for savings. A case study of insulin glargine (Lantus) showed a near-total switch to biosimilars in public plans in both British Columbia (by 2020) and Alberta (by 2021) following the implementation of a biosimilar switching policy affecting all patients, i.e., established and naïve (new) patients. Switching policies that target only naïve patients, in effect since 2017/18 in Quebec and Atlantic provinces, resulted in a significant, albeit smaller, shift to biosimilars by 2021 (53% to 80% biosimilars), outperforming provinces without biosimilar policies (5% to 23% biosimilars). The total market for insulin glargine (Lantus and biosimilars) was further affected by provincial plan formulary decisions such as removing reimbursement criteria for this class of insulins, and the decision to list insulin degludec (Tresiba), a new long-acting insulin. For example, in Alberta, the implementation of the biosimilar policy coincided with the listing of insulin degludec, which may have contributed to a 33% drop in total insulin glargine claims. Finally, market shares observed in private plans and in the cash market reflected the extent to which these segments operate in an integrated environment.
Introduction
This report on antidiabetic drugs is part of the PMPRB’s Market Intelligence Report series. These reports dive into specific therapeutic market segments that matter to Canadians. They use real-word evidence to inform policy discussions and support decision making while providing Canadians with an understanding of the issues that affect drug prices and utilization, both in Canada and internationally.
The Public Health Agency of Canada estimates the total number of individuals diagnosed with diabetes at over 3 million Canadians, representing an 8.9% prevalence rate. Furthermore, according to estimates by Diabetes Canada, the combined number of diagnosed and undiagnosed patients reached 5.7 million in 2022 and an additional 6 million Canadians are likely prediabetic. The cost burden of diabetes in Canada is estimated at $29 billion.Footnote 1 Type 1 diabetes is an autoimmune condition and represents roughly 10% of individuals living with diabetes. The risk of developing type 2 diabetes, however, is linked to common lifestyle factors such as diet, exercise, and smoking. Once diabetes is diagnosed, most patients will require antidiabetic drugs in addition to lifestyle changes to manage their condition. Over time other co-morbidities can surface leading to additional costs to health care systems and decreased quality of life and life expectancy for the patient.
Spending on antidiabetic drugs in Canada increased substantially from $0.9 billion in 2012 to $2.7 billion in 2021 (see Figure I.1). This increase outpaced the growth in the overall drug market resulting in an increased market share for antidiabetic drugs from 4.9% (2012) to 7.9% (2021). The three new-generation/non-insulin drug subclasses, which are the focus of this report, were the key drivers of this increase: glucagon-like peptide 1 (GLP-1) agonists, dipeptidyl peptidase (DPP-4) inhibitors, and sodium glucose cotransporter 2 (SGLT-2) inhibitors. While insulin sales remained stable during this period, notable changes occurred in Canada: provincial drug plans implemented biosimilar switching policies and insulin degludec (Tresiba) entered the market.
These trends in market shares and underlying utilization patterns are explored throughout this report. Section 1 provides a primer on diabetes in Canada and looks at diagnosis, treatment, and prevalence. Section 2 provides an overview of the regulatory and reimbursement landscape, highlighting key decisions and advice from major agencies and regulatory bodies. Section 3 dives into the numbers and explores the PMPRB’s real-world databases to reveal the cost drivers at play in this market. These include cost and utilization trends as well as international price comparisons and domestic competition. Finally, Section 4 looks at what the future may hold for new drugs in the pipeline for the treatment of diabetes.
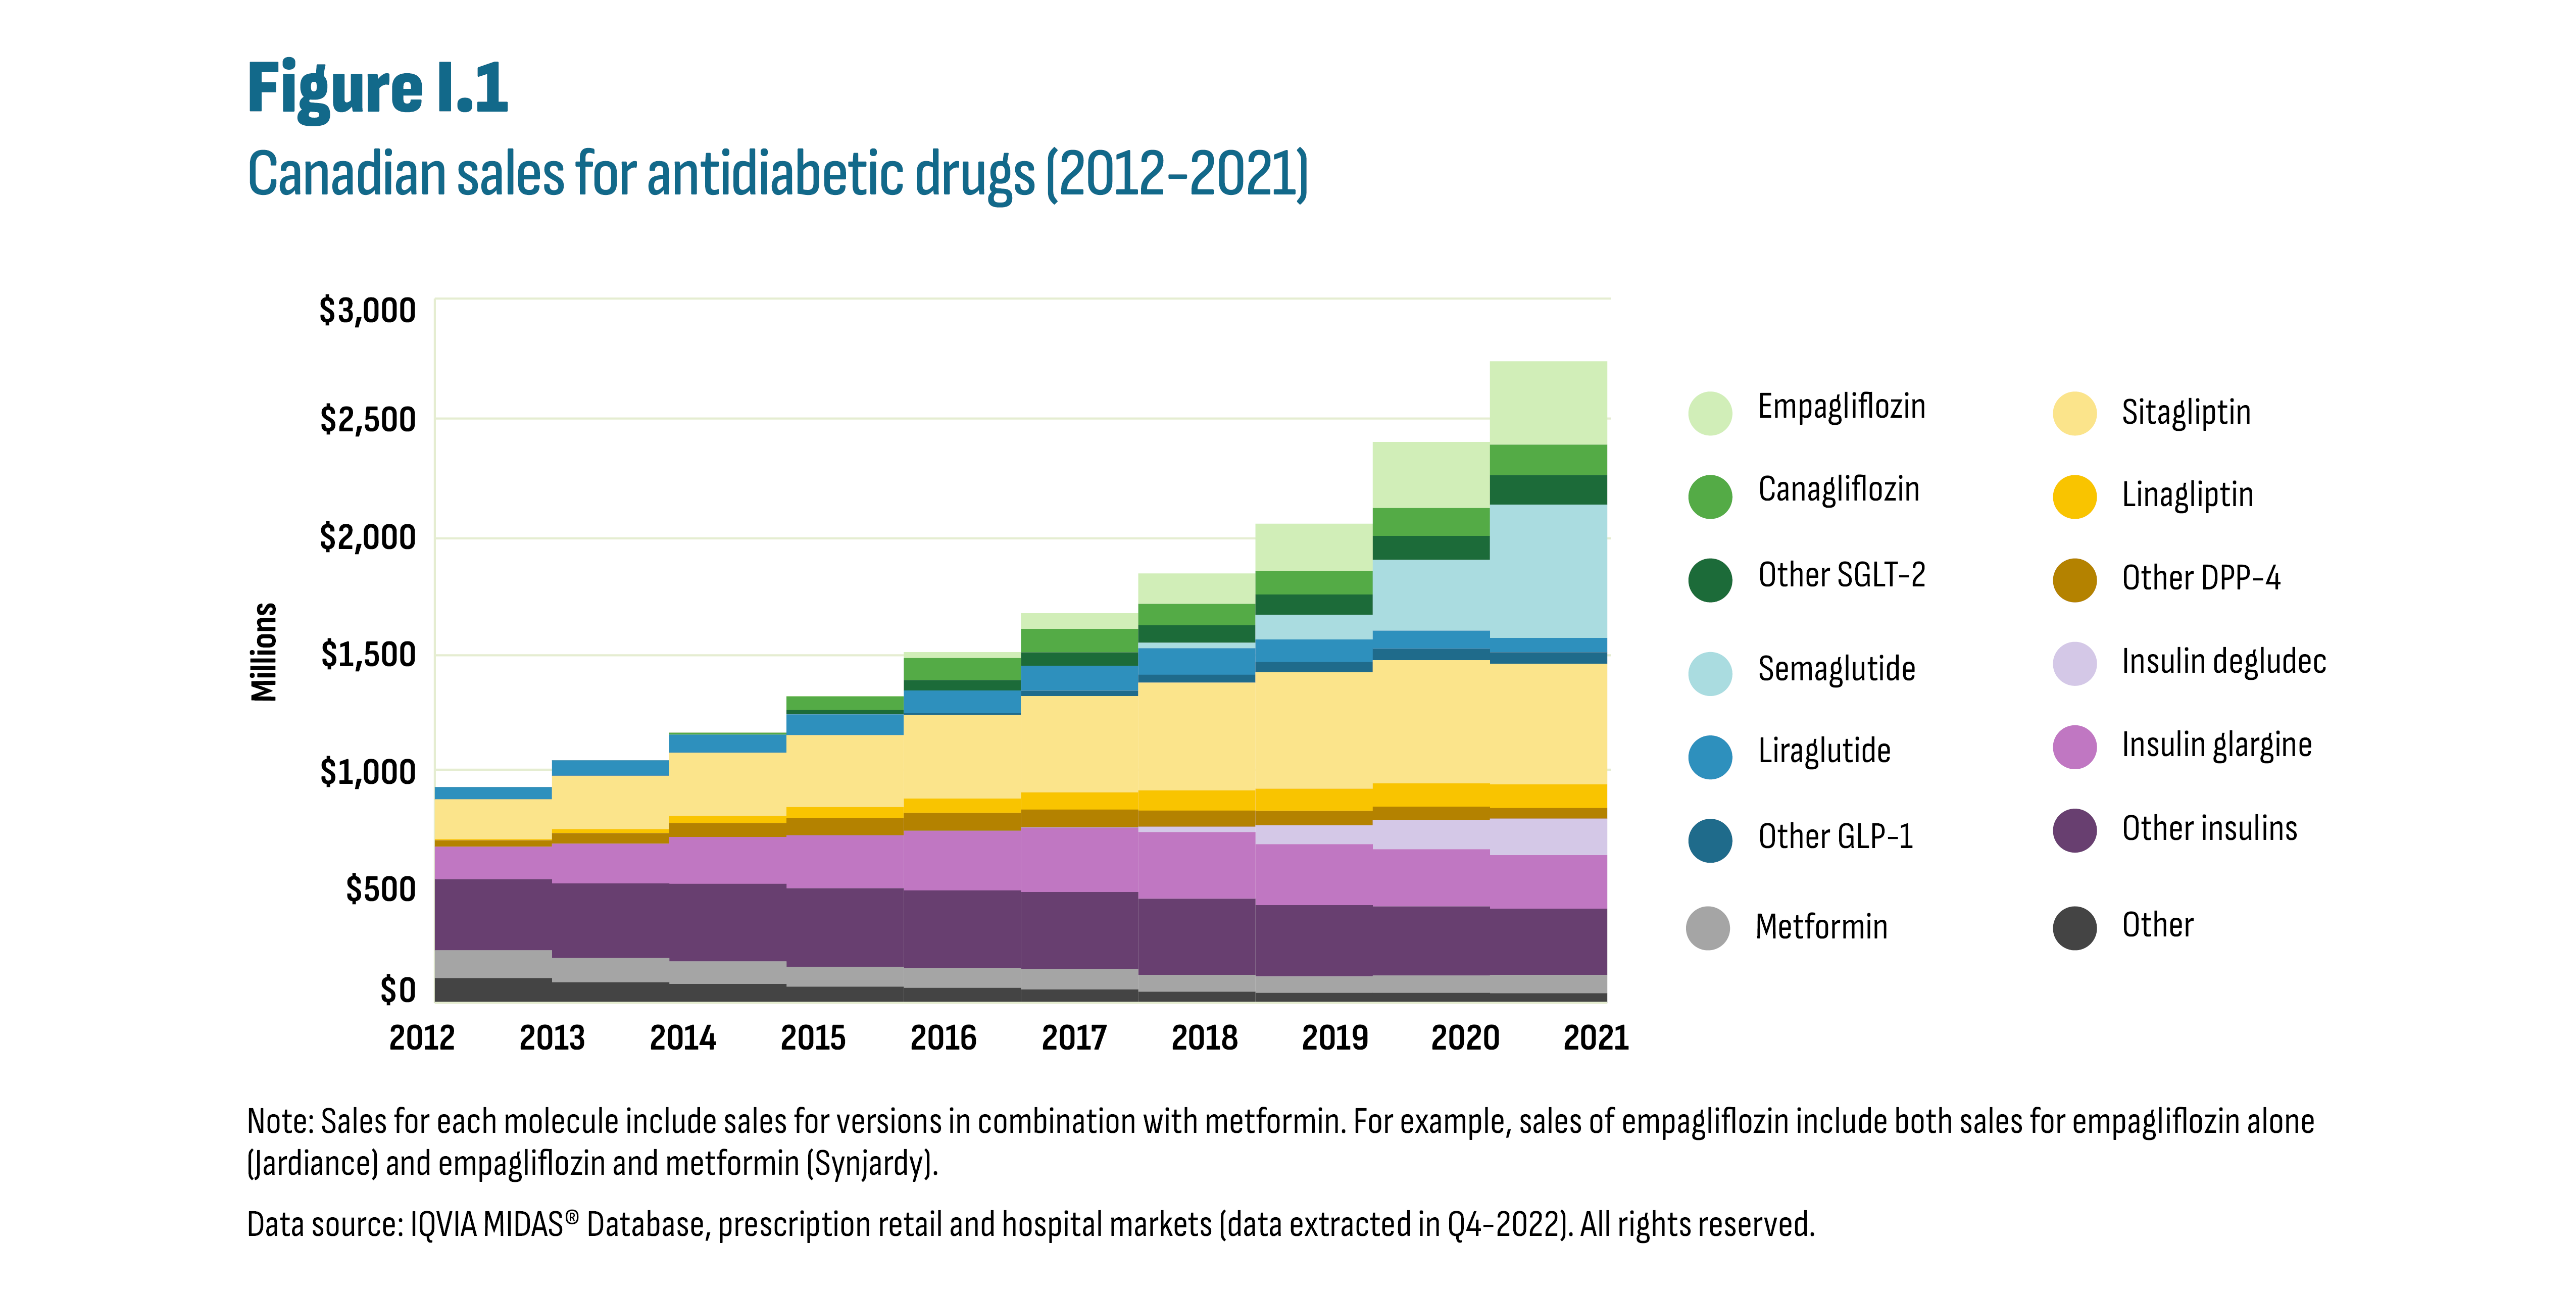
Figure description
This stacked area graph shows the trends in Canadian sales revenues for antidiabetic drugs from 2012 to 2021.
| 2012 | 2013 | 2014 | 2015 | 2016 | 2017 | 2018 | 2019 | 2020 | 2021 | ||
|---|---|---|---|---|---|---|---|---|---|---|---|
SGLT-2 |
Empagliflozin |
$0 million |
$0 million |
$0 million |
$1 million |
$25 million |
$67 million |
$130 million |
$201 million |
$282 million |
$355 million |
Canagliflozin |
$0 million |
$0 million |
$8 million |
$58 million |
$93 million |
$100 million |
$92 million |
$101 million |
$119 million |
$129 million |
|
Other SGLT-2 |
$0 million |
$0 million |
$0 million |
$18 million |
$45 million |
$57 million |
$74 million |
$86 million |
$102 million |
$126 million |
|
DPP-4 |
Sitagliptin |
$170 million |
$226 million |
$269 million |
$306 million |
$356 million |
$409 million |
$458 million |
$495 million |
$524 million |
$514 million |
Linagliptin |
$4 million |
$17 million |
$30 million |
$48 million |
$61 million |
$74 million |
$86 million |
$95 million |
$100 million |
$101 million |
|
Other DPP-4 |
$28 million |
$46 million |
$60 million |
$72 million |
$76 million |
$75 million |
$69 million |
$62 million |
$56 million |
$45 million |
|
GLP-1 |
Semaglutide |
$0 million |
$0 million |
$0 million |
$0 million |
$0 million |
$0 million |
$23 million |
$105 million |
$301 million |
$567 million |
Liraglutide |
$51 million |
$65 million |
$76 million |
$88 million |
$97 million |
$106 million |
$113 million |
$97 million |
$77 million |
$61 million |
|
Other GLP-1 |
$1 million |
$1 million |
$1 million |
$1 million |
$8 million |
$23 million |
$34 million |
$43 million |
$49 million |
$49 million |
|
Insulin |
Degludec |
$0 million |
$0 million |
$0 million |
$0 million |
$0 million |
$2 million |
$22 million |
$80 million |
$126 million |
$155 million |
Glargine |
$138 million |
$169 million |
$199 million |
$226 million |
$254 million |
$275 million |
$284 million |
$260 million |
$244 million |
$228 million |
|
Other Insulin |
$304 million |
$318 million |
$331 million |
$335 million |
$332 million |
$327 million |
$324 million |
$304 million |
$295 million |
$283 million |
|
Other |
Metformin |
$118 million |
$103 million |
$96 million |
$84 million |
$83 million |
$88 million |
$71 million |
$70 million |
$73 million |
$78 million |
Other antidiabetics |
$106 million |
$87 million |
$81 million |
$69 million |
$64 million |
$57 million |
$48 million |
$43 million |
$43 million |
$41 million |
Note: Sales for each molecule include sales for versions in combination with metformin. For example, sales of empagliflozin include both sales for empagliflozin alone (Jardiance) and empagliflozin & metformin (Synjardy).
Note: Sales for each molecule include sales for versions in combination with metformin. For example, sales of empagliflozin include both sales for empagliflozin alone (Jardiance) and empagliflozin and metformin (Synjardy).
Data source: IQVIA MIDAS® Database, prescription retail and hospital markets (data extracted in Q4-2022). All rights reserved.
Methods
Drug Selection
Antidiabetic drugs were selected at level 4 of the World Health Organization (WHO) Anatomic Therapeutic Chemical (ATC) classification system in the A10A (insulin) and A10B (non-insulin) categories (see Table M1). Devices were excluded. While diabetes is the primary indication for these drugs, some have other indications such as drugs in the SGLT-2 class that are also indicated for heart failure. The databases analyzed do not include information on the patient’s diagnosis and consequently it is not possible to determine with certainty the indication for which a drug is prescribed.
Table M1 Antidiabetic drugs included in analysis, by subclass
| Subclass | ATC | Molecules |
|---|---|---|
SGLT-2: sodium-glucose cotransporter-2 inhibitors. Oral solid medications that block the reabsorption of glucose in the kidney, thereby increasing the amount of glucose excreted through the urine. |
A10BK A10BD |
Canagliflozin, dapagliflozin, empagliflozin, ertugliflozin, and their combinations with metformin or with DPP-4’s. Combinations with insulins are grouped with insulins. |
GLP-1: glucagon-like peptide-1 receptor agonists. Primarily injectable pens that stimulate the release of insulin and reduce the release of glucagon from the pancreas. |
A10BJ |
Semaglutide, liraglutide, dulaglutide, exenatide, lixisenatide. |
DPP-4: dipeptidyl peptidase-4 inhibitors. Oral solid medications that stimulate the release of insulin when blood glucose is rising and inhibit the release of glucose from the liver. |
A10BH A10BD |
Sitagliptin, saxagliptin, linagliptin, alogliptin, and their combinations with metformin. Combinations with SGLT-2 are grouped with SGLT-2. |
Insulins: All forms of insulin (injectables). |
A10A A10AE |
Featured analysis looks at insulin glargine and insulin degludec in the subclass of long-acting soluble basal insulin analogue (A10AE). |
Metformin: Biguanides. |
A10BA |
All sources of metformin not in combination with other molecules. |
Other |
A10BB |
Sulfonylureas |
Comparator countries
This report compares Canada to members of the Organization for Economic Co-operation and Development (OECD), and specifically focuses on the PMPRB’s new basket of 11 comparator countries (PMPRB11): Australia, Belgium, France, Germany, Italy, Japan, the Netherlands, Norway, Spain, Sweden, and the United Kingdom (UK). When appropriate, the United States (US) and Switzerland are included as they were both in the original PMPRB basket of 7 countries (PMPRB7). For reference, countries are labelled in the figures with 7 and/or 11 to indicate their inclusion in the current PMPRB11 basket and the PMPRB7 historical basket (e.g., France (7/11)).
Data sources
The findings in this report are based on an analysis of databases from IQVIA and the National Prescription Drug Utilization Information System (NPDUIS) database managed by the Canadian Institute for Health Information (CIHI). These are detailed below along with notes on notable considerations. Further descriptions of PMPRB source materials can be found in the Reference Documents section of the Analytical Studies page on the PMPRB website. Additional databases and resources consulted are listed below.
Drug sales and drug plan databases
NPDUIS |
Provincial drug plan administrative data for all provinces except Quebec. Quebec public plan data provided in the report are estimates calculated using the IQVIA Payer Insights database (see below). |
IQVIA MIDAS® Database (all rights reserved) |
Country-specific international data for both retail and hospital sales. It includes units sold and sales amounts. These data are the primary source for international trends and price comparisons in Sections 3.1 and 3.2. |
IQVIA Private Drug Plan database |
Private drug plan administrative data obtained from pay-direct private insurers. While each supplier’s data are complete, not all Canadian insurers are included in this database and coverage varies across provinces. |
IQVIA Payer Insights database |
Database generated from a sampling of retail (community) pharmacies that specifies first payer: public plan, private plan, or out-of-pocket (cash). Used mainly to calculate market shares for each payer (public/private/cash). Also used as a proxy to analyze drug utilization in the Quebec public drug plan (data not included in the NPDUIS database). These estimates are provided for market shares only where additional context is relevant. |
Additional databases and online resources
- Information on provincial drug programs and formularies consulted online through their respective websites.
- Public Health Agency of Canada. Canadian Chronic Disease Surveillance System (CCDSS), Data Tool 2000–2017, 2019 Edition. Ottawa (ON): Public Health Agency of Canada; 2021. Available at: Canadian Chronic Disease Surveillance System (CCDSS) (canada.ca)
- Health Canada. Notice of Compliance Database. Government of Canada. Retrieved from: Notice of Compliance - Drug Products - Canada.ca.
- Statistics Canada. Table 11-10-0190-01 Market income, government transfers, total income, income tax and after-tax income by economic family type.
- World Health Organization. A10AE Insulins and analogues for injection, long-acting. Available at: WHOCC - ATC/DDD Index.
- Organisation for Economic Co-operation and Development. Dataset: Historical Population. Available at: https://stats.oecd.org/.
- pan-Canadian Pharmaceutical Alliance. Brand Name Drug Negotiations. Available at: https://www.pcpacanada.ca/negotiations
- GlobalData Healthcare database
Data limitations
Sales and spending reported in the drug sales and drug plan databases listed do not capture confidential price discounts. Price differentials and expenditure values may be overestimated or underestimated depending on these discounts in both Canadian and foreign markets. In addition, drug plan databases do not contain information on the reason a drug is prescribed. While most antidiabetic drugs are prescribed for treating diabetes, some drug classes may be used for other indications (see: Drug selection, above).
1. Diabetes Backgrounder
This section provides key information on the causes, diagnosis, and drug therapies for diabetes as well as the current prevalence and incidence of diabetes in Canada.
1.1 About diabetes mellitus: definition, diagnosis, and treatment

Figure description
This figure groups antidiabetic drug classes according to their use as first- or second-line therapies in the treatment of type 2 diabetes.
| Drug class | Treatment | Insulin/non-insulin | Category |
|---|---|---|---|
Metformin |
First line |
Non-insulin |
|
Other: Alpha-glucosidase inhibitors, Meglitinides, Sulfonylureas, Thiazolidinediones (TZDs) |
Second line |
Non-insulin |
|
SGLT-2: sodium-glucose cotransporter-2 inhibitors |
Second line |
Non-insulin |
New-generation |
DPP-4: dipeptidyl peptidase-4 inhibitors |
Second line |
Non-insulin |
New-generation |
GLP-1: glucagon-like peptide-1 receptor agonists |
Second line |
Non-insulin |
New-generation |
Insulins |
Second line |
Insulin |
|
Diabetes mellitus is a chronic condition associated with impairment of insulin secretion. Insulin is a hormone produced by the pancreas and is essential for regulating blood glucose (sugar) levels. Diabetes occurs when insulin levels are insufficient or when the body responds poorly to the insulin produced (insulin resistance). The goal of diabetes treatment is to regulate blood glucose to a healthy level. It is diagnosed and monitored by measuring the amount of glucose present in the patient’s bloodstream. Poorly regulated glucose levels can lead to major complications such as heart disease, vision loss, and kidney disease.
Diabetes falls predominantly under two types.Footnote i Type 1 diabetes is an autoimmune condition where the immune system destroys the insulin-producing cells found in the pancreas which can no longer produce sufficient insulin. It is usually diagnosed in childhood. There is no known cure and daily insulin injections are currently the only treatment option. In type 2 diabetes, the body is either unable to process insulin effectively or the pancreas does not produce enough insulin. It is considered preventable given its strong link to lifestyle risk factors (diet, activity, smoking), but there are other non-modifiable risk factors at play such as genetic predisposition and ethnicity. It is a condition that develops gradually over time and is primarily diagnosed in adults. However, recent years have seen an increase of the disease in adolescents and children, although they remain a very small proportion of overall cases.
Drug treatment for type 2 diabetes can be complex with many non-insulin drug options (see Figure 1.1 and Methods section for a detailed list). These may be prescribed as monotherapy or as various combination drug regimens. Metformin is generally considered the first-line choice for people with type 2 diabetes because of its safety, low cost, and possible heart benefits.Footnote 2 If optimal glucose levels are not reached, and prior to introducing insulin, a variety of second-line therapies are considered. Of these possible second-line therapies, the DPP-4’s, GLP-1’s, and SGLT-2’s are relatively recent additions (see Section 2) and are referred to as “new-generation/non-insulin” drugs throughout this report. Drug treatments are tailored according to each patient’s unique circumstances considering overall health, age, severity of disease, as well as the presence of co-morbidities such as heart disease and kidney function. In addition, the management of the overall drug load for patients with multiple chronic conditions presents unique challenges related to possible drug interactions and treatment adherence. This affects the dosing schedule and the choice of oral versus injectable forms. Only insulins and most GLP-1’s are injectable drugs. The remainder of antidiabetic drugs are oral solids. Semaglutide is the only GLP-1 sold as both an injectable (Ozempic) and an oral option (Rybelsus).
1.2 Diabetes prevalence and incidence
The Public Health Agency of Canada (PHAC) estimates that 8.9% of Canadians have been diagnosed with diabetes (over 3 million Canadians). Type 2 diabetes accounts for most cases (90%) followed by type 1 diabetes (9%) and gestational diabetes (1%). In addition, it estimates that 6.1% of adults (age 20 to 79) have prediabetes. PHAC provides data on incidence and prevalence of diabetes through the Canadian Chronic Disease Surveillance System (CCDSS). The data reported are for type 1 and type 2 diabetes combined and exclude gestational diabetes. As shown in Figure 1.2, diabetes prevalence has been steadily increasing over the past decades despite a slight drop in incidence. These trends may appear contradictory; however, improved treatment can increase survival, thus increasing the number of individuals living with diabetes in a given year.
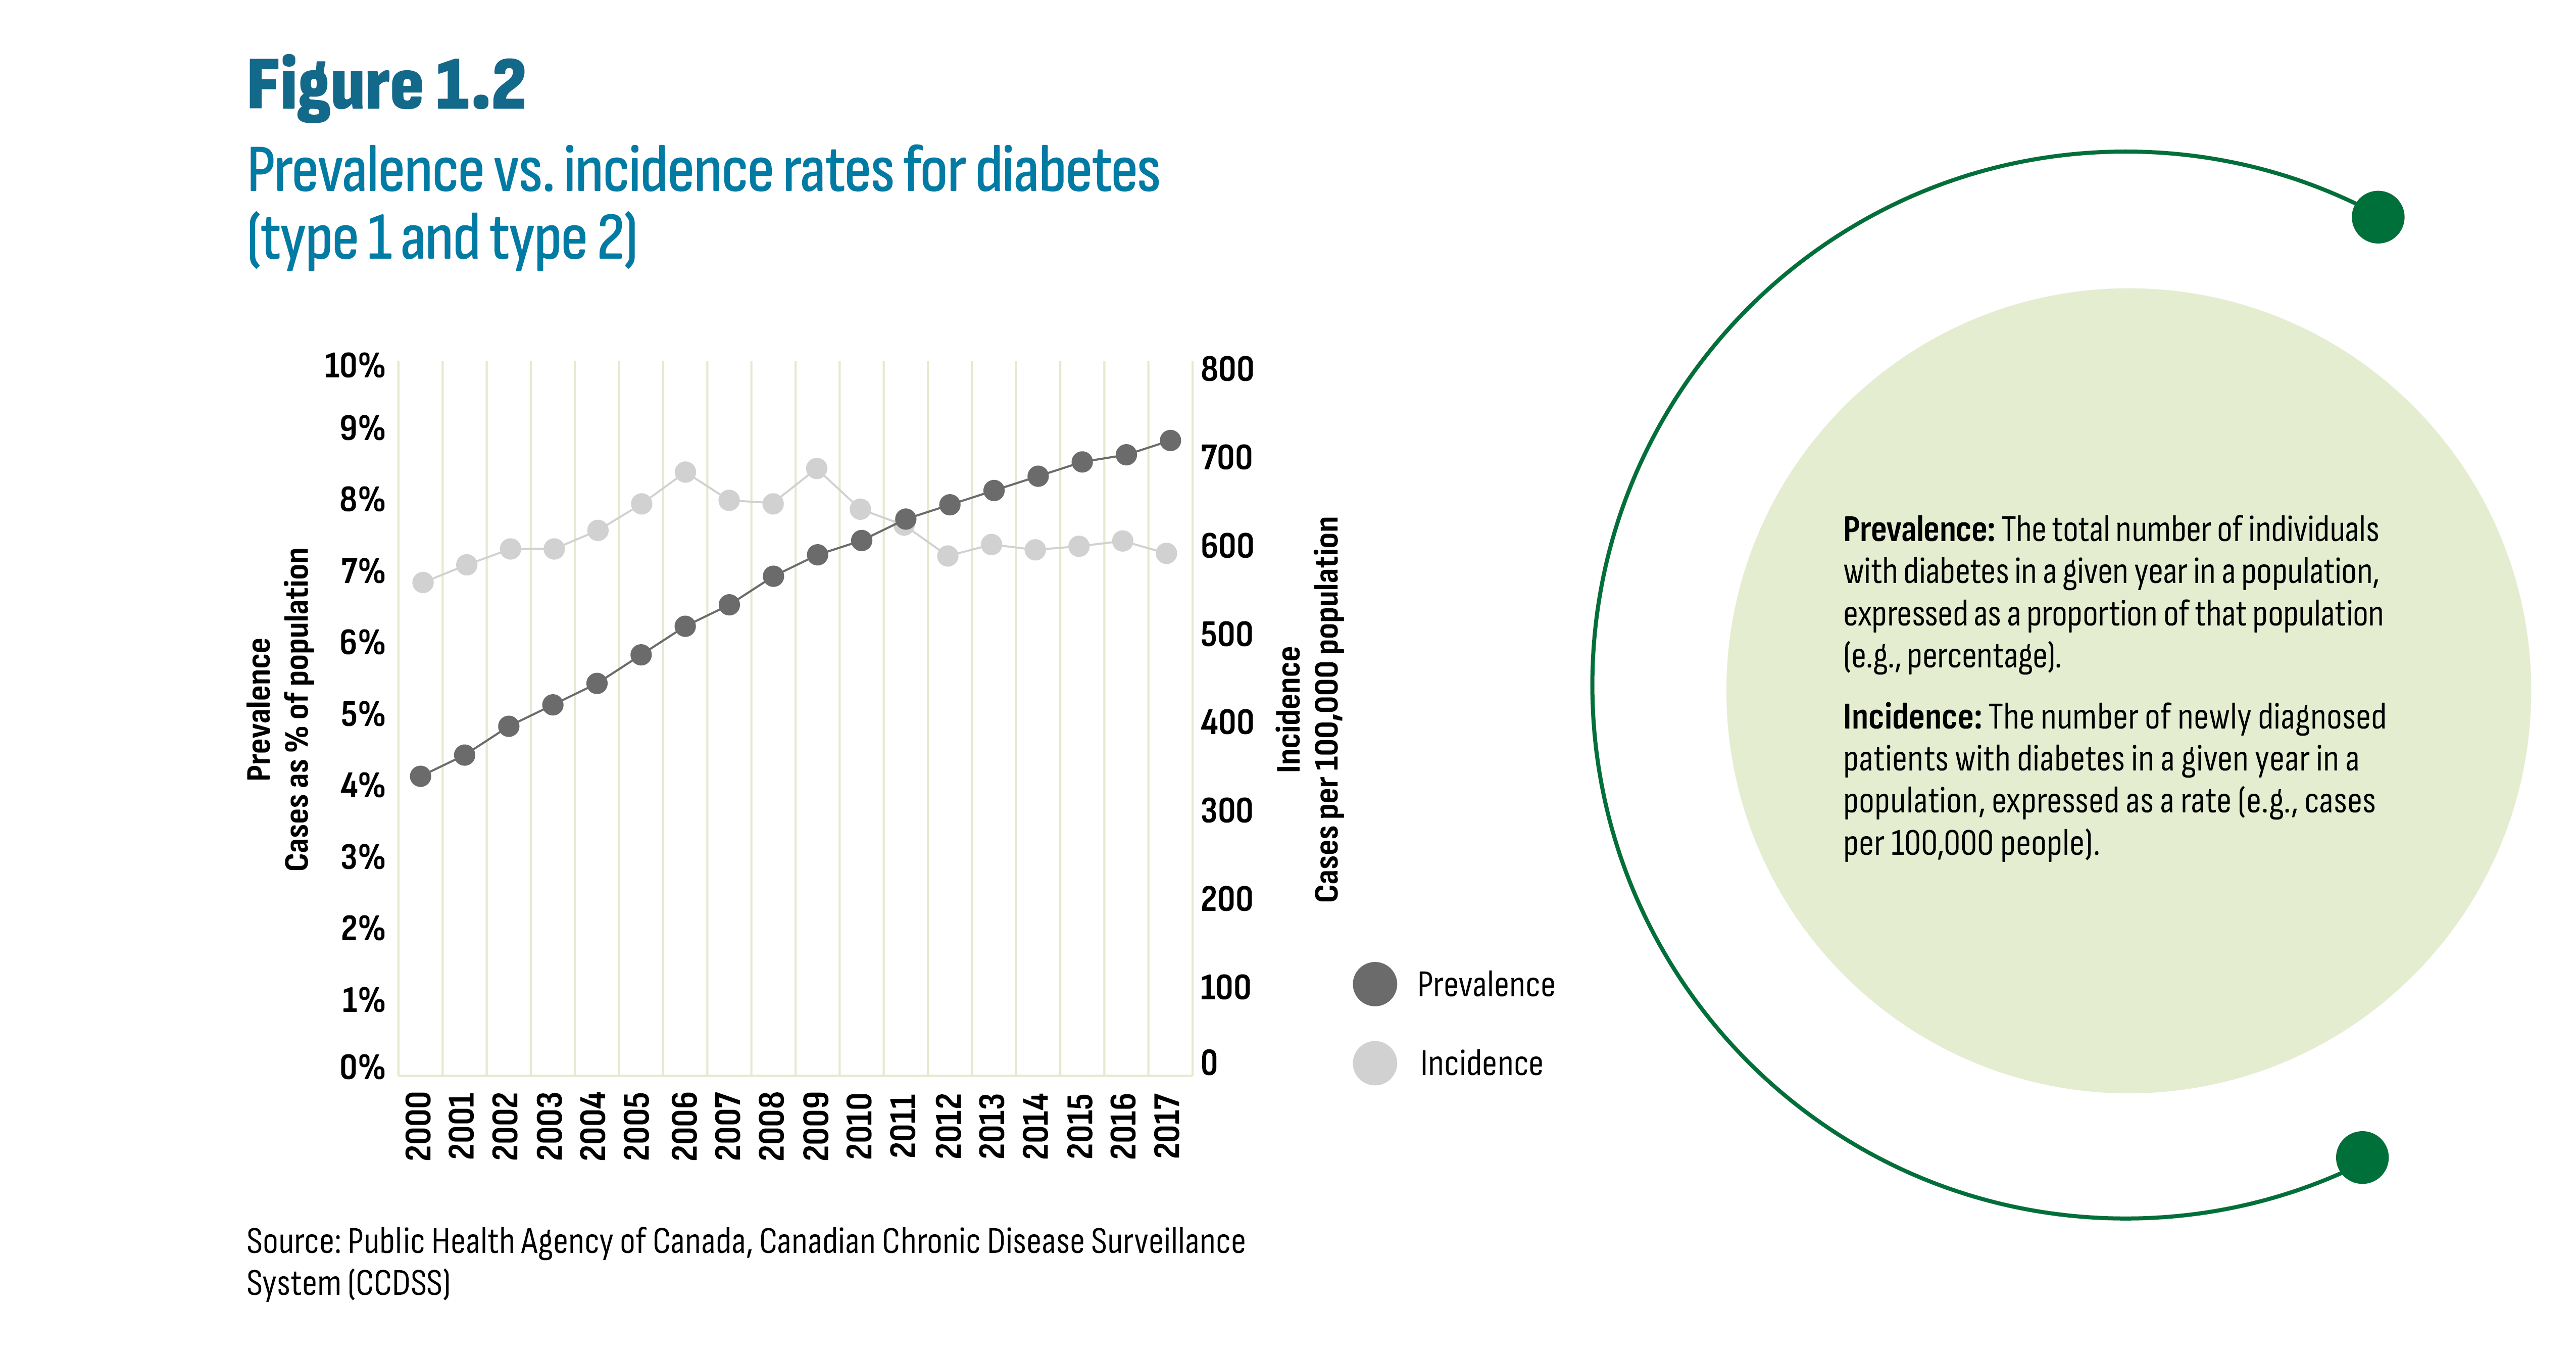
Figure description
This line graph shows the trend in diabetes prevalence and diabetes incidence from 2000 to 2017.
| Year | Prevalence (cases as percentage of population) | Incidence (cases per 100,000 population) |
|---|---|---|
2000 |
4% |
554 |
2001 |
5% |
574 |
2002 |
5% |
592 |
2003 |
5% |
581 |
2004 |
6% |
613 |
2005 |
6% |
643 |
2006 |
6% |
679 |
2007 |
7% |
647 |
2008 |
7% |
644 |
2009 |
7% |
683 |
2010 |
8% |
637 |
2011 |
8% |
619 |
2012 |
8% |
584 |
2013 |
8% |
597 |
2014 |
8% |
591 |
2015 |
9% |
595 |
2016 |
9% |
601 |
2017 |
9% |
587 |
Source: Public Health Agency of Canada, Canadian Chronic Disease Surveillance System (CCDSS)
Prevalence: The total number of individuals with diabetes in a given year in a population, expressed as a proportion of that population (e.g., percentage).
Incidence: The number of newly diagnosed patients with diabetes in a given year in a population, expressed as a rate (e.g., cases per 100,000 people).
The prevalence of diabetes (type 1 and type 2 combined) increases with age with higher rates for males compared to females (see Figure 1.3). While it is also documented that the prevalence varies by ethnicity and socio-economic factors, current drug plan information systems are not designed for reporting these patient characteristics.
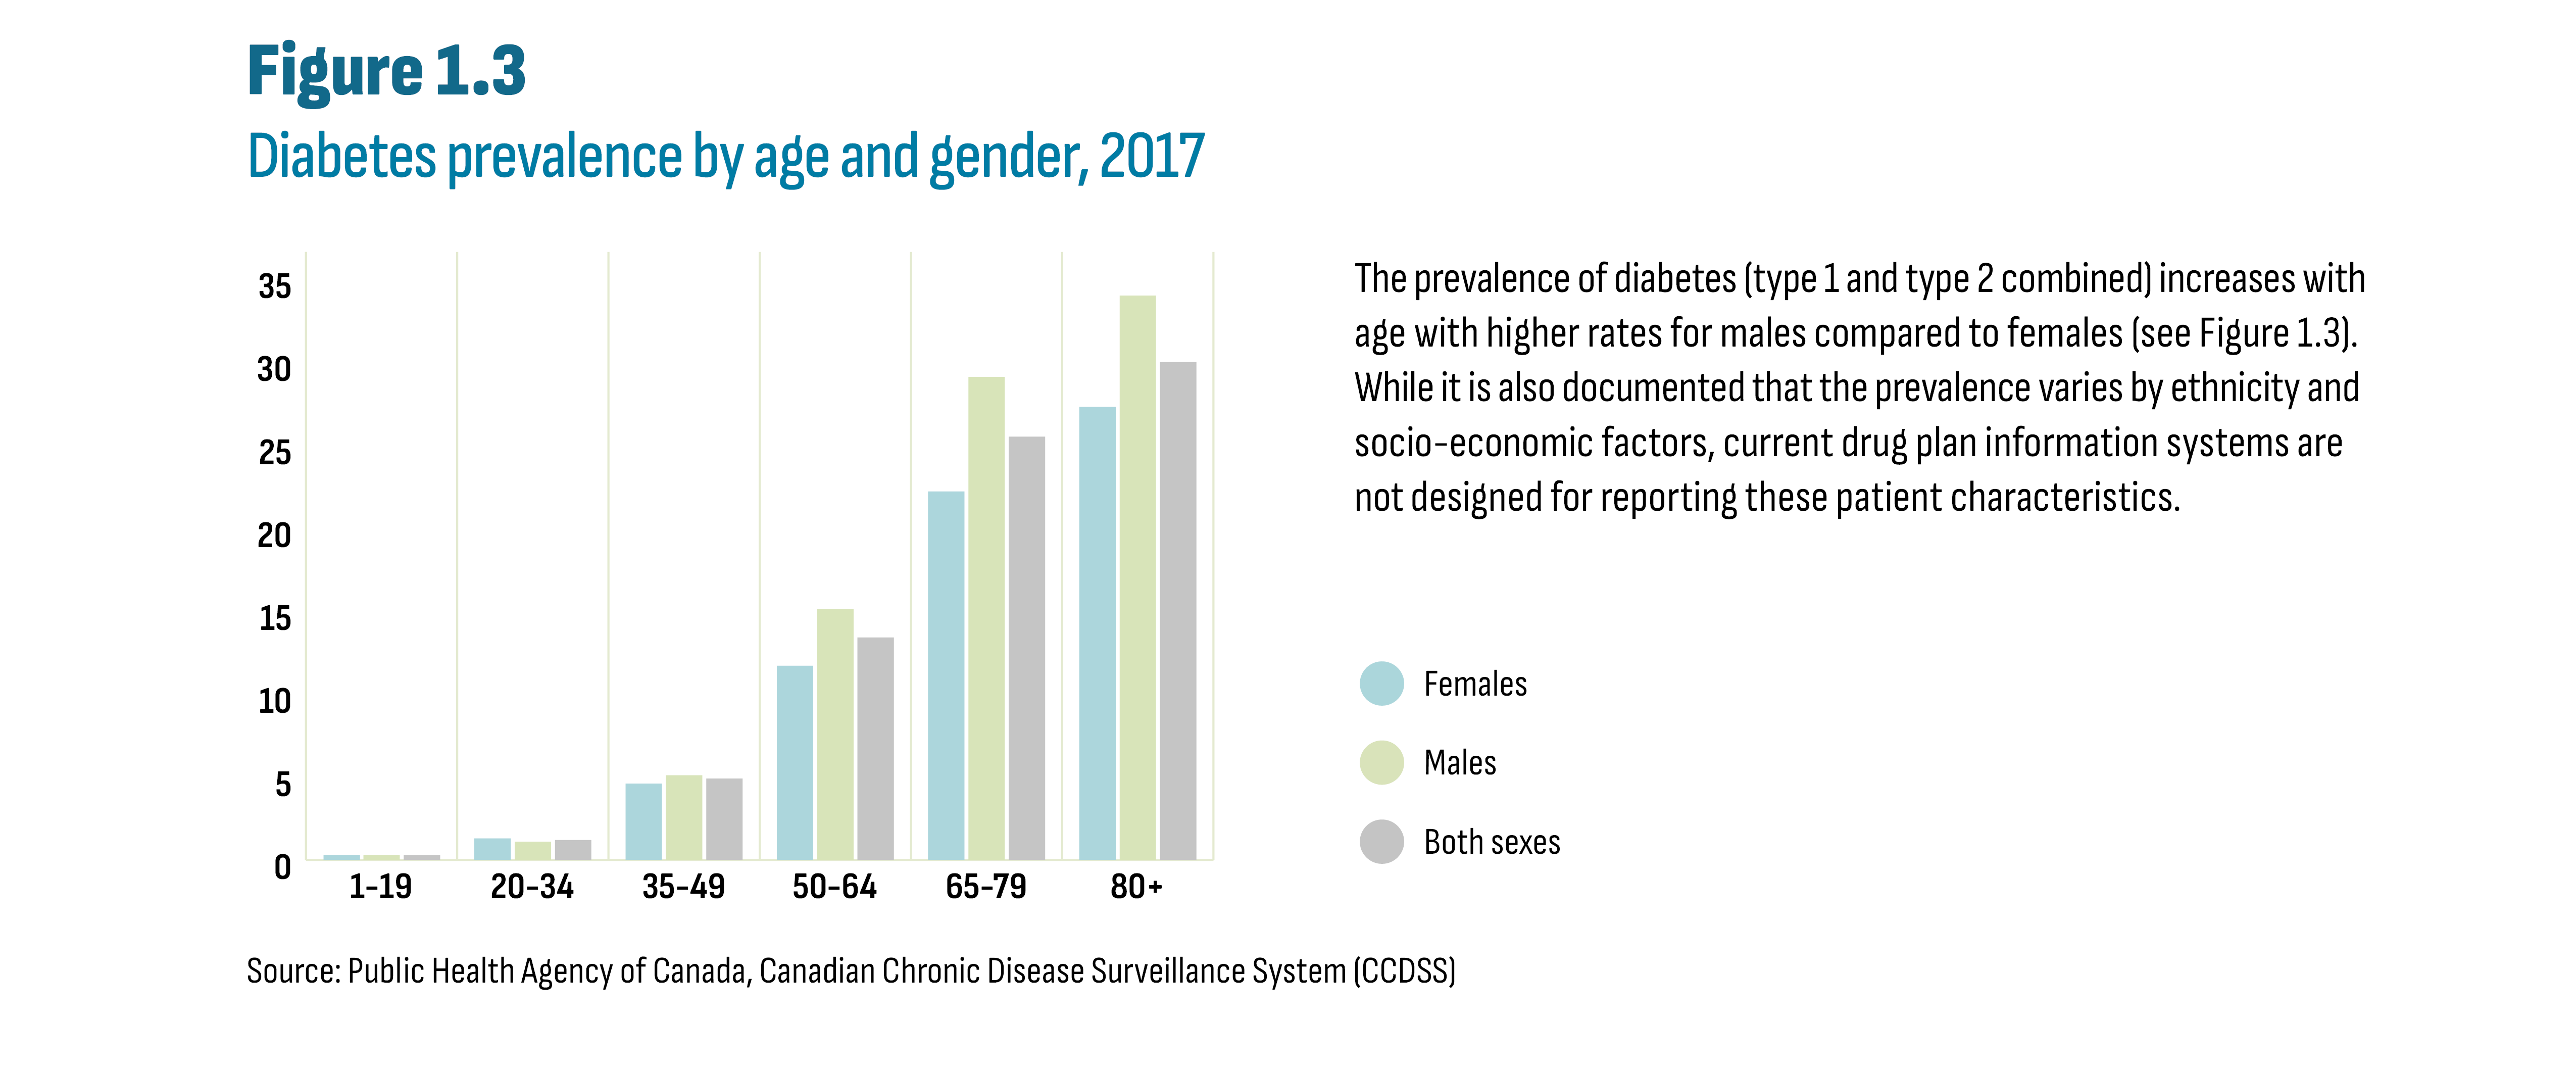
Figure description
This column graph shows diabetes prevalence by age group and gender in 2017.
Age group |
Both sexes |
Females |
Males |
1-19 |
0.3% |
0.3% |
0.3% |
20-34 |
1.2% |
1.3% |
1.1% |
35-49 |
4.9% |
4.6% |
5.1% |
50-64 |
13.4% |
11.7% |
15.1% |
65-79 |
25.5% |
22.2% |
29.1% |
80+ |
30.0% |
27.3% |
34.0% |
Source: Public Health Agency of Canada, Canadian Chronic Disease Surveillance System (CCDSS)
2. International Market Overview
This section situates new antidiabetic drugs within the Canadian regulatory and reimbursement landscape, beginning with the launch of the first new-generation/non-insulin drug sitagliptin (Januvia) in late 2007. The section begins with a timeline outlining the entry of the first brand of each drug. This is followed by an overview of the PMPRB’s classification of these drugs. The section ends with highlights of the advice from economic assessments and provincial negotiations and listing decisions.
The text box Canadian Regulatory and Reimbursement Organizations describes the organizations involved in making drugs accessible to Canadians. Appendix B provides details on the decisions and advice by these organizations for all the drugs selected for this report.
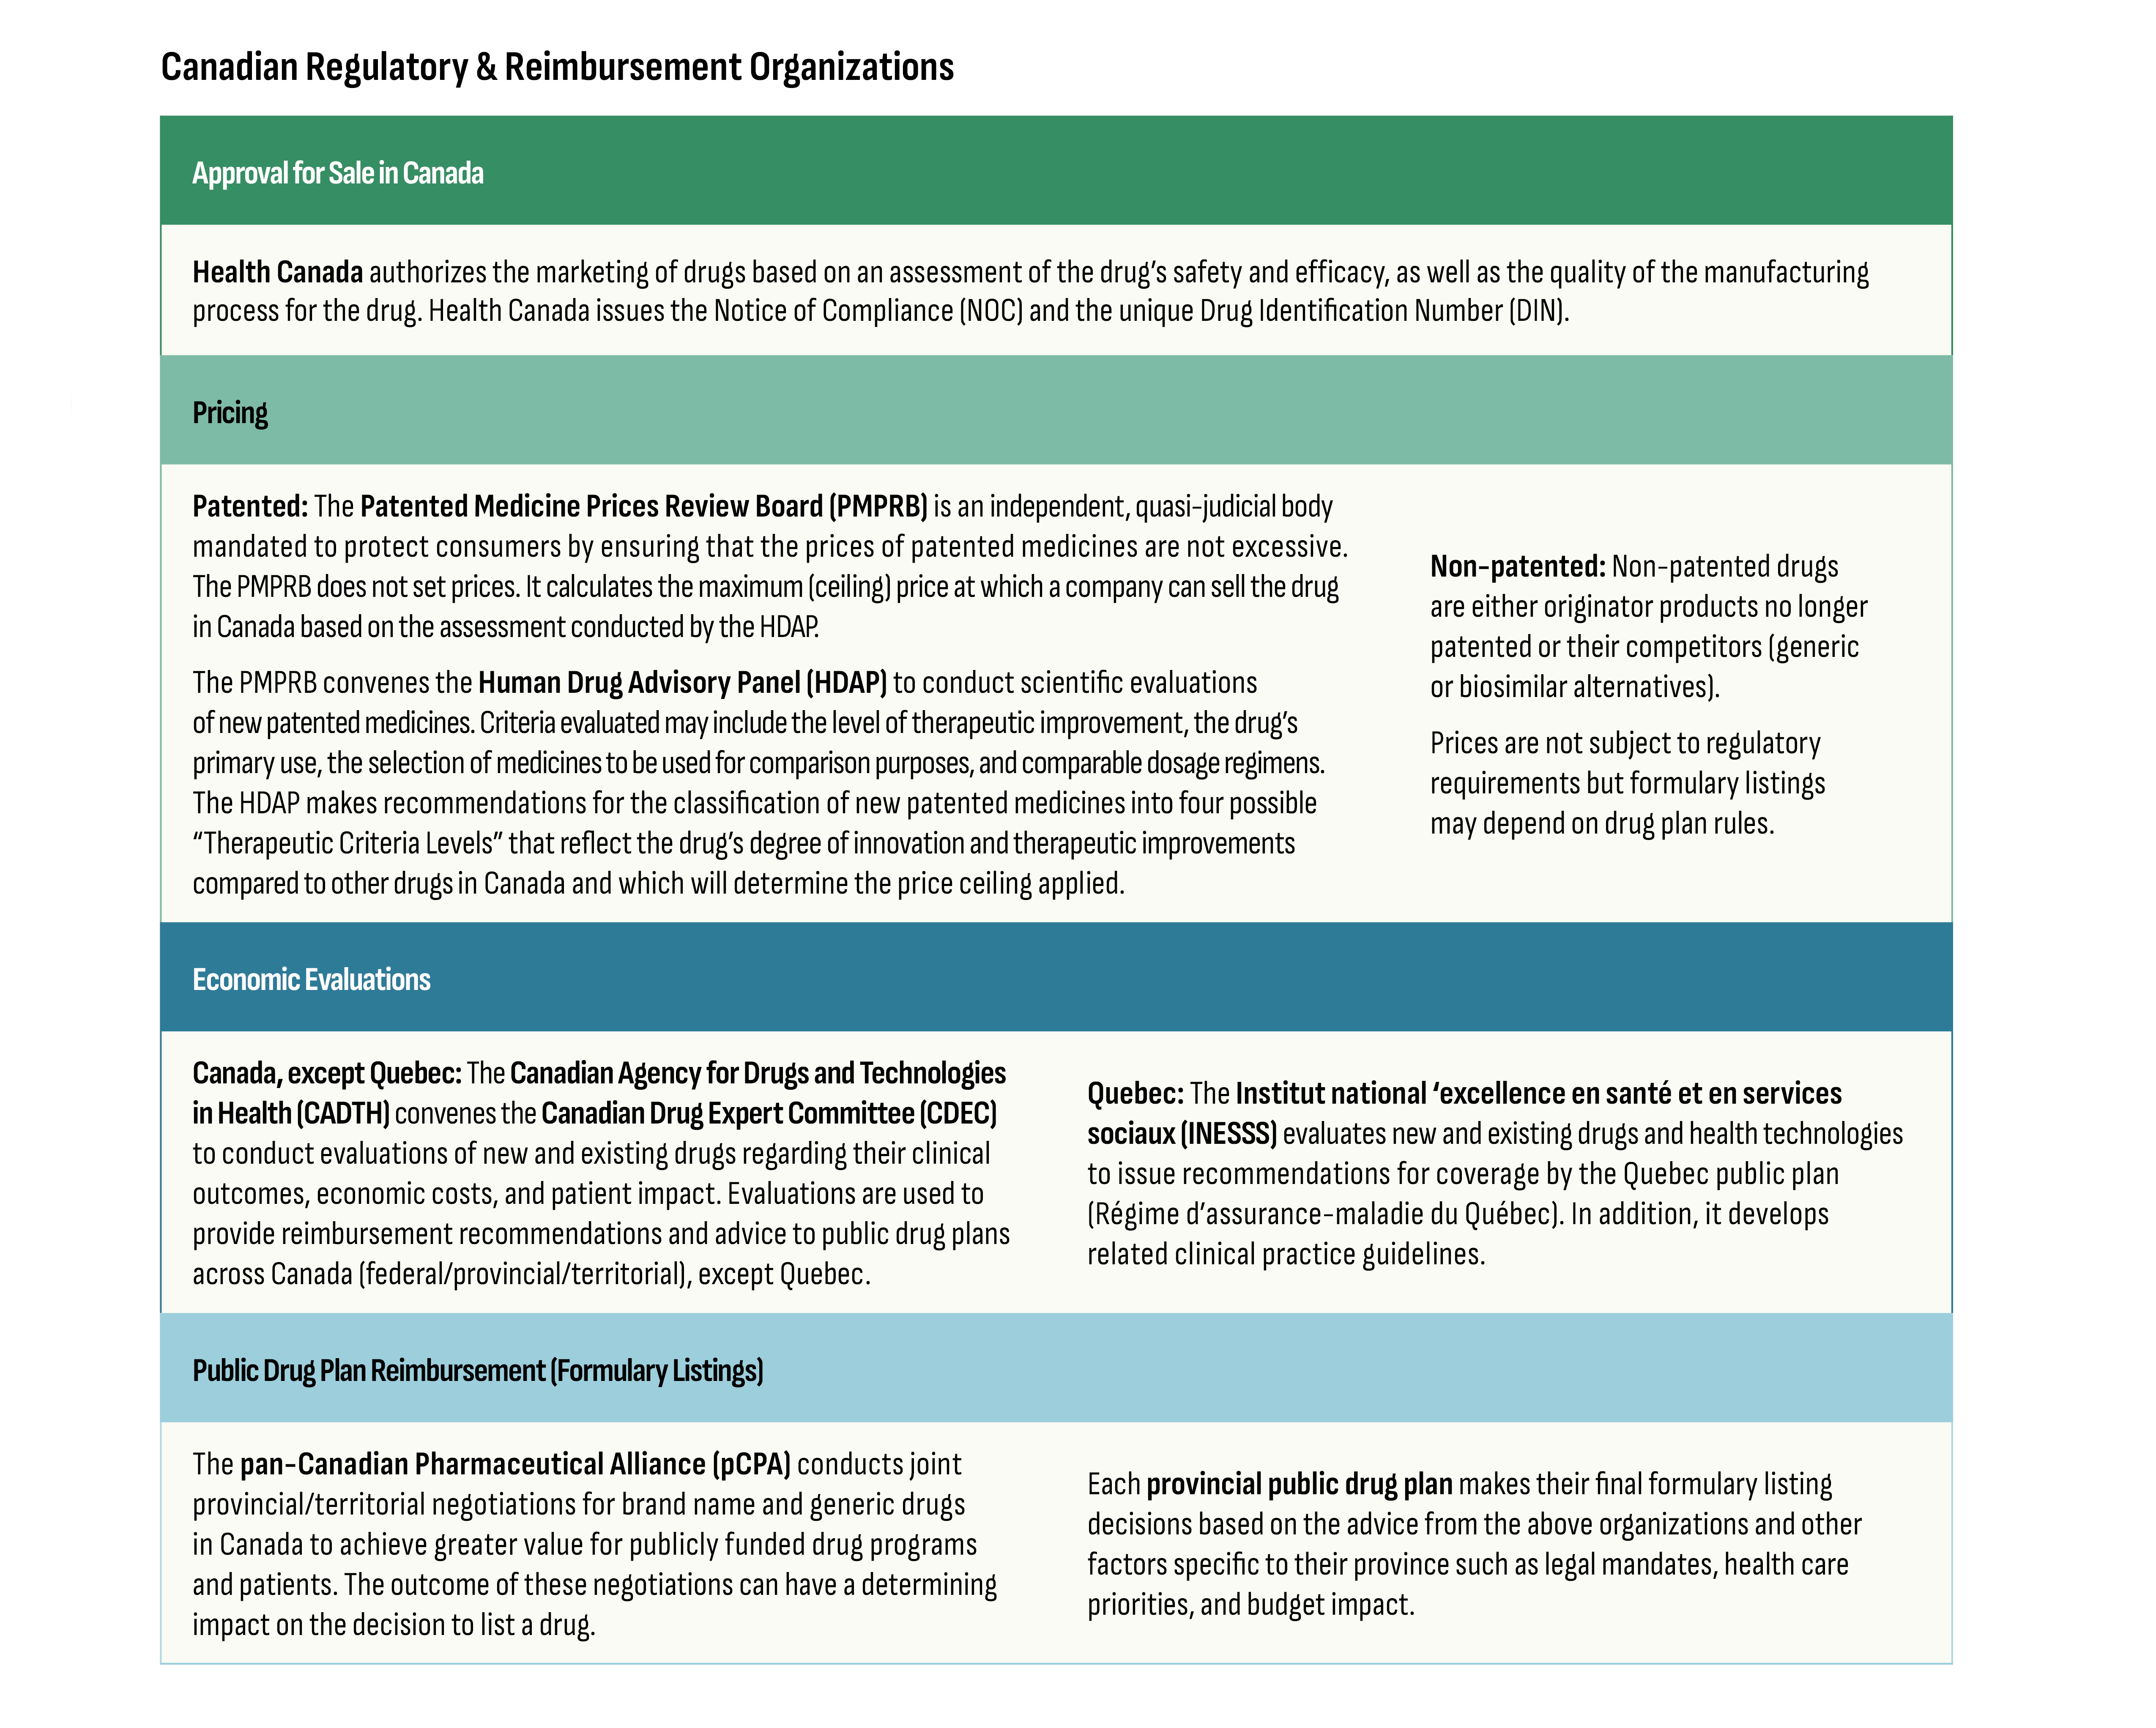
Figure description
Approval for Sale in Canada
Health Canada authorizes the marketing of drugs based on an assessment of the drug’s safety and efficacy, as well as the quality of the manufacturing process for the drug. Health Canada issues the Notice of Compliance (NOC) and the unique Drug Identification Number (DIN).
Pricing
Patented: The Patented Medicine Prices Review Board (PMPRB) is an independent, quasi-judicial body mandated to protect consumers by ensuring that the prices of patented medicines are not excessive.The PMPRB does not set prices. It calculates the maximum (ceiling) price at which a company can sell the drug in Canada based on the assessment conducted by the HDAP.
The PMPRB convenes the Human Drug Advisory Panel (HDAP) to conduct scientific evaluationsof new patented medicines. Criteria evaluated may include the level of therapeutic improvement, the drug’s primary use, the selection of medicines to be used for comparison purposes, and comparable dosage regimens.The HDAP makes recommendations for the classification of new patented medicines into four possible“Therapeutic Criteria Levels” that reflect the drug’s degree of innovation and therapeutic improvements compared to other drugs in Canada and which will determine the price ceiling applied.
Non-patented: Non-patented drugs are either originator products no longer patented or their competitors (generic or biosimilar alternatives).
Prices are not subject to regulatory requirements but formulary listings may depend on drug plan rules.
Economic Evaluations
Canada, except Quebec: The Canadian Agency for Drugs and Technologies in Health (CADTH) convenes the Canadian Drug Expert Committee (CDEC) to conduct evaluations of new and existing drugs regarding their clinical outcomes, economic costs, and patient impact. Evaluations are used to provide reimbursement recommendations and advice to public drug plans across Canada (federal/provincial/territorial), except Quebec.
Quebec: The Institut national ‘excellence en santé et en services sociaux (INESSS) evaluates new and existing drugs and health technologies to issue recommendations for coverage by the Quebec public plan(Régime d’assurance-maladie du Québec). In addition, it develops related clinical practice guidelines.
Public Drug Plan Reimbursement (Formulary Listings)
The pan-Canadian Pharmaceutical Alliance (pCPA) conducts joint provincial/territorial negotiations for brand name and generic drugsin Canada to achieve greater value for publicly funded drug programs and patients. The outcome of these negotiations can have a determining impact on the decision to list a drug.
Each provincial public drug plan makes their final formulary listing decisions based on the advice from the above organizations and other factors specific to their province such as legal mandates, health care priorities, and budget impact.
Figure 2.1 illustrates the timeline of the allocation of the first Notice of Compliance (NOC) by Health Canada for each new antidiabetic drug, beginning in 2007 with sitagliptin (Januvia), the first DPP-4. For simplicity, only brand names are provided in the figure. While all drugs shown in Figure 2.1 are indicated for diabetes, some acquired indications for other conditions or may be used off-label. The figure indicates instances where utilization may be significantly impacted and attributable to indications other than diabetes. Finally, except for insulin degludec (Tresiba), all drugs shown in Figure 2.1 are currently patented medicines.Footnote ii
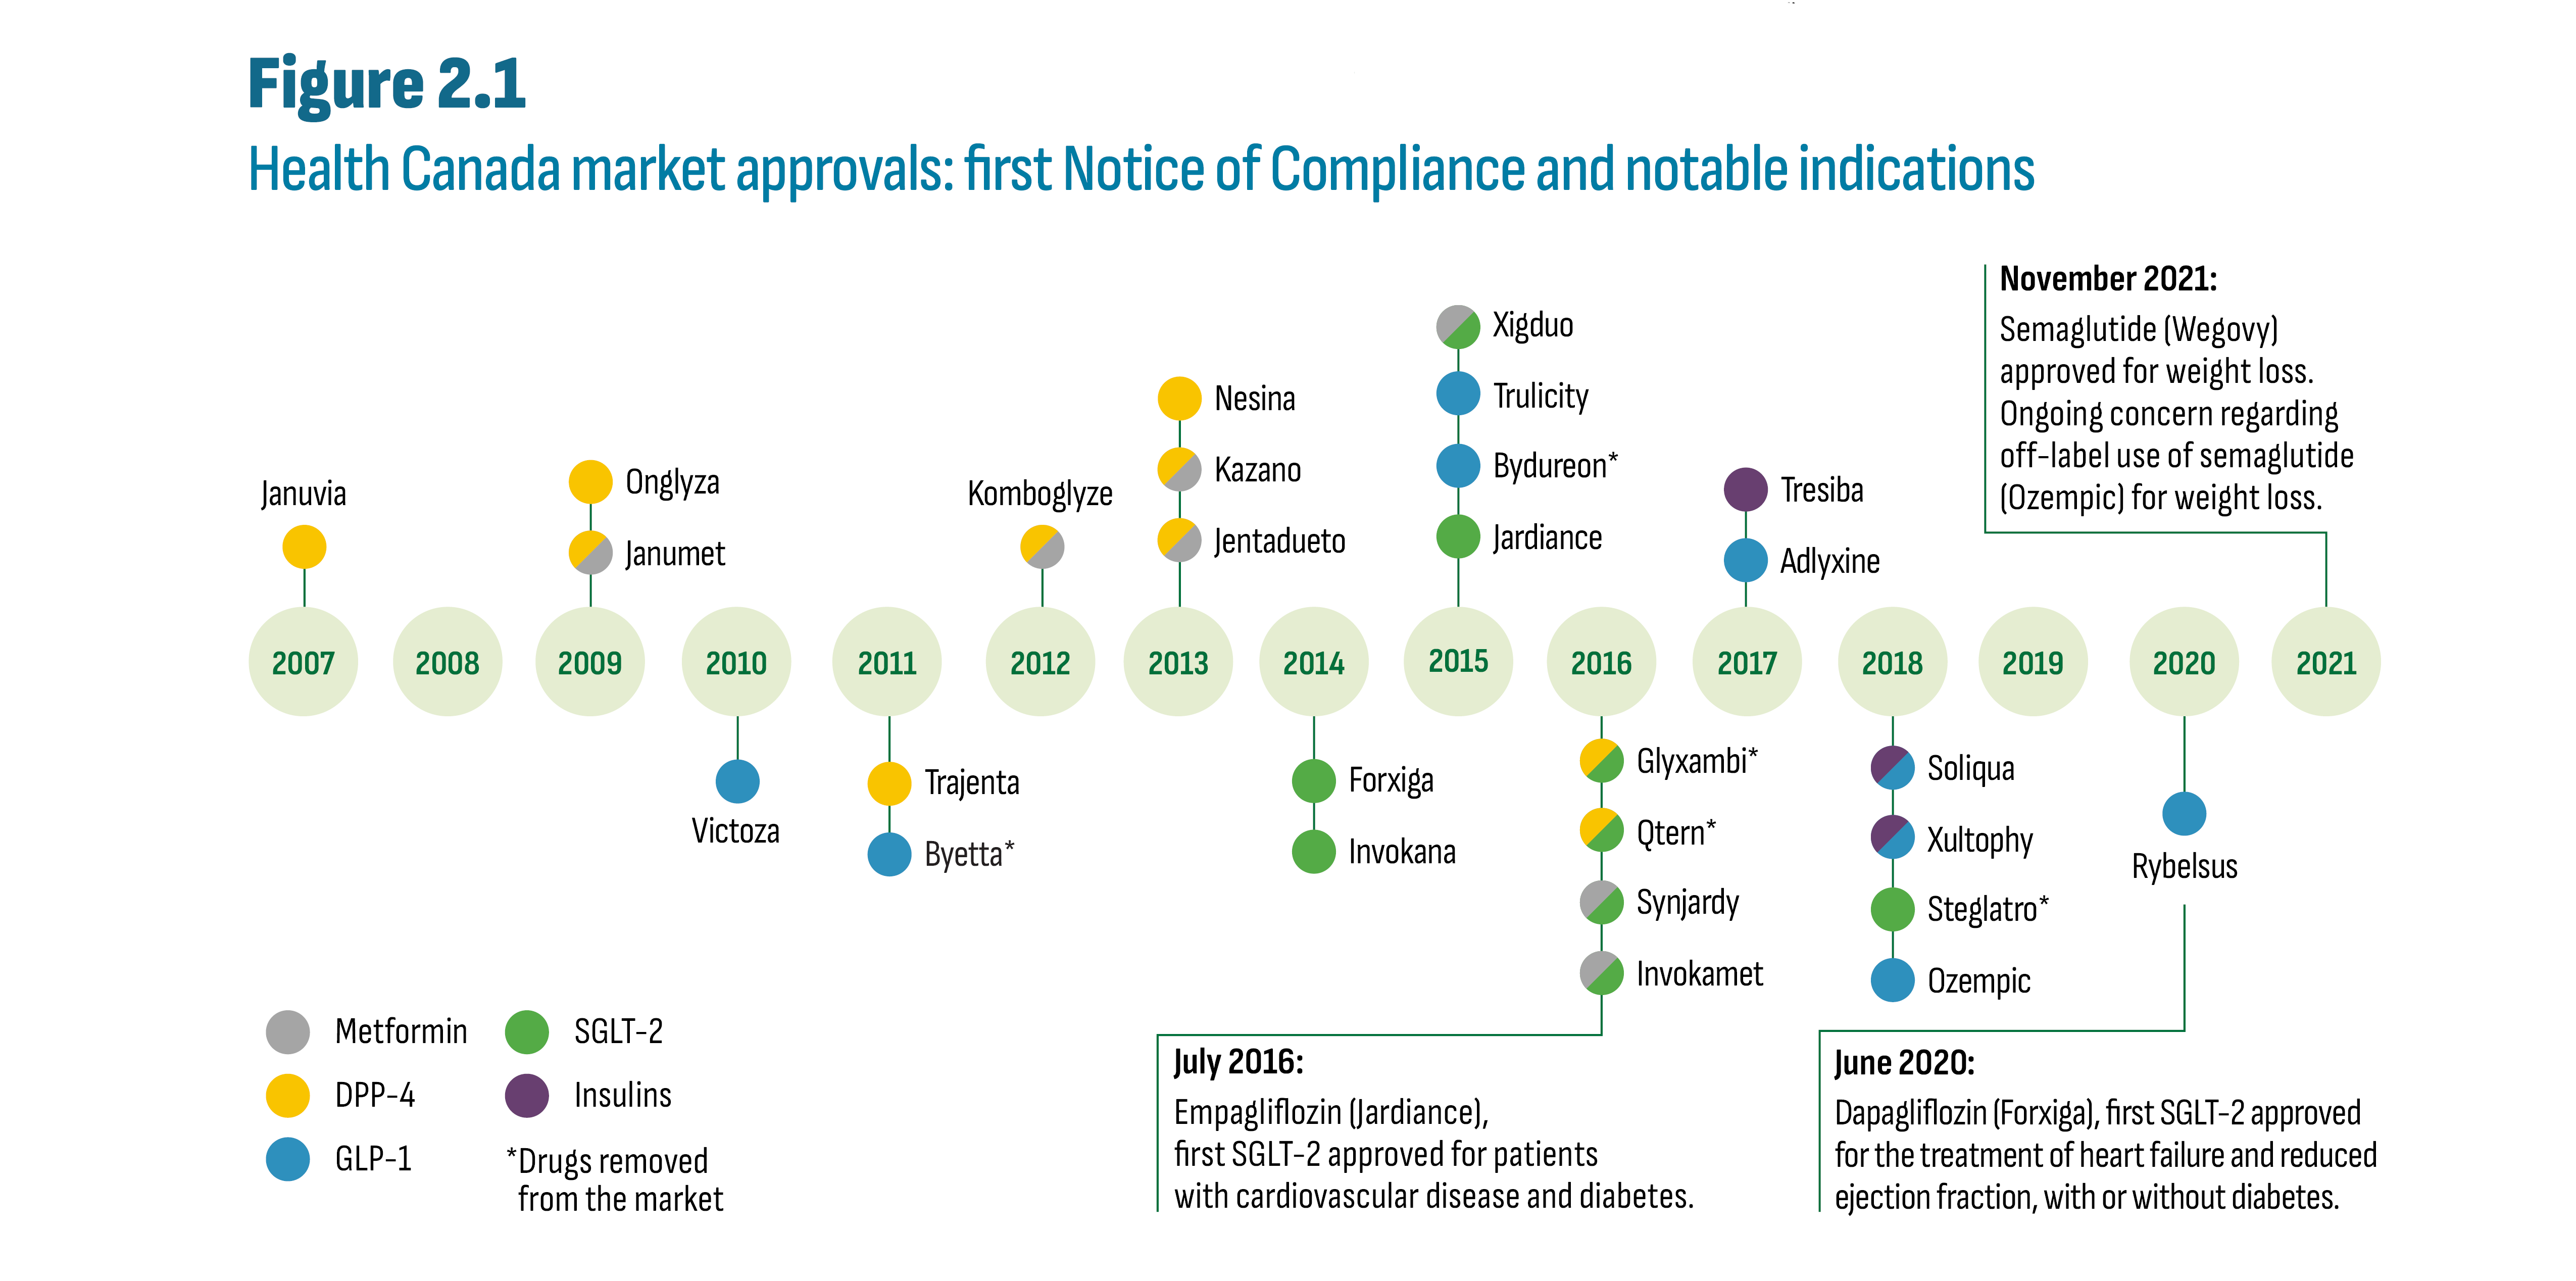
Figure description
This figure shows the timeline of the granting of NOC for the first brand of each antidiabetic drug launched since 2007. Also shown are three notable new indications for three drugs as follows:
- July 2016: Empagliflozin (Jardiance), first SGLT-2 approved for patients with cardiovascular disease and diabetes.
- June 2020: Dapagliflozin (Forxiga), first SGLT-2 approved for the treatment of heart failure and reduced ejection fraction, with or without diabetes.
- November 2021: Semaglutide (Wegovy) approved for weight loss. Ongoing concern regarding off label use of semaglutide (Ozempic) for weight loss.
| Drug name | Chemical name(s) | Drug class | NOC date | Status |
|---|---|---|---|---|
Rybelsus |
Semaglutide |
GLP-1 |
30-Mar-20 |
Marketed |
Soliqua |
Insulin Glargine, Lixisenatide |
GLP-1/Insulin |
06-Jul-18 |
Marketed |
Xultophy |
Insulin Degludec, Liraglutide |
GLP-1/Insulin |
11-Apr-18 |
Marketed |
Steglatro |
Ertugliflozin |
SGLT-2 |
09-May-18 |
Cancelled Post-Market |
Ozempic |
Semaglutide |
GLP-1 |
04-Jan-18 |
Marketed |
Tresiba |
Insulin Degludec |
Insulin |
25-Aug-17 |
Marketed |
Adlyxine |
Lixisenatide |
GLP-1 |
25-May-17 |
Marketed |
Glyxambi |
Empagliflozin, Linagliptin |
SGLT-2/DPP-4 |
15-Dec-16 |
Cancelled Post-Market |
Synjardy |
Empagliflozin, Metformin |
SGLT-2/metformin |
29-Jul-16 |
Marketed |
Qtern |
Dapagliflozin, Saxagliptin |
SGLT-2/DPP-4 |
22-Nov-16 |
Cancelled Pre-Market |
Invokamet |
Canagliflozin, Metformin |
SGLT-2/metformin |
01-Jun-16 |
Marketed |
Xigduo |
Dapagliflozin, Metformin |
SGLT-2/metformin |
10-Dec-15 |
Marketed |
Trulicity |
Dulaglutide |
GLP-1 |
10-Nov-15 |
Marketed |
Bydureon |
Exenatide |
GLP-1 |
30-Oct-15 |
Cancelled Post-Market |
Jardiance |
Empagliflozin |
SGLT-2 |
23-Jul-15 |
Marketed |
Forxiga |
Dapagliflozin |
SGLT-2 |
12-Dec-14 |
Marketed |
Invokana |
Canagliflozin |
SGLT-2 |
23-May-14 |
Marketed |
Kazano |
Alogliptin, Metformin |
DPP-4/metformin |
27-Nov-13 |
Marketed |
Nesina |
Alogliptin |
DPP-4 |
27-Nov-13 |
Marketed |
Jentadueto |
Linagliptin, Metformin |
DPP-4/metformin |
07-Mar-13 |
Marketed |
Komboglyze |
Metformin, Saxagliptin |
DPP-4/metformin |
09-Jul-12 |
Marketed |
Trajenta |
Linagliptin |
DPP-4 |
28-Jul-11 |
Marketed |
Byetta |
Exenatide |
GLP-1 |
13-Jan-11 |
Cancelled Post-Market |
Victoza |
Liraglutide |
GLP-1 |
21-May-10 |
Marketed |
Janumet |
Metformin, Sitagliptin |
DPP-4/metformin |
24-Sep-09 |
Marketed |
Onglyza |
Saxagliptin |
DPP-4 |
14-Sep-09 |
Marketed |
Januvia |
Sitagliptin |
DPP-4 |
14-Dec-07 |
Marketed |
The PMPRB’s Human Drug Advisory Panel (HDAP) provides recommendations for the categorization of new products and the selection of comparable drug productsFootnote iii. Sitagliptin (Januvia) was not only the first DPP-4, but also the first new-generation/non-insulin product. It was classified as a Category 3 medicine (moderate, little or no therapeutic advantage) according to the guidelines in effect at the time. The HDAP compared Januvia to existing classes (α-glucosidase inhibitors, meglitinides, thiazolidinediones, and sulfonylureas) because there were no comparators within the same 4th level ATC class. Subsequent DPP-4’s and their metformin combinations received similar designations. Liraglutide (Victoza) was the first GLP-1 and was also classified as a Category 3 medicine. The HDAP recommended insulin glargine (Lantus) as the most appropriate comparator, stating that both would be prescribed similarly as second- or third-line therapy despite not sharing the same 4th level ATC class and despite the availability of DPP-4’s. Subsequent GLP-1 and insulin combinations and all SGLT-2’s (beginning with canagliflozin (Invokana) in 2014) were similarly classified as “slight or no therapeutic improvement” under the new (2010) guidelines. The HDAP included DPP-4’s and other oral agents as comparators in their evaluation of SGLT-2’s.
The initial review by the CADTH Canadian Drug Expert Committee (CDEC) of the first DPP-4 drugs (Januvia and Onglyza) resulted in a recommendation to provincial drugs plans to not list these drugs. By 2012, the beginning of the period analyzed in this report, the CDEC’s recommendation for all DPP-4’s was reimbursement with criteria (e.g., limited use). It then continued with this advice for all subsequent new-generation/non-insulin drugs including combination drugs with insulin (Soliqua, Xultophy) as well as insulin degludec (Tresiba). These reimbursement criteria consider failure on alternate therapies and contraindications (such as kidney function, heart-related risk factors, or inadequate blood glucose control on alternate drugs, typically metformin and/or sulfonylurea).Footnote 5
For the most part, provinces followed CADTH’s advice and listed DPP-4’s and SGLT-2’s with limited criteria, except for Ontario, which listed these drugs as open benefits. The two GLP-1’s, Adlyxine and Ozempic, were listed as full benefits in Ontario and with criteria in Alberta, Saskatchewan, and New Brunswick. No province listed Rybelsus. All provinces except British Columbia listed Tresiba as a full benefit. For the new combination GLP-1/ insulin drugs, no province listed Xultophy and Soliqua was listed as a full benefit in Ontario and with criteria in Saskatchewan.Footnote 6
3. Cost Drivers
Spending on antidiabetic drugs varies based on drug prices and utilization. Drug utilization, in turn, depends on factors discussed in Sections 1 and 2, such as drug options, drug access, and disease prevalence. Subsection 3.1 compares Canadian prices for a sample of top-selling antidiabetic drugs to the prices in the current PMPRB basket of 11 countries (PMPRB11), the former basket of 7 countries (PMPRB7), and across the OECD countries. Subsection 3.2 situates Canadian market trends among its international peers. Subsection 3.3 provides an extensive analysis of public (provincial) and private payers in Canada.
3.1 International price comparison
Top-selling drugs selected for price comparison
DPP-4
- Sitagliptin (Januvia/Janumet*)
- Linagliptin (Tradjenta/Jentadueto*)
SGLT-2
- Canagliflozin (Invokana)
- Empagliflozin (Jardiance)
GLP-1
- Semaglutide (Ozempic)
- Liraglutide (Victoza)
Insulin
- Insulin degludec (Tresiba)
* Janumet and Jentadueto are the related ingredient combinations with metformin.
International prices are compared by calculating the ratio of the foreign price divided by the Canadian priceFootnote iv. For each ratio, the Canadian price is set to one and the corresponding foreign prices are determined to be either higher than (above) or lower than (below) this level. The average price ratios are calculated using sales-weighted arithmetic means of price ratios obtained for the top-selling drugs in the DPP-4, SGLT-2, and GLP-1 subclasses. This ratio was also calculated for insulin degludec (Tresiba), the only new insulin product launched in Canada over the last decade. It is worth noting that insulin degludec was never subject to PMPRB reporting due its patent lapsing before receiving its NOC (see Section 2).
Figure 3.1 reports foreign-to-Canadian price ratios in 2021 for the PMPRB11 countries as well as Switzerland and the United States, which were part of the PMPRB7 list of comparator countries. The median for the PMPRB11, the PMPRB7, and OECD countries are provided at the bottom of each graph. The prices of the selected products in the PMPRB11 countries were 30% to 50% lower than the Canadian prices. Italy was most often second to Canada with ratios ranging from 0.59 for the DPP-4’s to 0.77 for the GLP-1’s and insulin degludec. The median PMPRB11-to-Canadian price ratio was 0.50 for DPP-4’s, 0.69 for SGLT-2’s, 0.61 for GLP-1’s, and 0.60 for insulin degludec. The OECD-to-Canadian price ratio followed a similar trend.
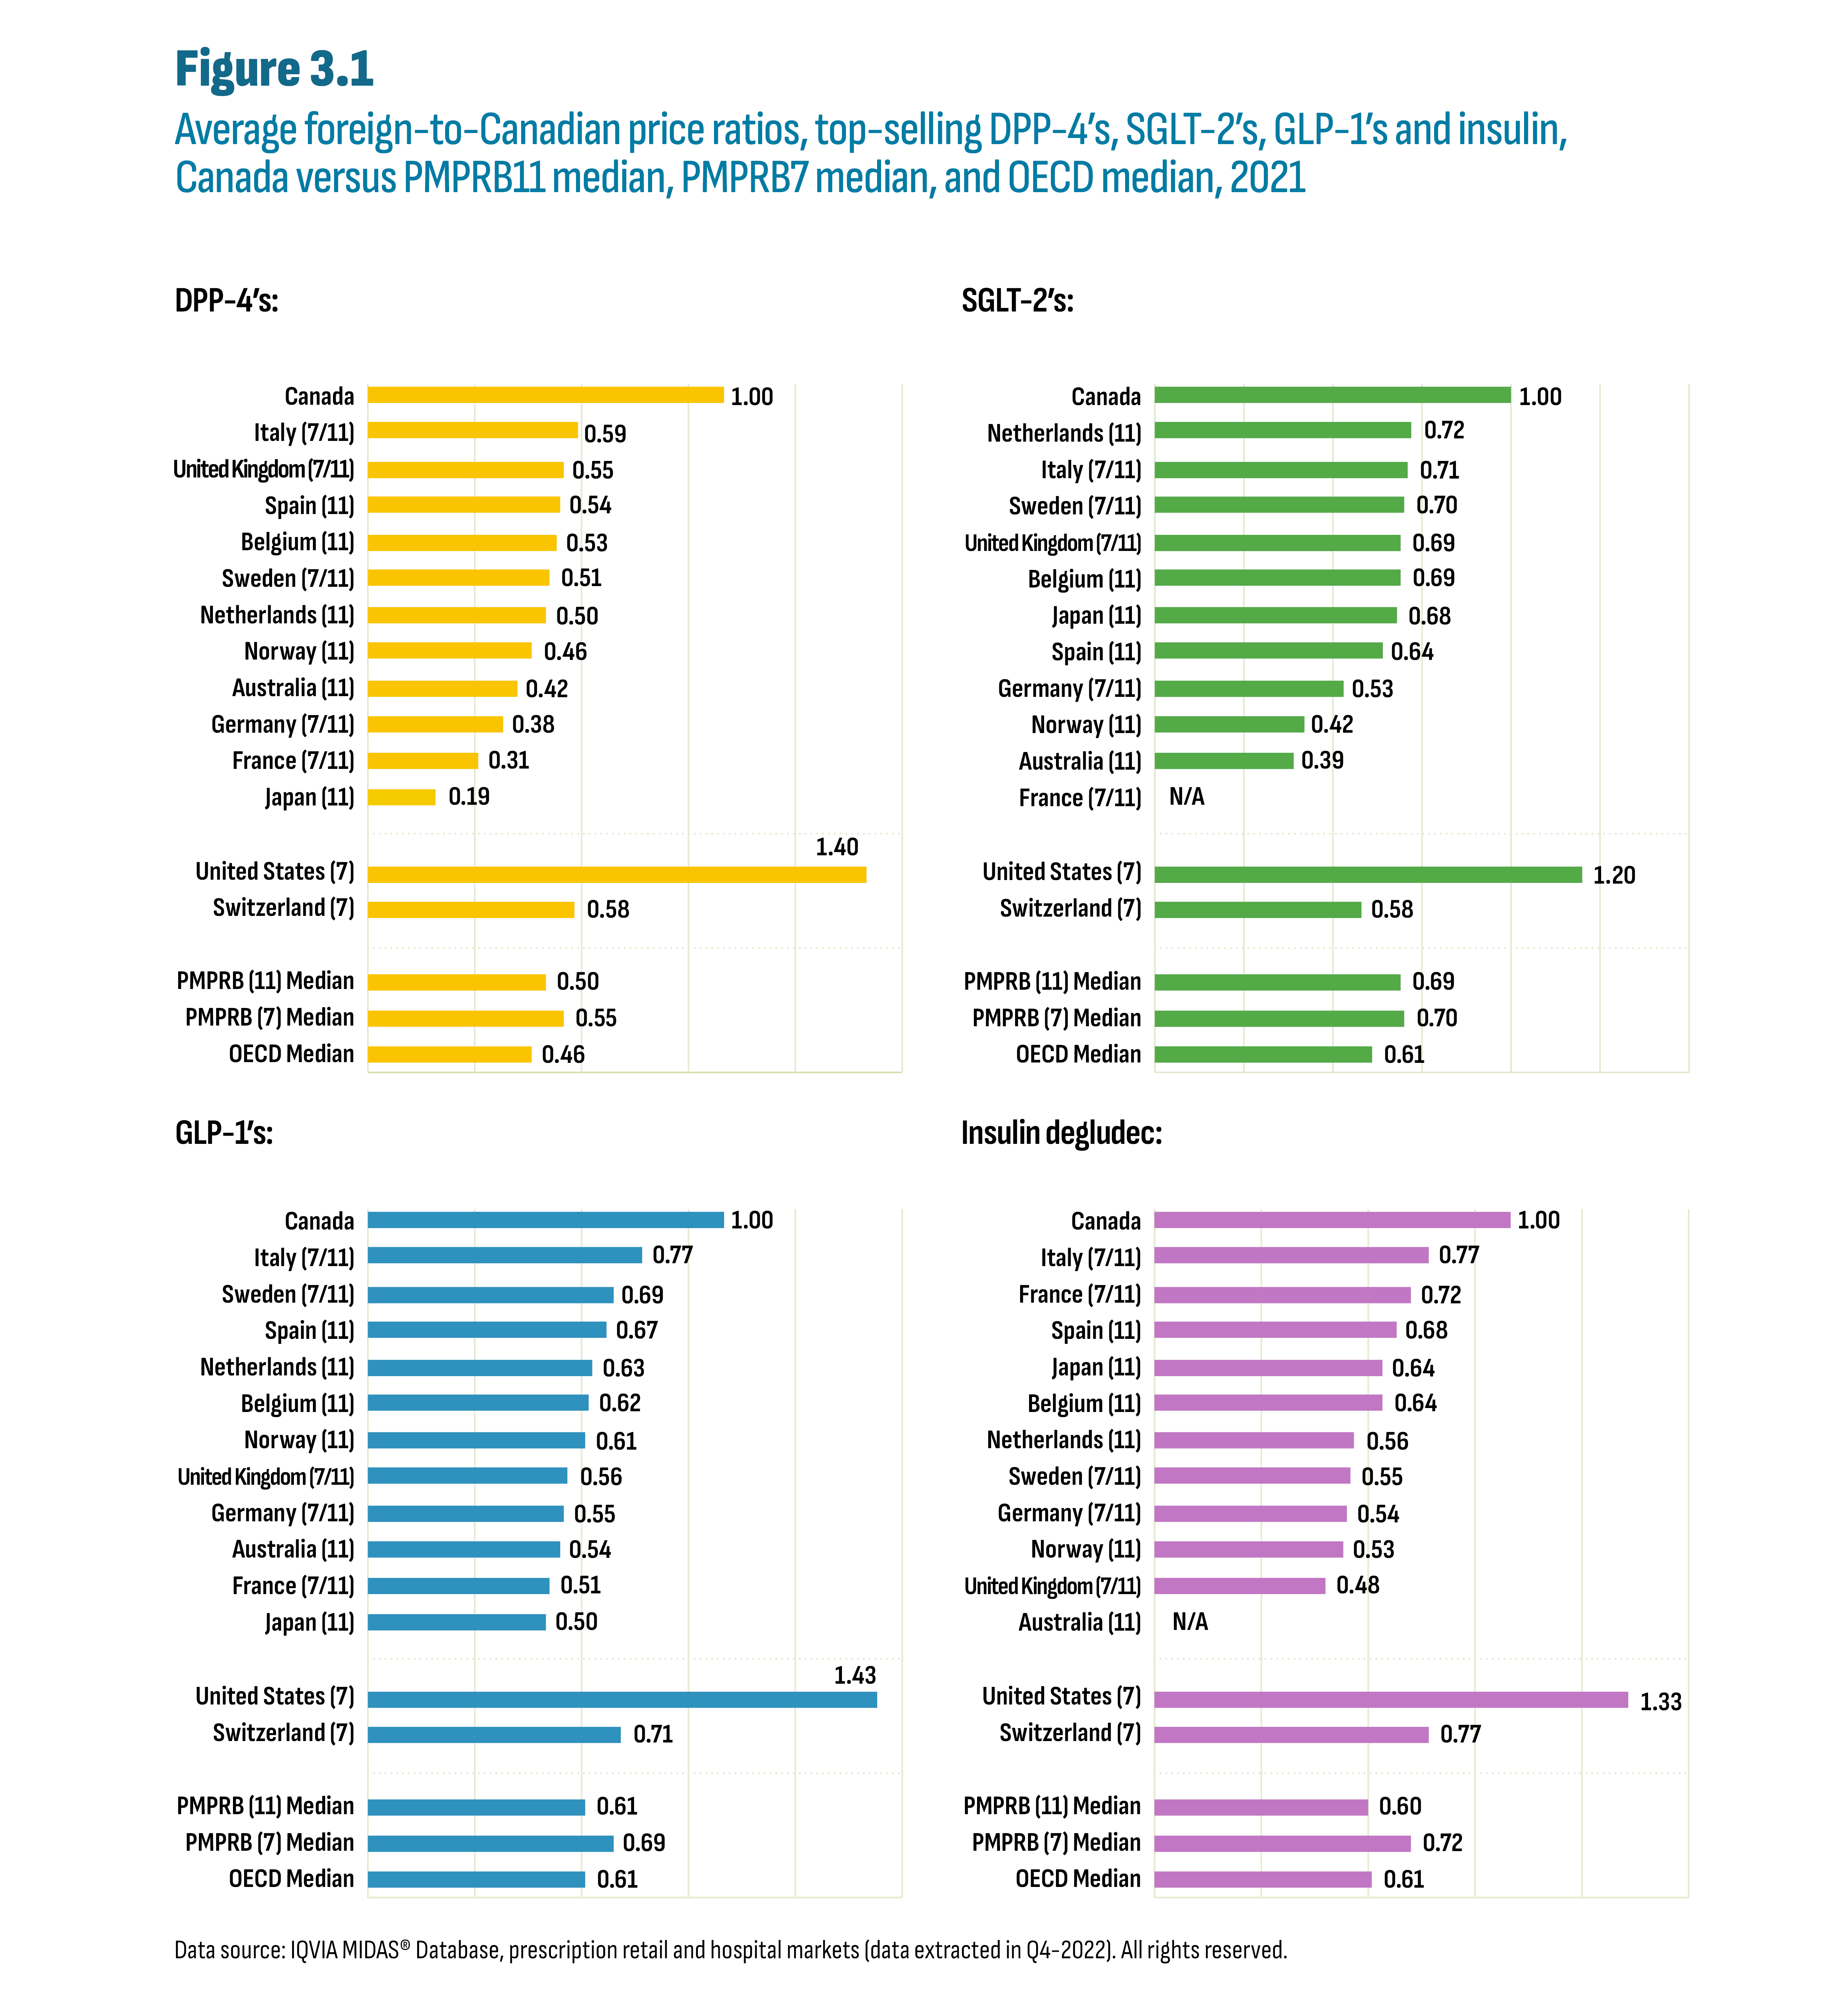
Figure description
This figure consists of four separate bar graphs showing the average foreign-to-Canadian price ratios for top-selling drugs by country. There is one bar graph for each drug class: DPP-4’s, SGLT-2’s, GLP-1’s and insulin degludec. The graphs also indicate whether each country was part of the PMPRB7 or PMPRB11 comparator countries, with 7 and/or 11 in parentheses.
| DPP-4’s | SGLT-2’s | GLP-1’s | Insulin degludec | ||||
|---|---|---|---|---|---|---|---|
Canada |
1.00 |
Canada |
1.00 |
Canada |
1.00 |
Canada |
1.00 |
Italy (7/11) |
0.59 |
Netherlands (11) |
0.72 |
Italy (7/11) |
0.77 |
Italy (7/11) |
0.77 |
United Kingdom (7/11) |
0.55 |
Italy (7/11) |
0.71 |
Sweden (7/11) |
0.69 |
France (7/11) |
0.72 |
Spain (11) |
0.54 |
Sweden (7/11) |
0.70 |
Spain (11) |
0.67 |
Spain (11) |
0.68 |
Belgium (11) |
0.53 |
United Kingdom (7/11) |
0.69 |
Netherlands (11) |
0.63 |
Japan (11) |
0.64 |
Sweden (7/11) |
0.51 |
Belgium (11) |
0.69 |
Belgium (11) |
0.62 |
Belgium (11) |
0.64 |
Netherlands (11) |
0.50 |
Japan (11) |
0.68 |
Norway (11) |
0.61 |
Netherlands (11) |
0.56 |
Norway (11) |
0.46 |
Spain (11) |
0.64 |
United Kingdom (7/11) |
0.56 |
Sweden (7/11) |
0.55 |
Australia (11) |
0.42 |
Germany (7/11) |
0.53 |
Germany (7/11) |
0.55 |
Germany (7/11) |
0.54 |
Germany (7/11) |
0.38 |
Norway (11) |
0.42 |
Australia (11) |
0.54 |
Norway (11) |
0.53 |
France (7/11) |
0.31 |
Australia (11) |
0.39 |
France (7/11) |
0.51 |
United Kingdom (7/11) |
0.48 |
Japan (11) |
0.19 |
France (7/11) |
N/A |
Japan (11) |
0.50 |
Australia (11) |
N/A |
United States (7) |
1.40 |
United States (7) |
1.20 |
United States (7) |
1.43 |
United States (7) |
1.33 |
Switzerland (7) |
0.58 |
Switzerland (7) |
0.58 |
Switzerland (7) |
0.71 |
Switzerland (7) |
0.77 |
PMPRB (11) Median |
0.50 |
PMPRB (11) Median |
0.69 |
PMPRB (11) Median |
0.61 |
PMPRB (11) Median |
0.60 |
PMPRB (7) Median |
0.55 |
PMPRB (7) Median |
0.70 |
PMPRB (7) Median |
0.69 |
PMPRB (7) Median |
0.72 |
OECD Median |
0.46 |
OECD Median |
0.61 |
OECD Median |
0.61 |
OECD Median |
0.61 |
Data source: IQVIA MIDAS® Database, prescription retail and hospital markets (data extracted in Q4-2022). All rights reserved.
3.2 International markets
Sales of antidiabetic drugs in all OECD countries have outpaced sales growth in the overall drug market, resulting in a growth in market share for antidiabetic drugs over the last decade (see Figure 3.2). This growth in market share was predominantly the result of the increased utilization of new-generation/non-insulin drugs. International market share comparisons in any given year have limitations due to market-specific factors in each country. However, the overall level and growth of these market shares are indicative of shared challenges in diabetes management.
The Canadian market share for antidiabetic drugs relative to the overall drug market in 2021 (7.9%) was the highest among the PMPRB11, almost doubling from 2012 (4.2%). While the PMPRB11 countries also saw an increase in share since 2012, the growth in spending for antidiabetic drugs was more in line with the general growth of their respective domestic drug markets. For the PMPRB11 countries, the market share increase during this period was comparatively modest. Outside the PMPRB11, the US stood out among OECD countries with the highest market share for antidiabetic drugs in 2021 (14.5%) nearly doubling from its already significant share in 2012 (6.7%). Greece came in second with a 12.4% share in 2021.
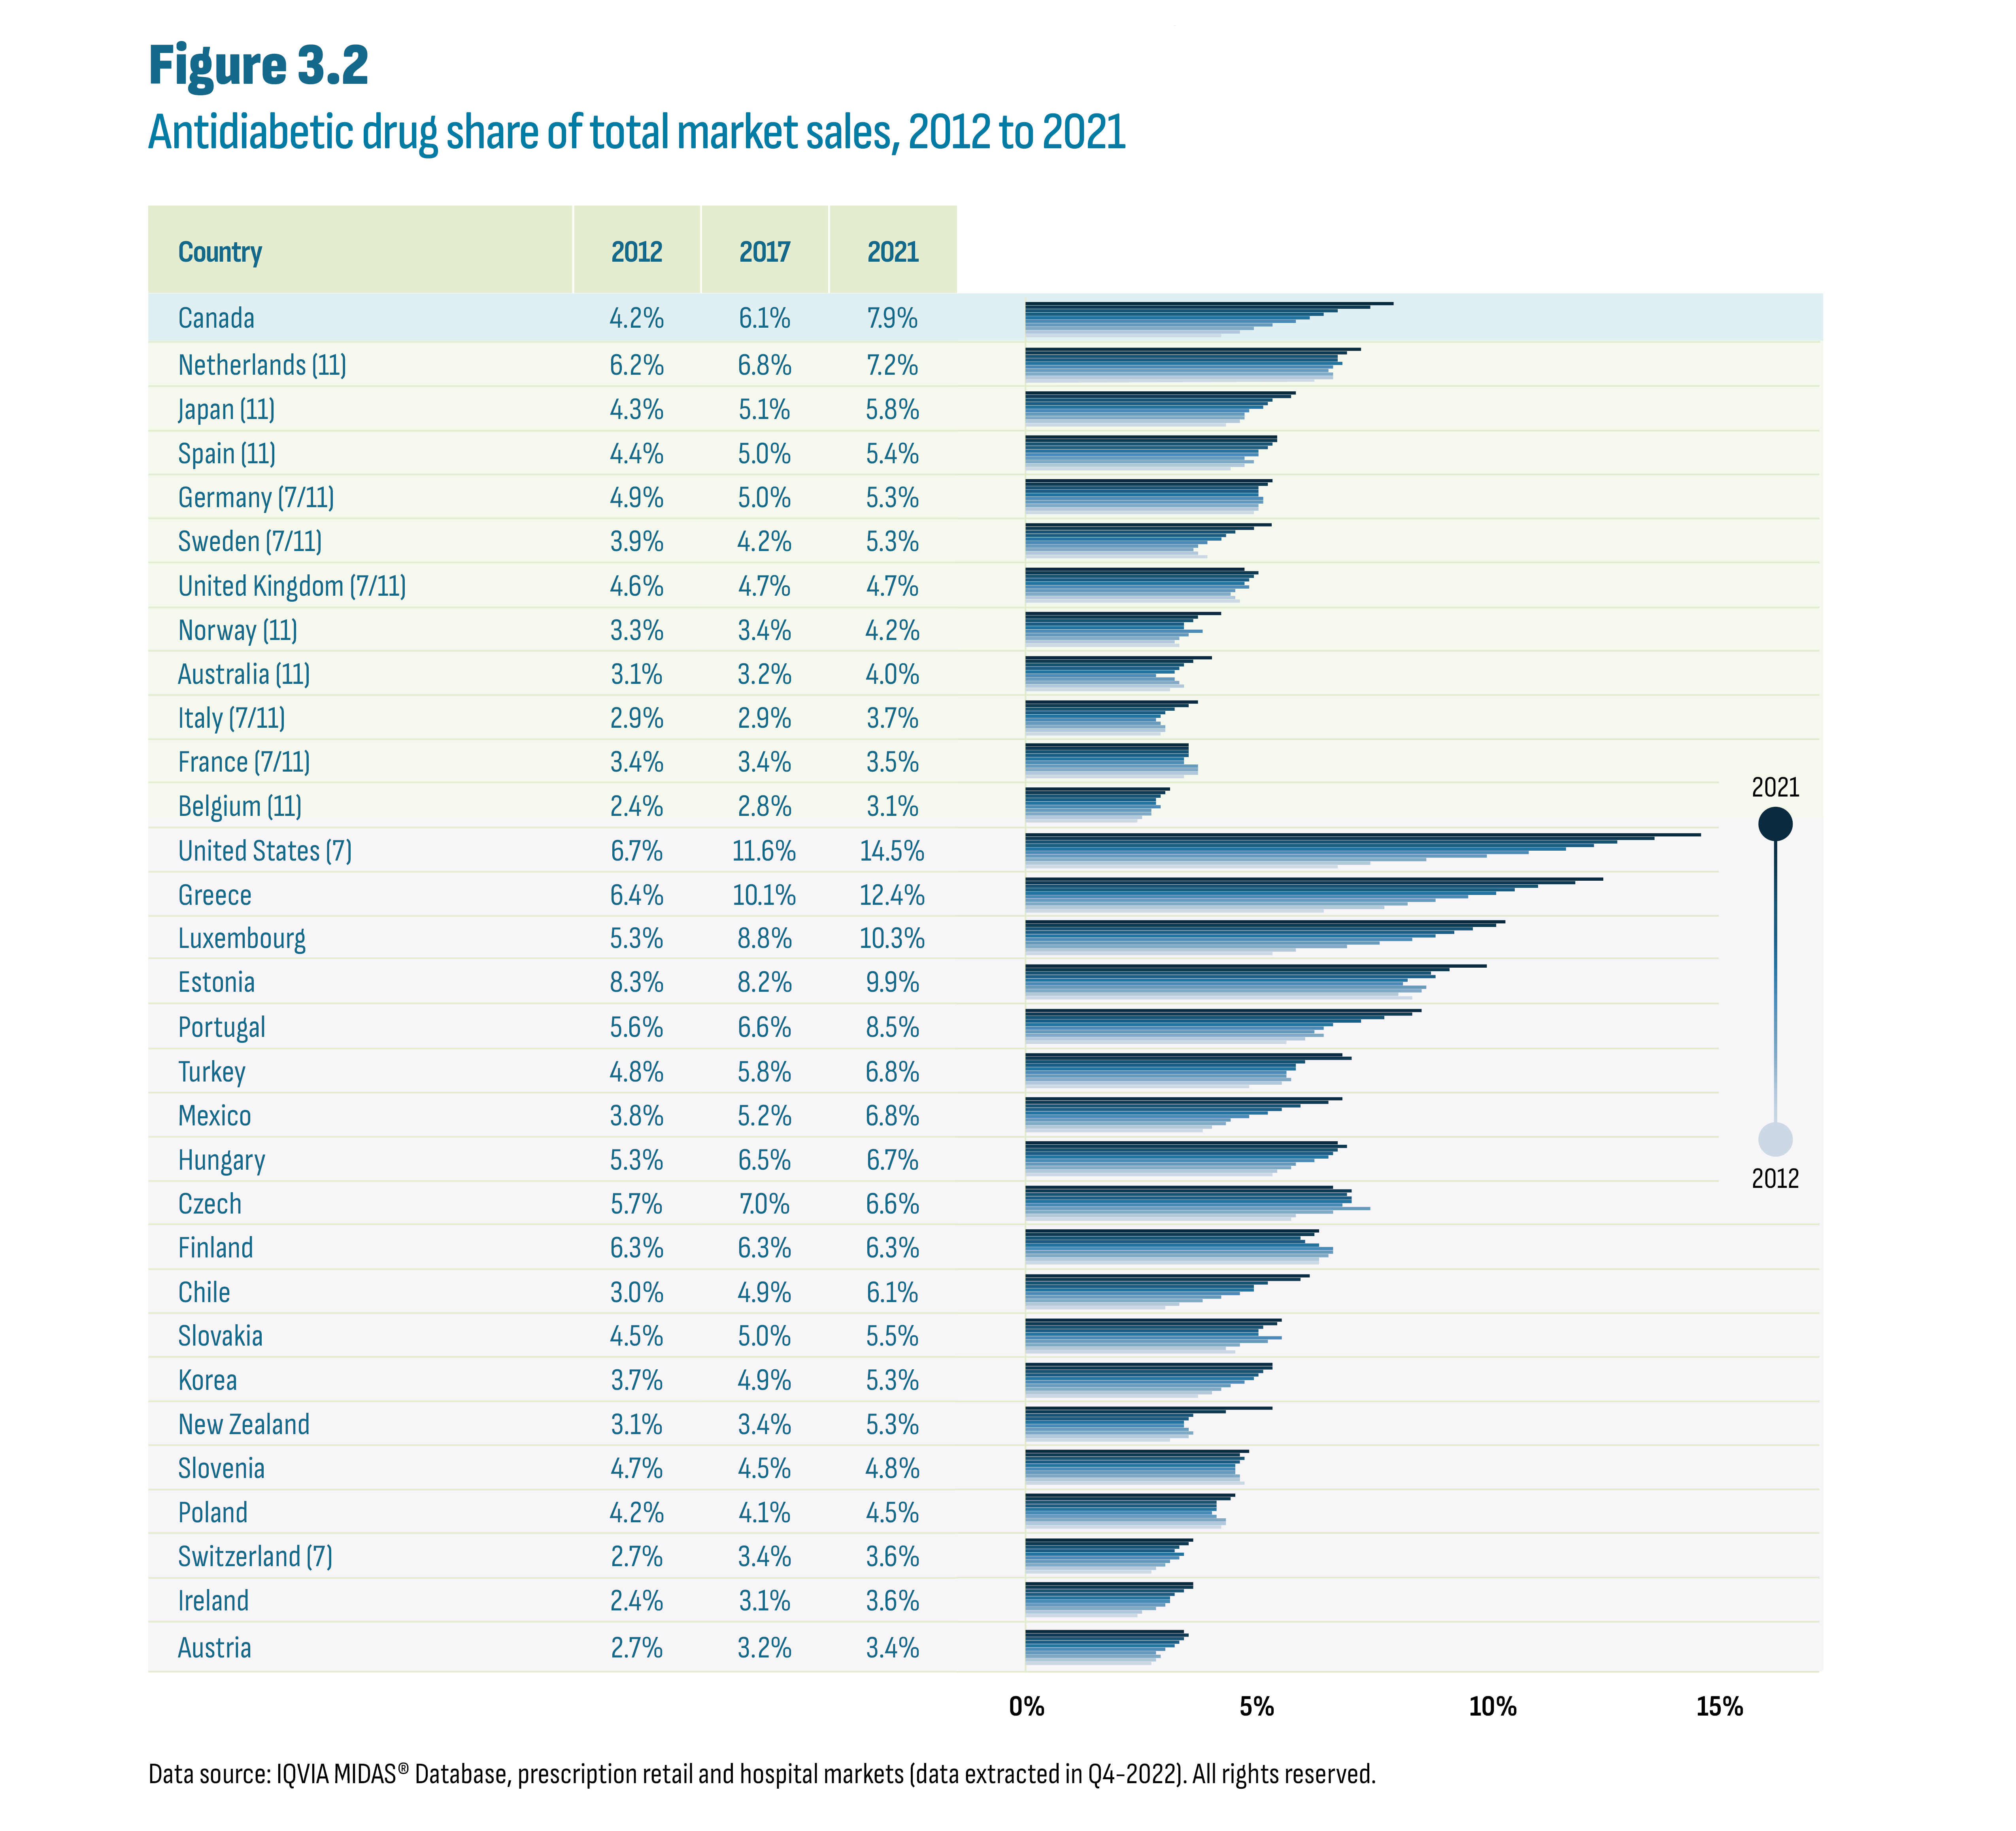
Figure description
This figure shows a bar graph of the antidiabetic drug share of the total market by country and by year from 2012 to 2021. The figure also indicates whether each country was part of the PMPRB7 or PMPRB11 comparator countries, with 7 and/or 11 in parentheses.
| Country | 2012 | 2013 | 2014 | 2015 | 2016 | 2017 | 2018 | 2019 | 2020 | 2021 |
|---|---|---|---|---|---|---|---|---|---|---|
Canada |
4.2% |
4.6% |
4.9% |
5.3% |
5.8% |
6.1% |
6.4% |
6.7% |
7.4% |
7.9% |
Netherlands (11) |
6.2% |
6.6% |
6.6% |
6.5% |
6.6% |
6.8% |
6.7% |
6.7% |
6.9% |
7.2% |
Japan (11) |
4.3% |
4.6% |
4.7% |
4.7% |
4.8% |
5.1% |
5.2% |
5.3% |
5.7% |
5.8% |
Spain (11) |
4.4% |
4.7% |
4.9% |
4.7% |
5.0% |
5.0% |
5.2% |
5.3% |
5.4% |
5.4% |
Germany (7/11) |
4.9% |
5.0% |
5.0% |
5.1% |
5.1% |
5.0% |
5.0% |
5.0% |
5.2% |
5.3% |
Sweden (7/11) |
3.9% |
3.7% |
3.6% |
3.7% |
3.9% |
4.2% |
4.3% |
4.5% |
4.9% |
5.3% |
United Kingdom (7/11) |
4.6% |
4.5% |
4.4% |
4.5% |
4.8% |
4.7% |
4.8% |
4.9% |
5.0% |
4.7% |
Norway (11) |
3.3% |
3.2% |
3.3% |
3.5% |
3.8% |
3.4% |
3.4% |
3.6% |
3.7% |
4.2% |
Australia (11) |
3.1% |
3.4% |
3.3% |
3.2% |
2.8% |
3.2% |
3.3% |
3.4% |
3.6% |
4.0% |
Italy (7/11) |
2.9% |
3.0% |
3.0% |
2.9% |
2.8% |
2.9% |
3.0% |
3.2% |
3.5% |
3.7% |
France (7/11) |
3.4% |
3.7% |
3.7% |
3.7% |
3.4% |
3.4% |
3.5% |
3.5% |
3.5% |
3.5% |
Belgium (11) |
2.4% |
2.5% |
2.7% |
2.7% |
2.9% |
2.8% |
2.8% |
2.9% |
3.0% |
3.1% |
United States (7) |
6.7% |
7.4% |
8.6% |
9.9% |
10.8% |
11.6% |
12.2% |
12.7% |
13.5% |
14.5% |
Greece |
6.4% |
7.7% |
8.2% |
8.8% |
9.5% |
10.1% |
10.5% |
11.0% |
11.8% |
12.4% |
Luxembourg |
5.3% |
5.8% |
6.9% |
7.6% |
8.3% |
8.8% |
9.2% |
9.6% |
10.1% |
10.3% |
Estonia |
8.3% |
8.0% |
8.5% |
8.6% |
8.1% |
8.2% |
8.8% |
8.7% |
9.1% |
9.9% |
Portugal |
5.6% |
6.0% |
6.4% |
6.2% |
6.4% |
6.6% |
7.2% |
7.7% |
8.3% |
8.5% |
Turkey |
4.8% |
5.5% |
5.7% |
5.6% |
5.6% |
5.8% |
5.8% |
6.0% |
7.0% |
6.8% |
Mexico |
3.8% |
4.0% |
4.3% |
4.4% |
4.8% |
5.2% |
5.5% |
5.9% |
6.5% |
6.8% |
Hungary |
5.3% |
5.4% |
5.7% |
5.8% |
6.2% |
6.5% |
6.6% |
6.7% |
6.9% |
6.7% |
Czech |
5.7% |
5.8% |
6.6% |
7.4% |
6.8% |
7.0% |
7.0% |
6.9% |
7.0% |
6.6% |
Finland |
6.3% |
6.3% |
6.5% |
6.6% |
6.6% |
6.3% |
6.0% |
5.9% |
6.2% |
6.3% |
Chile |
3.0% |
3.3% |
3.8% |
4.2% |
4.6% |
4.9% |
4.9% |
5.2% |
5.9% |
6.1% |
Slovakia |
4.5% |
4.3% |
4.6% |
5.2% |
5.5% |
5.0% |
5.0% |
5.1% |
5.4% |
5.5% |
Korea |
3.7% |
4.0% |
4.2% |
4.4% |
4.7% |
4.9% |
5.0% |
5.1% |
5.3% |
5.3% |
New Zealand |
3.1% |
3.5% |
3.6% |
3.5% |
3.4% |
3.4% |
3.5% |
3.6% |
4.3% |
5.3% |
Slovenia |
4.7% |
4.6% |
4.6% |
4.5% |
4.5% |
4.5% |
4.6% |
4.7% |
4.6% |
4.8% |
Poland |
4.2% |
4.3% |
4.3% |
4.1% |
4.0% |
4.1% |
4.1% |
4.1% |
4.4% |
4.5% |
Switzerland (7) |
2.7% |
2.8% |
3.0% |
3.1% |
3.3% |
3.4% |
3.2% |
3.3% |
3.5% |
3.6% |
Ireland |
2.4% |
2.5% |
2.8% |
3.0% |
3.1% |
3.1% |
3.2% |
3.4% |
3.6% |
3.6% |
Austria |
2.7% |
2.8% |
2.9% |
2.8% |
3.0% |
3.2% |
3.3% |
3.4% |
3.5% |
3.4% |
Data source: IQVIA MIDAS® Database, prescription retail and hospital markets (data extracted in Q4-2022). All rights reserved.
The cost increases resulted in cost per capita increases over the same period, most notably in the latter years. In 2021, Canada had the highest cost per capita ($71) of the PMPRB11, ahead of Japan ($46), Germany ($46), and Spain ($43) (Figure 3.3). Among OECD countries, Canada was a distant second to the US ($316) but ahead of the next highest countries beginning with Greece ($52) and was more than double the median for both the OECD ($30) and PMPRB11 ($30).
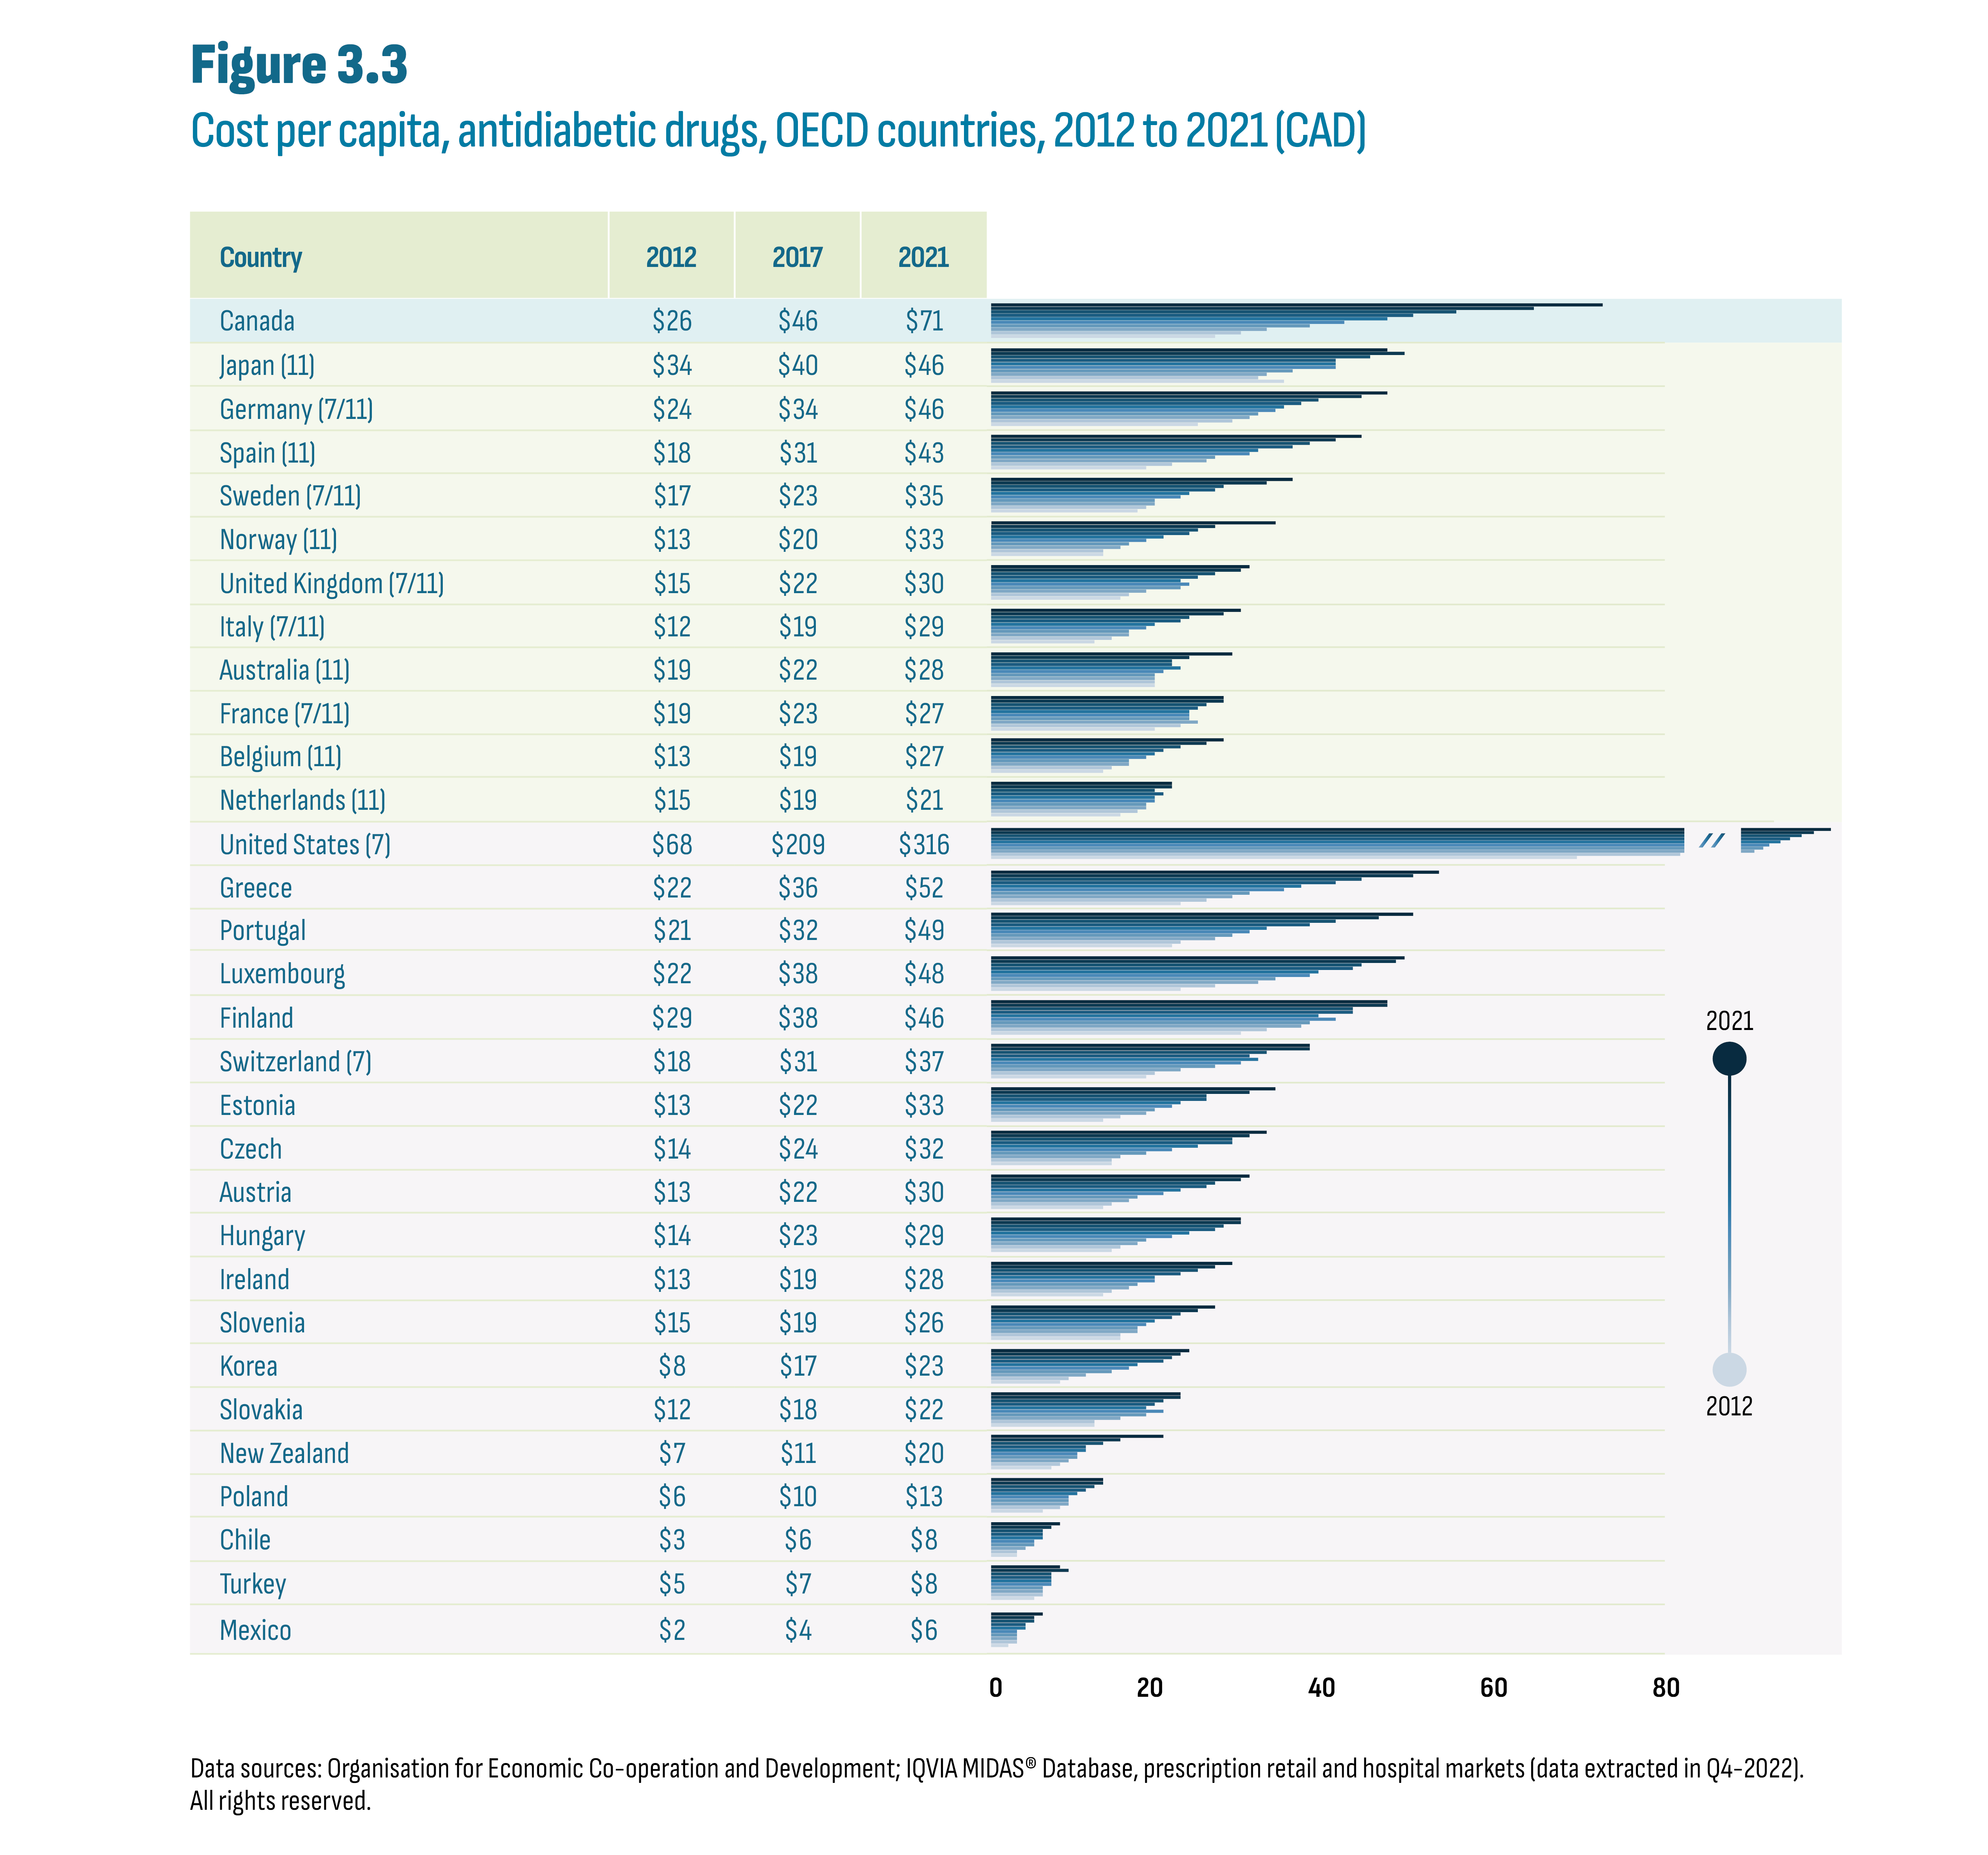
Figure description
This figure shows a bar graph of the cost per capita in Canadian dollars for antidiabetic drugs by country and by year from 2012 to 2021. The figure also indicates whether each country was part of the PMPRB7 or PMPRB11 comparator countries, with 7 and/or 11 in parentheses.
| Country | 2012 | 2013 | 2014 | 2015 | 2016 | 2017 | 2018 | 2019 | 2020 | 2021 |
|---|---|---|---|---|---|---|---|---|---|---|
Canada |
$26 |
$29 |
$32 |
$37 |
$41 |
$46 |
$49 |
$54 |
$63 |
$71 |
Japan (11) |
$34 |
$31 |
$32 |
$35 |
$40 |
$40 |
$40 |
$44 |
$48 |
$46 |
Germany (7/11) |
$24 |
$28 |
$30 |
$31 |
$33 |
$34 |
$36 |
$38 |
$43 |
$46 |
Spain (11) |
$18 |
$21 |
$25 |
$26 |
$30 |
$31 |
$35 |
$37 |
$40 |
$43 |
Sweden (7/11) |
$17 |
$18 |
$19 |
$19 |
$22 |
$23 |
$26 |
$27 |
$32 |
$35 |
Norway (11) |
$13 |
$13 |
$15 |
$16 |
$18 |
$20 |
$23 |
$24 |
$26 |
$33 |
United Kingdom (7/11) |
$15 |
$16 |
$18 |
$22 |
$23 |
$22 |
$24 |
$26 |
$29 |
$30 |
Italy (7/11) |
$12 |
$14 |
$16 |
$16 |
$18 |
$19 |
$22 |
$23 |
$27 |
$29 |
Australia (11) |
$19 |
$19 |
$19 |
$19 |
$20 |
$22 |
$21 |
$21 |
$23 |
$28 |
France (7/11) |
$19 |
$22 |
$24 |
$23 |
$23 |
$23 |
$24 |
$25 |
$27 |
$27 |
Belgium (11) |
$13 |
$14 |
$16 |
$16 |
$18 |
$19 |
$20 |
$22 |
$25 |
$27 |
Netherlands (11) |
$15 |
$17 |
$18 |
$18 |
$19 |
$19 |
$20 |
$19 |
$21 |
$21 |
United States (7) |
$68 |
$80 |
$112 |
$167 |
$196 |
$209 |
$232 |
$259 |
$291 |
$316 |
Greece |
$22 |
$25 |
$28 |
$30 |
$34 |
$36 |
$40 |
$43 |
$49 |
$52 |
Portugal |
$21 |
$22 |
$26 |
$28 |
$30 |
$32 |
$37 |
$40 |
$45 |
$49 |
Luxembourg |
$22 |
$26 |
$31 |
$33 |
$37 |
$38 |
$42 |
$43 |
$47 |
$48 |
Finland |
$29 |
$32 |
$36 |
$37 |
$40 |
$38 |
$42 |
$42 |
$46 |
$46 |
Switzerland (7) |
$18 |
$19 |
$22 |
$26 |
$29 |
$31 |
$30 |
$32 |
$37 |
$37 |
Estonia |
$13 |
$15 |
$18 |
$19 |
$21 |
$22 |
$25 |
$25 |
$30 |
$33 |
Czech |
$14 |
$14 |
$15 |
$18 |
$21 |
$24 |
$28 |
$28 |
$30 |
$32 |
Austria |
$13 |
$14 |
$16 |
$17 |
$20 |
$22 |
$25 |
$26 |
$29 |
$30 |
Hungary |
$14 |
$15 |
$17 |
$18 |
$21 |
$23 |
$26 |
$27 |
$29 |
$29 |
Ireland |
$13 |
$14 |
$16 |
$17 |
$19 |
$19 |
$22 |
$24 |
$26 |
$28 |
Slovenia |
$15 |
$15 |
$17 |
$17 |
$18 |
$19 |
$21 |
$22 |
$24 |
$26 |
Korea |
$8 |
$9 |
$11 |
$14 |
$16 |
$17 |
$20 |
$21 |
$22 |
$23 |
Slovakia |
$12 |
$12 |
$15 |
$18 |
$20 |
$18 |
$19 |
$20 |
$22 |
$22 |
New Zealand |
$7 |
$8 |
$9 |
$10 |
$10 |
$11 |
$11 |
$13 |
$15 |
$20 |
Poland |
$6 |
$8 |
$9 |
$9 |
$9 |
$10 |
$11 |
$12 |
$13 |
$13 |
Chile |
$3 |
$3 |
$4 |
$5 |
$5 |
$6 |
$6 |
$6 |
$7 |
$8 |
Turkey |
$5 |
$6 |
$6 |
$6 |
$7 |
$7 |
$7 |
$7 |
$9 |
$8 |
Mexico |
$2 |
$3 |
$3 |
$3 |
$3 |
$4 |
$4 |
$5 |
$5 |
$6 |
Data sources: Organisation for Economic Co-operation and Development; IQVIA MIDAS® Database, prescription retail and hospital markets (data extracted in Q4-2022). All rights reserved.
While the cost per capita increased in all OECD countries (Figure 3.3), the key difference among countries is the size of this increase. Figure 3.4 shows the distribution of all OECD countries according to their respective percent increase in cost per capita since 2012. Each category on the horizontal axis displays a compound annual growth rate (CAGR) range in cost per capita from the smallest change observed (0% to 2.0%) to the largest (18.1% to 20.0%). Three PMPRB11 countries experienced increases below 4% in cost per capita: Japan (3.5%); the Netherlands (3.6%); and France (3.9%). An 8% CAGR represents a doubling in the cost per capita over this period and four countries were in this range: the UK (7.6%); Sweden (8.2%); Hungary (8.4%); and Switzerland (8.4%). Overall, two-thirds of countries had increase over 8%, including Canada (11.7%). The PMPRB11 was split with 5 countries below 8% and 6 above while other OECD more often saw increases above 8% (15 versus 4 countries).
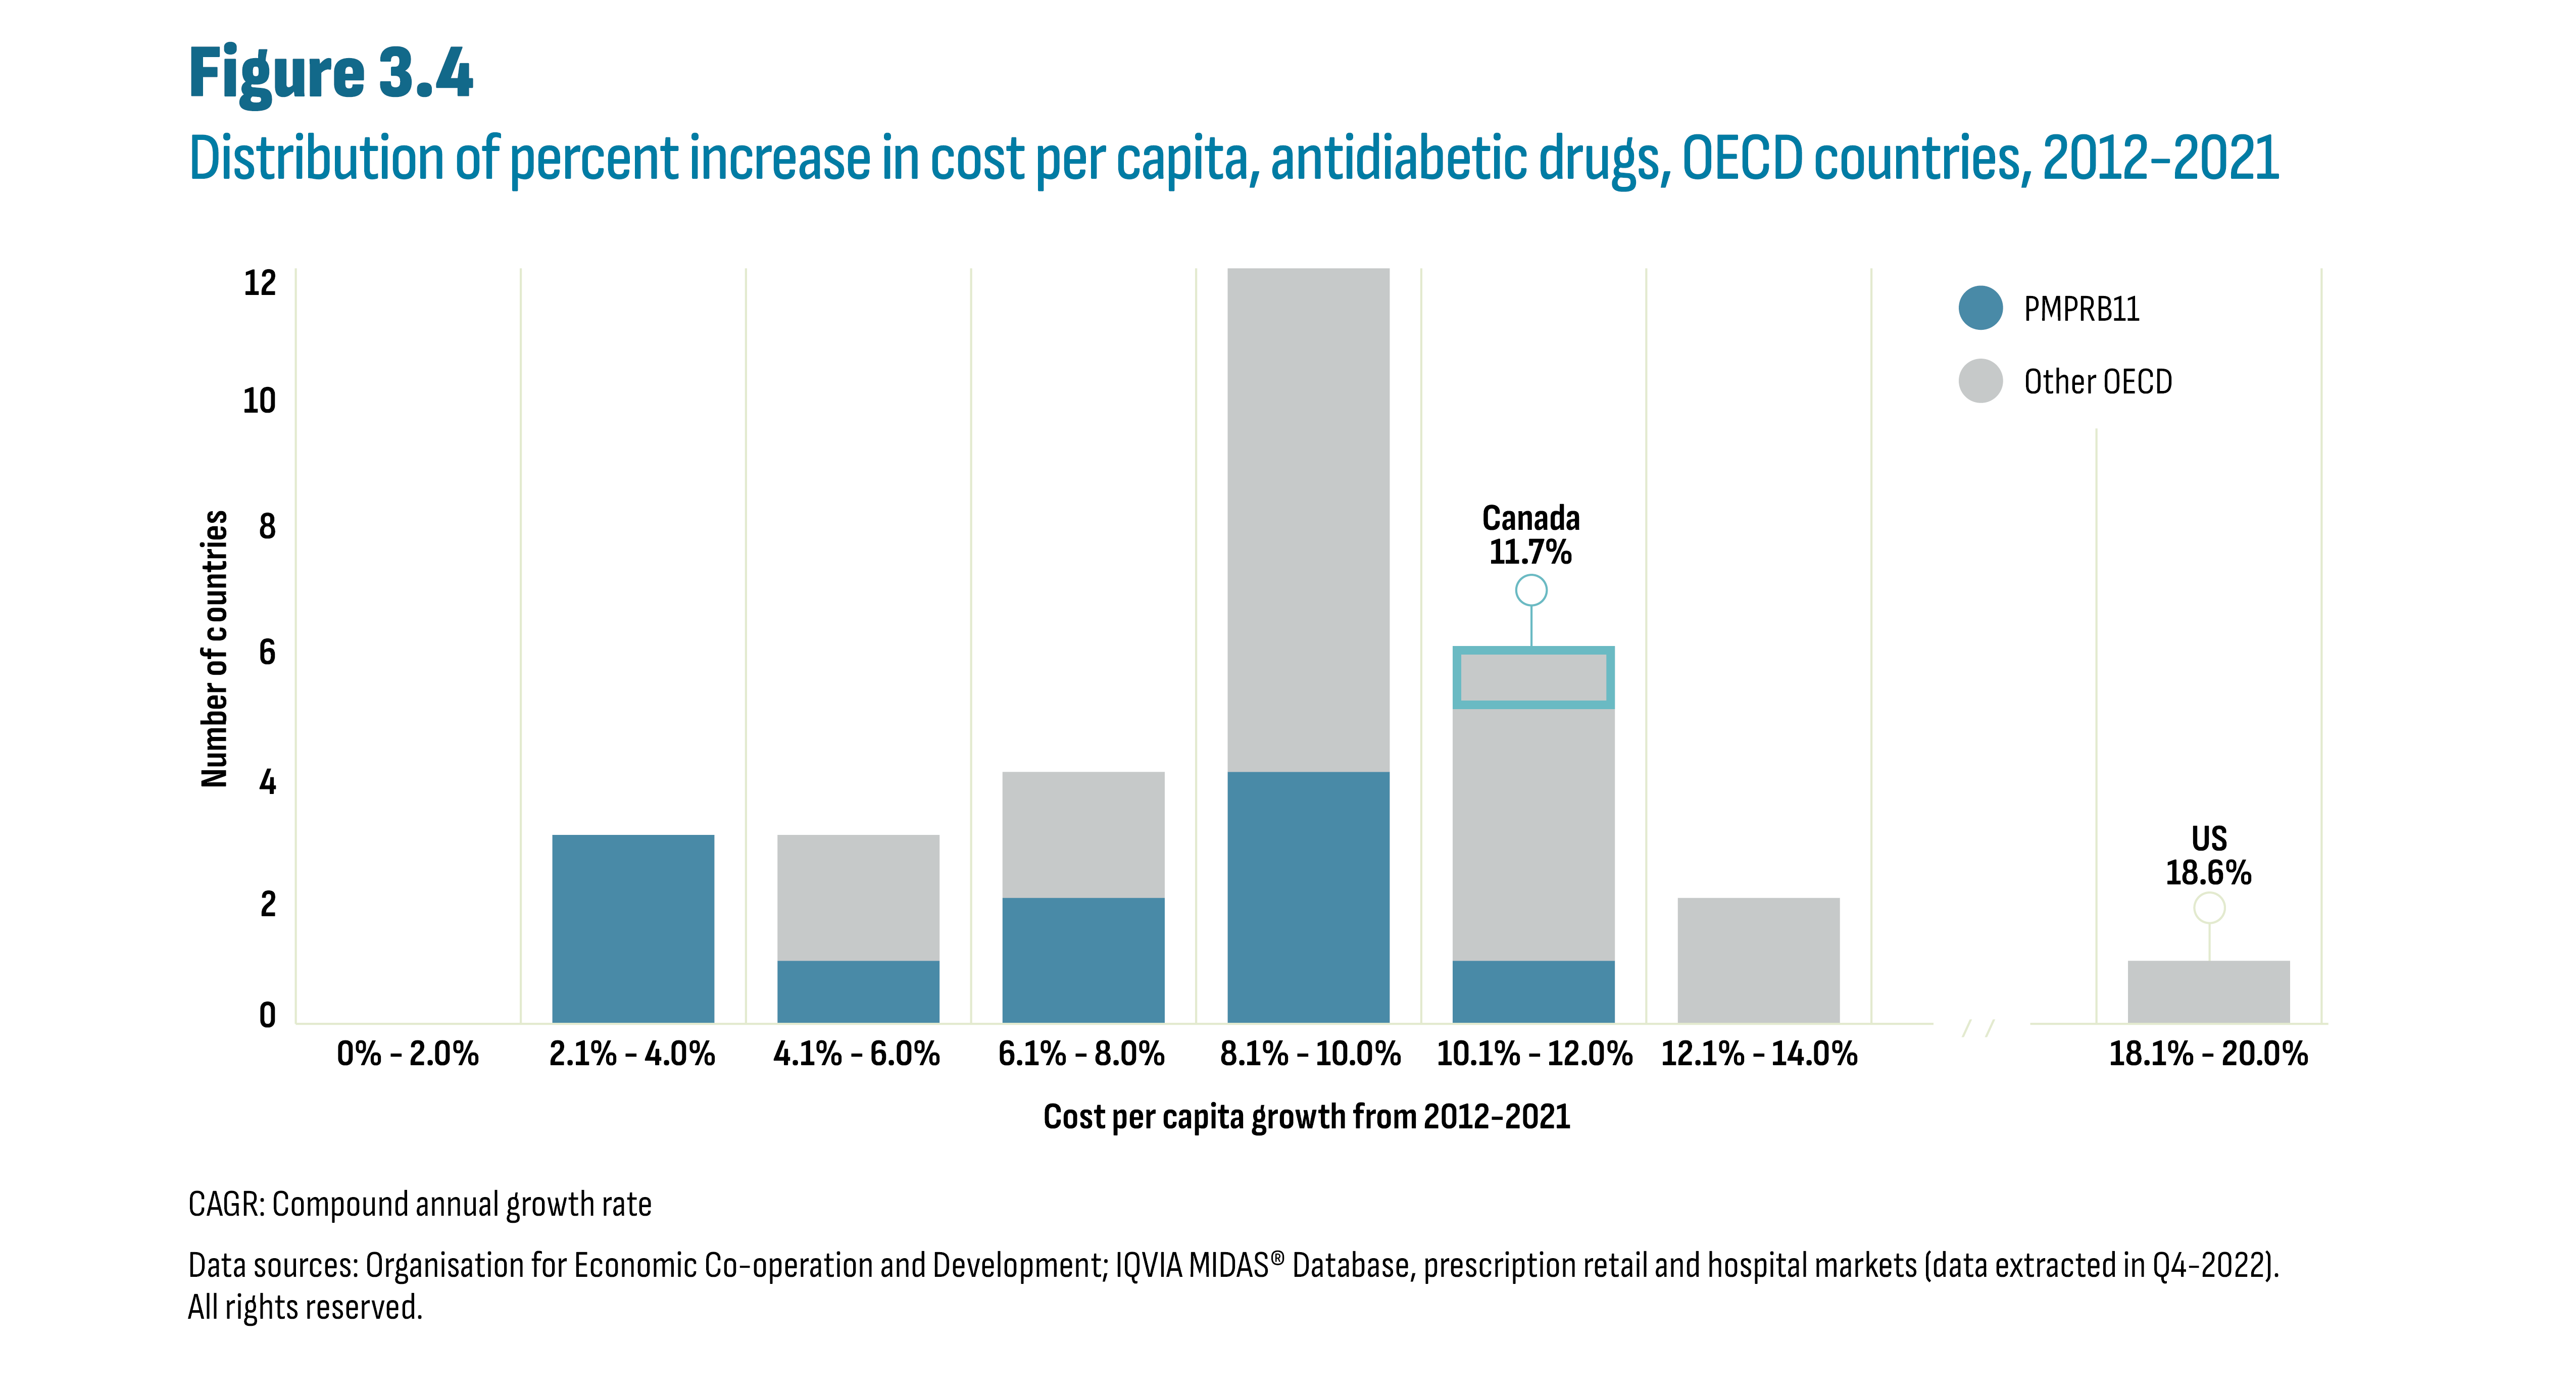
Figure description
This is a stacked column graph that shows the distribution of all OECD countries according to their respective percent increase in cost per capita over the 2012 to 2021 period. The number of countries is provided for each increment of 2 percentage points: 0% to 2.0%, 2.1% to 4.0%, and so on. The graph highlights that the compound annual growth rate or CAGR for Canada was 11.7% and for the United States was 18.6%.
| Cost per Capita Growth (CAGR) from 2012-2021 | Number of countries | ||
|---|---|---|---|
| PMPRB11 | Other OECD | Canada | |
0% - 2.0% |
0 |
0 |
|
2.1% - 4.0% |
3 |
0 |
|
4.1% - 6.0% |
1 |
2 |
|
6.1% - 8.0% |
2 |
2 |
|
8.1% - 10.0% |
4 |
8 |
|
10.1% - 12.0% |
1 |
4 |
1 |
12.1% - 14.0% |
0 |
2 |
|
/ / |
|
||
18.1% - 20.0% |
0 |
1 |
|
CAGR: Compound annual growth rate
Data sources: Organisation for Economic Co-operation and Development; IQVIA MIDAS® Database, prescription retail and hospital markets (data extracted in Q4-2022). All rights reserved.
Growth in cost per capita, regardless of scale, was driven by shifts in prescribing toward the new-generation/non-insulin drugs as further detailed below. It is also worth noting that the US experienced substantial increases in insulin prices over the last decade, particularly in the first half. Figure 3.5 divides the 2021 cost per capita by subclass. While the overall cost per capita varies across countries, the subclass distributions are similar and illustrate the relative importance of the new-generation/non-insulin subclasses (DPP-4, GLP-1, SGLT-2).
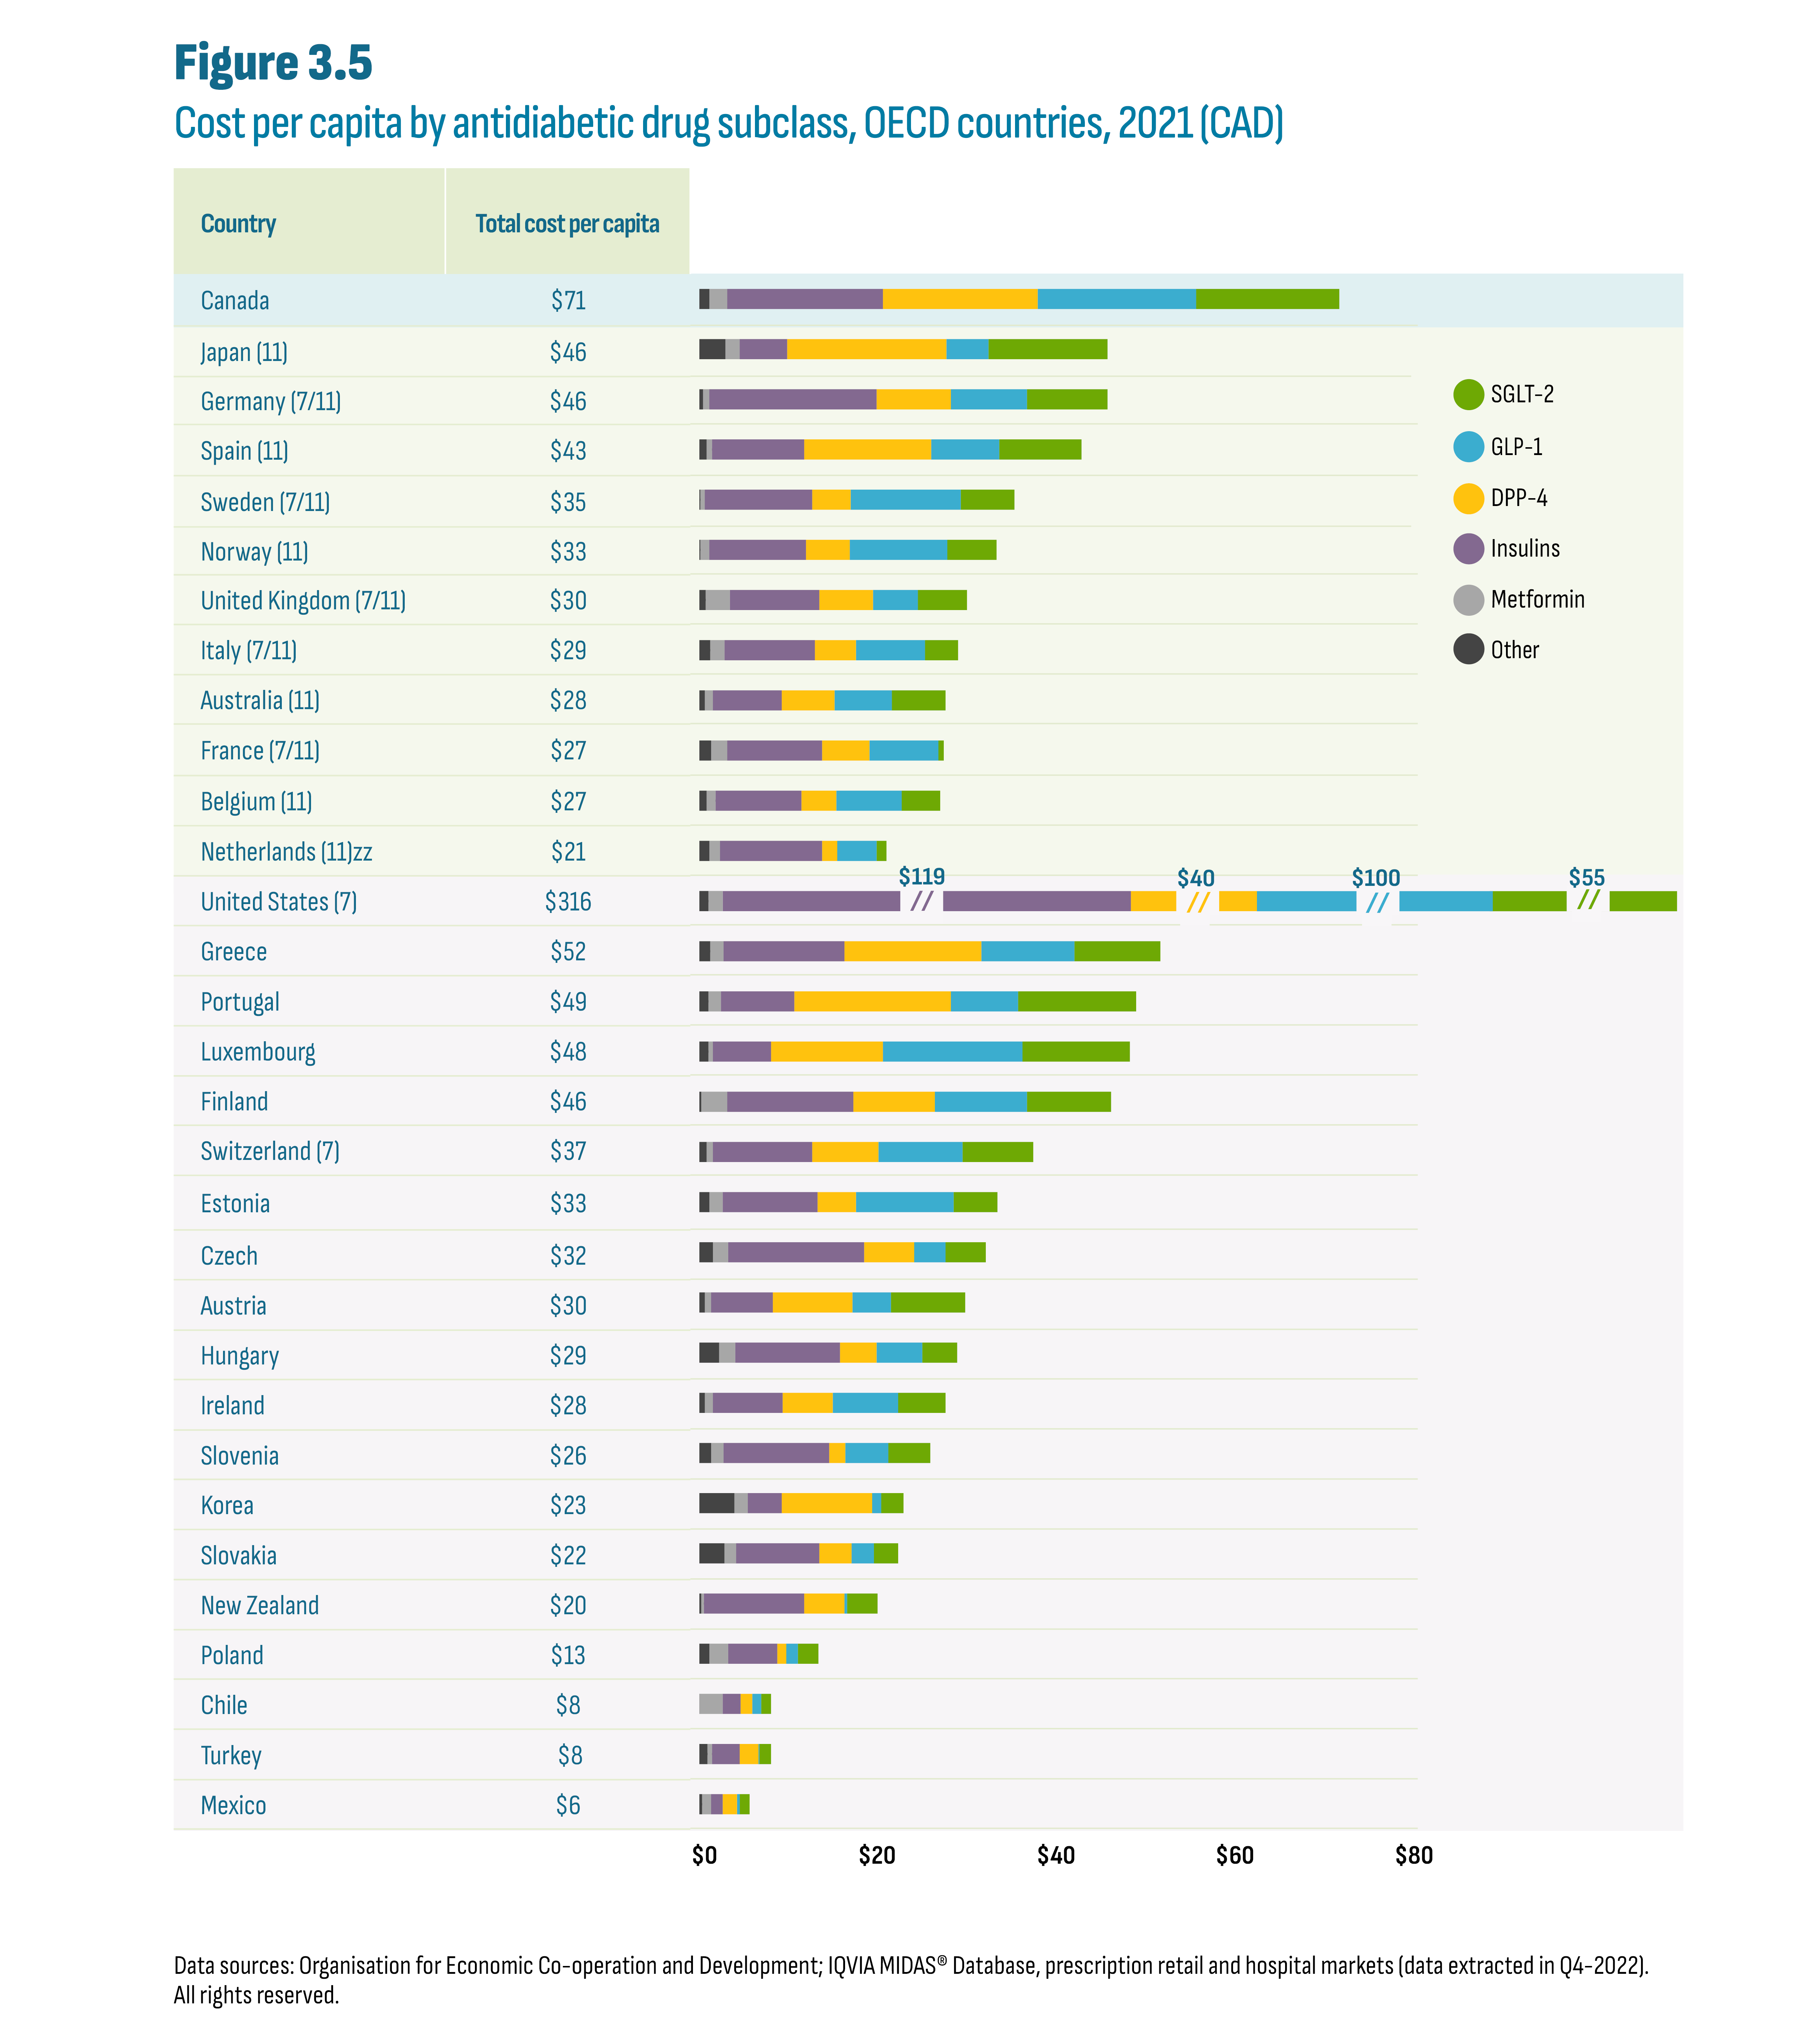
Figure description
This figure shows a horizontal stacked bar graph of the 2021 cost per capita in Canadian dollars for antidiabetic drugs by country and by drug subclass. The total cost per capita is indicated for each country. The figure also indicates whether each country was part of the PMPRB7 or PMPRB11 comparator countries, with 7 and/or 11 in parentheses. The horizontal axis for cost per capita ranges from $0 to $80. The United States bars for Insulins, DPP-4, GLP-1, and SGLT-2 are broken to fit the graph due to their relative size. For the United States, cost per capita subtotals are shown above the broken bars for the subclasses of Insulins ($119); DPP-4 ($40); GLP-1 ($100) and SGLT-2 ($55).
| Country | Total cost per capita | Other | Metformin | Insulins | DPP-4 | GLP-1 | SGLT-2 |
|---|---|---|---|---|---|---|---|
Canada |
$71 |
$1.1 |
$2.0 |
$17.4 |
$17.3 |
$17.7 |
$16.0 |
Japan (11) |
$46 |
$2.9 |
$1.6 |
$5.3 |
$17.8 |
$4.7 |
$13.3 |
Germany (7/11) |
$46 |
$0.4 |
$0.7 |
$18.7 |
$8.3 |
$8.5 |
$9.0 |
Spain (11) |
$43 |
$0.8 |
$0.6 |
$10.3 |
$14.2 |
$7.6 |
$9.2 |
Sweden (7/11) |
$35 |
$0.1 |
$0.5 |
$12.0 |
$4.3 |
$12.3 |
$6.0 |
Norway (11) |
$33 |
$0.1 |
$1.0 |
$10.8 |
$4.9 |
$10.9 |
$5.5 |
United Kingdom (7/11) |
$30 |
$0.7 |
$2.7 |
$10.0 |
$6.0 |
$5.0 |
$5.5 |
Italy (7/11) |
$29 |
$1.2 |
$1.6 |
$10.1 |
$4.6 |
$7.7 |
$3.7 |
Australia (11) |
$28 |
$0.6 |
$0.9 |
$7.7 |
$5.9 |
$6.4 |
$6.0 |
France (7/11) |
$27 |
$1.3 |
$1.8 |
$10.6 |
$5.3 |
$7.7 |
$0.6 |
Belgium (11) |
$27 |
$0.8 |
$1.0 |
$9.6 |
$3.9 |
$7.3 |
$4.3 |
Netherlands (11) |
$21 |
$1.1 |
$1.2 |
$11.4 |
$1.7 |
$4.4 |
$1.1 |
United States (7) |
$316 |
$1.0 |
$1.6 |
$118.5 |
$39.8 |
$99.9 |
$54.7 |
Greece |
$52 |
$1.2 |
$1.5 |
$13.5 |
$15.3 |
$10.4 |
$9.6 |
Portugal |
$49 |
$1.0 |
$1.4 |
$8.2 |
$17.5 |
$7.5 |
$13.2 |
Luxembourg |
$48 |
$1.0 |
$0.5 |
$6.5 |
$12.5 |
$15.6 |
$12.0 |
Finland |
$46 |
$0.2 |
$2.9 |
$14.1 |
$9.1 |
$10.3 |
$9.4 |
Switzerland (7) |
$37 |
$0.8 |
$0.7 |
$11.1 |
$7.4 |
$9.4 |
$7.9 |
Estonia |
$33 |
$1.1 |
$1.5 |
$10.6 |
$4.3 |
$10.9 |
$4.9 |
Czech |
$32 |
$1.5 |
$1.7 |
$15.2 |
$5.6 |
$3.5 |
$4.5 |
Austria |
$30 |
$0.6 |
$0.7 |
$6.9 |
$8.9 |
$4.3 |
$8.3 |
Hungary |
$29 |
$2.2 |
$1.8 |
$11.7 |
$4.1 |
$5.1 |
$3.9 |
Ireland |
$28 |
$0.6 |
$0.9 |
$7.8 |
$5.6 |
$7.3 |
$5.3 |
Slovenia |
$26 |
$1.3 |
$1.4 |
$11.8 |
$1.8 |
$4.8 |
$4.7 |
Korea |
$23 |
$3.9 |
$1.5 |
$3.8 |
$10.1 |
$1.0 |
$2.5 |
Slovakia |
$22 |
$2.8 |
$1.3 |
$9.3 |
$3.6 |
$2.5 |
$2.7 |
New Zealand |
$20 |
$0.2 |
$0.3 |
$11.2 |
$4.5 |
$0.3 |
$3.4 |
Poland |
$13 |
$1.1 |
$2.1 |
$5.5 |
$1.0 |
$1.3 |
$2.3 |
Chile |
$8 |
$0.0 |
$2.6 |
$2.0 |
$1.3 |
$1.0 |
$1.1 |
Turkey |
$8 |
$0.9 |
$0.5 |
$3.1 |
$2.1 |
$0.1 |
$1.3 |
Mexico |
$6 |
$0.3 |
$1.0 |
$1.3 |
$1.6 |
$0.3 |
$1.1 |
Data sources: Organisation for Economic Co-operation and Development; IQVIA MIDAS® Database, prescription retail and hospital markets (data extracted in Q4-2022). All rights reserved.
The shift to the new subclasses, particularly since the arrival of the SGLT-2’s in the mid-2010’s, is analysed in Figure 3.6. For example, Canada’s cost per capita increased by $26 since 2017, from $46 (2017) to $71 (2021). Of this change, SGLT-2’s and GLP-1’s each contributed $9.8 and $14.2, respectively. This reflects the uptake of a new class (SGLT-2’s) and the impact of semaglutide on the growth of the GLP-1 subclass. The modest $2.0 contribution by DPP-4’s is consistent with an established class facing competition. Insulins contributed $0.9, and all other antidiabetic drugs mitigated the increase with a cost per capita decrease of $0.9. Similar results are observed across the PMPRB11 and only the magnitude of the change varies. However, while in most countries insulins contributed to modest growth, some countries saw the reverse effect: Japan (-$0.8), Sweden (-$1.3), Australia (-$3.0), and the Netherlands (-$3.2).

Figure description
This figure shows a table and a bar graph that provide the total increase in cost per capita from 2017 to 2021 by class and by country. It also shows the contribution of each class to the increase in both dollars and as a percentage of the total increase. The figure also indicates whether each country was part of the PMPRB7 or PMPRB11 comparator countries, with 7 and/or 11 in parentheses.
| Total | Change by subclass | |||||
|---|---|---|---|---|---|---|
| SGLT-2 | GLP-1 | DPP-4 | Insulins | Other | ||
Canada |
$26 |
$9.8 |
$14.2 |
$2.0 |
$0.9 |
-$0.9 |
Japan (11) |
$6 |
$9.0 |
$2.6 |
-$2.3 |
-$0.8 |
-$2.5 |
Germany (7/11) |
$12 |
$6.3 |
$5.4 |
$0.2 |
$0.0 |
-$0.1 |
Spain (11) |
$11 |
$6.1 |
$4.6 |
$0.8 |
$0.2 |
-$0.2 |
Sweden (7/11) |
$12 |
$4.6 |
$8.0 |
$0.8 |
-$1.3 |
-$0.2 |
Norway (11) |
$13 |
$3.4 |
$7.4 |
$0.3 |
$1.7 |
$0.1 |
United Kingdom (7/11) |
$8 |
$3.4 |
$2.6 |
$1.0 |
$0.5 |
$0.2 |
Italy (7/11) |
$10 |
$2.7 |
$5.7 |
$0.8 |
$1.2 |
-$0.6 |
Australia (11) |
$6 |
$3.3 |
$4.9 |
$0.8 |
-$3.0 |
-$0.1 |
France (7/11) |
$4 |
$0.6 |
$3.7 |
-$0.3 |
$0.8 |
-$0.4 |
Belgium (11) |
$8 |
$3.4 |
$4.4 |
-$0.1 |
$0.8 |
-$0.1 |
Netherlands (11) |
$2 |
$0.7 |
$3.1 |
$0.3 |
-$3.2 |
$0.9 |
Data sources: Organisation for Economic Co-operation and Development; IQVIA MIDAS® Database, prescription retail and hospital markets (data extracted in Q4-2022). All rights reserved.
A closer look at shifts in utilization indicate that the changes in cost per capita discussed above were the result of increases in utilization of the relatively more expensive new-generation/non-insulin drugs and not the result of price increases. Figure 3.7 shows both overall growth and market share shifts in the units (Chart A) and costs (Chart B) for these subclasses over the past decade (2012-2021). The data are shown as a series of ten clustered stacked columns for each country. The data are indexed, with the total reported market for the drugs set at a value of 1 in 2017 across all countries (see Appendix A: Methodology Notes). It is important to keep in mind that both units and costs have limitations as metrics to analyse utilization. For example, units reported for semaglutide (Ozempic), the leading GLP-1, are comparatively low given its once per week dosing regimen, but costs remain substantial given its relatively higher price. This contrasts with DPP-4’s and SGLT-2’s that are taken once or twice a day. As such, GLP-1 utilization will be underestimated when measured in units and overestimated when measured in costs.
Overall, the international data suggest an evolving shift in prescribing from DPP-4’s to SGLT-2’s following the launch of SGLT-2’s. However, it remains unclear whether the further decrease of DPP-4’s is due to the launch of Ozempic or ongoing competition from the SGLT-2’s. It is also unclear whether GLP-1 prescribing displaced SGLT-2’s or if growth in GLP-1’s was the result of off-label prescribing given semaglutide (Ozempic)’s documented effects on weight loss. It is worth noting that drugs in the SGLT-2 subclass are also indicated for the treatment of heart failure even in the absence of diabetes. It is not possible to determine if these drugs were used to treat diabetes or heart failure.
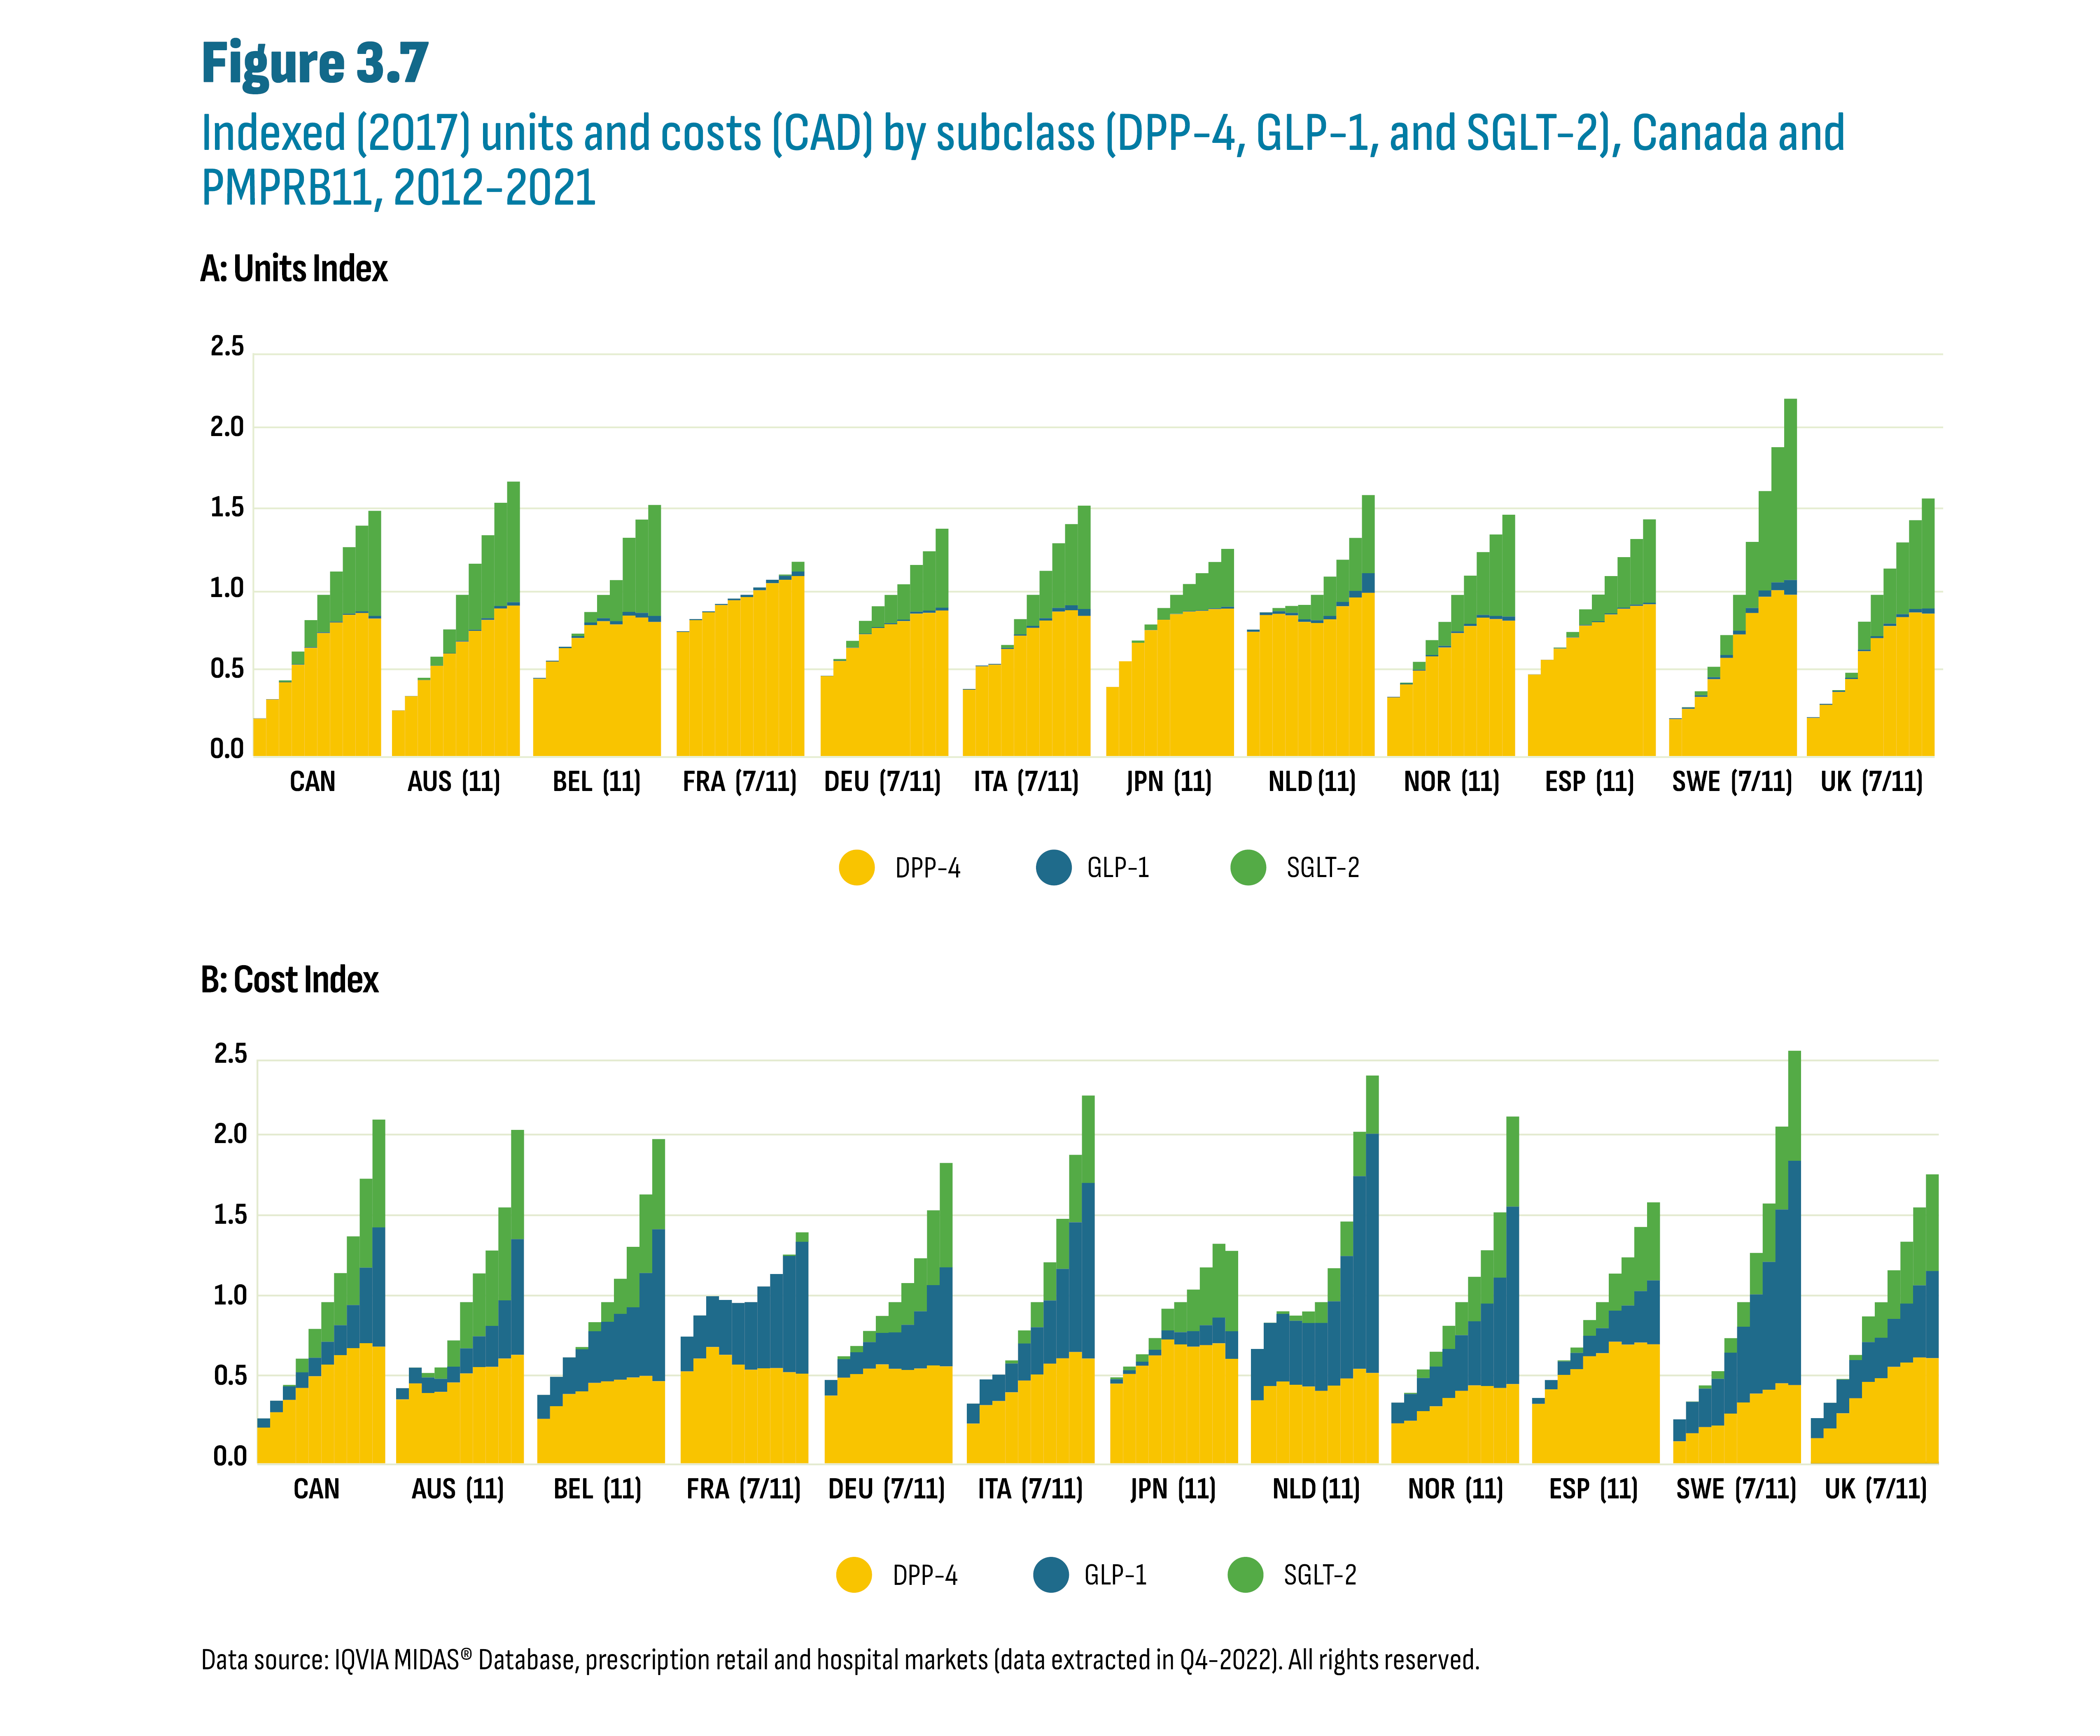
Figure description
This figure shows two stacked column graphs of indexed units (graph A) and indexed costs (graph B) by subclass, by year from 2012 to 2021, and by country for Canada and the PMPRB11 countries. The figure also indicates whether each country was part of the PMPRB7 or PMPRB11 comparator countries, with 7 and/or 11 in parentheses.
| A: Unit Index | |||||||||||
|---|---|---|---|---|---|---|---|---|---|---|---|
| Country | Class | 2012 | 2013 | 2014 | 2015 | 2016 | 2017 | 2018 | 2019 | 2020 | 2021 |
Canada |
DPP-4 |
0.2 |
0.4 |
0.5 |
0.6 |
0.7 |
0.8 |
0.8 |
0.9 |
0.9 |
0.9 |
GLP-1 |
0.0 |
0.0 |
0.0 |
0.0 |
0.0 |
0.0 |
0.0 |
0.0 |
0.0 |
0.0 |
|
SGLT-2 |
0.0 |
0.0 |
0.0 |
0.1 |
0.2 |
0.2 |
0.3 |
0.4 |
0.5 |
0.7 |
|
Australia (11) |
DPP-4 |
0.3 |
0.4 |
0.5 |
0.6 |
0.6 |
0.7 |
0.8 |
0.8 |
0.9 |
0.9 |
GLP-1 |
0.0 |
0.0 |
0.0 |
0.0 |
0.0 |
0.0 |
0.0 |
0.0 |
0.0 |
0.0 |
|
SGLT-2 |
0.0 |
0.0 |
0.0 |
0.1 |
0.1 |
0.3 |
0.4 |
0.5 |
0.6 |
0.7 |
|
Belgium (11) |
DPP-4 |
0.5 |
0.6 |
0.7 |
0.7 |
0.8 |
0.8 |
0.8 |
0.9 |
0.9 |
0.8 |
GLP-1 |
0.0 |
0.0 |
0.0 |
0.0 |
0.0 |
0.0 |
0.0 |
0.0 |
0.0 |
0.0 |
|
SGLT-2 |
0.0 |
0.0 |
0.0 |
0.0 |
0.1 |
0.1 |
0.3 |
0.5 |
0.6 |
0.7 |
|
France (7/11) |
DPP-4 |
0.8 |
0.8 |
0.9 |
0.9 |
1.0 |
1.0 |
1.0 |
1.1 |
1.1 |
1.1 |
GLP-1 |
0.0 |
0.0 |
0.0 |
0.0 |
0.0 |
0.0 |
0.0 |
0.0 |
0.0 |
0.0 |
|
SGLT-2 |
0.0 |
0.0 |
0.0 |
0.0 |
0.0 |
0.0 |
0.0 |
0.0 |
0.0 |
0.1 |
|
Germany (7/11) |
DPP-4 |
0.5 |
0.6 |
0.7 |
0.8 |
0.8 |
0.8 |
0.8 |
0.9 |
0.9 |
0.9 |
GLP-1 |
0.0 |
0.0 |
0.0 |
0.0 |
0.0 |
0.0 |
0.0 |
0.0 |
0.0 |
0.0 |
|
SGLT-2 |
0.0 |
0.0 |
0.0 |
0.1 |
0.1 |
0.2 |
0.2 |
0.3 |
0.4 |
0.5 |
|
Italy (7/11) |
DPP-4 |
0.4 |
0.6 |
0.6 |
0.7 |
0.7 |
0.8 |
0.8 |
0.9 |
0.9 |
0.9 |
GLP-1 |
0.0 |
0.0 |
0.0 |
0.0 |
0.0 |
0.0 |
0.0 |
0.0 |
0.0 |
0.0 |
|
SGLT-2 |
0.0 |
0.0 |
0.0 |
0.0 |
0.1 |
0.2 |
0.3 |
0.4 |
0.5 |
0.6 |
|
Japan (11) |
DPP-4 |
0.4 |
0.6 |
0.7 |
0.8 |
0.8 |
0.9 |
0.9 |
0.9 |
0.9 |
0.9 |
GLP-1 |
0.0 |
0.0 |
0.0 |
0.0 |
0.0 |
0.0 |
0.0 |
0.0 |
0.0 |
0.0 |
|
SGLT-2 |
0.0 |
0.0 |
0.0 |
0.0 |
0.1 |
0.1 |
0.2 |
0.2 |
0.3 |
0.4 |
|
Netherlands (11) |
DPP-4 |
0.8 |
0.9 |
0.9 |
0.9 |
0.8 |
0.8 |
0.8 |
0.9 |
1.0 |
1.0 |
GLP-1 |
0.0 |
0.0 |
0.0 |
0.0 |
0.0 |
0.0 |
0.0 |
0.0 |
0.0 |
0.1 |
|
SGLT-2 |
0.0 |
0.0 |
0.0 |
0.0 |
0.1 |
0.2 |
0.2 |
0.3 |
0.3 |
0.5 |
|
Norway (11) |
DPP-4 |
0.4 |
0.4 |
0.5 |
0.6 |
0.7 |
0.8 |
0.8 |
0.9 |
0.8 |
0.8 |
GLP-1 |
0.0 |
0.0 |
0.0 |
0.0 |
0.0 |
0.0 |
0.0 |
0.0 |
0.0 |
0.0 |
|
SGLT-2 |
0.0 |
0.0 |
0.0 |
0.1 |
0.1 |
0.2 |
0.3 |
0.4 |
0.5 |
0.6 |
|
Spain (11) |
DPP-4 |
0.5 |
0.6 |
0.7 |
0.7 |
0.8 |
0.8 |
0.9 |
0.9 |
0.9 |
0.9 |
GLP-1 |
0.0 |
0.0 |
0.0 |
0.0 |
0.0 |
0.0 |
0.0 |
0.0 |
0.0 |
0.0 |
|
SGLT-2 |
0.0 |
0.0 |
0.0 |
0.0 |
0.1 |
0.2 |
0.2 |
0.3 |
0.4 |
0.5 |
|
Sweden (7/11) |
DPP-4 |
0.2 |
0.3 |
0.4 |
0.5 |
0.6 |
0.8 |
0.9 |
1.0 |
1.0 |
1.0 |
GLP-1 |
0.0 |
0.0 |
0.0 |
0.0 |
0.0 |
0.0 |
0.0 |
0.0 |
0.0 |
0.1 |
|
SGLT-2 |
0.0 |
0.0 |
0.0 |
0.1 |
0.1 |
0.2 |
0.4 |
0.6 |
0.8 |
1.1 |
|
United Kingdom (7/11) |
DPP-4 |
0.2 |
0.3 |
0.4 |
0.5 |
0.7 |
0.7 |
0.8 |
0.9 |
0.9 |
0.9 |
GLP-1 |
0.0 |
0.0 |
0.0 |
0.0 |
0.0 |
0.0 |
0.0 |
0.0 |
0.0 |
0.0 |
|
SGLT-2 |
0.0 |
0.0 |
0.0 |
0.0 |
0.2 |
0.3 |
0.3 |
0.4 |
0.6 |
0.7 |
|
| B: Cost Index | |||||||||||
|---|---|---|---|---|---|---|---|---|---|---|---|
| Country | Class | 2012 | 2013 | 2014 | 2015 | 2016 | 2017 | 2018 | 2019 | 2020 | 2021 |
Canada |
DPP-4 |
0.2 |
0.3 |
0.4 |
0.5 |
0.5 |
0.6 |
0.7 |
0.7 |
0.7 |
0.7 |
GLP-1 |
0.1 |
0.1 |
0.1 |
0.1 |
0.1 |
0.1 |
0.2 |
0.3 |
0.5 |
0.7 |
|
SGLT-2 |
0.0 |
0.0 |
0.0 |
0.1 |
0.2 |
0.2 |
0.3 |
0.4 |
0.6 |
0.7 |
|
Australia (11) |
DPP-4 |
0.4 |
0.5 |
0.4 |
0.4 |
0.5 |
0.6 |
0.6 |
0.6 |
0.6 |
0.7 |
GLP-1 |
0.1 |
0.1 |
0.1 |
0.1 |
0.1 |
0.2 |
0.2 |
0.3 |
0.4 |
0.7 |
|
SGLT-2 |
0.0 |
0.0 |
0.0 |
0.1 |
0.2 |
0.3 |
0.4 |
0.5 |
0.6 |
0.7 |
|
Belgium (11) |
DPP-4 |
0.3 |
0.4 |
0.4 |
0.4 |
0.5 |
0.5 |
0.5 |
0.5 |
0.5 |
0.5 |
GLP-1 |
0.1 |
0.2 |
0.2 |
0.3 |
0.3 |
0.4 |
0.4 |
0.4 |
0.6 |
0.9 |
|
SGLT-2 |
0.0 |
0.0 |
0.0 |
0.0 |
0.1 |
0.1 |
0.2 |
0.4 |
0.5 |
0.6 |
|
France (7/11) |
DPP-4 |
0.6 |
0.6 |
0.7 |
0.7 |
0.6 |
0.6 |
0.6 |
0.6 |
0.6 |
0.6 |
GLP-1 |
0.2 |
0.3 |
0.3 |
0.3 |
0.4 |
0.4 |
0.5 |
0.6 |
0.7 |
0.8 |
|
SGLT-2 |
0.0 |
0.0 |
0.0 |
0.0 |
0.0 |
0.0 |
0.0 |
0.0 |
0.0 |
0.1 |
|
Germany (7/11) |
DPP-4 |
0.4 |
0.5 |
0.6 |
0.6 |
0.6 |
0.6 |
0.6 |
0.6 |
0.6 |
0.6 |
GLP-1 |
0.1 |
0.1 |
0.1 |
0.2 |
0.2 |
0.2 |
0.3 |
0.4 |
0.5 |
0.6 |
|
SGLT-2 |
0.0 |
0.0 |
0.0 |
0.1 |
0.1 |
0.2 |
0.3 |
0.3 |
0.5 |
0.6 |
|
Italy (7/11) |
DPP-4 |
0.2 |
0.4 |
0.4 |
0.4 |
0.5 |
0.6 |
0.6 |
0.7 |
0.7 |
0.6 |
GLP-1 |
0.1 |
0.2 |
0.2 |
0.2 |
0.2 |
0.3 |
0.4 |
0.6 |
0.8 |
1.1 |
|
SGLT-2 |
0.0 |
0.0 |
0.0 |
0.0 |
0.1 |
0.2 |
0.2 |
0.3 |
0.4 |
0.5 |
|
Japan (11) |
DPP-4 |
0.5 |
0.6 |
0.6 |
0.7 |
0.8 |
0.7 |
0.7 |
0.7 |
0.7 |
0.6 |
GLP-1 |
0.0 |
0.0 |
0.0 |
0.0 |
0.1 |
0.1 |
0.1 |
0.1 |
0.2 |
0.2 |
|
SGLT-2 |
0.0 |
0.0 |
0.0 |
0.1 |
0.1 |
0.2 |
0.3 |
0.4 |
0.5 |
0.5 |
|
Netherlands (11) |
DPP-4 |
0.4 |
0.5 |
0.5 |
0.5 |
0.5 |
0.4 |
0.5 |
0.5 |
0.6 |
0.6 |
GLP-1 |
0.3 |
0.4 |
0.4 |
0.4 |
0.4 |
0.4 |
0.5 |
0.8 |
1.2 |
1.5 |
|
SGLT-2 |
0.0 |
0.0 |
0.0 |
0.0 |
0.1 |
0.1 |
0.2 |
0.2 |
0.3 |
0.4 |
|
Norway (11) |
DPP-4 |
0.2 |
0.3 |
0.3 |
0.4 |
0.4 |
0.4 |
0.5 |
0.5 |
0.5 |
0.5 |
GLP-1 |
0.1 |
0.2 |
0.2 |
0.2 |
0.3 |
0.3 |
0.4 |
0.5 |
0.7 |
1.1 |
|
SGLT-2 |
0.0 |
0.0 |
0.1 |
0.1 |
0.1 |
0.2 |
0.3 |
0.3 |
0.4 |
0.6 |
|
Spain (11) |
DPP-4 |
0.4 |
0.5 |
0.5 |
0.6 |
0.7 |
0.7 |
0.8 |
0.7 |
0.7 |
0.7 |
GLP-1 |
0.0 |
0.1 |
0.1 |
0.1 |
0.1 |
0.2 |
0.2 |
0.2 |
0.3 |
0.4 |
|
SGLT-2 |
0.0 |
0.0 |
0.0 |
0.0 |
0.1 |
0.2 |
0.2 |
0.3 |
0.4 |
0.5 |
|
Sweden (7/11) |
DPP-4 |
0.1 |
0.2 |
0.2 |
0.2 |
0.3 |
0.4 |
0.4 |
0.5 |
0.5 |
0.5 |
GLP-1 |
0.1 |
0.2 |
0.2 |
0.3 |
0.4 |
0.5 |
0.6 |
0.8 |
1.1 |
1.4 |
|
SGLT-2 |
0.0 |
0.0 |
0.0 |
0.0 |
0.1 |
0.2 |
0.3 |
0.4 |
0.5 |
0.7 |
|
United Kingdom (7/11) |
DPP-4 |
0.2 |
0.2 |
0.3 |
0.4 |
0.5 |
0.5 |
0.6 |
0.6 |
0.7 |
0.7 |
GLP-1 |
0.1 |
0.2 |
0.2 |
0.2 |
0.2 |
0.3 |
0.3 |
0.4 |
0.4 |
0.5 |
|
SGLT-2 |
0.0 |
0.0 |
0.0 |
0.0 |
0.2 |
0.2 |
0.3 |
0.4 |
0.5 |
0.6 |
|
Data source: IQVIA MIDAS® Database, prescription retail and hospital markets (data extracted in Q4-2022). All rights reserved.
3.3 Canadian payers
This subsection looks at changes in antidiabetic drug spending by provincial (public) and private plans as well as out-of-pocket spending. The section begins with an overview of market share trends followed by an analysis of the three key cost drivers: utilization patterns, drug prices, and competition.
Who pays for drugs in Canada?
The administration and delivery of health care in Canada is a provincial responsibility subject to the provisions of the Canada Health Act (CHA)Footnote 8. Under the Act, provinces must provide access to doctor visits and hospital care without financial barriers but are not required to provide drug coverage outside the hospital setting. As a result, drug coverage varies across provinces, each with their own unique mix of public and private plans. Public plan coverage varies across provinces in terms of drugs covered (formulary listings), cost-sharing rules (co-pays, deductibles, and maximums), and populations covered. Finally, many Canadians incur out-of-pocket drug expenses (cash market) either because they have not met their plan’s deductible, a drug is not covered, or they are not covered by a plan.
The two examples below illustrate the policy approaches that govern major drug programs administered by provinces‡.
Example 1: First payer, universal approach. British Columbia’s Fair Pharmacare plan covers all residents regardless of age. Patient ability to pay is factored into the program with an income-based deductible (for example, the deductible is $2,000* for a family with a net income of $67,500†). Spending on eligible drugs (listed on the formulary) are applied toward this deductible regardless of payment source, whether paid through a private insurer or out-of-pocket.
Example 2: Population-defined, mixed approach. Program eligibility in the Ontario Drug Benefit program is defined according to set criteria. It is the first payer for seniors (≥65), social assistance recipients, and people aged 24 and younger without private coverage. Cost sharing is low and only seniors that do not meet the “low-income” threshold are required to meet a $100 deductible. Residents facing substantial drug costs may be eligible for the Trillium drug program if they meet an income-based deductible. While this deductible is similar in size to the one in British Columbia, it is administered as a “last payer” which means that only out-of-pocket expenses are applied to the deductible.
Notes:
* Deductible amount specified in the Fair PharmaCare assistance levels table (consulted January 2023).
† $67,500 is the “Median after-tax income, economic families and persons not in an economic family” for British Columbia in 2020 as reported by Statistics Canada.
‡ The examples provided are the largest programs; they are not an exhaustive list.
For all market segments and across all jurisdictions, growth in antidiabetic drug spending has outpaced the growth in the overall drug market, resulting in an increased share for antidiabetic drugs (see Figure 3.8). Results across market segments and jurisdictions only vary in the size of this change over time. Nationally (Chart A), the overall retail market reached a 10% market share, and provincially (Chart B) some jurisdictions approached 15%.
Figure 3.8 Antidiabetic share of total drug market, 2012-2021

Figure description
This figure shows two bar graphs that illustrate the trend in share of antidiabetic drug costs relative to total drug costs by market and year from 2012 to 2021. The bar graph (A) shows national results for specific market segments.
A: National averages
| 2012 | 2013 | 2014 | 2015 | 2016 | 2017 | 2018 | 2019 | 2020 | 2021 | |
|---|---|---|---|---|---|---|---|---|---|---|
National, retail & hospital |
4% |
5% |
5% |
5% |
6% |
6% |
6% |
7% |
7% |
8% |
National, retail |
0% |
5% |
6% |
6% |
7% |
7% |
8% |
8% |
9% |
10% |
Public drug plans |
6% |
7% |
7% |
8% |
8% |
9% |
9% |
10% |
11% |
12% |
Private drug plans |
5% |
6% |
6% |
6% |
7% |
8% |
9% |
9% |
9% |
10% |
Cash Market |
0% |
4% |
4% |
4% |
4% |
4% |
5% |
5% |
6% |
7% |
Data sources (data extracted in Q4-2022):
- National, retail and hospital: IQVIA MIDAS® Database, all rights reserved.
- National, retail: IQVIA Payer Insights Database
- Public drug plans: National Prescription Drug Utilization Information System Database, Canadian Institute for Health Information. National average does not include Quebec (see Methods section). Quebec shares in Chart B are estimated from IQVIA Payer Insights Database
- Private drug plans: IQVIA Private Pay Direct Drug Plan Database
- Cash market: IQVIA Payer Insights Database
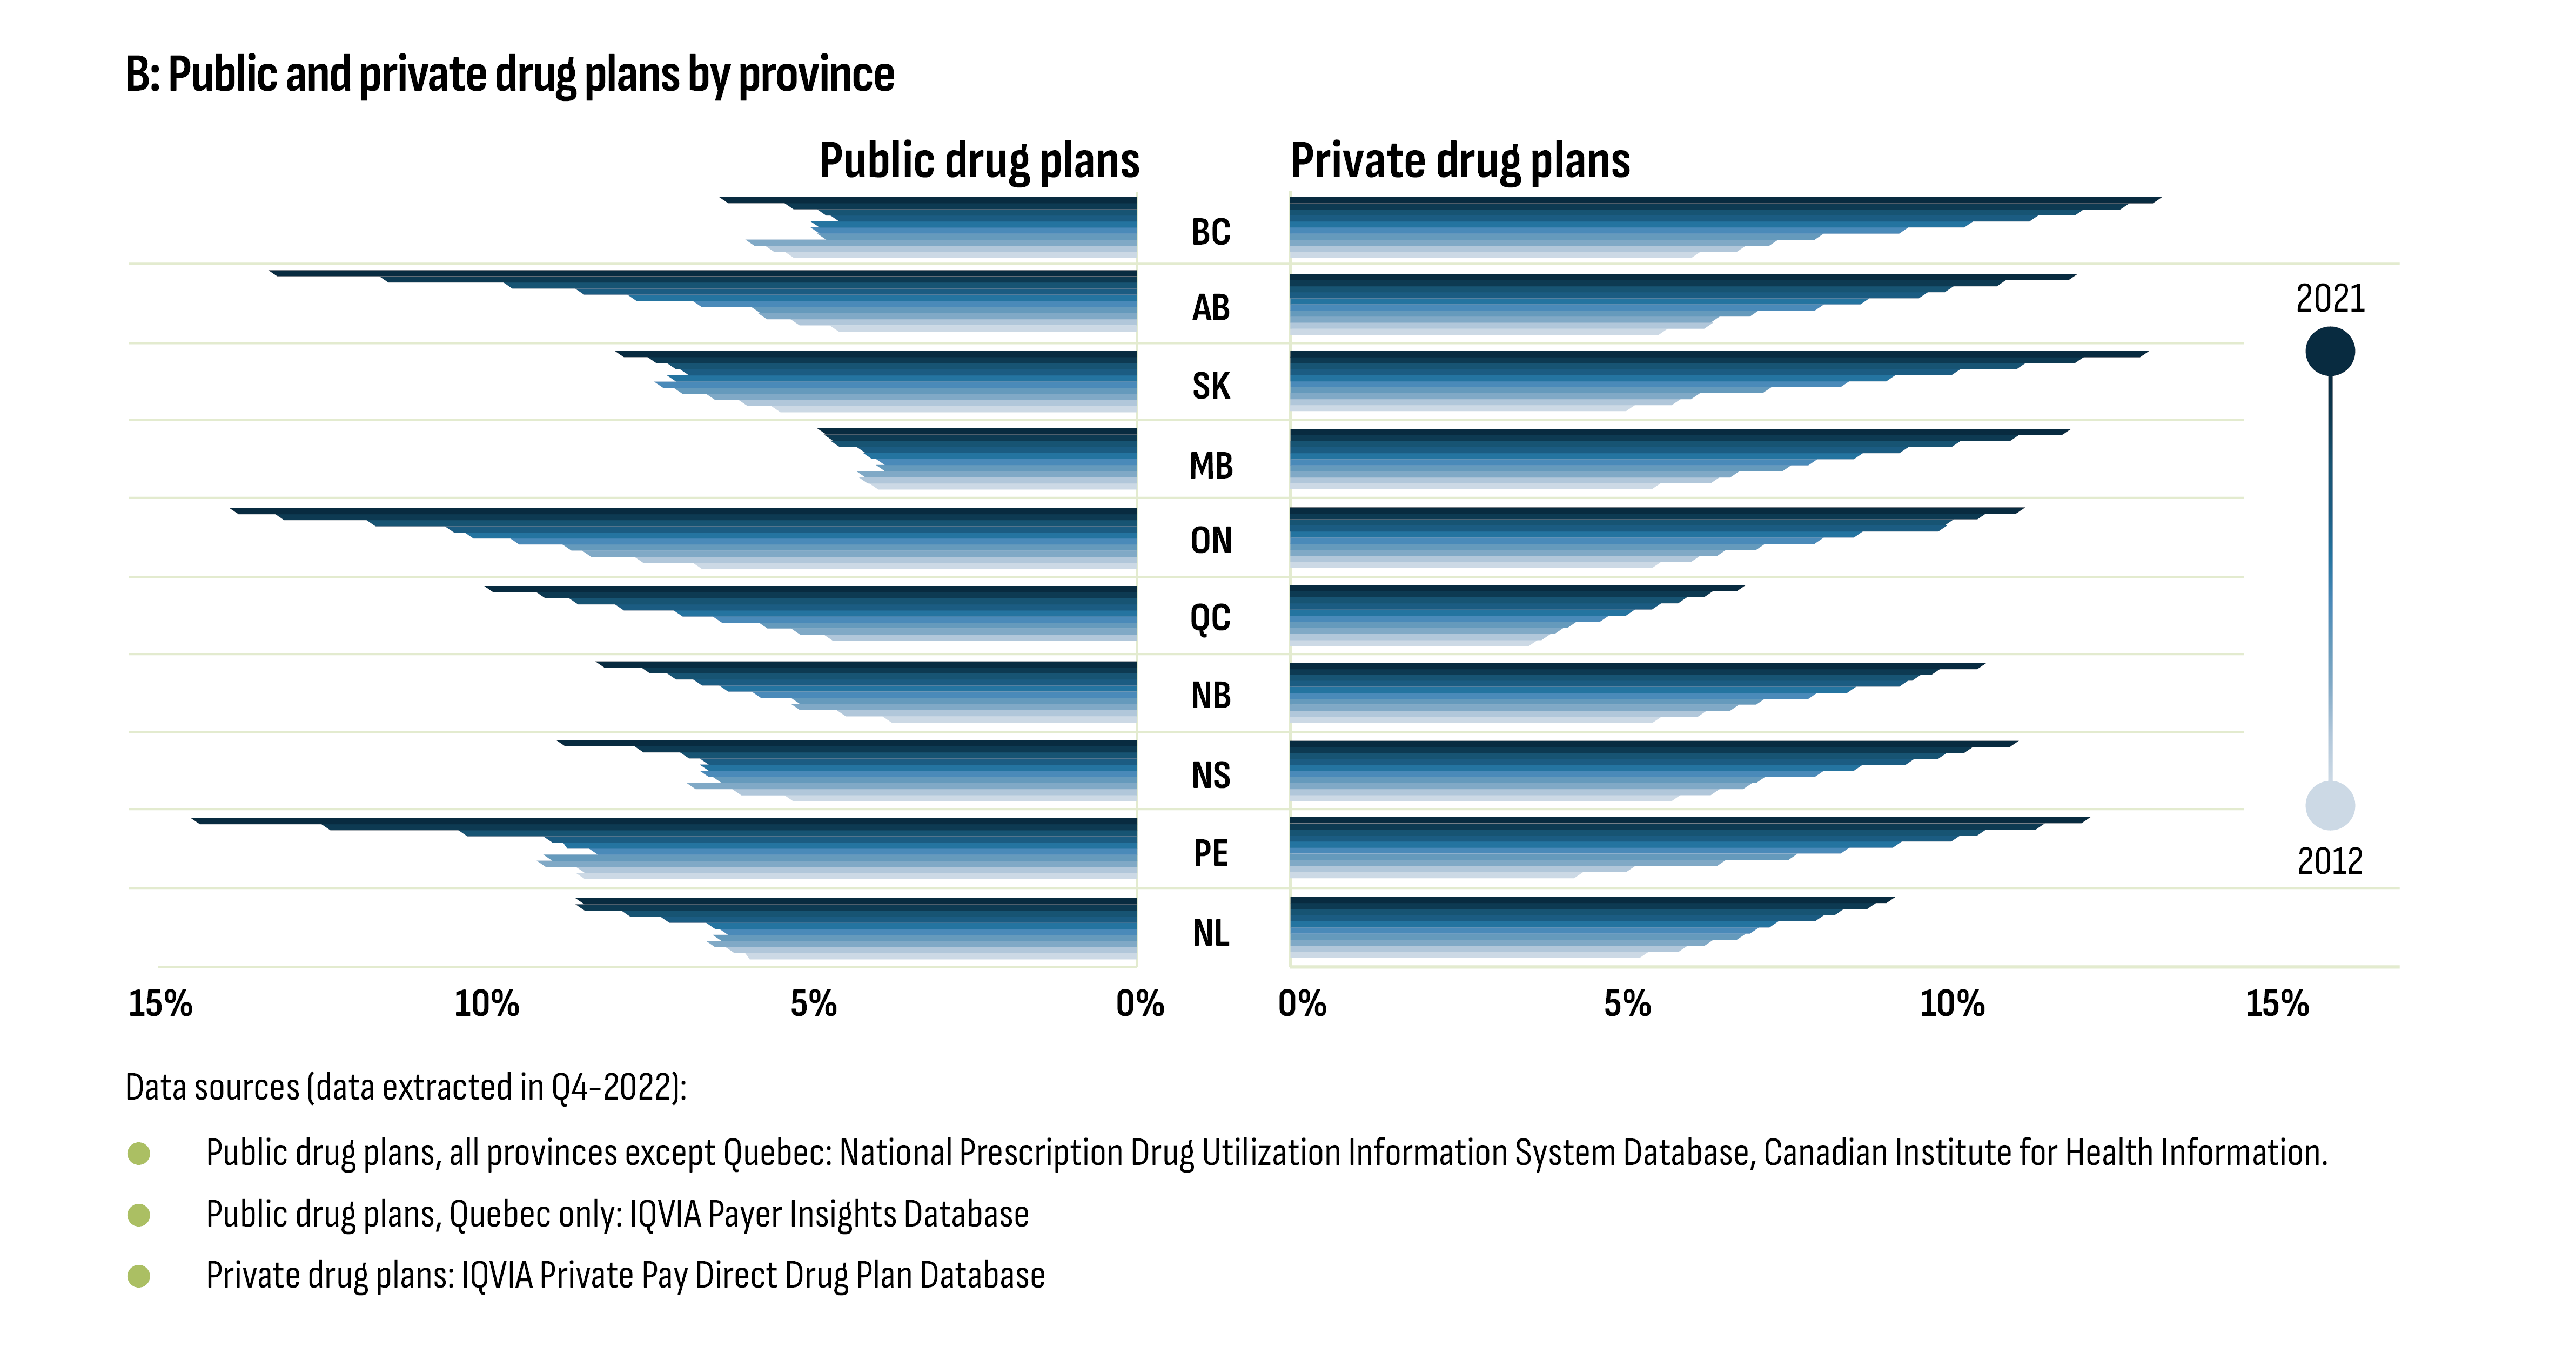
Figure description
This figure shows two bar graphs that illustrate the trend in share of antidiabetic drug costs relative to total drug costs by market and year from 2012 to 2021. The bar graph (B) shows results by province for public plans and private plans.
B: Public and private drug plans by province
| Public Drug Plans | |||||||||||||||||
|---|---|---|---|---|---|---|---|---|---|---|---|---|---|---|---|---|---|
| 2012 | 2013 | 2014 | 2015 | 2016 | 2017 | 2018 | 2019 | 2020 | 2021 | ||||||||
BC |
5% |
6% |
6% |
5% |
5% |
5% |
5% |
5% |
5% |
6% |
|||||||
AB |
5% |
5% |
6% |
6% |
7% |
8% |
9% |
10% |
12% |
13% |
|||||||
SK |
6% |
6% |
7% |
7% |
7% |
7% |
7% |
7% |
8% |
8% |
|||||||
MB |
4% |
4% |
4% |
4% |
4% |
4% |
4% |
5% |
5% |
5% |
|||||||
ON |
7% |
8% |
8% |
9% |
10% |
10% |
11% |
12% |
13% |
14% |
|||||||
QC |
NA |
5% |
5% |
6% |
7% |
7% |
8% |
9% |
9% |
10% |
|||||||
NB |
4% |
5% |
5% |
5% |
6% |
6% |
7% |
7% |
8% |
8% |
|||||||
NS |
5% |
6% |
7% |
7% |
7% |
7% |
7% |
7% |
8% |
9% |
|||||||
PE |
9% |
9% |
9% |
9% |
8% |
9% |
9% |
10% |
12% |
15% |
|||||||
NL |
6% |
6% |
7% |
6% |
6% |
7% |
7% |
8% |
9% |
9% |
|||||||
| Private Drug Plans | |||||||||||||||||
BC |
6% |
7% |
7% |
8% |
9% |
10% |
12% |
12% |
13% |
13% |
|||||||
AB |
6% |
6% |
7% |
7% |
8% |
9% |
10% |
10% |
11% |
12% |
|||||||
SK |
5% |
6% |
6% |
7% |
9% |
9% |
10% |
11% |
12% |
13% |
|||||||
MB |
6% |
7% |
7% |
8% |
8% |
9% |
10% |
10% |
11% |
12% |
|||||||
ON |
6% |
6% |
7% |
7% |
8% |
9% |
10% |
10% |
11% |
11% |
|||||||
QC |
4% |
4% |
4% |
4% |
5% |
5% |
6% |
6% |
7% |
7% |
|||||||
NB |
6% |
6% |
7% |
7% |
8% |
9% |
10% |
10% |
10% |
11% |
|||||||
NS |
6% |
7% |
7% |
7% |
8% |
9% |
10% |
10% |
11% |
11% |
|||||||
PE |
4% |
5% |
7% |
8% |
9% |
9% |
10% |
11% |
12% |
12% |
|||||||
NL |
5% |
6% |
7% |
7% |
7% |
8% |
8% |
9% |
9% |
9% |
|||||||
Data sources (data extracted in Q4-2022):
- Public drug plans, all provinces except Quebec: National Prescription Drug Utilization Information System Database, Canadian Institute for Health Information.
- Public drug plans, Quebec only: IQVIA Payer Insights Database
- Private drug plans: IQVIA Private Pay Direct Drug Plan Database
While spending on antidiabetic drugs has outpaced the growth in the overall drug market, public drug programs have continued to cover roughly half of the spending on this class every year. As shown in Figure 3.9 (Chart A), overall share of spending by public plans was 51% in 2013, falling to 49% in 2015 and 2016, and remained at 52% from 2019 to 2021. This occurred while public spending on all drugs declined steadily from 48% in 2013 to 44% in 2021. At the subclass level, the increase in the public share of GLP-1’ and SGLT-2’s reflects the evolution of formulary listing decisions. Finally, the public sector share of spending by province (Figure 3.9, Chart B) is reflective of provincial plan eligibility criteria and drug coverage (see text box: Who pays for drugs in Canada?).
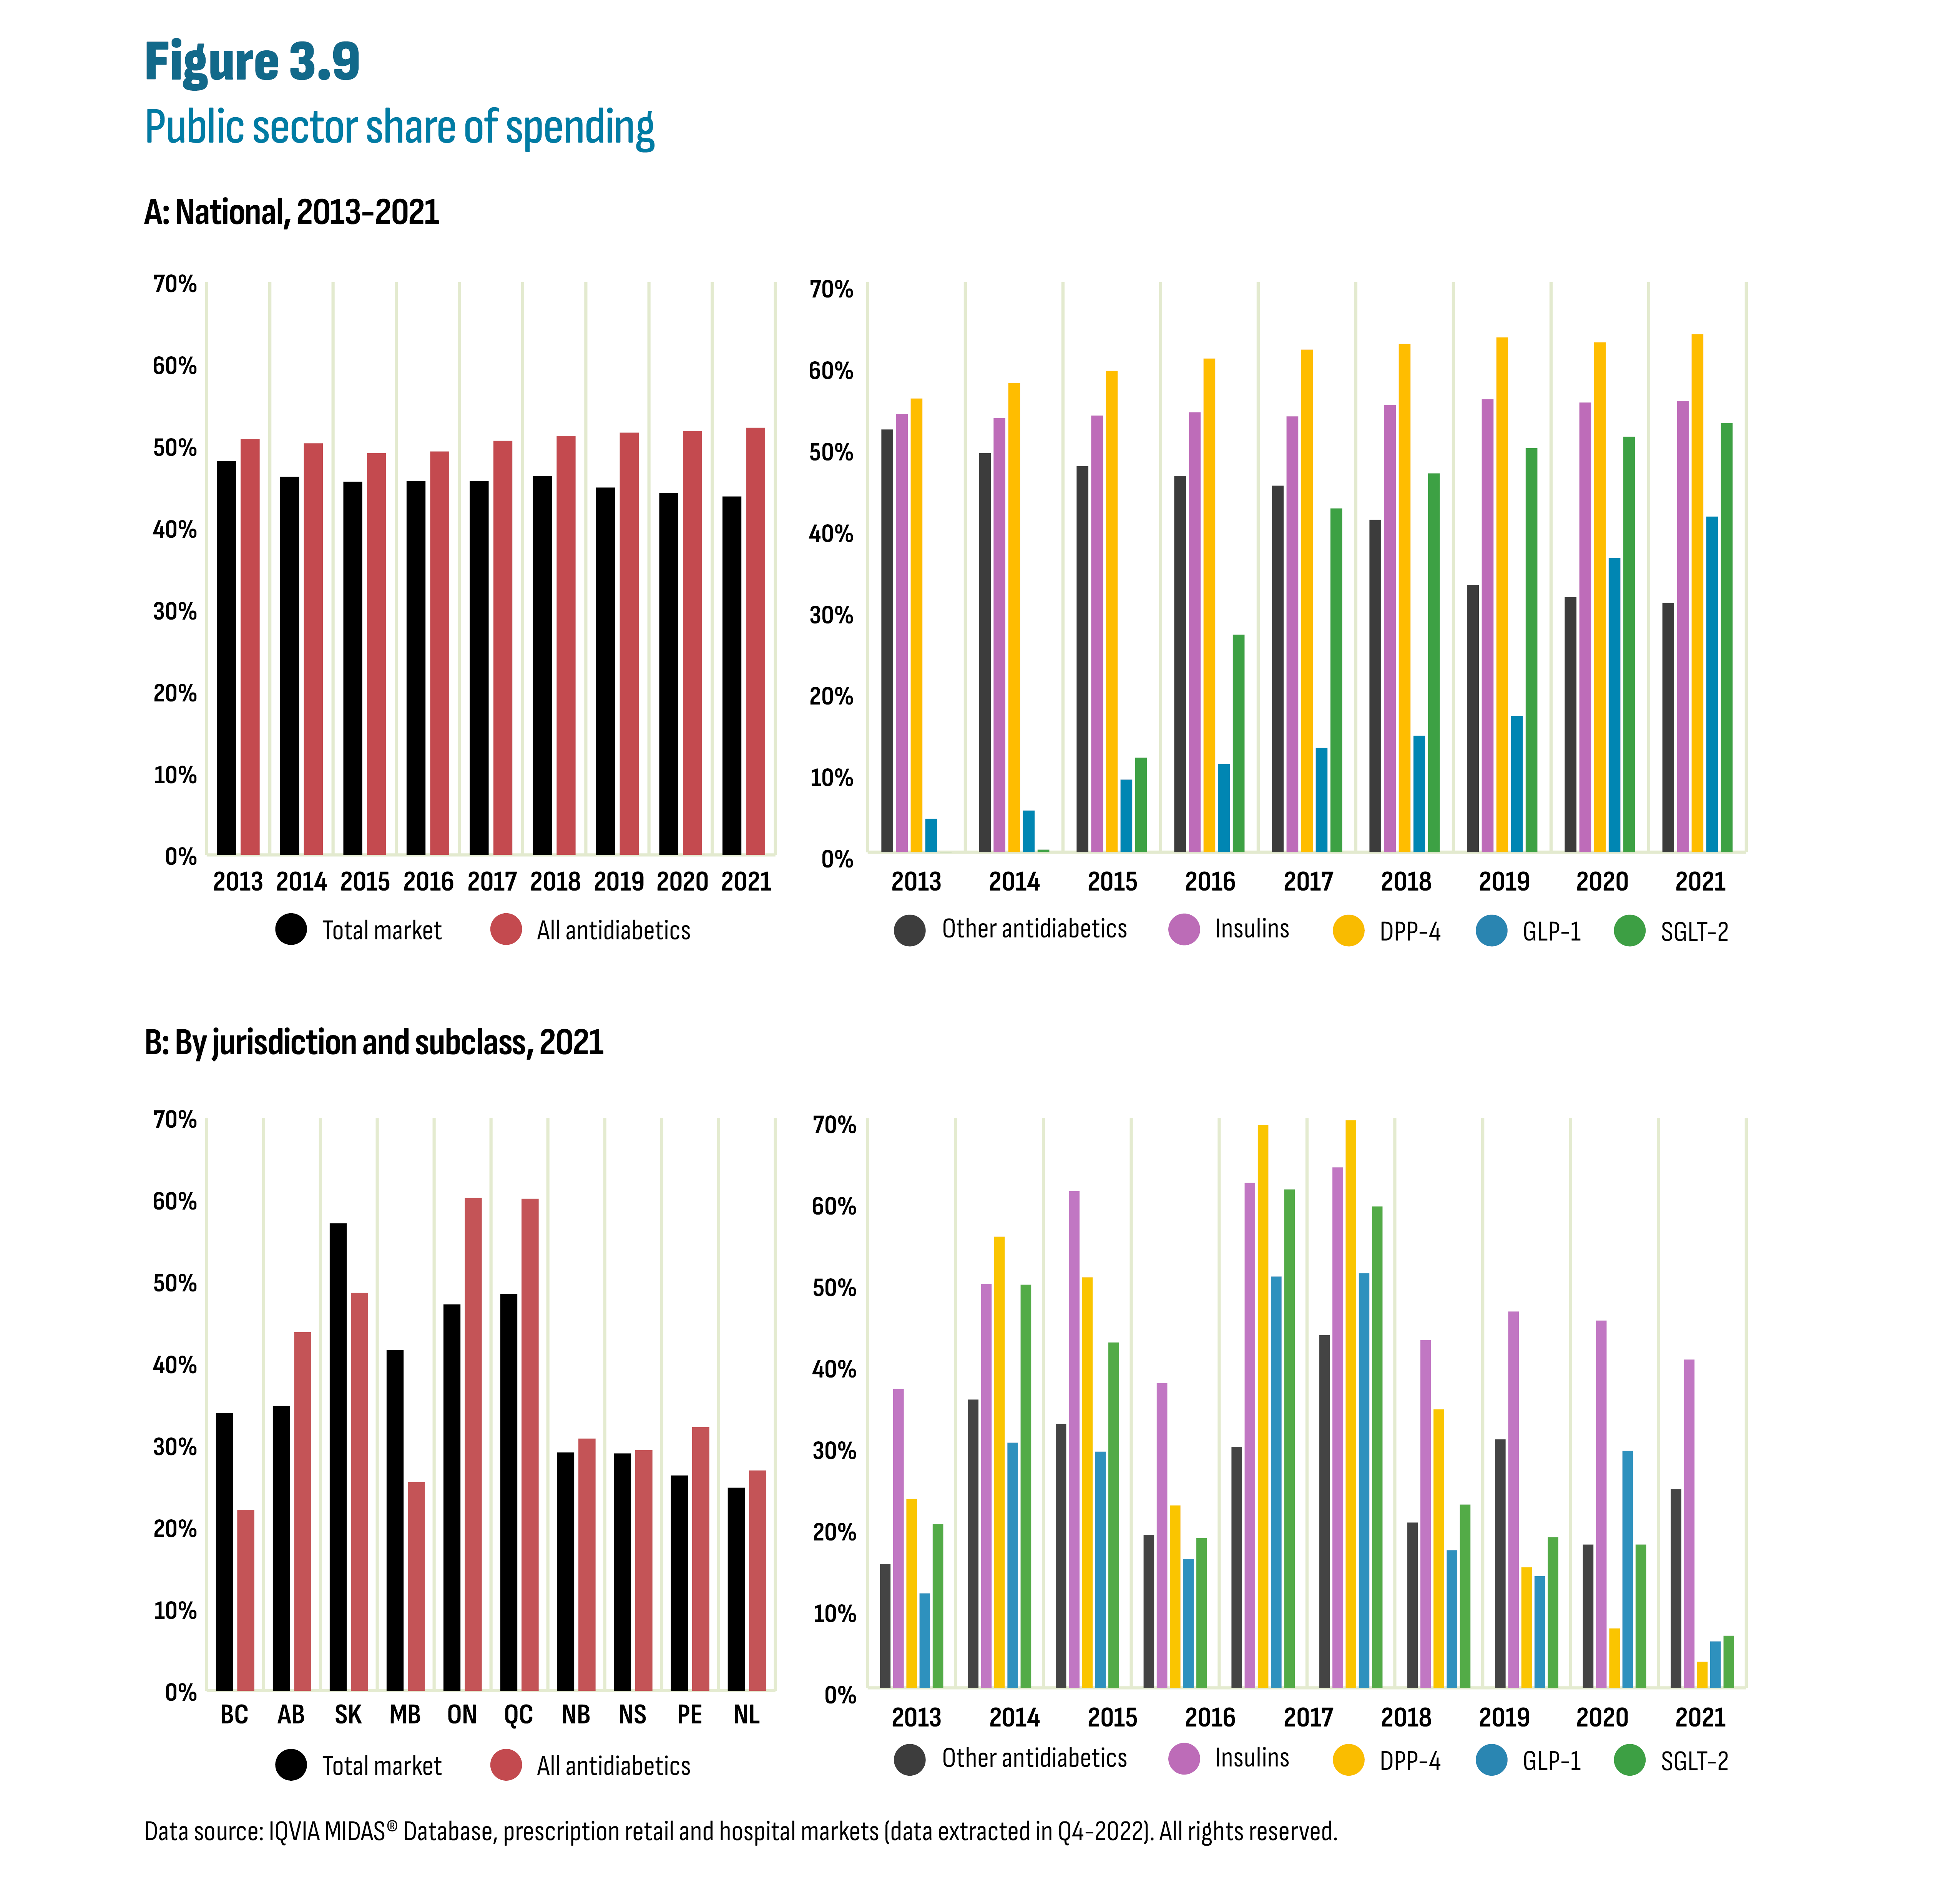
Figure description
This figure shows the public sector share of spending on drugs. The first graph shows the share by class and by year. The second graph shows the share in 2021 by class and by jurisdiction.
| A: National, time series 2013-2021 | |||||||||
|---|---|---|---|---|---|---|---|---|---|
| 2013 | 2014 | 2015 | 2016 | 2017 | 2018 | 2019 | 2020 | 2021 | |
Total market |
48% |
46% |
46% |
46% |
46% |
46% |
45% |
44% |
44% |
All antidiabetics |
51% |
50% |
49% |
49% |
51% |
51% |
52% |
52% |
52% |
Other antidiabetics |
52% |
49% |
47% |
46% |
45% |
41% |
33% |
31% |
31% |
Insulins |
54% |
53% |
54% |
54% |
54% |
55% |
56% |
55% |
55% |
DPP-4 |
56% |
58% |
59% |
61% |
62% |
62% |
63% |
63% |
64% |
GLP-1 |
4% |
5% |
9% |
11% |
13% |
14% |
17% |
36% |
41% |
SGLT-2 |
0% |
0% |
12% |
27% |
42% |
46% |
50% |
51% |
53% |
| B: By jurisdiction and subclass, 2021 | ||||||||||
|---|---|---|---|---|---|---|---|---|---|---|
| BC | AB | SK | MB | ON | QC | NB | NS | PE | NL | |
Total market |
22% |
44% |
49% |
25% |
60% |
60% |
31% |
29% |
32% |
27% |
All antidiabetics |
34% |
35% |
57% |
42% |
47% |
49% |
29% |
29% |
26% |
25% |
Other antidiabetics |
15% |
35% |
32% |
19% |
30% |
43% |
20% |
30% |
18% |
24% |
Insulins |
37% |
50% |
61% |
37% |
62% |
64% |
43% |
46% |
45% |
40% |
DPP-4 |
23% |
55% |
50% |
22% |
69% |
70% |
34% |
15% |
7% |
3% |
GLP-1 |
12% |
30% |
29% |
16% |
50% |
51% |
17% |
14% |
29% |
6% |
SGLT-2 |
20% |
50% |
42% |
18% |
61% |
59% |
22% |
19% |
18% |
6% |
Data source: IQVIA Payer Insights Database (data extracted in Q4-2022).
Figures 3.10 and 3.11 show utilization patterns at the provincial level for both public and private drug plans from 2012 to 2021. In both cases, standardization metrics were calculated to better compare trends and market shares across jurisdictions. Data in Figure 3.10 are standardized according to each plan’s spending on metformin (first-line drug therapy for type 2 diabetes). In other words: “For every dollar spent on metformin in 2017, how much did the program spend on other drugs and how did this change over time?” Alternately, data in Figure 3.11 focus exclusively on utilization by analysing claims (paid prescriptions) rather than costs. The results are shown as a series of ten clustered stacked columns which have been indexed where total claims are set to one in 2017 (see Appendix A: Methodology Notes).
For each dollar spent on metformin in 2017, the new-generation/non-insulin drugs saw the greatest increases for both public and private drug plans (Figure 3.10). The greatest increase was for Ontario’s public drug plan, a result consistent with the plan’s decision to list DPP-4’s, GLP-1’s, and SGLT-2’s as open benefits rather than restricting access as is the case in all other provincial programs. For every dollar of metformin spent in 2017, Ontario spent $47 on new-generation/non-insulin drugs in 2021, nearly double Alberta’s $25 spending and triple New Brunswick’s $15 spending. Spending on GLP-1’s was virtually non-existent in provincial plans for most of the period analysed until some provinces listed semaglutide (Ozempic). However, this subclass accounted for a larger market share in the private drug plans where access was generally less restricted. There has been considerable media attention concerning the extent to which semaglutide (Ozempic) is being prescribed off-label for weight loss. However, administrative databases do not include the reason for prescribing and this issue was not evaluated. Finally, insulin remained relatively stable, as a result of the market entry of degludec (Tresiba); biosimilar policies related to insulin glargine (Lantus); and changes in formulary status for long-acting insulins. These are explored later in this subsection.
An analysis of claims (paid prescriptions) in Figure 3.11 reveals similar patterns and confirms that the growth in GLP-1’s is not solely driven by the cost of these drugs. In the public sector, the entry of SGLT-2’s coincides with a slowing rate of growth in DPP-4’s well before the listing of semaglutide (Ozempic) but the latter likely contributed to further market erosion of the DPP-4 subclass. Finally, growth in SGLT-2’s is likely driven by both patients with and without a diabetes diagnosis as these drugs are also indicated for heart failure.
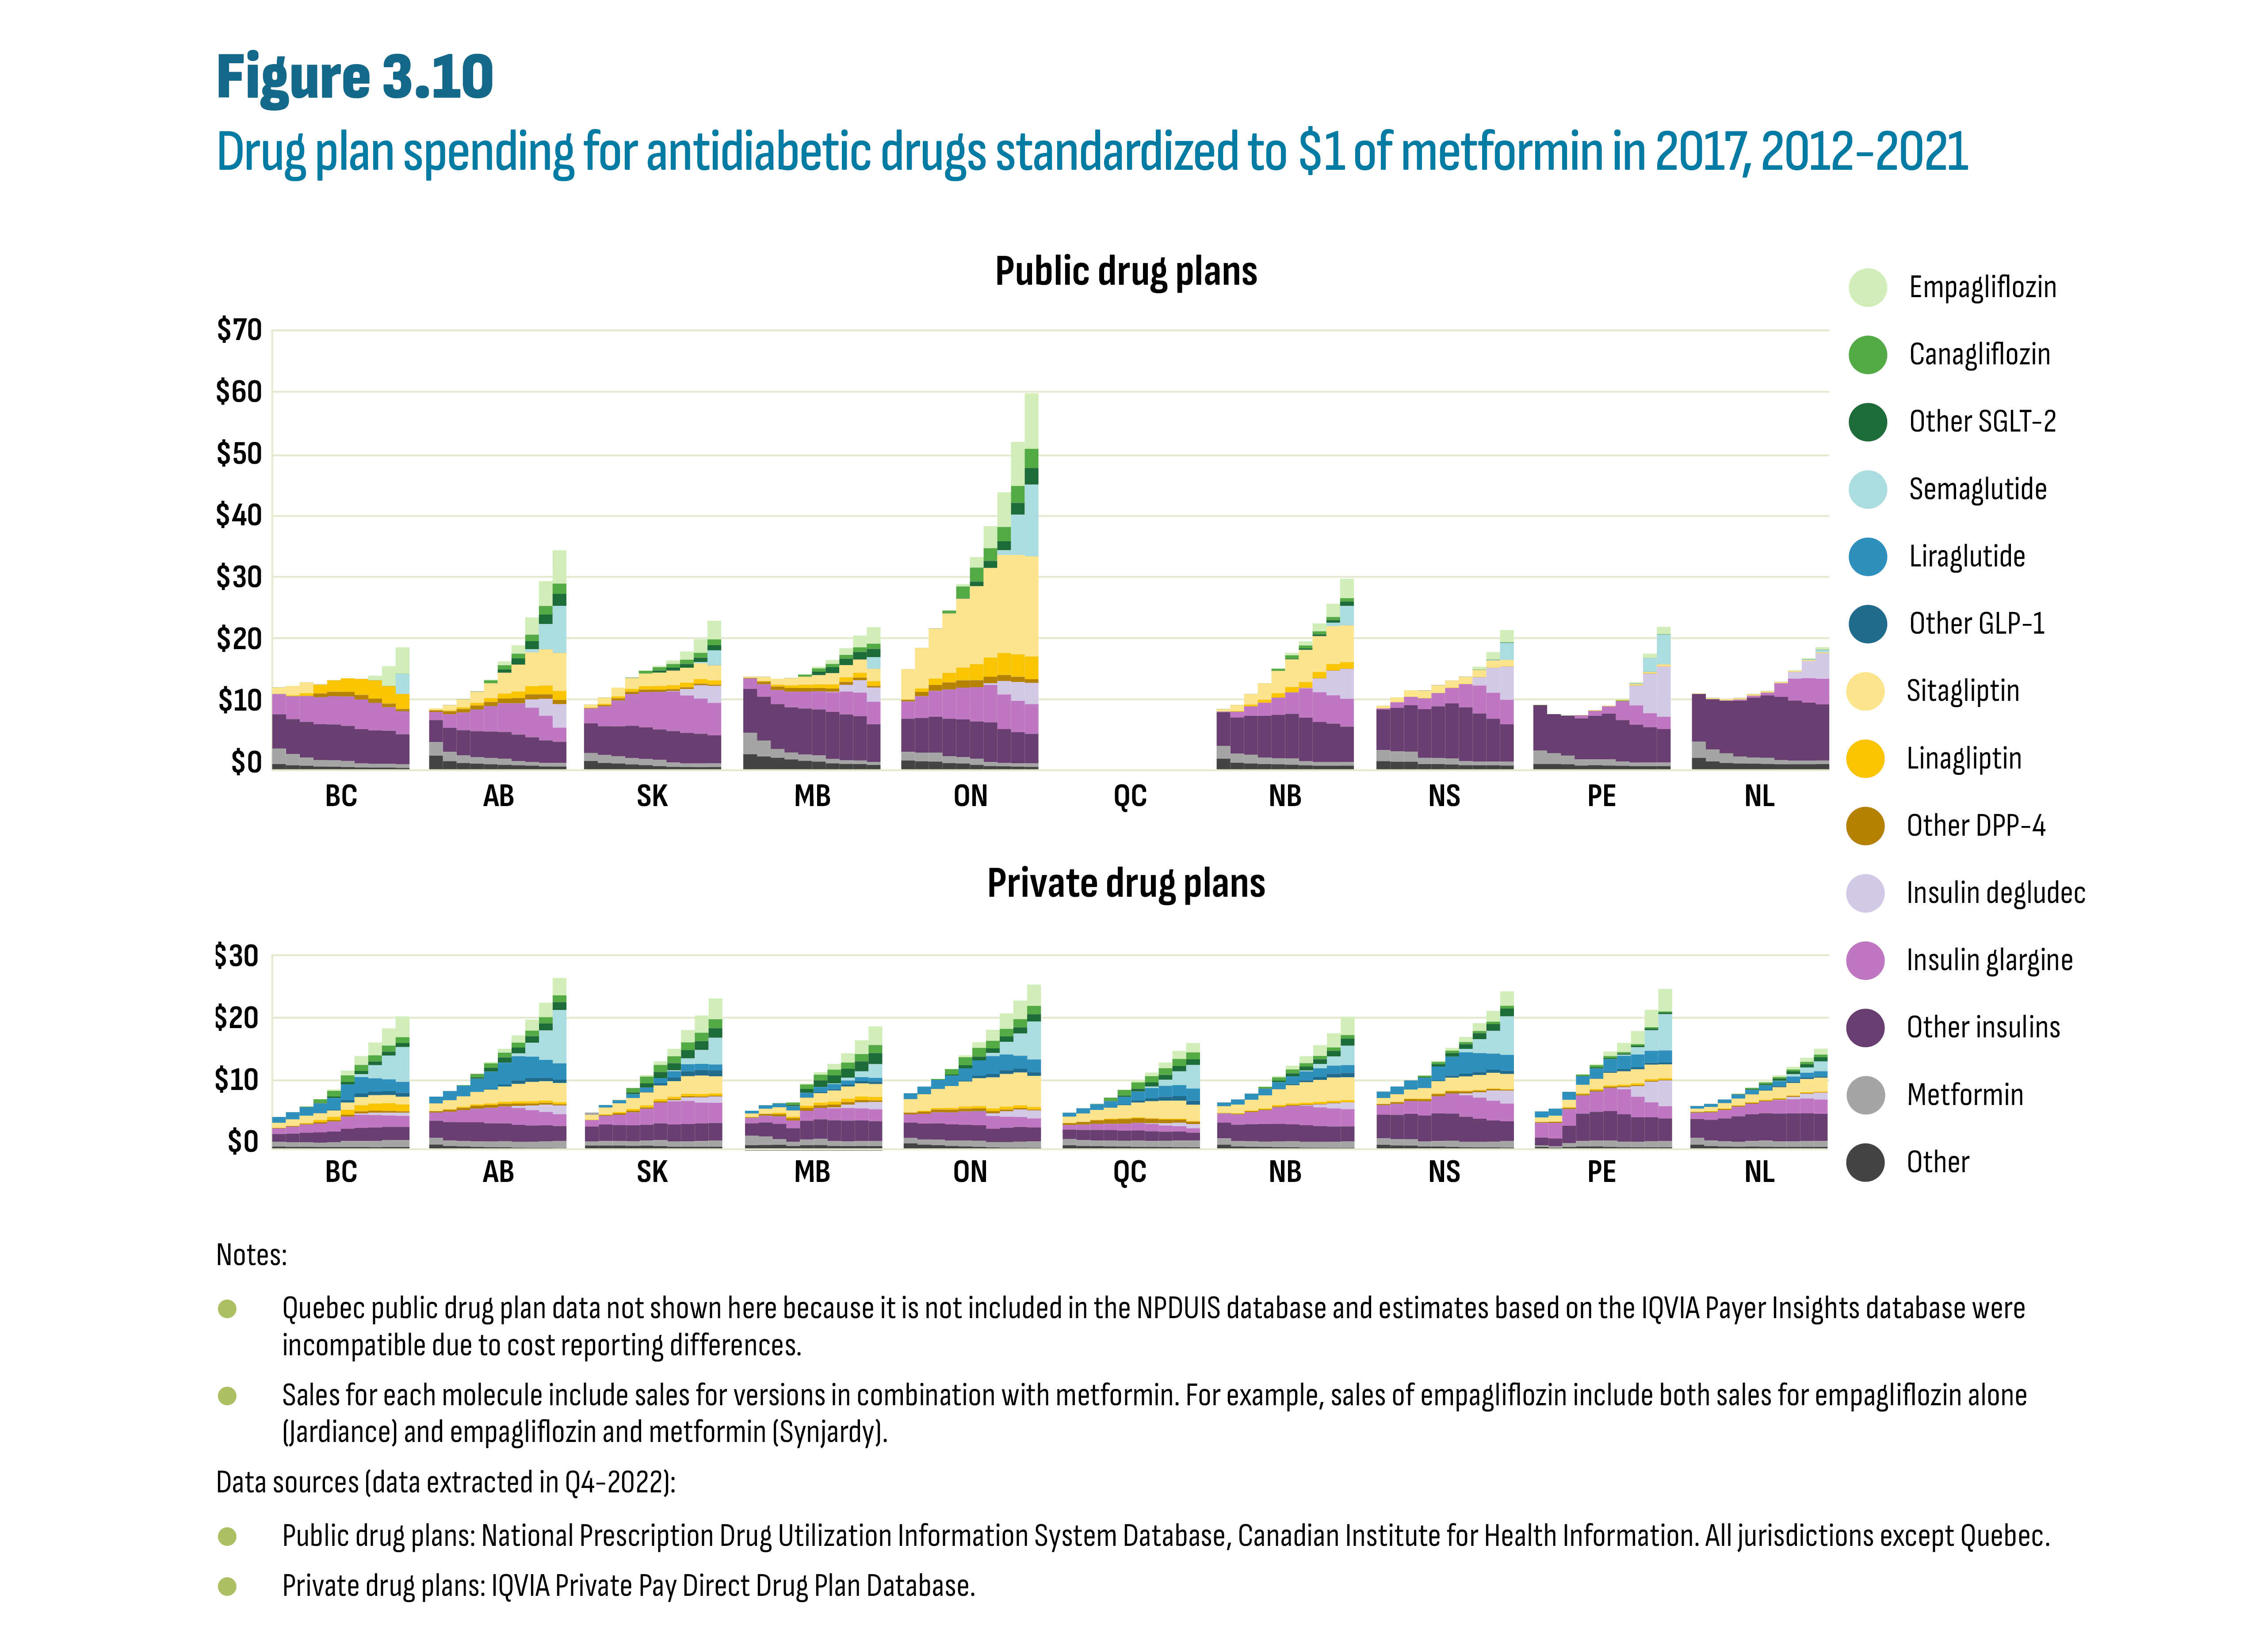
Figure description
This figure shows two stacked column graphs that show drug plan expenditures standardized to $1 of metformin in 2017 from 2012 to 2021. The data are shown by drugs and drug classes, by jurisdiction. The first graph shows the data for public drug plans and the second graph shows the data for private drug plans.
Notes:
- Quebec public drug plan data not shown here because it is not included in the NPDUIS database and estimates based on the IQVIA Payer Insights database were incompatible due to cost reporting differences.
- Sales for each molecule include sales for versions in combination with metformin. For example, sales of empagliflozin include both sales for empagliflozin alone (Jardiance) and empagliflozin and metformin (Synjardy).
| Public drug plans | |||||||||||
|---|---|---|---|---|---|---|---|---|---|---|---|
| 2012 | 2013 | 2014 | 2015 | 2016 | 2017 | 2018 | 2019 | 2020 | 2021 | ||
BC |
Empagliflozin |
$0.00 |
$0.00 |
$0.00 |
$0.00 |
$0.00 |
$0.00 |
$0.00 |
$0.77 |
$3.23 |
$4.27 |
Canagliflozin |
$0.00 |
$0.00 |
$0.00 |
$0.00 |
$0.00 |
$0.00 |
$0.00 |
$0.00 |
$0.00 |
$0.00 |
|
Other SGLT-2 |
$0.00 |
$0.00 |
$0.00 |
$0.00 |
$0.00 |
$0.00 |
$0.00 |
$0.00 |
$0.00 |
$0.00 |
|
Semaglutide |
$0.00 |
$0.00 |
$0.00 |
$0.00 |
$0.00 |
$0.00 |
$0.00 |
$0.00 |
$0.00 |
$3.26 |
|
Liraglutide |
$0.00 |
$0.00 |
$0.00 |
$0.00 |
$0.00 |
$0.00 |
$0.00 |
$0.00 |
$0.00 |
$0.00 |
|
Other GLP-1 |
$0.00 |
$0.00 |
$0.00 |
$0.00 |
$0.00 |
$0.00 |
$0.00 |
$0.00 |
$0.00 |
$0.00 |
|
Sitagliptin |
$1.07 |
$1.54 |
$1.75 |
$0.10 |
$0.01 |
$0.01 |
$0.01 |
$0.00 |
$0.00 |
$0.00 |
|
Linagliptin |
$0.02 |
$0.16 |
$0.42 |
$1.40 |
$1.86 |
$2.20 |
$2.59 |
$2.94 |
$2.83 |
$2.42 |
|
Other DPP-4 |
$0.00 |
$0.00 |
$0.07 |
$0.60 |
$0.73 |
$0.75 |
$0.75 |
$0.70 |
$0.58 |
$0.40 |
|
Insulin degludec |
$0.00 |
$0.00 |
$0.00 |
$0.00 |
$0.00 |
$0.00 |
$0.00 |
$0.00 |
$0.00 |
$0.00 |
|
Insulin glargine |
$3.26 |
$3.69 |
$4.15 |
$4.36 |
$4.56 |
$4.73 |
$4.80 |
$4.45 |
$3.81 |
$3.72 |
|
Other insulins |
$5.54 |
$5.64 |
$5.77 |
$5.81 |
$5.80 |
$5.67 |
$5.54 |
$5.41 |
$5.35 |
$4.85 |
|
Metformin |
$2.52 |
$1.82 |
$1.34 |
$1.05 |
$1.04 |
$1.00 |
$0.65 |
$0.60 |
$0.62 |
$0.58 |
|
Other |
$0.98 |
$0.80 |
$0.70 |
$0.58 |
$0.55 |
$0.50 |
$0.43 |
$0.41 |
$0.40 |
$0.36 |
|
AB |
Empagliflozin |
$0.00 |
$0.00 |
$0.00 |
$0.00 |
$0.13 |
$0.63 |
$1.37 |
$2.80 |
$4.00 |
$5.40 |
Canagliflozin |
$0.00 |
$0.00 |
$0.00 |
$0.06 |
$0.48 |
$0.70 |
$0.77 |
$1.05 |
$1.39 |
$1.66 |
|
Other SGLT-2 |
$0.00 |
$0.00 |
$0.00 |
$0.00 |
$0.00 |
$0.54 |
$0.99 |
$1.31 |
$1.55 |
$1.94 |
|
Semaglutide |
$0.00 |
$0.00 |
$0.00 |
$0.00 |
$0.00 |
$0.00 |
$0.00 |
$0.50 |
$4.10 |
$7.61 |
|
Liraglutide |
$0.00 |
$0.00 |
$0.00 |
$0.00 |
$0.00 |
$0.00 |
$0.00 |
$0.00 |
$0.00 |
$0.00 |
|
Other GLP-1 |
$0.00 |
$0.00 |
$0.00 |
$0.00 |
$0.00 |
$0.00 |
$0.00 |
$0.00 |
$0.00 |
$0.00 |
|
Sitagliptin |
$0.27 |
$0.86 |
$1.28 |
$1.80 |
$2.41 |
$3.34 |
$4.35 |
$5.45 |
$5.84 |
$6.15 |
|
Linagliptin |
$0.04 |
$0.15 |
$0.27 |
$0.43 |
$0.62 |
$0.83 |
$1.06 |
$1.35 |
$1.43 |
$1.48 |
|
Other DPP-4 |
$0.27 |
$0.47 |
$0.58 |
$0.66 |
$0.67 |
$0.77 |
$0.82 |
$0.81 |
$0.74 |
$0.67 |
|
Insulin degludec |
$0.00 |
$0.00 |
$0.00 |
$0.00 |
$0.00 |
$0.00 |
$0.04 |
$1.33 |
$2.72 |
$3.80 |
|
Insulin glargine |
$1.30 |
$2.20 |
$2.85 |
$3.49 |
$4.10 |
$4.63 |
$5.06 |
$4.79 |
$3.99 |
$2.29 |
|
Other insulins |
$3.59 |
$3.87 |
$4.06 |
$4.21 |
$4.31 |
$4.32 |
$4.29 |
$4.03 |
$3.64 |
$3.41 |
|
Metformin |
$2.20 |
$1.52 |
$1.25 |
$1.04 |
$0.99 |
$1.00 |
$0.68 |
$0.58 |
$0.58 |
$0.60 |
|
Other |
$2.33 |
$1.46 |
$1.15 |
$1.05 |
$0.96 |
$0.86 |
$0.78 |
$0.72 |
$0.60 |
$0.58 |
|
SK |
Empagliflozin |
$0.00 |
$0.00 |
$0.00 |
$0.00 |
$0.06 |
$0.23 |
$0.57 |
$1.34 |
$2.21 |
$3.02 |
Canagliflozin |
$0.00 |
$0.00 |
$0.00 |
$0.08 |
$0.45 |
$0.54 |
$0.58 |
$0.67 |
$0.79 |
$0.92 |
|
Other SGLT-2 |
$0.00 |
$0.00 |
$0.00 |
$0.00 |
$0.00 |
$0.32 |
$0.50 |
$0.62 |
$0.72 |
$0.85 |
|
Semaglutide |
$0.00 |
$0.00 |
$0.00 |
$0.00 |
$0.00 |
$0.00 |
$0.00 |
$0.00 |
$0.18 |
$2.42 |
|
Liraglutide |
$0.00 |
$0.00 |
$0.00 |
$0.00 |
$0.00 |
$0.00 |
$0.00 |
$0.00 |
$0.00 |
$0.00 |
|
Other GLP-1 |
$0.00 |
$0.00 |
$0.00 |
$0.00 |
$0.00 |
$0.00 |
$0.00 |
$0.00 |
$0.00 |
$0.00 |
|
Sitagliptin |
$0.53 |
$1.01 |
$1.42 |
$1.76 |
$2.03 |
$2.17 |
$2.33 |
$2.43 |
$2.56 |
$2.43 |
|
Linagliptin |
$0.03 |
$0.18 |
$0.31 |
$0.44 |
$0.56 |
$0.61 |
$0.66 |
$0.73 |
$0.76 |
$0.71 |
|
Other DPP-4 |
$0.09 |
$0.24 |
$0.36 |
$0.40 |
$0.39 |
$0.35 |
$0.31 |
$0.27 |
$0.24 |
$0.20 |
|
Insulin degludec |
$0.00 |
$0.00 |
$0.00 |
$0.00 |
$0.00 |
$0.00 |
$0.07 |
$1.08 |
$2.15 |
$2.74 |
|
Insulin glargine |
$2.41 |
$3.19 |
$4.16 |
$5.11 |
$5.72 |
$6.07 |
$6.40 |
$6.03 |
$5.70 |
$5.26 |
|
Other Insulin |
$4.77 |
$4.67 |
$4.88 |
$5.24 |
$5.12 |
$4.94 |
$5.08 |
$4.94 |
$4.80 |
$4.52 |
|
Metformin |
$1.31 |
$1.28 |
$1.14 |
$1.02 |
$0.99 |
$1.00 |
$0.72 |
$0.60 |
$0.61 |
$0.61 |
|
Other |
$1.48 |
$1.17 |
$1.08 |
$0.93 |
$0.81 |
$0.65 |
$0.53 |
$0.49 |
$0.48 |
$0.49 |
|
MB |
Empagliflozin |
$0.00 |
$0.00 |
$0.00 |
$0.00 |
$0.05 |
$0.28 |
$0.64 |
$1.09 |
$1.91 |
$2.68 |
Canagliflozin |
$0.00 |
$0.00 |
$0.00 |
$0.01 |
$0.36 |
$0.52 |
$0.55 |
$0.61 |
$0.74 |
$0.85 |
|
Other SGLT-2 |
$0.00 |
$0.00 |
$0.00 |
$0.00 |
$0.00 |
$0.57 |
$0.95 |
$1.07 |
$1.23 |
$1.33 |
|
Semaglutide |
$0.00 |
$0.00 |
$0.00 |
$0.00 |
$0.00 |
$0.00 |
$0.00 |
$0.00 |
$0.00 |
$1.88 |
|
Liraglutide |
$0.00 |
$0.01 |
$0.01 |
$0.01 |
$0.01 |
$0.01 |
$0.01 |
$0.00 |
$0.01 |
$0.00 |
|
Other GLP-1 |
$0.00 |
$0.00 |
$0.00 |
$0.00 |
$0.00 |
$0.00 |
$0.00 |
$0.00 |
$0.00 |
$0.00 |
|
Sitagliptin |
$0.19 |
$0.67 |
$0.94 |
$1.15 |
$1.26 |
$1.49 |
$1.78 |
$1.96 |
$2.12 |
$1.99 |
|
Linagliptin |
$0.00 |
$0.11 |
$0.30 |
$0.45 |
$0.55 |
$0.59 |
$0.69 |
$0.76 |
$0.81 |
$0.78 |
|
Other DPP-4 |
$0.11 |
$0.43 |
$0.57 |
$0.61 |
$0.58 |
$0.54 |
$0.53 |
$0.46 |
$0.42 |
$0.25 |
|
Insulin degludec |
$0.00 |
$0.00 |
$0.00 |
$0.00 |
$0.00 |
$0.00 |
$0.08 |
$1.09 |
$1.99 |
$2.31 |
|
Insulin glargine |
$1.66 |
$2.01 |
$2.28 |
$2.51 |
$2.74 |
$2.90 |
$3.18 |
$3.68 |
$3.82 |
$3.66 |
|
Other insulins |
$7.10 |
$7.09 |
$7.27 |
$7.33 |
$7.46 |
$7.45 |
$7.63 |
$7.44 |
$7.17 |
$6.07 |
|
Metformin |
$3.48 |
$2.58 |
$1.41 |
$1.11 |
$1.00 |
$1.00 |
$0.69 |
$0.58 |
$0.59 |
$0.51 |
|
Other |
$2.56 |
$2.21 |
$2.01 |
$1.74 |
$1.51 |
$1.39 |
$1.10 |
$1.01 |
$0.97 |
$0.83 |
|
ON |
Empagliflozin |
$0.00 |
$0.00 |
$0.00 |
$0.00 |
$0.37 |
$1.70 |
$3.57 |
$5.61 |
$7.14 |
$8.98 |
Canagliflozin |
$0.00 |
$0.00 |
$0.00 |
$0.48 |
$1.96 |
$2.27 |
$2.07 |
$2.30 |
$2.74 |
$3.10 |
|
Other SGLT-2 |
$0.00 |
$0.00 |
$0.00 |
$0.00 |
$0.04 |
$0.76 |
$1.14 |
$1.46 |
$1.89 |
$2.68 |
|
Semaglutide |
$0.00 |
$0.00 |
$0.00 |
$0.00 |
$0.00 |
$0.00 |
$0.00 |
$0.76 |
$6.54 |
$11.63 |
|
Liraglutide |
$0.00 |
$0.00 |
$0.00 |
$0.00 |
$0.00 |
$0.00 |
$0.00 |
$0.00 |
$0.00 |
$0.00 |
|
Other GLP-1 |
$0.00 |
$0.00 |
$0.00 |
$0.00 |
$0.00 |
$0.00 |
$0.00 |
$0.00 |
$0.00 |
$0.00 |
|
Sitagliptin |
$4.90 |
$6.56 |
$8.07 |
$9.59 |
$11.13 |
$12.61 |
$14.49 |
$15.87 |
$16.07 |
$16.20 |
|
Linagliptin |
$0.05 |
$0.56 |
$1.04 |
$1.57 |
$2.07 |
$2.60 |
$3.12 |
$3.57 |
$3.64 |
$3.67 |
|
Other DPP-4 |
$0.27 |
$0.69 |
$0.97 |
$1.14 |
$1.17 |
$1.13 |
$1.05 |
$0.97 |
$0.86 |
$0.61 |
|
Insulin degludec |
$0.00 |
$0.00 |
$0.00 |
$0.00 |
$0.00 |
$0.00 |
$0.26 |
$2.17 |
$3.05 |
$3.42 |
|
Insulin glargine |
$2.80 |
$3.50 |
$4.18 |
$4.73 |
$5.15 |
$5.53 |
$6.06 |
$5.60 |
$5.05 |
$4.82 |
|
Other insulins |
$5.35 |
$5.62 |
$5.83 |
$6.05 |
$6.10 |
$6.03 |
$6.39 |
$5.49 |
$5.04 |
$4.77 |
|
Metformin |
$1.42 |
$1.42 |
$1.42 |
$1.13 |
$1.03 |
$1.00 |
$0.66 |
$0.55 |
$0.55 |
$0.58 |
|
Other |
$1.55 |
$1.42 |
$1.39 |
$1.14 |
$1.08 |
$0.86 |
$0.68 |
$0.61 |
$0.56 |
$0.52 |
|
QC |
Empagliflozin |
NA |
NA |
NA |
NA |
NA |
NA |
NA |
NA |
NA |
NA |
Canagliflozin |
NA |
NA |
NA |
NA |
NA |
NA |
NA |
NA |
NA |
NA |
|
Other SGLT-2 |
NA |
NA |
NA |
NA |
NA |
NA |
NA |
NA |
NA |
NA |
|
Semaglutide |
NA |
NA |
NA |
NA |
NA |
NA |
NA |
NA |
NA |
NA |
|
Liraglutide |
NA |
NA |
NA |
NA |
NA |
NA |
NA |
NA |
NA |
NA |
|
Other GLP-1 |
NA |
NA |
NA |
NA |
NA |
NA |
NA |
NA |
NA |
NA |
|
Sitagliptin |
NA |
NA |
NA |
NA |
NA |
NA |
NA |
NA |
NA |
NA |
|
Linagliptin |
NA |
NA |
NA |
NA |
NA |
NA |
NA |
NA |
NA |
NA |
|
Other DPP-4 |
NA |
NA |
NA |
NA |
NA |
NA |
NA |
NA |
NA |
NA |
|
Insulin degludec |
NA |
NA |
NA |
NA |
NA |
NA |
NA |
NA |
NA |
NA |
|
Insulin glargine |
NA |
NA |
NA |
NA |
NA |
NA |
NA |
NA |
NA |
NA |
|
Other insulins |
NA |
NA |
NA |
NA |
NA |
NA |
NA |
NA |
NA |
NA |
|
Metformin |
NA |
NA |
NA |
NA |
NA |
NA |
NA |
NA |
NA |
NA |
|
Other |
NA |
NA |
NA |
NA |
NA |
NA |
NA |
NA |
NA |
NA |
|
NB |
Empagliflozin |
$0.00 |
$0.00 |
$0.00 |
$0.00 |
$0.05 |
$0.41 |
$0.69 |
$1.28 |
$2.15 |
$3.16 |
Canagliflozin |
$0.00 |
$0.00 |
$0.00 |
$0.01 |
$0.37 |
$0.54 |
$0.49 |
$0.49 |
$0.49 |
$0.52 |
|
Other SGLT-2 |
$0.00 |
$0.00 |
$0.00 |
$0.00 |
$0.00 |
$0.11 |
$0.22 |
$0.31 |
$0.43 |
$0.72 |
|
Semaglutide |
$0.00 |
$0.00 |
$0.00 |
$0.00 |
$0.00 |
$0.00 |
$0.00 |
$0.00 |
$0.55 |
$3.15 |
|
Liraglutide |
$0.00 |
$0.00 |
$0.00 |
$0.00 |
$0.00 |
$0.00 |
$0.00 |
$0.00 |
$0.00 |
$0.00 |
|
Other GLP-1 |
$0.00 |
$0.00 |
$0.00 |
$0.00 |
$0.00 |
$0.00 |
$0.00 |
$0.00 |
$0.00 |
$0.00 |
|
Sitagliptin |
$0.38 |
$0.97 |
$1.72 |
$2.65 |
$3.61 |
$4.47 |
$5.20 |
$5.79 |
$6.12 |
$5.94 |
|
Linagliptin |
$0.01 |
$0.13 |
$0.32 |
$0.50 |
$0.70 |
$0.86 |
$0.94 |
$1.00 |
$1.06 |
$1.07 |
|
Other DPP-4 |
$0.00 |
$0.00 |
$0.00 |
$0.00 |
$0.03 |
$0.05 |
$0.05 |
$0.06 |
$0.06 |
$0.04 |
|
Insulin degludec |
$0.00 |
$0.00 |
$0.00 |
$0.00 |
$0.00 |
$0.00 |
$0.04 |
$2.20 |
$3.94 |
$4.83 |
|
Insulin glargine |
$0.10 |
$0.94 |
$1.51 |
$2.13 |
$2.78 |
$3.44 |
$4.74 |
$4.82 |
$4.63 |
$4.51 |
|
Other insulins |
$5.47 |
$5.80 |
$6.28 |
$6.72 |
$7.01 |
$7.23 |
$7.05 |
$6.51 |
$6.20 |
$5.70 |
|
Metformin |
$2.06 |
$1.51 |
$1.41 |
$1.07 |
$0.97 |
$1.00 |
$0.68 |
$0.58 |
$0.60 |
$0.61 |
|
Other |
$1.86 |
$1.19 |
$1.09 |
$0.98 |
$0.95 |
$0.88 |
$0.76 |
$0.71 |
$0.70 |
$0.73 |
|
NS |
Empagliflozin |
$0.00 |
$0.00 |
$0.00 |
$0.00 |
$0.00 |
$0.01 |
$0.03 |
$0.47 |
$1.19 |
$1.99 |
Canagliflozin |
$0.00 |
$0.00 |
$0.00 |
$0.00 |
$0.01 |
$0.01 |
$0.01 |
$0.02 |
$0.02 |
$0.03 |
|
Other SGLT-2 |
$0.00 |
$0.00 |
$0.00 |
$0.00 |
$0.00 |
$0.00 |
$0.01 |
$0.03 |
$0.04 |
$0.05 |
|
Semaglutide |
$0.00 |
$0.00 |
$0.00 |
$0.00 |
$0.00 |
$0.00 |
$0.00 |
$0.00 |
$0.11 |
$2.77 |
|
Liraglutide |
$0.00 |
$0.00 |
$0.00 |
$0.00 |
$0.00 |
$0.01 |
$0.01 |
$0.01 |
$0.00 |
$0.00 |
|
Other GLP-1 |
$0.00 |
$0.00 |
$0.00 |
$0.00 |
$0.00 |
$0.00 |
$0.00 |
$0.00 |
$0.00 |
$0.00 |
|
Sitagliptin |
$0.41 |
$0.80 |
$1.04 |
$1.23 |
$1.23 |
$1.14 |
$1.14 |
$1.12 |
$1.11 |
$1.02 |
|
Linagliptin |
$0.00 |
$0.01 |
$0.03 |
$0.03 |
$0.03 |
$0.04 |
$0.04 |
$0.04 |
$0.05 |
$0.05 |
|
Other DPP-4 |
$0.00 |
$0.00 |
$0.00 |
$0.01 |
$0.01 |
$0.02 |
$0.02 |
$0.02 |
$0.01 |
$0.01 |
|
Insulin degludec |
$0.00 |
$0.00 |
$0.00 |
$0.00 |
$0.00 |
$0.00 |
$0.00 |
$1.33 |
$4.04 |
$5.38 |
|
Insulin glargine |
$0.16 |
$0.91 |
$1.36 |
$1.75 |
$2.13 |
$2.48 |
$3.73 |
$4.52 |
$4.19 |
$3.96 |
|
Other insulins |
$6.57 |
$7.04 |
$7.49 |
$7.87 |
$8.38 |
$8.89 |
$8.70 |
$7.80 |
$6.93 |
$6.05 |
|
Metformin |
$1.80 |
$1.66 |
$1.63 |
$1.01 |
$0.97 |
$1.00 |
$0.69 |
$0.60 |
$0.63 |
$0.63 |
|
Other |
$1.46 |
$1.37 |
$1.37 |
$0.98 |
$0.98 |
$0.91 |
$0.79 |
$0.77 |
$0.77 |
$0.74 |
|
PE |
Empagliflozin |
$0.00 |
$0.00 |
$0.00 |
$0.00 |
$0.00 |
$0.02 |
$0.04 |
$0.15 |
$0.71 |
$1.21 |
Canagliflozin |
$0.00 |
$0.00 |
$0.00 |
$0.00 |
$0.00 |
$0.00 |
$0.01 |
$0.01 |
$0.01 |
$0.03 |
|
Other SGLT-2 |
$0.00 |
$0.00 |
$0.00 |
$0.00 |
$0.00 |
$0.01 |
$0.02 |
$0.02 |
$0.01 |
$0.02 |
|
Semaglutide |
$0.00 |
$0.00 |
$0.00 |
$0.00 |
$0.00 |
$0.00 |
$0.00 |
$0.09 |
$2.24 |
$4.83 |
|
Liraglutide |
$0.00 |
$0.00 |
$0.00 |
$0.00 |
$0.00 |
$0.00 |
$0.00 |
$0.00 |
$0.00 |
$0.00 |
|
Other GLP-1 |
$0.00 |
$0.00 |
$0.00 |
$0.00 |
$0.00 |
$0.00 |
$0.00 |
$0.00 |
$0.00 |
$0.00 |
|
Sitagliptin |
$0.00 |
$0.00 |
$0.00 |
$0.01 |
$0.06 |
$0.09 |
$0.11 |
$0.14 |
$0.17 |
$0.26 |
|
Linagliptin |
$0.00 |
$0.00 |
$0.00 |
$0.01 |
$0.03 |
$0.03 |
$0.05 |
$0.06 |
$0.07 |
$0.07 |
|
Other DPP-4 |
$0.00 |
$0.00 |
$0.00 |
$0.00 |
$0.01 |
$0.00 |
$0.01 |
$0.00 |
$0.00 |
$0.00 |
|
Insulin degludec |
$0.00 |
$0.00 |
$0.00 |
$0.00 |
$0.00 |
$0.00 |
$0.07 |
$3.25 |
$6.44 |
$8.14 |
|
Insulin glargine |
$0.01 |
$0.01 |
$0.01 |
$0.46 |
$0.79 |
$1.15 |
$3.04 |
$3.12 |
$2.27 |
$2.00 |
|
Other insulins |
$7.35 |
$6.33 |
$6.44 |
$6.63 |
$7.01 |
$7.39 |
$6.74 |
$6.12 |
$5.70 |
$5.39 |
|
Metformin |
$2.16 |
$1.74 |
$1.40 |
$1.02 |
$0.96 |
$1.00 |
$0.69 |
$0.57 |
$0.59 |
$0.59 |
|
Other |
$0.99 |
$0.99 |
$0.96 |
$0.74 |
$0.81 |
$0.75 |
$0.69 |
$0.66 |
$0.64 |
$0.66 |
|
NL |
Empagliflozin |
$0.00 |
$0.00 |
$0.00 |
$0.00 |
$0.00 |
$0.01 |
$0.01 |
$0.02 |
$0.15 |
$0.40 |
Canagliflozin |
$0.00 |
$0.00 |
$0.00 |
$0.00 |
$0.01 |
$0.02 |
$0.03 |
$0.02 |
$0.03 |
$0.03 |
|
Other SGLT-2 |
$0.00 |
$0.00 |
$0.00 |
$0.00 |
$0.00 |
$0.00 |
$0.01 |
$0.01 |
$0.01 |
$0.01 |
|
Semaglutide |
$0.00 |
$0.00 |
$0.00 |
$0.00 |
$0.00 |
$0.00 |
$0.00 |
$0.00 |
$0.11 |
$0.39 |
|
Liraglutide |
$0.00 |
$0.00 |
$0.00 |
$0.00 |
$0.00 |
$0.00 |
$0.00 |
$0.00 |
$0.00 |
$0.00 |
|
Other GLP-1 |
$0.00 |
$0.00 |
$0.00 |
$0.00 |
$0.00 |
$0.00 |
$0.00 |
$0.00 |
$0.00 |
$0.00 |
|
Sitagliptin |
$0.09 |
$0.15 |
$0.19 |
$0.21 |
$0.25 |
$0.22 |
$0.18 |
$0.18 |
$0.16 |
$0.17 |
|
Linagliptin |
$0.00 |
$0.02 |
$0.03 |
$0.03 |
$0.03 |
$0.03 |
$0.02 |
$0.02 |
$0.01 |
$0.01 |
|
Other DPP-4 |
$0.00 |
$0.00 |
$0.00 |
$0.00 |
$0.00 |
$0.01 |
$0.00 |
$0.00 |
$0.00 |
$0.00 |
|
Insulin degludec |
$0.00 |
$0.00 |
$0.00 |
$0.00 |
$0.00 |
$0.00 |
$0.00 |
$1.06 |
$2.74 |
$4.11 |
|
Insulin glargine |
$0.01 |
$0.01 |
$0.04 |
$0.17 |
$0.29 |
$0.45 |
$2.21 |
$3.55 |
$3.98 |
$4.14 |
|
Other insulins |
$7.70 |
$8.12 |
$8.50 |
$9.04 |
$9.69 |
$10.09 |
$10.21 |
$9.72 |
$9.38 |
$9.07 |
|
Metformin |
$2.64 |
$1.95 |
$1.54 |
$1.12 |
$1.00 |
$1.00 |
$0.68 |
$0.59 |
$0.59 |
$0.60 |
|
Other |
$1.98 |
$1.40 |
$1.18 |
$1.09 |
$1.05 |
$0.99 |
$0.96 |
$0.95 |
$0.95 |
$0.97 |
|
| Private Drug Plans | |||||||||||
|---|---|---|---|---|---|---|---|---|---|---|---|
| 2012 | 2013 | 2014 | 2015 | 2016 | 2017 | 2018 | 2019 | 2020 | 2021 | ||
BC |
Empagliflozin |
$0.00 |
$0.00 |
$0.00 |
$0.01 |
$0.25 |
$0.78 |
$1.44 |
$2.09 |
$2.78 |
$3.35 |
Canagliflozin |
$0.00 |
$0.00 |
$0.11 |
$0.60 |
$0.91 |
$1.06 |
$0.98 |
$0.99 |
$1.00 |
$0.96 |
|
Other SGLT-2 |
$0.00 |
$0.00 |
$0.00 |
$0.09 |
$0.26 |
$0.43 |
$0.52 |
$0.59 |
$0.61 |
$0.64 |
|
Semaglutide |
$0.00 |
$0.00 |
$0.00 |
$0.00 |
$0.00 |
$0.00 |
$0.47 |
$2.14 |
$3.88 |
$5.63 |
|
Liraglutide |
$0.94 |
$1.15 |
$1.36 |
$1.57 |
$1.90 |
$2.53 |
$2.67 |
$2.15 |
$1.90 |
$1.79 |
|
Other GLP-1 |
$0.02 |
$0.02 |
$0.02 |
$0.02 |
$0.12 |
$0.39 |
$0.56 |
$0.58 |
$0.63 |
$0.63 |
|
Sitagliptin |
$0.80 |
$1.01 |
$1.16 |
$1.05 |
$1.02 |
$1.18 |
$1.31 |
$1.34 |
$1.33 |
$1.23 |
|
Linagliptin |
$0.03 |
$0.07 |
$0.15 |
$0.37 |
$0.51 |
$0.78 |
$1.01 |
$1.17 |
$1.23 |
$1.14 |
|
Other DPP-4 |
$0.08 |
$0.10 |
$0.13 |
$0.23 |
$0.26 |
$0.31 |
$0.34 |
$0.33 |
$0.30 |
$0.22 |
|
Insulin degludec |
$0.00 |
$0.00 |
$0.00 |
$0.00 |
$0.00 |
$0.01 |
$0.20 |
$0.37 |
$0.46 |
$0.51 |
|
Insulin glargine |
$0.90 |
$1.11 |
$1.29 |
$1.43 |
$1.61 |
$1.96 |
$2.13 |
$2.04 |
$1.82 |
$1.77 |
|
Other insulins |
$1.24 |
$1.39 |
$1.54 |
$1.65 |
$1.71 |
$1.95 |
$2.12 |
$2.14 |
$2.17 |
$2.13 |
|
Metformin |
$0.79 |
$0.76 |
$0.75 |
$0.72 |
$0.80 |
$1.00 |
$0.99 |
$1.02 |
$1.11 |
$1.15 |
|
Other |
$0.43 |
$0.39 |
$0.40 |
$0.36 |
$0.35 |
$0.36 |
$0.35 |
$0.34 |
$0.35 |
$0.35 |
|
AB |
Empagliflozin |
$0.00 |
$0.00 |
$0.00 |
$0.01 |
$0.22 |
$0.62 |
$1.20 |
$1.78 |
$2.33 |
$2.83 |
Canagliflozin |
$0.00 |
$0.00 |
$0.09 |
$0.55 |
$0.70 |
$0.78 |
$0.79 |
$0.89 |
$1.01 |
$1.08 |
|
Other SGLT-2 |
$0.00 |
$0.00 |
$0.00 |
$0.23 |
$0.62 |
$0.85 |
$0.95 |
$1.07 |
$1.14 |
$1.29 |
|
Semaglutide |
$0.00 |
$0.00 |
$0.00 |
$0.00 |
$0.00 |
$0.00 |
$0.45 |
$2.23 |
$4.77 |
$8.63 |
|
Liraglutide |
$1.09 |
$1.49 |
$1.72 |
$2.13 |
$2.83 |
$3.54 |
$3.91 |
$3.48 |
$2.88 |
$2.64 |
|
Other GLP-1 |
$0.01 |
$0.01 |
$0.01 |
$0.01 |
$0.09 |
$0.32 |
$0.55 |
$0.62 |
$0.57 |
$0.55 |
|
Sitagliptin |
$1.22 |
$1.42 |
$1.67 |
$2.00 |
$2.23 |
$2.48 |
$2.86 |
$3.11 |
$3.14 |
$3.08 |
|
Linagliptin |
$0.03 |
$0.11 |
$0.17 |
$0.24 |
$0.28 |
$0.31 |
$0.35 |
$0.39 |
$0.37 |
$0.34 |
|
Other DPP-4 |
$0.22 |
$0.30 |
$0.40 |
$0.47 |
$0.46 |
$0.43 |
$0.38 |
$0.33 |
$0.27 |
$0.21 |
|
Insulin degludec |
$0.00 |
$0.00 |
$0.00 |
$0.00 |
$0.00 |
$0.02 |
$0.31 |
$0.73 |
$1.19 |
$1.40 |
|
Insulin glargine |
$1.33 |
$1.68 |
$1.95 |
$2.19 |
$2.49 |
$2.73 |
$2.76 |
$2.49 |
$2.17 |
$1.92 |
|
Other insulins |
$2.75 |
$3.00 |
$3.04 |
$3.10 |
$2.95 |
$2.88 |
$2.75 |
$2.65 |
$2.58 |
$2.44 |
|
Metformin |
$1.09 |
$0.89 |
$0.86 |
$0.87 |
$0.91 |
$1.00 |
$0.94 |
$0.98 |
$1.07 |
$1.12 |
|
Other |
$0.77 |
$0.52 |
$0.46 |
$0.40 |
$0.34 |
$0.30 |
$0.25 |
$0.22 |
$0.22 |
$0.20 |
|
SK |
Empagliflozin |
$0.00 |
$0.00 |
$0.00 |
$0.01 |
$0.25 |
$0.58 |
$1.21 |
$1.99 |
$2.79 |
$3.37 |
Canagliflozin |
$0.00 |
$0.00 |
$0.08 |
$0.71 |
$1.09 |
$1.15 |
$1.12 |
$1.27 |
$1.36 |
$1.45 |
|
Other SGLT-2 |
$0.00 |
$0.00 |
$0.00 |
$0.27 |
$0.69 |
$0.99 |
$1.14 |
$1.32 |
$1.43 |
$1.54 |
|
Semaglutide |
$0.00 |
$0.00 |
$0.00 |
$0.00 |
$0.00 |
$0.00 |
$0.15 |
$0.96 |
$2.24 |
$4.33 |
|
Liraglutide |
$0.35 |
$0.39 |
$0.46 |
$0.62 |
$0.68 |
$0.84 |
$1.04 |
$1.11 |
$0.97 |
$0.96 |
|
Other GLP-1 |
$0.02 |
$0.02 |
$0.02 |
$0.02 |
$0.11 |
$0.35 |
$0.57 |
$0.82 |
$0.94 |
$0.95 |
|
Sitagliptin |
$0.79 |
$1.09 |
$1.41 |
$1.78 |
$2.07 |
$2.22 |
$2.52 |
$2.84 |
$2.96 |
$2.76 |
|
Linagliptin |
$0.03 |
$0.11 |
$0.19 |
$0.28 |
$0.34 |
$0.36 |
$0.36 |
$0.40 |
$0.40 |
$0.38 |
|
Other DPP-4 |
$0.07 |
$0.16 |
$0.24 |
$0.26 |
$0.23 |
$0.21 |
$0.20 |
$0.19 |
$0.16 |
$0.13 |
|
Insulin degludec |
$0.00 |
$0.00 |
$0.00 |
$0.00 |
$0.00 |
$0.00 |
$0.17 |
$0.56 |
$0.84 |
$1.03 |
|
Insulin glargine |
$1.02 |
$1.37 |
$1.66 |
$2.11 |
$2.56 |
$3.36 |
$3.77 |
$3.75 |
$3.38 |
$3.25 |
|
Other insulins |
$2.40 |
$2.67 |
$2.59 |
$2.55 |
$2.54 |
$2.68 |
$2.74 |
$2.81 |
$2.83 |
$2.86 |
|
Metformin |
$0.65 |
$0.75 |
$0.74 |
$0.75 |
$0.87 |
$1.00 |
$0.85 |
$0.86 |
$0.92 |
$0.98 |
|
Other |
$0.61 |
$0.59 |
$0.59 |
$0.56 |
$0.57 |
$0.50 |
$0.41 |
$0.41 |
$0.42 |
$0.42 |
|
MB |
Empagliflozin |
$0.00 |
$0.00 |
$0.00 |
$0.00 |
$0.14 |
$0.42 |
$0.93 |
$1.51 |
$2.24 |
$3.00 |
Canagliflozin |
$0.00 |
$0.00 |
$0.07 |
$0.36 |
$0.73 |
$0.92 |
$0.92 |
$1.00 |
$1.18 |
$1.30 |
|
Other SGLT-2 |
$0.00 |
$0.00 |
$0.00 |
$0.22 |
$0.60 |
$1.08 |
$1.30 |
$1.44 |
$1.61 |
$1.79 |
|
Semaglutide |
$0.00 |
$0.00 |
$0.00 |
$0.00 |
$0.00 |
$0.00 |
$0.13 |
$0.45 |
$0.94 |
$2.22 |
|
Liraglutide |
$0.42 |
$0.54 |
$0.63 |
$0.70 |
$0.76 |
$0.83 |
$0.82 |
$0.68 |
$0.64 |
$0.63 |
|
Other GLP-1 |
$0.01 |
$0.01 |
$0.00 |
$0.01 |
$0.06 |
$0.17 |
$0.21 |
$0.28 |
$0.36 |
$0.37 |
|
Sitagliptin |
$0.59 |
$0.77 |
$0.90 |
$0.99 |
$1.28 |
$1.52 |
$1.79 |
$2.00 |
$2.13 |
$2.10 |
|
Linagliptin |
$0.03 |
$0.08 |
$0.21 |
$0.26 |
$0.38 |
$0.42 |
$0.48 |
$0.53 |
$0.57 |
$0.55 |
|
Other DPP-4 |
$0.11 |
$0.27 |
$0.35 |
$0.37 |
$0.44 |
$0.46 |
$0.46 |
$0.42 |
$0.37 |
$0.26 |
|
Insulin degludec |
$0.00 |
$0.00 |
$0.00 |
$0.00 |
$0.00 |
$0.00 |
$0.13 |
$0.57 |
$0.98 |
$1.17 |
|
Insulin glargine |
$0.87 |
$1.09 |
$1.23 |
$1.24 |
$1.64 |
$1.82 |
$1.96 |
$2.02 |
$1.96 |
$1.94 |
|
Other insulins |
$2.01 |
$2.29 |
$2.46 |
$2.21 |
$3.00 |
$3.17 |
$3.36 |
$3.35 |
$3.34 |
$3.21 |
|
Metformin |
$1.53 |
$1.36 |
$0.91 |
$0.68 |
$0.92 |
$1.00 |
$0.79 |
$0.77 |
$0.80 |
$0.82 |
|
Other |
$0.88 |
$0.91 |
$0.94 |
$0.74 |
$0.89 |
$0.90 |
$0.75 |
$0.73 |
$0.74 |
$0.73 |
|
ON |
Empagliflozin |
$0.00 |
$0.00 |
$0.00 |
$0.01 |
$0.32 |
$0.93 |
$1.78 |
$2.50 |
$3.01 |
$3.46 |
Canagliflozin |
$0.00 |
$0.00 |
$0.15 |
$0.89 |
$1.29 |
$1.42 |
$1.22 |
$1.22 |
$1.32 |
$1.34 |
|
Other SGLT-2 |
$0.00 |
$0.00 |
$0.00 |
$0.19 |
$0.49 |
$0.60 |
$0.74 |
$0.87 |
$1.00 |
$1.20 |
|
Semaglutide |
$0.00 |
$0.00 |
$0.00 |
$0.00 |
$0.00 |
$0.00 |
$0.51 |
$2.05 |
$3.61 |
$6.14 |
|
Liraglutide |
$0.93 |
$1.21 |
$1.47 |
$1.66 |
$2.01 |
$2.50 |
$2.90 |
$2.55 |
$2.09 |
$2.03 |
|
Other GLP-1 |
$0.01 |
$0.01 |
$0.01 |
$0.01 |
$0.13 |
$0.40 |
$0.55 |
$0.61 |
$0.62 |
$0.61 |
|
Sitagliptin |
$2.14 |
$2.67 |
$3.10 |
$3.52 |
$4.04 |
$4.49 |
$5.03 |
$5.28 |
$5.29 |
$5.02 |
|
Linagliptin |
$0.05 |
$0.14 |
$0.23 |
$0.30 |
$0.36 |
$0.40 |
$0.44 |
$0.47 |
$0.47 |
$0.44 |
|
Other DPP-4 |
$0.27 |
$0.37 |
$0.45 |
$0.46 |
$0.44 |
$0.40 |
$0.34 |
$0.29 |
$0.23 |
$0.16 |
|
Insulin degludec |
$0.00 |
$0.00 |
$0.00 |
$0.00 |
$0.00 |
$0.03 |
$0.44 |
$0.88 |
$1.20 |
$1.26 |
|
Insulin glargine |
$1.32 |
$1.56 |
$1.79 |
$1.92 |
$2.15 |
$2.29 |
$2.07 |
$1.77 |
$1.62 |
$1.47 |
|
Other insulins |
$2.50 |
$2.57 |
$2.63 |
$2.64 |
$2.58 |
$2.51 |
$2.14 |
$2.32 |
$2.37 |
$2.26 |
|
Metformin |
$0.88 |
$0.85 |
$0.89 |
$0.86 |
$0.92 |
$1.00 |
$0.88 |
$0.92 |
$1.01 |
$1.06 |
|
Other |
$0.95 |
$0.74 |
$0.66 |
$0.53 |
$0.47 |
$0.37 |
$0.29 |
$0.25 |
$0.23 |
$0.21 |
|
QC |
Empagliflozin |
$0.00 |
$0.00 |
$0.00 |
$0.00 |
$0.09 |
$0.31 |
$0.58 |
$0.92 |
$1.30 |
$1.53 |
Canagliflozin |
$0.00 |
$0.00 |
$0.07 |
$0.53 |
$0.90 |
$1.03 |
$1.00 |
$1.07 |
$1.14 |
$1.12 |
|
Other SGLT-2 |
$0.00 |
$0.00 |
$0.00 |
$0.07 |
$0.22 |
$0.44 |
$0.68 |
$0.80 |
$0.86 |
$0.91 |
|
Semaglutide |
$0.00 |
$0.00 |
$0.00 |
$0.00 |
$0.00 |
$0.00 |
$0.23 |
$0.98 |
$2.24 |
$3.81 |
|
Liraglutide |
$0.62 |
$0.81 |
$0.92 |
$1.02 |
$1.25 |
$1.47 |
$1.68 |
$1.77 |
$1.78 |
$1.99 |
|
Other GLP-1 |
$0.01 |
$0.01 |
$0.01 |
$0.01 |
$0.10 |
$0.32 |
$0.48 |
$0.64 |
$0.73 |
$0.65 |
|
Sitagliptin |
$1.03 |
$1.32 |
$1.58 |
$1.80 |
$2.09 |
$2.40 |
$2.70 |
$2.92 |
$2.93 |
$2.62 |
|
Linagliptin |
$0.02 |
$0.06 |
$0.09 |
$0.11 |
$0.13 |
$0.14 |
$0.14 |
$0.14 |
$0.14 |
$0.12 |
|
Other DPP-4 |
$0.30 |
$0.45 |
$0.59 |
$0.71 |
$0.76 |
$0.75 |
$0.69 |
$0.60 |
$0.51 |
$0.37 |
|
Insulin degludec |
$0.00 |
$0.00 |
$0.00 |
$0.00 |
$0.00 |
$0.01 |
$0.14 |
$0.35 |
$0.56 |
$0.68 |
|
Insulin glargine |
$0.73 |
$0.84 |
$0.95 |
$1.02 |
$1.14 |
$1.23 |
$1.18 |
$1.00 |
$0.87 |
$0.71 |
|
Other insulins |
$1.52 |
$1.63 |
$1.70 |
$1.70 |
$1.63 |
$1.62 |
$1.57 |
$1.48 |
$1.44 |
$1.28 |
|
Metformin |
$1.03 |
$0.97 |
$0.94 |
$0.92 |
$0.94 |
$1.00 |
$0.97 |
$1.01 |
$1.08 |
$1.09 |
|
Other |
$0.64 |
$0.53 |
$0.50 |
$0.47 |
$0.43 |
$0.40 |
$0.37 |
$0.36 |
$0.34 |
$0.32 |
|
NB |
Empagliflozin |
$0.00 |
$0.00 |
$0.00 |
$0.01 |
$0.21 |
$0.61 |
$1.13 |
$1.74 |
$2.31 |
$2.95 |
Canagliflozin |
$0.00 |
$0.00 |
$0.02 |
$0.26 |
$0.52 |
$0.64 |
$0.55 |
$0.54 |
$0.54 |
$0.58 |
|
Other SGLT-2 |
$0.00 |
$0.00 |
$0.00 |
$0.07 |
$0.26 |
$0.47 |
$0.64 |
$0.76 |
$0.92 |
$1.14 |
|
Semaglutide |
$0.00 |
$0.00 |
$0.00 |
$0.00 |
$0.00 |
$0.00 |
$0.15 |
$0.70 |
$1.49 |
$3.15 |
|
Liraglutide |
$0.59 |
$0.82 |
$0.98 |
$1.06 |
$1.09 |
$1.24 |
$1.45 |
$1.44 |
$1.31 |
$1.25 |
|
Other GLP-1 |
$0.01 |
$0.01 |
$0.01 |
$0.01 |
$0.06 |
$0.20 |
$0.31 |
$0.44 |
$0.61 |
$0.72 |
|
Sitagliptin |
$1.08 |
$1.38 |
$1.72 |
$2.09 |
$2.55 |
$2.94 |
$3.30 |
$3.56 |
$3.76 |
$3.69 |
|
Linagliptin |
$0.03 |
$0.09 |
$0.13 |
$0.17 |
$0.23 |
$0.26 |
$0.29 |
$0.31 |
$0.32 |
$0.33 |
|
Other DPP-4 |
$0.08 |
$0.11 |
$0.13 |
$0.14 |
$0.14 |
$0.12 |
$0.11 |
$0.10 |
$0.09 |
$0.06 |
|
Insulin degludec |
$0.00 |
$0.00 |
$0.00 |
$0.00 |
$0.00 |
$0.01 |
$0.09 |
$0.46 |
$0.83 |
$1.07 |
|
Insulin glargine |
$1.46 |
$1.67 |
$1.95 |
$2.23 |
$2.69 |
$3.00 |
$3.17 |
$3.05 |
$2.92 |
$2.79 |
|
Other insulins |
$2.52 |
$2.64 |
$2.76 |
$2.84 |
$2.83 |
$2.73 |
$2.70 |
$2.56 |
$2.49 |
$2.41 |
|
Metformin |
$1.06 |
$0.86 |
$0.89 |
$0.87 |
$0.92 |
$1.00 |
$0.93 |
$0.95 |
$0.99 |
$1.07 |
|
Other |
$0.73 |
$0.47 |
$0.42 |
$0.37 |
$0.34 |
$0.30 |
$0.25 |
$0.23 |
$0.21 |
$0.22 |
|
NS |
Empagliflozin |
$0.00 |
$0.00 |
$0.00 |
$0.00 |
$0.15 |
$0.44 |
$0.81 |
$1.28 |
$1.74 |
$2.33 |
Canagliflozin |
$0.00 |
$0.00 |
$0.03 |
$0.24 |
$0.37 |
$0.37 |
$0.34 |
$0.36 |
$0.39 |
$0.45 |
|
Other SGLT-2 |
$0.00 |
$0.00 |
$0.00 |
$0.12 |
$0.38 |
$0.62 |
$0.77 |
$0.96 |
$1.10 |
$1.26 |
|
Semaglutide |
$0.00 |
$0.00 |
$0.00 |
$0.00 |
$0.00 |
$0.00 |
$0.56 |
$2.25 |
$3.69 |
$6.23 |
|
Liraglutide |
$1.01 |
$1.24 |
$1.45 |
$1.65 |
$2.27 |
$3.05 |
$3.46 |
$3.06 |
$2.58 |
$2.58 |
|
Other GLP-1 |
$0.01 |
$0.01 |
$0.01 |
$0.01 |
$0.10 |
$0.33 |
$0.46 |
$0.48 |
$0.53 |
$0.52 |
|
Sitagliptin |
$0.98 |
$1.21 |
$1.44 |
$1.68 |
$1.96 |
$2.09 |
$2.30 |
$2.42 |
$2.51 |
$2.44 |
|
Linagliptin |
$0.02 |
$0.07 |
$0.11 |
$0.12 |
$0.13 |
$0.12 |
$0.12 |
$0.12 |
$0.12 |
$0.11 |
|
Other DPP-4 |
$0.19 |
$0.26 |
$0.31 |
$0.34 |
$0.37 |
$0.35 |
$0.31 |
$0.26 |
$0.22 |
$0.14 |
|
Insulin degludec |
$0.00 |
$0.00 |
$0.00 |
$0.00 |
$0.00 |
$0.02 |
$0.30 |
$0.87 |
$1.66 |
$2.10 |
|
Insulin glargine |
$1.54 |
$1.80 |
$2.07 |
$2.30 |
$2.77 |
$3.23 |
$3.48 |
$3.42 |
$3.19 |
$2.87 |
|
Other insulins |
$3.81 |
$3.93 |
$4.12 |
$4.20 |
$4.44 |
$4.40 |
$4.07 |
$3.76 |
$3.43 |
$3.19 |
|
Metformin |
$1.05 |
$1.01 |
$1.02 |
$0.81 |
$0.91 |
$1.00 |
$0.87 |
$0.89 |
$0.95 |
$1.06 |
|
Other |
$0.72 |
$0.62 |
$0.59 |
$0.44 |
$0.44 |
$0.38 |
$0.32 |
$0.29 |
$0.28 |
$0.27 |
|
PE |
Empagliflozin |
$0.00 |
$0.00 |
$0.00 |
$0.00 |
$0.19 |
$0.72 |
$1.48 |
$2.12 |
$2.82 |
$3.63 |
Canagliflozin |
$0.00 |
$0.00 |
$0.03 |
$0.23 |
$0.35 |
$0.34 |
$0.24 |
$0.25 |
$0.21 |
$0.19 |
|
Other SGLT-2 |
$0.00 |
$0.00 |
$0.00 |
$0.06 |
$0.16 |
$0.16 |
$0.19 |
$0.26 |
$0.27 |
$0.26 |
|
Semaglutide |
$0.00 |
$0.00 |
$0.00 |
$0.00 |
$0.00 |
$0.00 |
$0.19 |
$1.17 |
$3.32 |
$5.86 |
|
Liraglutide |
$0.96 |
$1.12 |
$1.29 |
$1.38 |
$1.63 |
$2.02 |
$2.14 |
$2.08 |
$1.95 |
$1.96 |
|
Other GLP-1 |
$0.00 |
$0.01 |
$0.00 |
$0.00 |
$0.06 |
$0.21 |
$0.35 |
$0.33 |
$0.32 |
$0.30 |
|
Sitagliptin |
$0.71 |
$0.93 |
$1.17 |
$1.36 |
$1.65 |
$2.03 |
$2.17 |
$2.27 |
$2.32 |
$2.24 |
|
Linagliptin |
$0.04 |
$0.07 |
$0.13 |
$0.16 |
$0.19 |
$0.20 |
$0.24 |
$0.28 |
$0.29 |
$0.25 |
|
Other DPP-4 |
$0.14 |
$0.18 |
$0.20 |
$0.21 |
$0.22 |
$0.21 |
$0.17 |
$0.16 |
$0.15 |
$0.12 |
|
Insulin degludec |
$0.00 |
$0.00 |
$0.00 |
$0.00 |
$0.00 |
$0.02 |
$0.33 |
$1.72 |
$3.33 |
$4.15 |
|
Insulin glargine |
$2.36 |
$2.51 |
$2.69 |
$2.93 |
$3.27 |
$3.73 |
$4.06 |
$3.33 |
$2.42 |
$1.99 |
|
Other insulins |
$1.25 |
$1.26 |
$2.80 |
$4.43 |
$4.67 |
$4.77 |
$4.42 |
$3.97 |
$3.87 |
$3.66 |
|
Metformin |
$0.28 |
$0.26 |
$0.64 |
$0.89 |
$0.93 |
$1.00 |
$0.89 |
$0.89 |
$1.00 |
$1.03 |
|
Other |
$0.37 |
$0.22 |
$0.36 |
$0.45 |
$0.46 |
$0.40 |
$0.34 |
$0.31 |
$0.30 |
$0.30 |
|
NL |
Empagliflozin |
$0.00 |
$0.00 |
$0.00 |
$0.00 |
$0.05 |
$0.13 |
$0.28 |
$0.44 |
$0.67 |
$0.97 |
Canagliflozin |
$0.00 |
$0.00 |
$0.01 |
$0.08 |
$0.18 |
$0.25 |
$0.25 |
$0.30 |
$0.38 |
$0.44 |
|
Other SGLT-2 |
$0.00 |
$0.00 |
$0.00 |
$0.04 |
$0.12 |
$0.22 |
$0.34 |
$0.46 |
$0.55 |
$0.68 |
|
Semaglutide |
$0.00 |
$0.00 |
$0.00 |
$0.00 |
$0.00 |
$0.00 |
$0.06 |
$0.37 |
$0.84 |
$1.56 |
|
Liraglutide |
$0.43 |
$0.50 |
$0.56 |
$0.66 |
$0.72 |
$0.75 |
$0.82 |
$0.85 |
$0.79 |
$0.85 |
|
Other GLP-1 |
$0.00 |
$0.01 |
$0.00 |
$0.00 |
$0.03 |
$0.11 |
$0.19 |
$0.22 |
$0.22 |
$0.21 |
|
Sitagliptin |
$0.50 |
$0.68 |
$0.88 |
$1.06 |
$1.26 |
$1.49 |
$1.76 |
$1.99 |
$2.14 |
$2.23 |
|
Linagliptin |
$0.01 |
$0.05 |
$0.08 |
$0.09 |
$0.10 |
$0.11 |
$0.12 |
$0.12 |
$0.13 |
$0.13 |
|
Other DPP-4 |
$0.14 |
$0.14 |
$0.16 |
$0.16 |
$0.15 |
$0.14 |
$0.13 |
$0.13 |
$0.12 |
$0.08 |
|
Insulin degludec |
$0.00 |
$0.00 |
$0.00 |
$0.00 |
$0.00 |
$0.00 |
$0.08 |
$0.38 |
$0.76 |
$1.09 |
|
Insulin glargine |
$1.01 |
$1.19 |
$1.36 |
$1.56 |
$1.71 |
$1.91 |
$2.16 |
$2.30 |
$2.41 |
$2.33 |
|
Other insulins |
$3.06 |
$3.36 |
$3.71 |
$4.10 |
$4.32 |
$4.42 |
$4.51 |
$4.50 |
$4.49 |
$4.36 |
|
Metformin |
$1.08 |
$0.90 |
$0.85 |
$0.81 |
$0.91 |
$1.00 |
$0.89 |
$0.91 |
$0.94 |
$0.98 |
|
Other |
$0.76 |
$0.51 |
$0.43 |
$0.41 |
$0.43 |
$0.41 |
$0.38 |
$0.38 |
$0.38 |
$0.38 |
|
Notes:
- Quebec public drug plan data not shown here because it is not included in the NPDUIS database and estimates based on the IQVIA Payer Insights database were incompatible due to cost reporting differences.
- Sales for each molecule include sales for versions in combination with metformin. For example, sales of empagliflozin include both sales for empagliflozin alone (Jardiance) and empagliflozin and metformin (Synjardy).
Data sources (data extracted in Q4-2022):
- Public drug plans: National Prescription Drug Utilization Information System Database, Canadian Institute for Health Information. All jurisdictions except Quebec.
- Private drug plans: IQVIA Private Pay Direct Drug Plan Database.

Figure description
This figure shows two stacked column graphs that show drug plan claims indexed to 2017 from 2012 to 2021. The data are shown by drug class and by jurisdiction. The first graph shows the data for public drug plans and the second graph shows the data for private drug plans.
Note: Prince Edward Island not included due to program changes resulting in distorted indexed data.
| Public Drug Plans | |||||||||||
|---|---|---|---|---|---|---|---|---|---|---|---|
| 2012 | 2013 | 2014 | 2015 | 2016 | 2017 | 2018 | 2019 | 2020 | 2021 | ||
BC |
DPP-4 |
0.190 |
0.323 |
0.476 |
0.599 |
0.784 |
0.999 |
1.244 |
1.475 |
1.531 |
1.464 |
GLP-1 |
0.000 |
0.000 |
0.000 |
0.000 |
0.000 |
0.000 |
0.000 |
0.000 |
0.000 |
0.223 |
|
SGLT-2 |
0.000 |
0.000 |
0.000 |
0.000 |
0.000 |
0.001 |
0.000 |
0.170 |
0.800 |
1.229 |
|
AB |
DPP-4 |
0.068 |
0.181 |
0.279 |
0.395 |
0.518 |
0.721 |
0.877 |
1.039 |
1.293 |
1.125 |
GLP-1 |
0.000 |
0.000 |
0.000 |
0.000 |
0.000 |
0.000 |
0.000 |
0.042 |
0.318 |
0.475 |
|
SGLT-2 |
0.000 |
0.000 |
0.000 |
0.008 |
0.087 |
0.279 |
0.451 |
0.729 |
1.187 |
1.323 |
|
SK |
DPP-4 |
0.151 |
0.329 |
0.473 |
0.594 |
0.688 |
0.716 |
0.741 |
0.772 |
0.804 |
0.742 |
GLP-1 |
0.000 |
0.000 |
0.000 |
0.000 |
0.000 |
0.000 |
0.000 |
0.000 |
0.021 |
0.293 |
|
SGLT-2 |
0.000 |
0.000 |
0.000 |
0.022 |
0.134 |
0.284 |
0.422 |
0.663 |
0.954 |
1.228 |
|
MB |
DPP-4 |
0.060 |
0.255 |
0.395 |
0.521 |
0.591 |
0.672 |
0.791 |
0.891 |
0.954 |
0.937 |
GLP-1 |
0.000 |
0.001 |
0.001 |
0.001 |
0.000 |
0.001 |
0.000 |
0.000 |
0.000 |
0.175 |
|
SGLT-2 |
0.000 |
0.000 |
0.000 |
0.003 |
0.088 |
0.328 |
0.523 |
0.728 |
1.121 |
1.493 |
|
ON |
DPP-4 |
0.216 |
0.339 |
0.459 |
0.579 |
0.669 |
0.785 |
0.915 |
1.021 |
1.075 |
1.007 |
GLP-1 |
0.000 |
0.000 |
0.000 |
0.000 |
0.000 |
0.000 |
0.000 |
0.012 |
0.097 |
0.151 |
|
SGLT-2 |
0.000 |
0.000 |
0.000 |
0.020 |
0.102 |
0.215 |
0.320 |
0.447 |
0.605 |
0.729 |
|
QC |
DPP-4 |
NA |
0.321 |
0.441 |
0.555 |
0.687 |
0.803 |
0.891 |
0.975 |
0.927 |
0.931 |
GLP-1 |
NA |
0.003 |
0.006 |
0.013 |
0.018 |
0.027 |
0.039 |
0.054 |
0.093 |
0.139 |
|
SGLT-2 |
NA |
0.000 |
0.000 |
0.013 |
0.063 |
0.170 |
0.258 |
0.376 |
0.466 |
0.596 |
|
NB |
DPP-4 |
0.060 |
0.182 |
0.339 |
0.516 |
0.679 |
0.843 |
0.959 |
1.073 |
1.145 |
1.044 |
GLP-1 |
0.000 |
0.000 |
0.000 |
0.000 |
0.000 |
0.000 |
0.000 |
0.000 |
0.040 |
0.204 |
|
SGLT-2 |
0.000 |
0.000 |
0.000 |
0.001 |
0.069 |
0.157 |
0.198 |
0.278 |
0.433 |
0.600 |
|
NS |
DPP-4 |
0.365 |
0.690 |
0.898 |
1.035 |
1.016 |
0.977 |
0.990 |
0.995 |
1.010 |
0.874 |
GLP-1 |
0.001 |
0.001 |
0.001 |
0.003 |
0.002 |
0.002 |
0.002 |
0.002 |
0.047 |
1.105 |
|
SGLT-2 |
0.000 |
0.000 |
0.000 |
0.001 |
0.010 |
0.021 |
0.055 |
0.469 |
1.223 |
2.020 |
|
PE |
DPP-4 |
0.000 |
0.000 |
0.000 |
0.176 |
0.595 |
0.803 |
1.074 |
1.294 |
1.496 |
1.937 |
GLP-1 |
0.000 |
0.000 |
0.000 |
0.000 |
0.000 |
0.000 |
0.000 |
0.246 |
5.782 |
12.277 |
|
SGLT-2 |
0.000 |
0.000 |
0.000 |
0.000 |
0.000 |
0.197 |
0.426 |
1.139 |
4.838 |
8.208 |
|
NL |
DPP-4 |
0.391 |
0.552 |
0.724 |
0.848 |
1.041 |
0.852 |
0.713 |
0.624 |
0.615 |
0.624 |
GLP-1 |
0.000 |
0.000 |
0.000 |
0.000 |
0.000 |
0.000 |
0.000 |
0.000 |
0.237 |
0.802 |
|
SGLT-2 |
0.000 |
0.000 |
0.000 |
0.006 |
0.085 |
0.148 |
0.183 |
0.207 |
0.738 |
1.645 |
|
| Private Drug Plans | |||||||||||
|---|---|---|---|---|---|---|---|---|---|---|---|
| 2012 | 2013 | 2014 | 2015 | 2016 | 2017 | 2018 | 2019 | 2020 | 2021 | ||
BC |
DPP-4 |
0.144 |
0.181 |
0.226 |
0.272 |
0.302 |
0.392 |
0.451 |
0.483 |
0.499 |
0.455 |
GLP-1 |
0.104 |
0.118 |
0.130 |
0.140 |
0.165 |
0.226 |
0.292 |
0.406 |
0.542 |
0.680 |
|
SGLT-2 |
0.000 |
0.000 |
0.021 |
0.128 |
0.244 |
0.382 |
0.495 |
0.612 |
0.746 |
0.822 |
|
AB |
DPP-4 |
0.200 |
0.244 |
0.297 |
0.362 |
0.390 |
0.413 |
0.447 |
0.471 |
0.538 |
0.435 |
GLP-1 |
0.097 |
0.121 |
0.137 |
0.161 |
0.207 |
0.255 |
0.326 |
0.449 |
0.645 |
0.888 |
|
SGLT-2 |
0.000 |
0.000 |
0.014 |
0.119 |
0.232 |
0.332 |
0.420 |
0.523 |
0.729 |
0.723 |
|
SK |
DPP-4 |
0.144 |
0.216 |
0.289 |
0.365 |
0.404 |
0.423 |
0.456 |
0.509 |
0.520 |
0.475 |
GLP-1 |
0.036 |
0.037 |
0.042 |
0.052 |
0.060 |
0.088 |
0.127 |
0.212 |
0.312 |
0.471 |
|
SGLT-2 |
0.000 |
0.000 |
0.015 |
0.193 |
0.371 |
0.489 |
0.614 |
0.793 |
0.971 |
1.102 |
|
MB |
DPP-4 |
0.132 |
0.205 |
0.265 |
0.300 |
0.382 |
0.433 |
0.491 |
0.539 |
0.582 |
0.509 |
GLP-1 |
0.053 |
0.064 |
0.070 |
0.072 |
0.079 |
0.093 |
0.103 |
0.133 |
0.190 |
0.325 |
|
SGLT-2 |
0.000 |
0.000 |
0.013 |
0.122 |
0.296 |
0.474 |
0.598 |
0.759 |
1.020 |
1.162 |
|
ON |
DPP-4 |
0.249 |
0.320 |
0.387 |
0.444 |
0.489 |
0.530 |
0.569 |
0.591 |
0.650 |
0.529 |
GLP-1 |
0.058 |
0.069 |
0.078 |
0.081 |
0.098 |
0.131 |
0.181 |
0.250 |
0.330 |
0.428 |
|
SGLT-2 |
0.000 |
0.000 |
0.019 |
0.139 |
0.246 |
0.339 |
0.430 |
0.522 |
0.677 |
0.679 |
|
QC |
DPP-4 |
0.241 |
0.324 |
0.402 |
0.463 |
0.523 |
0.575 |
0.613 |
0.628 |
0.624 |
0.534 |
GLP-1 |
0.047 |
0.059 |
0.068 |
0.076 |
0.092 |
0.118 |
0.152 |
0.210 |
0.298 |
0.390 |
|
SGLT-2 |
0.000 |
0.000 |
0.012 |
0.105 |
0.209 |
0.307 |
0.391 |
0.478 |
0.574 |
0.607 |
|
NB |
DPP-4 |
0.215 |
0.279 |
0.351 |
0.413 |
0.501 |
0.560 |
0.612 |
0.654 |
0.710 |
0.640 |
GLP-1 |
0.074 |
0.093 |
0.103 |
0.099 |
0.102 |
0.122 |
0.163 |
0.226 |
0.312 |
0.466 |
|
SGLT-2 |
0.000 |
0.000 |
0.005 |
0.075 |
0.202 |
0.318 |
0.411 |
0.515 |
0.658 |
0.776 |
|
NS |
DPP-4 |
0.218 |
0.280 |
0.324 |
0.371 |
0.412 |
0.425 |
0.443 |
0.451 |
0.495 |
0.418 |
GLP-1 |
0.122 |
0.135 |
0.148 |
0.156 |
0.207 |
0.287 |
0.374 |
0.494 |
0.622 |
0.835 |
|
SGLT-2 |
0.000 |
0.000 |
0.007 |
0.076 |
0.179 |
0.288 |
0.373 |
0.488 |
0.661 |
0.753 |
|
PE |
DPP-4 |
0.185 |
0.242 |
0.292 |
0.343 |
0.396 |
0.453 |
0.472 |
0.495 |
0.543 |
0.475 |
GLP-1 |
0.157 |
0.175 |
0.181 |
0.172 |
0.207 |
0.265 |
0.298 |
0.421 |
0.747 |
1.084 |
|
SGLT-2 |
0.000 |
0.000 |
0.008 |
0.081 |
0.164 |
0.283 |
0.415 |
0.551 |
0.785 |
0.914 |
|
NL |
DPP-4 |
0.283 |
0.340 |
0.427 |
0.481 |
0.520 |
0.589 |
0.646 |
0.704 |
0.796 |
0.725 |
GLP-1 |
0.113 |
0.121 |
0.126 |
0.138 |
0.147 |
0.165 |
0.201 |
0.271 |
0.368 |
0.517 |
|
SGLT-2 |
0.000 |
0.000 |
0.003 |
0.059 |
0.148 |
0.246 |
0.351 |
0.472 |
0.646 |
0.777 |
|
Note: Prince Edward Island not included due to program changes resulting in distorted indexed data.
Data sources (data extracted in Q4-2022):
- Public drug plans, all provinces except Quebec: National Prescription Drug Utilization Information System Database, Canadian Institute for Health Information.
- Public drug plans, Quebec only: IQVIA Payer Insights Database.
- Private drug plans: IQVIA Private Pay Direct Drug Plan Database
As the prevalence of diabetes is expected to increase in coming years (see Section 1), payers can mitigate cost pressures by implementing formulary management strategies to balance optimal drug therapy for the patient while keeping health care budgets sustainable. Provincial plans can limit access to expensive drugs by requiring that other, less-expensive, therapies be attempted first. This is the case for most new-generation/non-insulin drugs that are listed with criteria in all provinces except Ontario, where they are open benefits. And while provinces can also encourage the use of less expensive generics, all drugs in the DPP-4, GLP-1, and SGLT-2 subclasses are still under patent and generic copies for the first DPP-4’s are not expected before 2026.
As discussed in subsection 3.1, Canadian prices for top-selling antidiabetic drugs were higher than the calculated PMPRB11 median price. As shown in Figure 3.12, the implication of this differential is $703M in savings nationally (retail and hospital) that could have been achieved based on calculated sales using the PMPRB11 median price ($1,181M) versus actual Canadian sales at list prices ($1,884M=$1,181M+$703M), while the remaining drugs not selected for price comparisons remain at $849M (see data for “all antidiabetics” in Figure 3.12). Except for insulin degludec (Tresiba), all top-selling drugs selected for this analysis are new-generation/non-insulin drugs and their respective cost implications are also shown in Figure 3.12. The greatest contributor to the overall differential ($703M) was the DPP-4 subclass ($280M), accounting for 40% of the differential. This was followed by the GLP-1 subclass ($242M) and the SGLT-2 subclass ($126), which accounted for 34% and 18% of the differential, respectively. Insulin degludec (not shown) accounted for 8% ($56M). It is worth noting that payers may have already obtained some savings through confidential prices and and rebates which are not included in the available data.
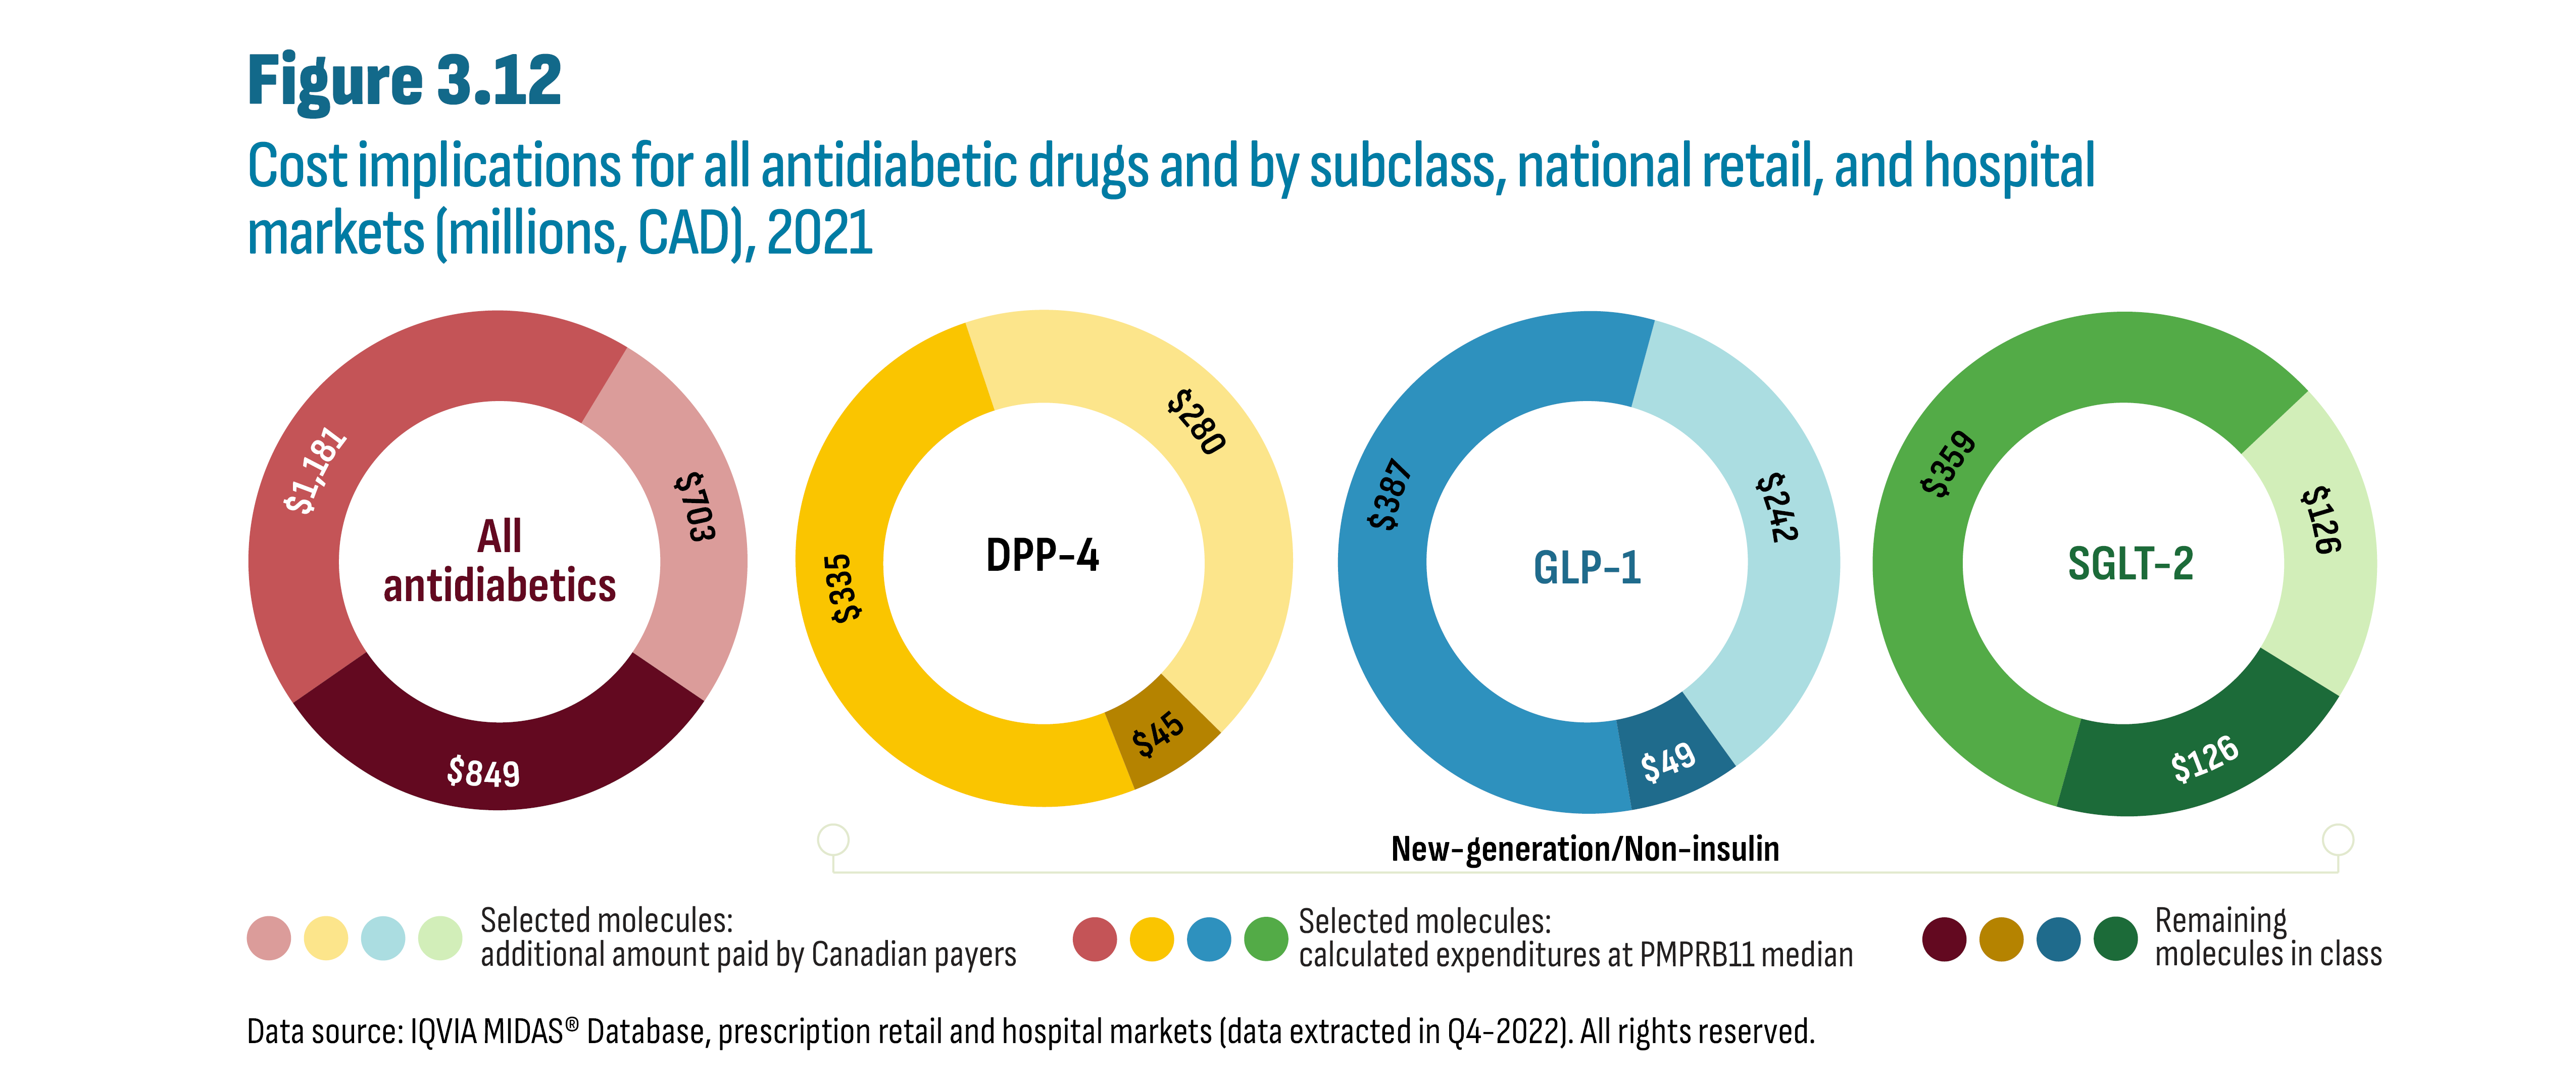
Figure description
This figure contains four doughnut charts that show the cost implications in 2021 related to drug expenditures calculated at Canadian list prices versus expenditures calculated at the PMPRB11 median prices. The first graph provides the results for all antidiabetics and the following three graphs provide results for each class of new-generation/non-insulin drugs: DPP-4; GLP-1; and SGLT-2.
Drug Class |
Molecule groupings |
Cost implication |
All antidiabetics |
Remaining molecules in class |
$849 million |
Selected molecules: calculated expenditures at PMPRB11 median |
$1,181 million |
|
Selected molecules: additional amount paid by Canadian payers |
$703 million |
|
DPP-4 |
Remaining molecules in class |
$45 million |
Selected molecules: calculated expenditures at PMPRB11 median |
$335 million |
|
Selected molecules: additional amount paid by Canadian payers |
$280 million |
|
GLP-1 |
Remaining molecules in class |
$49 million |
Selected molecules: calculated expenditures at PMPRB11 median |
$387 million |
|
Selected molecules: additional amount paid by Canadian payers |
$242 million |
|
SGLT-2 |
Remaining molecules in class |
$126 million |
Selected molecules: calculated expenditures at PMPRB11 median |
$359 million |
|
Selected molecules: additional amount paid by Canadian payers |
$126 million |
Data source: IQVIA MIDAS® Database, prescription retail and hospital markets (data extracted in Q4-2022). All rights reserved.
The cost implications for the top-selling antidiabetic drugs were also calculated for each province (see Figure 3.13). This cost differential was highest in Ontario and Alberta both in terms of absolute spending ($273.7M and $32.9M, respectively) and as a proportion of overall spending on antidiabetic drugs (30% and 28%, respectively). This cost differential represented 4% of both provinces’ total overall drug plan spending (all drugs, not shown). The cost implications for the other provinces (except Newfoundland) hovered near 20% of spending on antidiabetic drugs, representing a 1% to 3% share of overall drug plan spending.

Figure description
This a stacked column graph shows the cost implications in 2021 for public drug plans related to antidiabetic drug expenditures calculated at Canadian list prices versus expenditures calculated at the PMPRB11 median prices. The data are provided by jurisdiction.
|
BC |
AB |
SK |
MB |
ON |
NB |
NS |
PE |
NL |
Selected molecules: additional amount paid by Canadian payers |
$12.0 |
$32.9 |
$6.9 |
$3.3 |
$273.7 |
$5.1 |
$4.4 |
$1.5 |
$1.0 |
Selected molecules: calculated expenditures at PMPRB11 median |
$20.3 |
$51.8 |
$11.7 |
$5.5 |
$411.2 |
$7.6 |
$7.1 |
$2.4 |
$1.9 |
Remaining molecules in class |
$37.2 |
$33.4 |
$18.6 |
$10.6 |
$221.3 |
$8.5 |
$11.8 |
$2.3 |
$8.5 |
Data source: National Prescription Drug Utilization Information System Database, Canadian Institute for Health Information (data extracted in Q4-2022).
While generic competition for new-generation/non-insulin drugs is still a few years away (beyond 2026), provincial drug plans have begun implementing policies to encourage a switch to biosimilars in the insulin market. The remainder of this subsection presents a case study examining the impact of biosimilar switching policies for insulin glargine on utilization patterns by province. The analysis also looks at the impact of concurrent formulary changes as well as the launch of insulin degludec (Tresiba) on total insulin glargine utilization during that time.
Figure 3.14 summarizes the key formulary changes related to both insulin glargine and insulin degludec beginning in 2017/18 and up to 2021.Footnote v The early biosimilar switching policies, beginning in 2017, required naïve (new) patients to initiate treatment with the biosimilar version of insulin glargine, while patients already established on insulin therapy could continue to receive coverage for the brand (Lantus). By the end of 2021, only British Columbia, Alberta, and New Brunswick mandated biosimilar switching. However, New Brunswick’s policy was implemented very late in 2021 and its impact will only become apparent in the 2022 data. Consequently, in this analysis, New Brunswick is categorized as a province with a naïve biosimilar policy in effect upon listing biosimilars in late 2017.
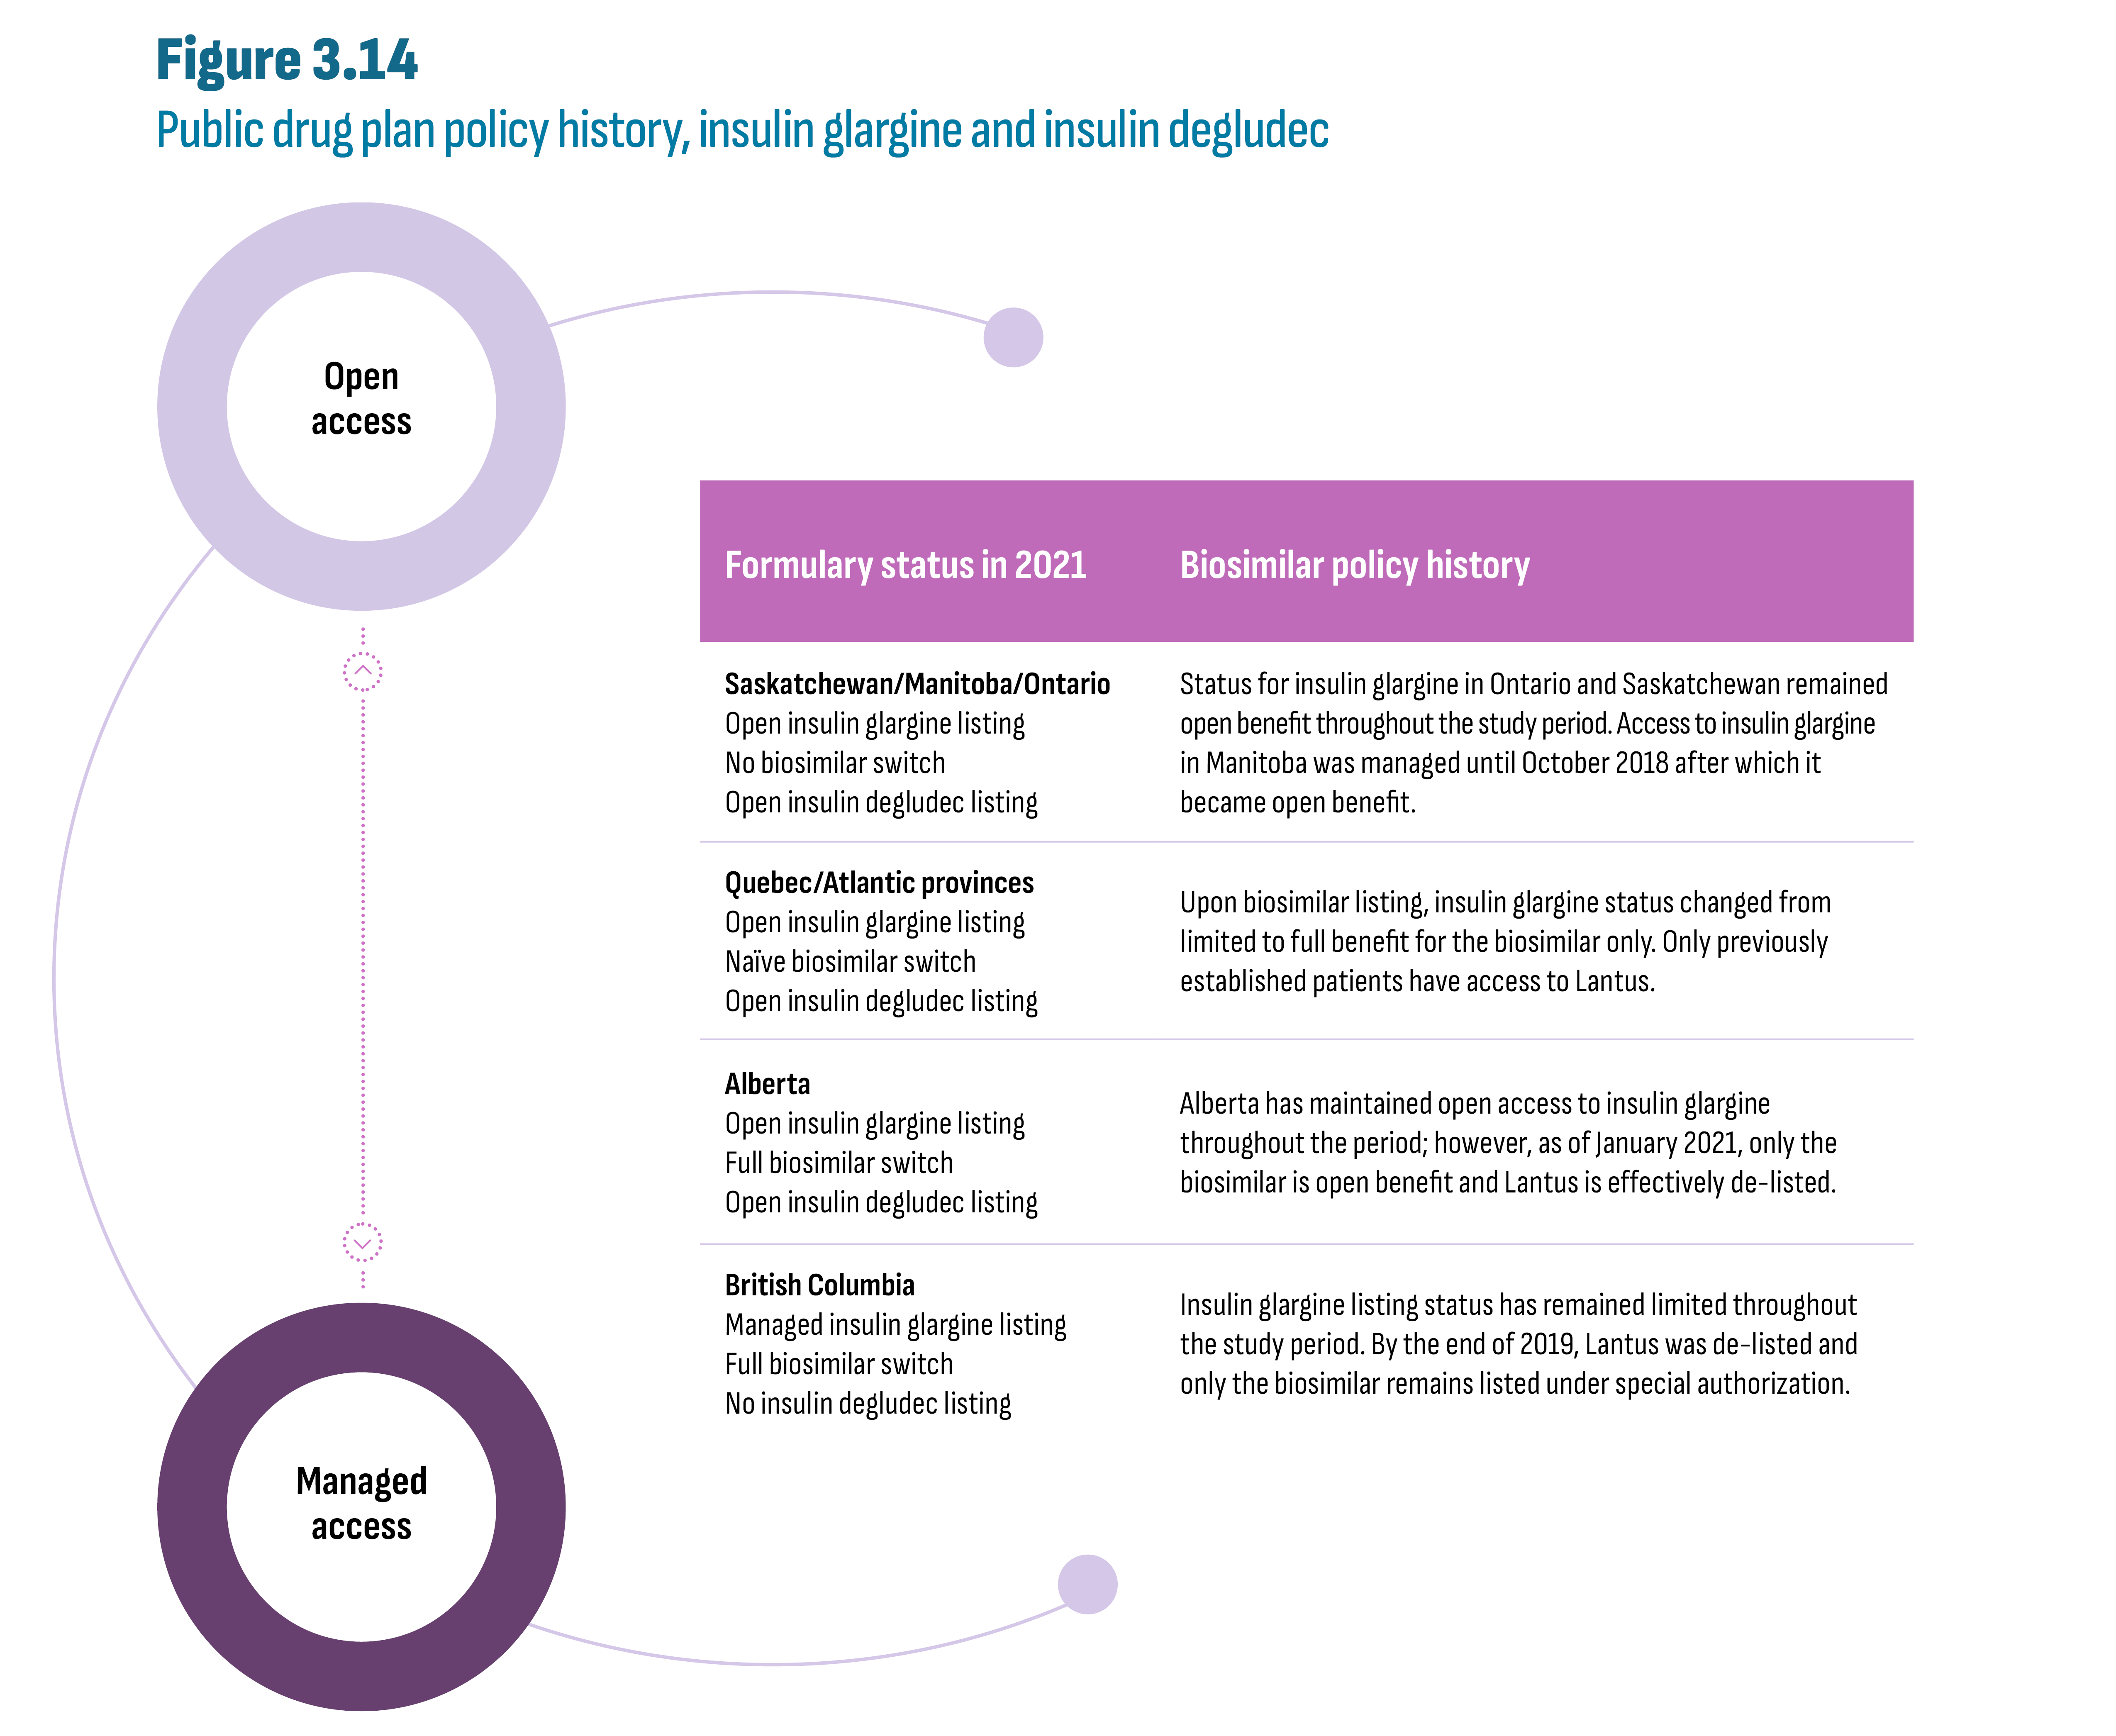
Figure description
This figure summarizes the key public drug plan formulary changes related to both insulin glargine and insulin degludec beginning in 2017/18 and up to 2021. A continuum between two circles labeled “Managed access” (at the bottom) and “Open access” (at the top) is shown next to the following table:
| Formulary status in 2021 | Biosimilar policy history |
|---|---|
Saskatchewan/Manitoba/Ontario Open insulin glargine listing No biosimilar switch Open insulin degludec listing |
Status for insulin glargine in Ontario and Saskatchewan remained open benefit throughout the study period. Access to insulin glargine in Manitoba was managed until October 2018 after which it became open benefit. |
Quebec/Atlantic provinces Open insulin glargine listing Naïve biosimilar switch Open insulin degludec listing |
Upon biosimilar listing, insulin glargine status changed from limited to full benefit for the biosimilar only. Only previously established patients have access to Lantus. |
Alberta Open insulin glargine listing Full biosimilar switch Open insulin degludec listing |
Alberta has maintained open access to insulin glargine throughout the period; however, as of January 2021, only the biosimilar is open benefit and Lantus is effectively de-listed. |
British Columbia Managed insulin glargine listing Full biosimilar switch No insulin degludec listing |
Insulin glargine listing status has remained limited throughout the study period. By the end of 2019, Lantus was de-listed and only the biosimilar remains listed under special authorization. |
The effect of a full biosimilar switching policy in the British Columbia and Alberta public drug plans was swift and complete while provinces with naïve biosimilar policies (Quebec and Atlantic provinces) saw a slower pace of change. As shown in Figure 3.15, Lantus’ share of insulin glargine claims in British Columbia and Alberta remained near 100% up until the policy was fully implemented and fell to virtually 0% after implementation (by 2020 in British Columbia and by 2021 in Alberta). In contrast, Lantus’ market share remained well above 75% by 2021 in provinces without any biosimilar policy (Saskatchewan: 95%; Manitoba: 86%; and Ontario: 77%). The naïve biosimilar policies in Quebec and in Atlantic provinces (implemented in 2017/18) gradually shifted prescribing toward biosimilars resulting in market shares for Lantus below 25% by 2021. Private drug plans in British Columbia, which are often more integrated with the public planFootnote 7, matched the dramatic change observed in the public sector. The cash market saw a similar change since only drugs covered by the provincial plan are applied to the income-based deductible in British Columbia. By contrast, populations covered by private and public plans in Alberta are very distinct, resulting in little spillover between the two market segments. Despite a near complete biosimilar switch in the public sector, Lantus’ market share only dropped by 10 percentage points after the biosimilar policy in both private and cash markets (from roughly 70% to 60%).
Moreover, uptake of biosimilars in both the private and cash markets in the absence of a biosimilar switching policy was consistently greater than in public plans. (The absence of a policy can be observed both prior to implementation and in provinces without a policy.) The reason may be that patients in the private and cash markets are on average younger and initiating treatment compared to patients in public plans that might be older and long-established on therapy. Even in a province like British Columbia where the universal program does not distinguish between seniors and non-seniors, younger patients may not reach their yearly deductible as they may have lower overall drug expenses due to fewer co-morbidities or beginning therapy mid-year. Another consideration in the cash market is drug affordability for patients who pay out-of-pocket. In these cases, biosimilars provide cost savings of 22%, or $265 per year for an average patient.Footnote vi This reasoning also holds in provinces with naïve patient switching policies (Quebec and Atlantic provinces) where Lantus’ loss of market share in private and cash markets was greater than in the provinces where no biosimilar policy was in effect. It appears that the biosimilar policy targeting naïve patients changed prescribing habits in all market segments.
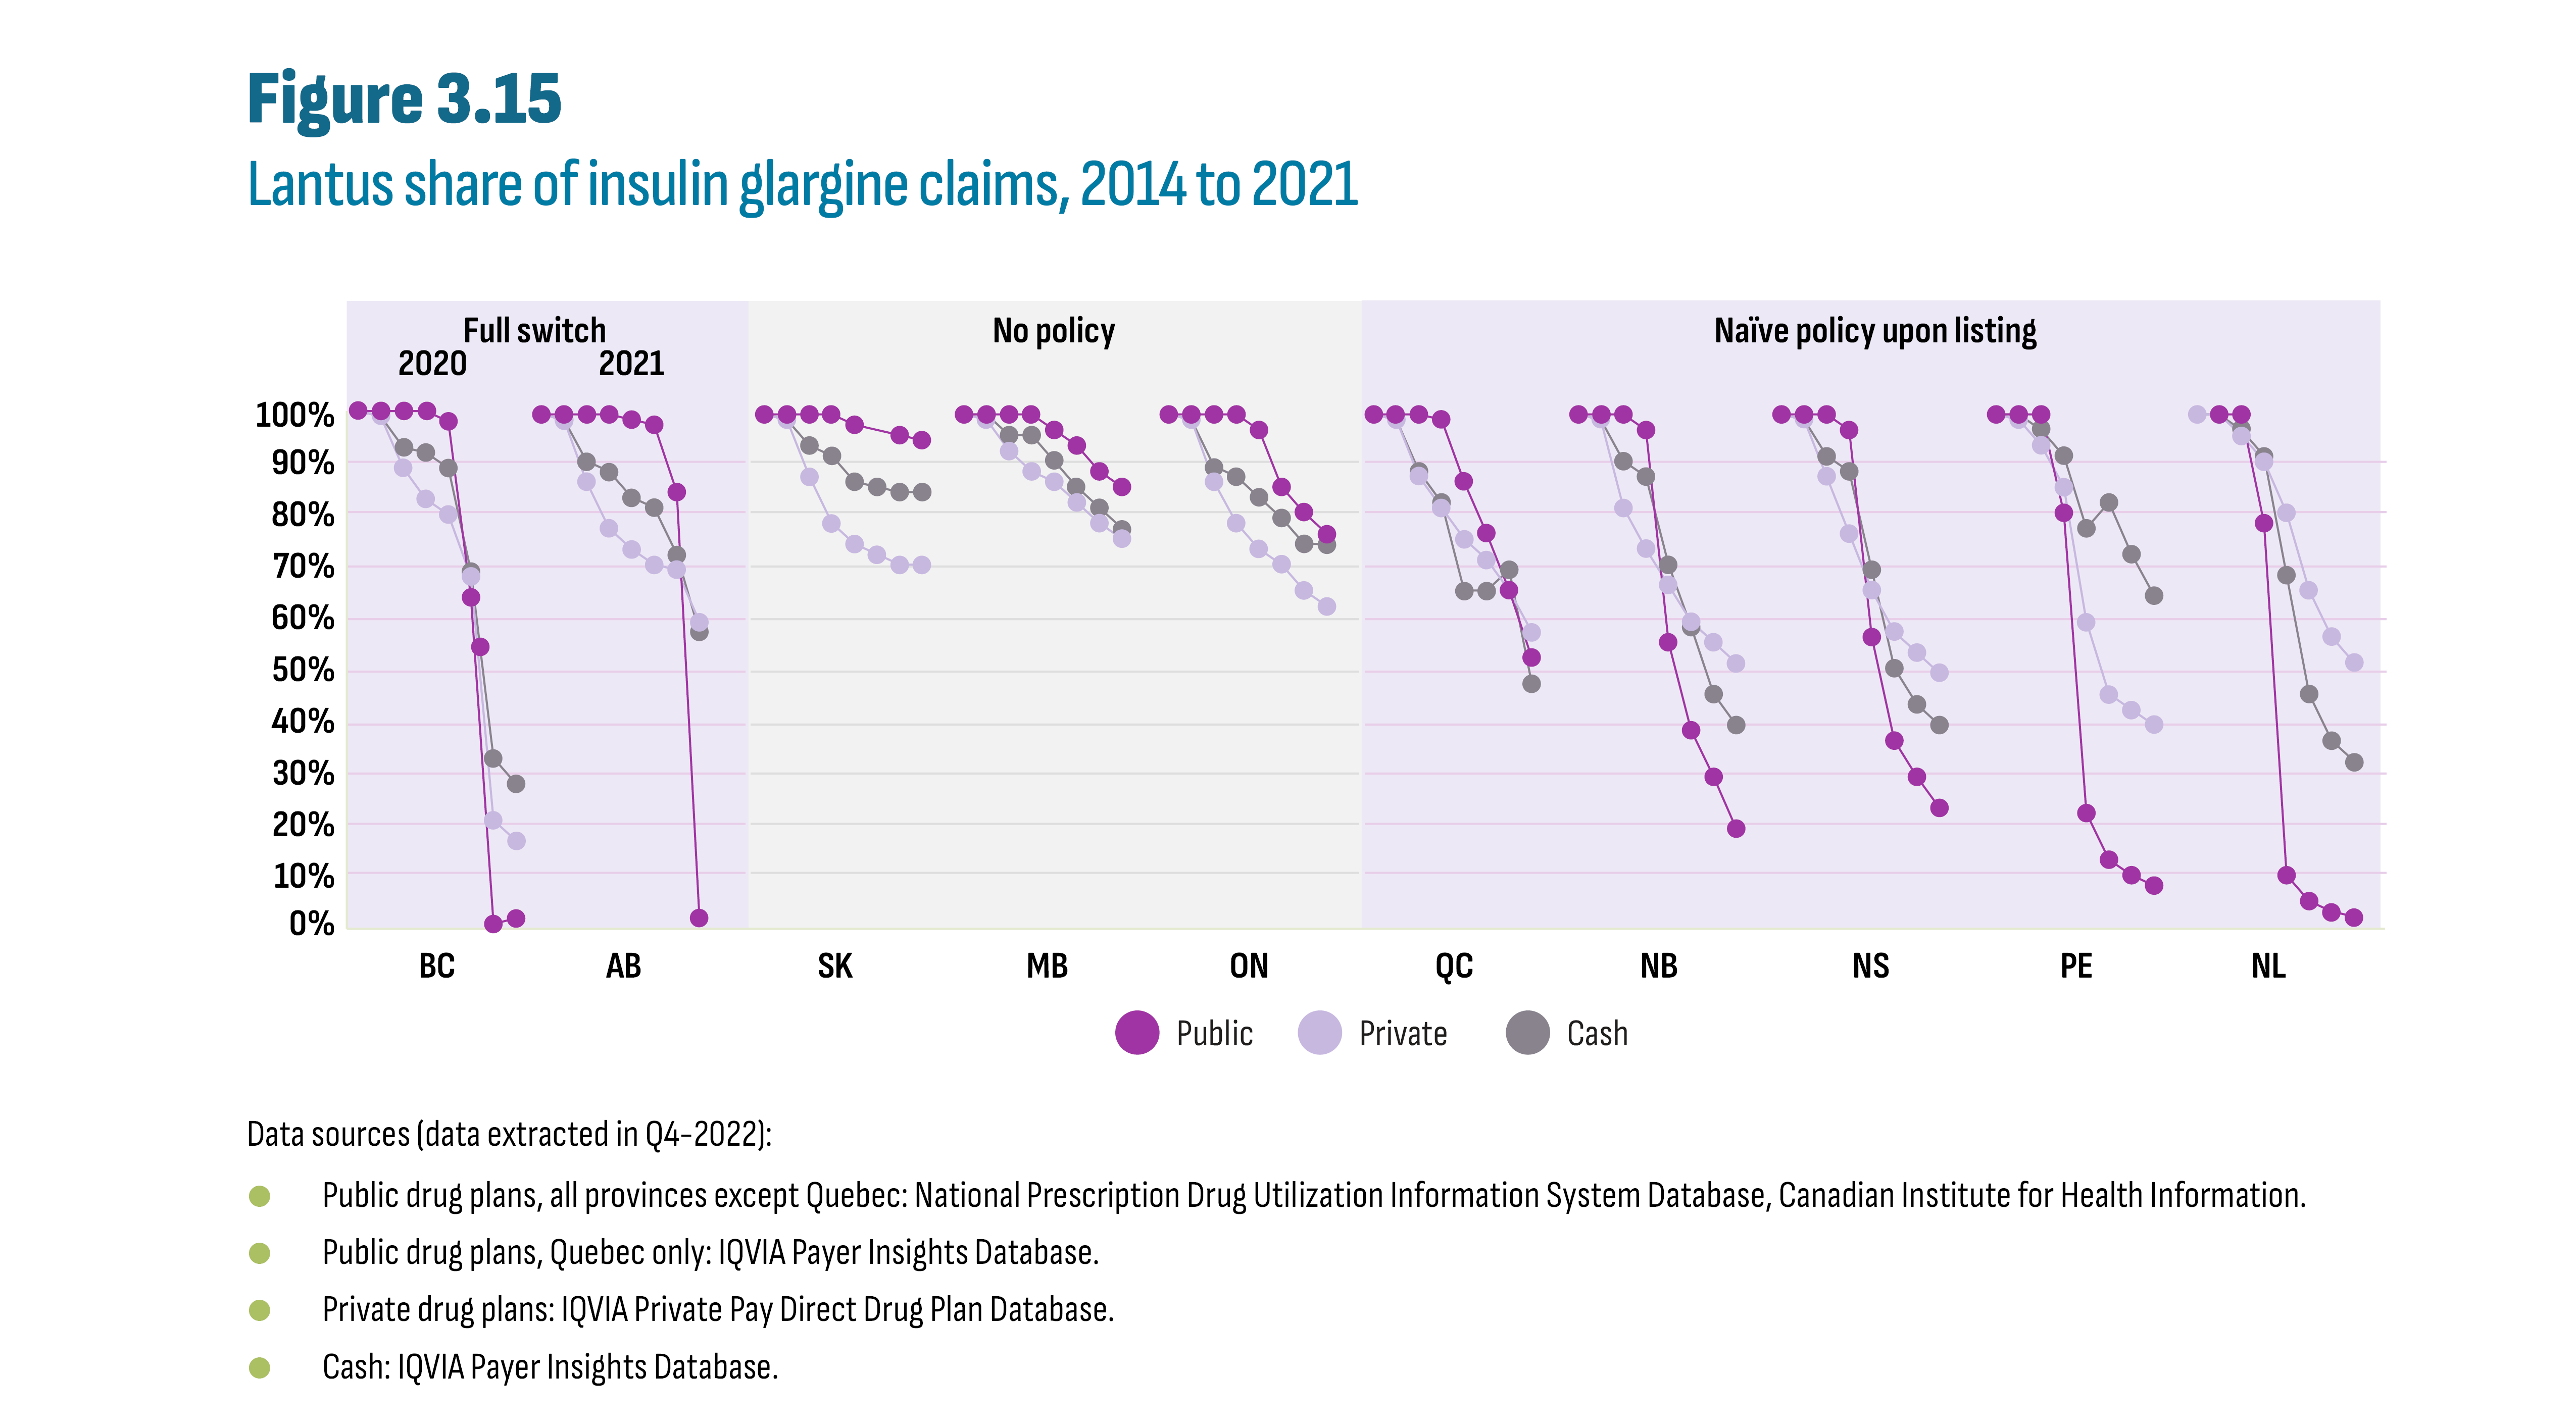
Figure description
This figure shows Lantus’ share of insulin glargine claims from 2014 to 2021 by market segment (i.e. public, private, and cash) and by jurisdiction. The figure groups the provinces according to the public drug plan switching policy in effect in 2021 (full, naïve, or no policy).
| Province | Provincial biosimilar policy | Market segment | 2014 | 2015 | 2016 | 2017 | 2018 | 2019 | 2020 | 2021 |
|---|---|---|---|---|---|---|---|---|---|---|
BC |
Full switch in 2020 |
Public |
100% |
100% |
100% |
100% |
98% |
64% |
1% |
2% |
Private |
100% |
99% |
89% |
83% |
80% |
68% |
21% |
17% |
||
Cash |
100% |
99% |
93% |
92% |
89% |
69% |
33% |
28% |
||
AB |
Full switch in 2021 |
Public |
100% |
100% |
100% |
100% |
99% |
98% |
85% |
3% |
Private |
100% |
99% |
87% |
78% |
74% |
71% |
70% |
60% |
||
Cash |
100% |
99% |
91% |
89% |
84% |
82% |
73% |
58% |
||
SK |
No policy |
Public |
100% |
100% |
100% |
100% |
98% |
97% |
96% |
95% |
Private |
100% |
99% |
88% |
79% |
75% |
73% |
71% |
71% |
||
Cash |
100% |
99% |
94% |
92% |
87% |
86% |
85% |
85% |
||
MB |
No policy |
Public |
100% |
100% |
100% |
100% |
97% |
94% |
89% |
86% |
Private |
100% |
99% |
93% |
89% |
87% |
83% |
79% |
76% |
||
Cash |
100% |
100% |
96% |
96% |
91% |
86% |
82% |
78% |
||
ON |
No policy |
Public |
100% |
100% |
100% |
100% |
97% |
86% |
81% |
77% |
Private |
100% |
99% |
87% |
79% |
74% |
71% |
66% |
63% |
||
Cash |
100% |
99% |
90% |
88% |
84% |
80% |
75% |
75% |
||
QC |
Naïve policy upon listing |
Public |
100% |
100% |
100% |
99% |
87% |
77% |
66% |
53% |
Private |
100% |
99% |
88% |
82% |
76% |
72% |
66% |
58% |
||
Cash |
100% |
99% |
89% |
83% |
66% |
66% |
70% |
48% |
||
NB |
Naïve policy upon listing |
Public |
100% |
100% |
100% |
97% |
56% |
39% |
30% |
20% |
Private |
100% |
99% |
82% |
74% |
67% |
60% |
56% |
52% |
||
Cash |
100% |
99% |
91% |
88% |
71% |
59% |
46% |
40% |
||
NS |
Naïve policy upon listing |
Public |
100% |
100% |
100% |
97% |
57% |
37% |
30% |
24% |
Private |
100% |
99% |
88% |
77% |
66% |
58% |
54% |
50% |
||
Cash |
100% |
99% |
92% |
89% |
70% |
51% |
44% |
40% |
||
PE |
Naïve policy upon listing |
Public |
100% |
100% |
100% |
81% |
23% |
14% |
11% |
9% |
Private |
100% |
99% |
94% |
86% |
60% |
46% |
43% |
40% |
||
Cash |
100% |
100% |
97% |
92% |
78% |
83% |
73% |
65% |
||
NL |
Naïve policy upon listing |
Public |
100% |
100% |
100% |
79% |
11% |
6% |
4% |
3% |
Private |
100% |
100% |
96% |
91% |
81% |
66% |
57% |
52% |
||
Cash |
100% |
100% |
97% |
92% |
69% |
46% |
37% |
33% |
Data sources (data extracted in Q4-2022):
- Public drug plans, all provinces except Quebec: National Prescription Drug Utilization Information System Database, Canadian Institute for Health Information.
- Public drug plans, Quebec only: IQVIA Payer Insights Database.
- Private drug plans: IQVIA Private Pay Direct Drug Plan Database.
- Cash: IQVIA Payer Insights Database.
In addition to the formulary listing decisions affecting insulin glargine claims, all provinces except British Columbia listed insulin degludec (Tresiba), a new long-acting insulin, as an open benefit (see Figures 3.14 and 3.16). The intersection of these evolving decisions resulted in a complex web of market effects which are the focus of the remainder of this subsection.
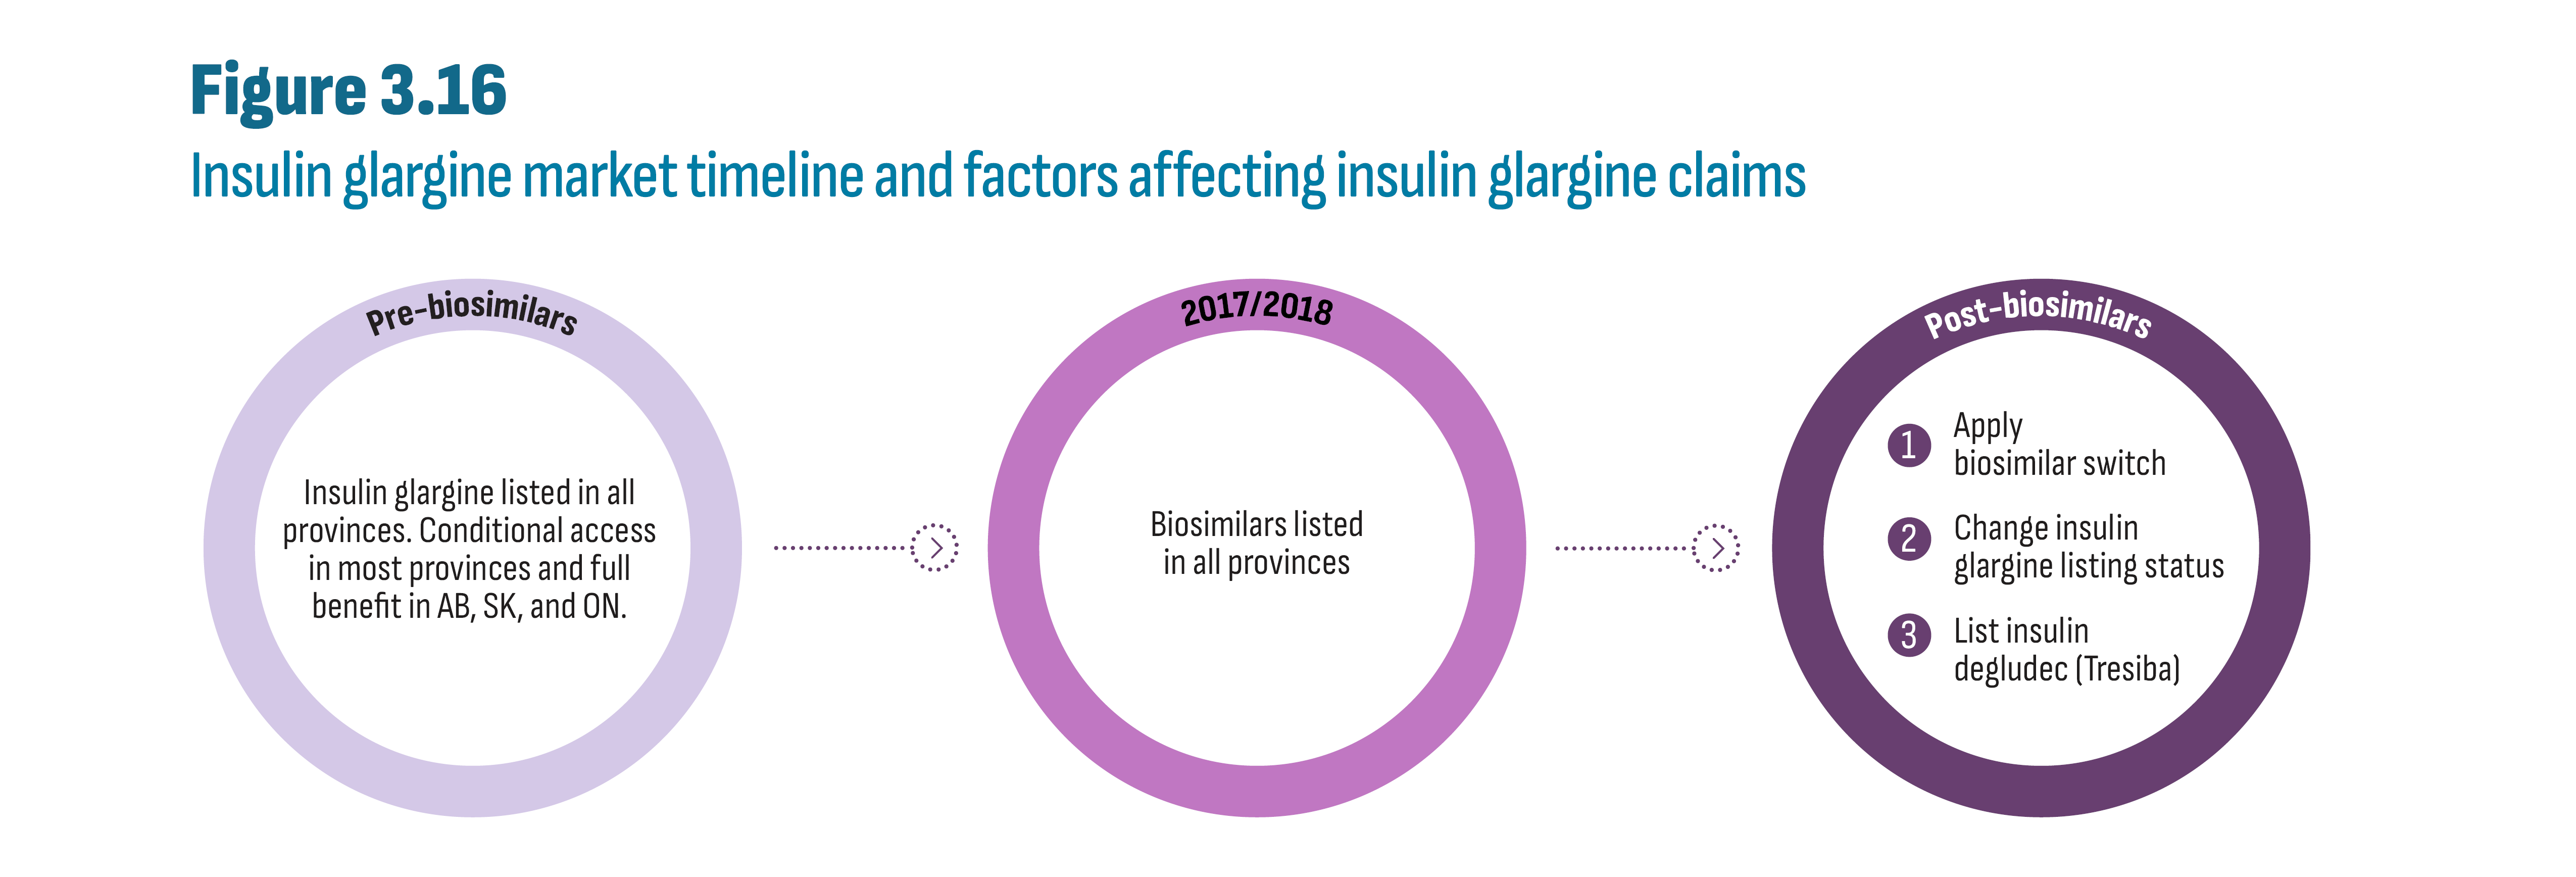
Figure description
This figure shows a continuum from left to right as three separate circles labelled, in order: 1. “Pre-biosimilars”; 2. “2017/2018”; 3. “Post-biosimilars”. There is an arrow between the “Pre-biosimilars” and “2017/2018” circles, and an arrow between the “2017/2018” and “Post-biosimilars” circle. The text inside each circle is as follow:
| Pre-biosimilars | 2017/2018 | Post-biosimilars |
|---|---|---|
Insulin glargine listed in all provinces. Conditional access in most provinces and full benefit in AB, SK, and ON. |
Biosimilars listed in all provinces |
|
The trends discussed below are illustrated in Figure 3.17. They are presented as an index for greater clarity and comparisons across jurisdictions. Newfoundland and Prince Edward Island are not shown due to the small amount of data (see Appendix A: Methodology Notes).
- British Columbia is the only province where claims for insulin glargine remained relatively constant from 2017 to 2021 in the public plan. It is also the only plan that implemented a full biosimilar switching policy while simultaneously maintaining special authorization access for insulin glargine and not listing insulin degludec.
- By contrast, both Saskatchewan and Ontario maintained consistently open access to all insulin products including listing insulin degludec, and both experienced a gradual decline in insulin glargine claims by 2021 of 14% (index: 0.86) and 12% (index: 0.88), respectively.
- Manitoba’s near-50% increase in insulin glargine claims reflects its decision in 2018 to remove its restrictions on these insulins including listing insulin degludec.
- Before implementing its switching policy in 2021, Alberta’s approach and market dynamics were similar to those observed in Saskatchewan and Ontario, both provinces with open access for insulin glargine and insulin degludec. However, while the effect of its full biosimilar switch policy was essentially the same as British Columbia’s, Alberta experienced the largest decline in overall insulin glargine claims (33%) of all jurisdictions. It is possible that the timing of its biosimilar policy, concurrent with listing insulin degludec, precipitated this decline and eroded cost savings generated by the biosimilar policy.
- Upon listing biosimilars in 2017/18, Quebec and Atlantic provinces removed reimbursement criteria for insulin glargine. The result in the Atlantic provinces is a substantial increase in insulin glargine claims. Quebec, however, did not experience a comparable increase, which may simply be due to the timing of policy changes which might have been more apparent between 2016 and 2017 and consequently are not apparent after 2017. Overall, Quebec and Atlantic provinces saw a more modest decline in insulin glargine claims despite listing insulin degludec, suggesting that the early naïve biosimilar policy provided sufficient time to adjust prescribing habits.
- As explained earlier, trends observed in private plans reflect the extent to which the public and private sectors are integrated. For example, in British Columbia, claims for insulin glargine remained relatively flat in both public and private drug plans and uptake of insulin degludec in private plans was lower than in any other province. Private plan trends in Alberta private plans do not mirror the public plan data. Rather, they look more like those observed in Ontario’s private plans which are similarly distinct from their public counterparts.
- The cash market saw little uptake of insulin degludec compared to private plans. The cost of this drug may have been a contributing factor as patients paying out-of-pocket would pay an additional $506 per year (50% more) compared to the biosimilar for insulin glargine.Footnote vii

Figure description
This figure contains three stacked column graphs that show indexed claims for insulin glargine and insulin degludec from 2017 to 2021 by jurisdiction and by market segment (i.e.: public, private, and cash).
Province |
Molecule |
Public drug plans |
Private drug plans |
Cash |
||||||||||||
2017 |
2018 |
2019 |
2020 |
2021 |
2017 |
2018 |
2019 |
2020 |
2021 |
2017 |
2018 |
2019 |
2020 |
2021 |
||
BC |
Insulin degludec |
0.000 |
0.000 |
0.000 |
0.000 |
0.000 |
0.005 |
0.090 |
0.156 |
0.193 |
0.214 |
0.003 |
0.038 |
0.070 |
0.088 |
0.098 |
Insulin glargine |
1.000 |
1.028 |
1.042 |
1.082 |
1.053 |
0.995 |
1.068 |
1.075 |
1.097 |
1.073 |
0.997 |
1.054 |
1.076 |
1.225 |
1.230 |
|
AB |
Insulin degludec |
0.000 |
0.007 |
0.232 |
0.492 |
0.622 |
0.006 |
0.096 |
0.226 |
0.363 |
0.411 |
0.004 |
0.061 |
0.114 |
0.223 |
0.303 |
Insulin glargine |
1.000 |
1.073 |
1.019 |
0.975 |
0.649 |
0.994 |
0.993 |
0.888 |
0.804 |
0.700 |
0.996 |
0.983 |
0.913 |
0.961 |
1.009 |
|
SK |
Insulin degludec |
0.000 |
0.010 |
0.134 |
0.253 |
0.322 |
0.001 |
0.040 |
0.135 |
0.209 |
0.252 |
0.002 |
0.033 |
0.094 |
0.169 |
0.262 |
Insulin glargine |
1.000 |
1.048 |
0.982 |
0.935 |
0.861 |
0.999 |
1.088 |
1.062 |
0.973 |
0.916 |
0.998 |
0.999 |
0.899 |
0.926 |
0.905 |
|
MB |
Insulin degludec |
0.000 |
0.022 |
0.271 |
0.501 |
0.574 |
0.003 |
0.060 |
0.257 |
0.429 |
0.497 |
0.001 |
0.020 |
0.159 |
0.277 |
0.361 |
Insulin glargine |
1.000 |
1.111 |
1.310 |
1.453 |
1.406 |
0.997 |
1.065 |
1.124 |
1.126 |
1.107 |
0.999 |
1.020 |
0.908 |
1.026 |
1.018 |
|
ON |
Insulin degludec |
0.000 |
0.040 |
0.310 |
0.452 |
0.489 |
0.011 |
0.164 |
0.316 |
0.444 |
0.448 |
0.009 |
0.091 |
0.187 |
0.287 |
0.382 |
Insulin glargine |
1.000 |
1.106 |
1.017 |
0.966 |
0.878 |
0.989 |
0.891 |
0.778 |
0.746 |
0.651 |
0.991 |
0.875 |
0.724 |
0.767 |
0.964 |
|
QC |
Insulin degludec |
0.000 |
0.014 |
0.218 |
0.422 |
0.684 |
0.006 |
0.102 |
0.250 |
0.396 |
0.485 |
0.006 |
0.099 |
0.263 |
0.243 |
0.167 |
Insulin glargine |
1.000 |
1.034 |
0.923 |
0.837 |
0.843 |
0.994 |
0.944 |
0.815 |
0.741 |
0.609 |
0.994 |
1.017 |
1.155 |
1.205 |
0.744 |
|
NB |
Insulin degludec |
0.000 |
0.009 |
0.492 |
0.865 |
1.012 |
0.003 |
0.036 |
0.148 |
0.251 |
0.308 |
0.004 |
0.039 |
0.097 |
0.171 |
0.222 |
Insulin glargine |
1.000 |
1.513 |
1.646 |
1.702 |
1.662 |
0.997 |
1.029 |
0.991 |
0.992 |
0.926 |
0.996 |
0.965 |
0.941 |
0.991 |
1.117 |
|
NS |
Insulin degludec |
0.000 |
0.000 |
0.421 |
1.271 |
1.622 |
0.005 |
0.077 |
0.217 |
0.427 |
0.518 |
0.008 |
0.087 |
0.157 |
0.347 |
0.508 |
Insulin glargine |
1.000 |
1.690 |
2.209 |
2.192 |
2.042 |
0.995 |
1.054 |
1.047 |
1.014 |
0.875 |
0.992 |
1.117 |
1.180 |
1.323 |
1.360 |
|
Data sources (data extracted in Q4-2022):
- Public drug plans: National Prescription Drug Utilization Information System Database, Canadian Institute for Health Information. All jurisdictions except Quebec. Data for Quebec estimated from IQVIA Payer Insights Database.
- Private drug plans: IQVIA Private Pay Direct Drug Plan Database.
- Cash: IQVIA Payer Insights Database.
4. A Look into the Future
Since the launch of canagliflozin (Invokana) in 2014, no novel antidiabetic drug class has been approved (see Section 2). This may change in 2023, following Health Canada’s approval of tirzepatide (Mounjaro) in November 2022, just months after approval by the US Food and Drug Administration (FDA) in May 2022. It is a first-in-class dual agonist compound indicated for type 2 diabetes affecting the activation of both GLP-1 and GIP (glucose-dependent insulinotropic polypeptide). This emerging generation of drugs, known as “twincretins” may offer additional benefits compared to GLP-1’s alone, including improved blood sugar control and weight loss, as well as evidence of favourable cardiovascular impact.Footnote 9
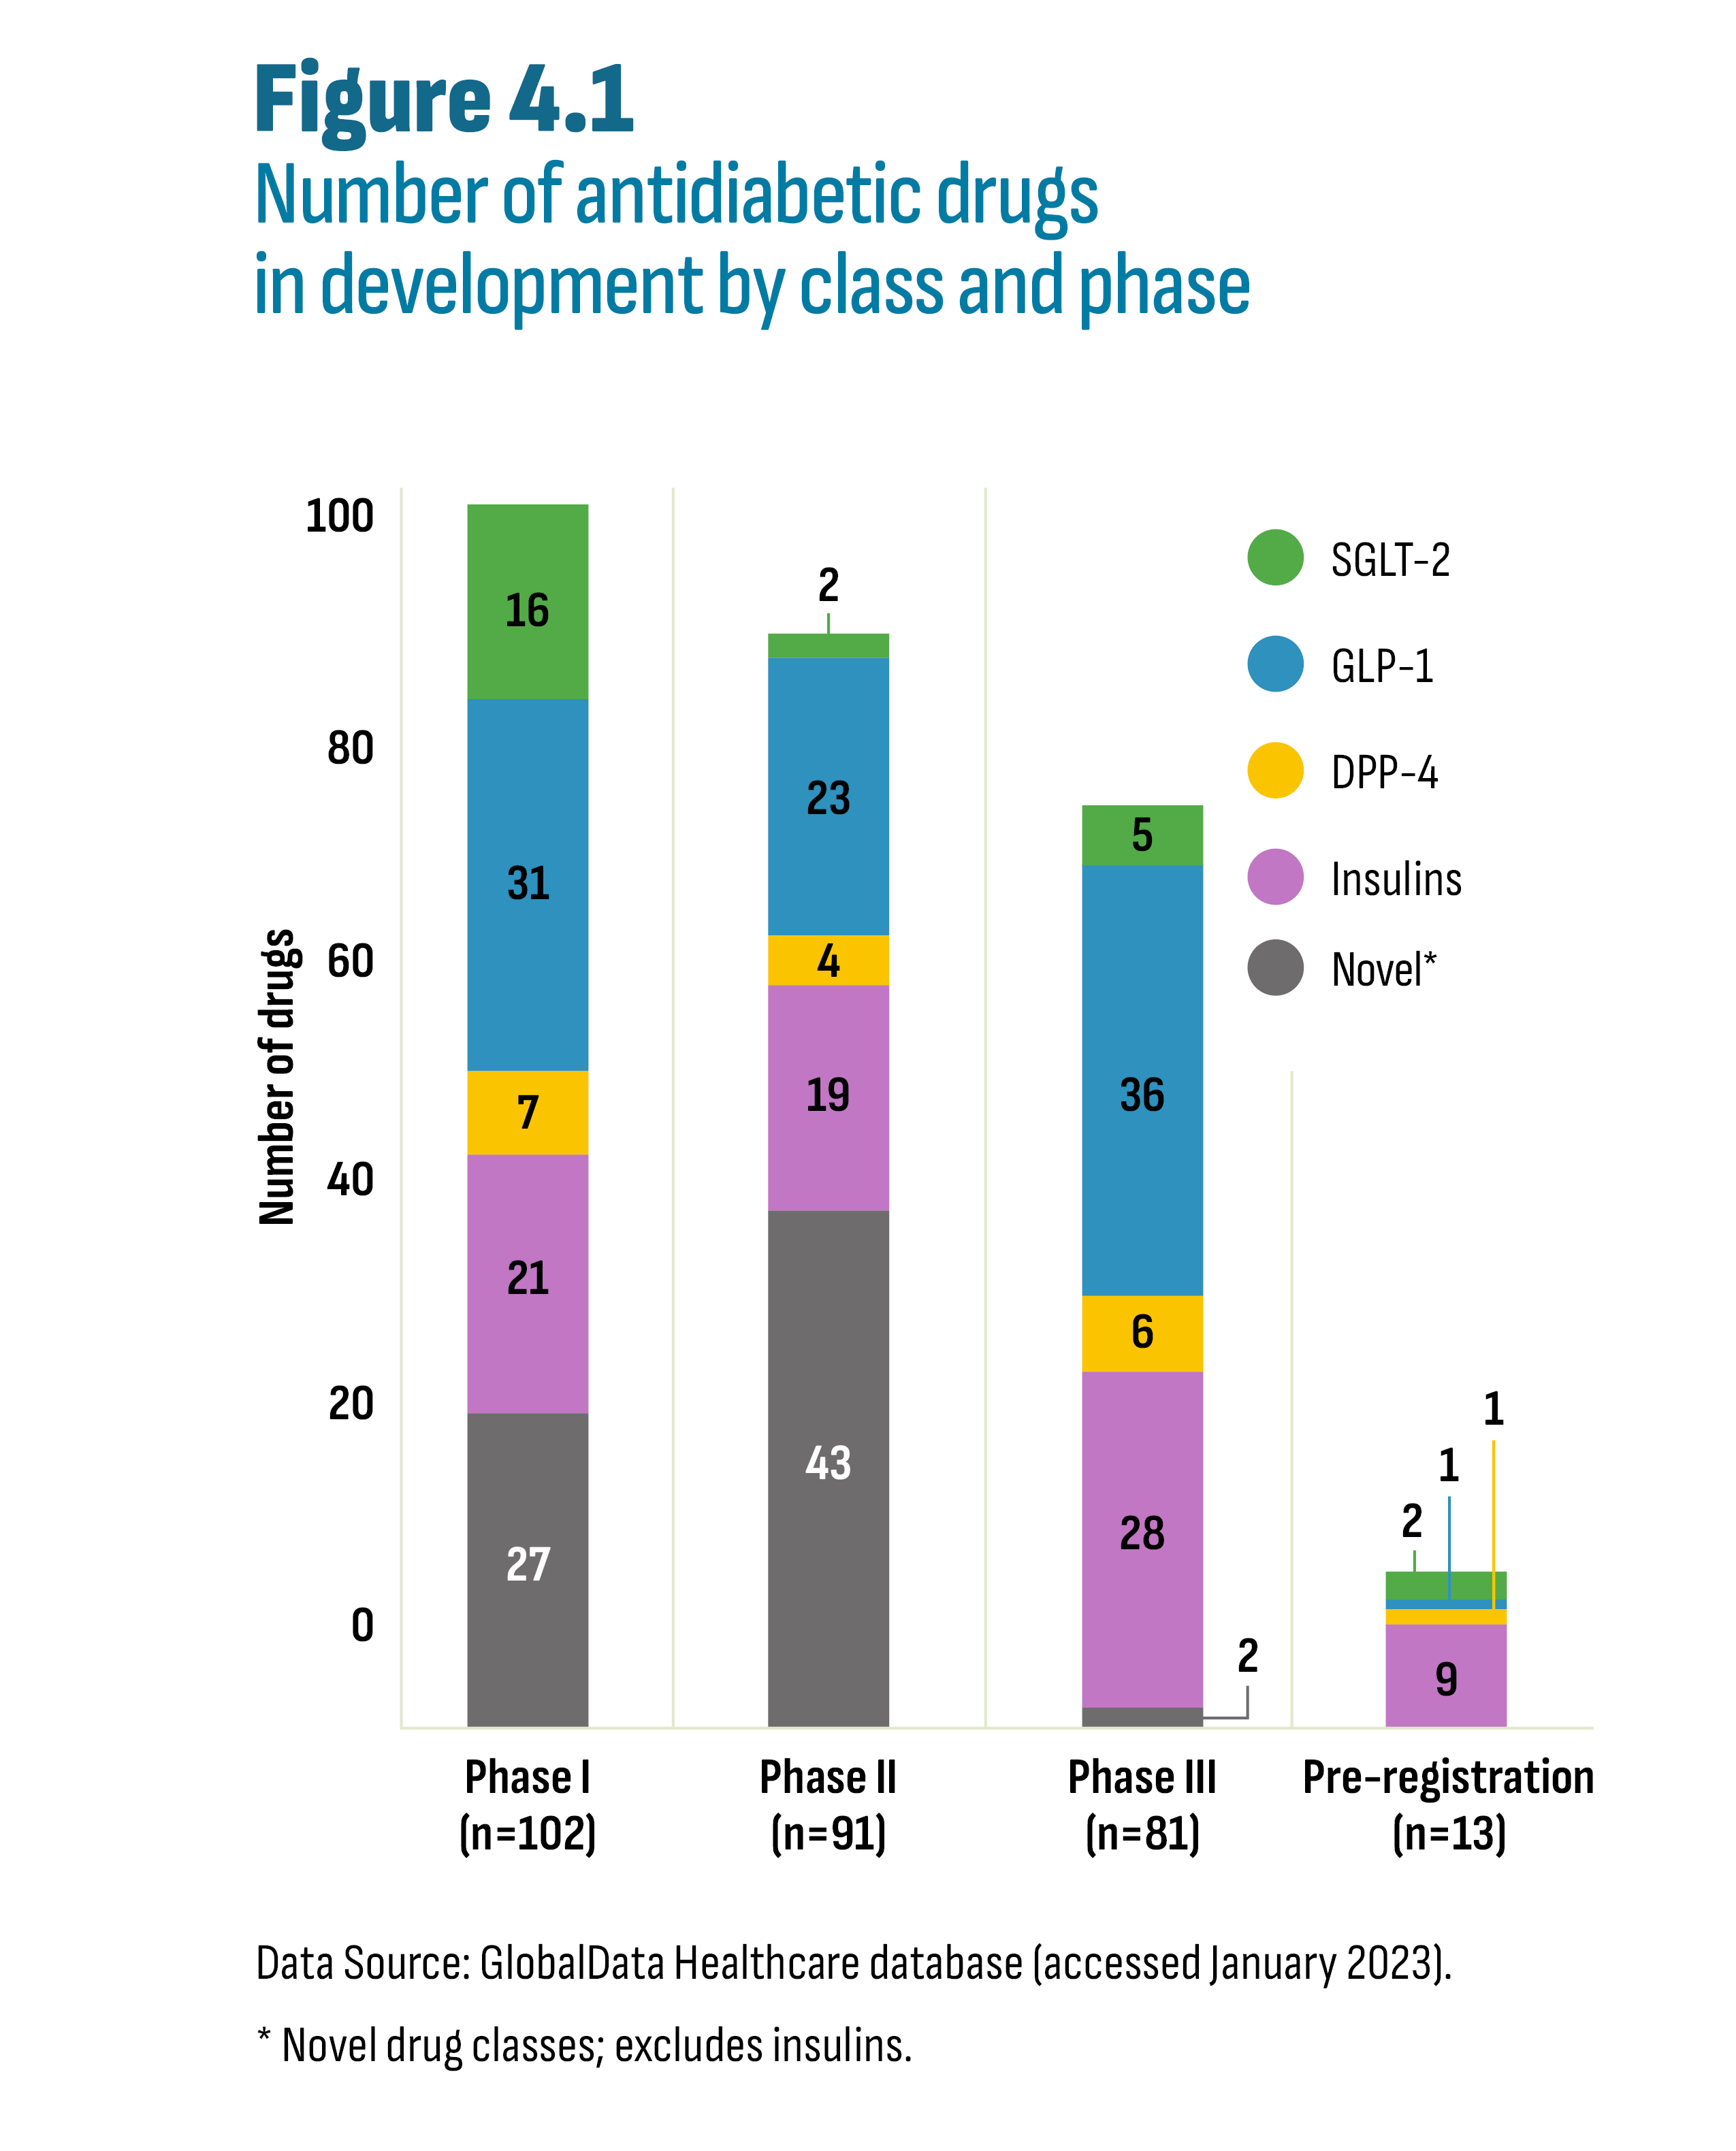
Figure description
This stacked column graph shows the number of drugs in the development pipeline according to their research phase and by class: Novel; Insulins, DPP-4; GLP-1; and SGLT-2. The “Novel” label includes novel drug classes and excludes insulins.
Research phase |
Number of drugs |
Novel |
Insulins |
DPP-4 |
GLP-1 |
SGLT-2 |
Phase I |
102 |
27 |
21 |
7 |
31 |
16 |
Phase II |
91 |
43 |
19 |
4 |
23 |
2 |
Phase III |
81 |
2 |
28 |
6 |
36 |
5 |
Pre-registration |
13 |
0 |
9 |
1 |
1 |
2 |
* Novel drug classes, excludes insulins.
Data Source: GlobalData Healthcare database (accessed January 2023).
Looking further into the drug pipeline, there are 206 non-insulin and 77 insulin drugs at various phases of clinical development. As shown in Figure 4.1, there are ongoing clinical trials for drugs in all existing classes featured in this report (DPP-4, GLP-1, SGLT-2, insulins) as well as non-insulin drugs in a variety of novel drug classes. These include targets for glucokinase, adenosine monophosphate activated protein kinase, fibroblast growth factor receptor 1 and bile acid receptors.
Over 80% of the drugs in the pipeline can be classified as “me-too”Footnote viii drugs, including all the drugs in Phase III and pre-registration, except for two drugs in clinical trials underway in China targeting various gene receptors. Drugs at this stage of development are still 2 to 5 years away from market, provided they remain clinically and commercially viable. Notably, two insulin products may have an impact on diabetes management due to their distinct formulations and dosing regimens. The first is a novel insulin receptor agonist in oral form (ORMD-0801) that is currently undergoing phase II and III clinical trials and has the potential to significantly impact therapy administration as an alternative to insulin injections. The second, insulin icodec, is a long-acting basal insulin analogue undergoing phase III clinical trials. Unlike currently available insulins that require daily injections, insulin icodec is only administered once weekly. This significant reduction in injection frequency may have an important impact on the management of diabetes for some patients.
It remains to be seen if, and to what extent, these novel classes of antidiabetic drugs and future “first-in-class” drugs will result in substantial treatment breakthroughs, if their benefits will be limited to niche populations, or if they will be one among many treatment options. Nevertheless, and perhaps more importantly, innovation in antidiabetic drugs reflects the evolving understanding of the complex mechanisms affecting human metabolism, shifting the focus beyond insulin. Not only have new-generation/non-insulin drugs changed prescribing for diabetic patients, but they are also the first antidiabetic drugs to be approved for indications outside of diabetes treatment, potentially with significant clinical and budgetary implications. These include indications for heart failure and kidney disease (SGLT-2’s) and indications for weight management (GLP-1’s) (see Section 2). And while the most recent addition, tirzepatide, is currently only indicated for type 2 diabetes, similar indications beyond diabetes may be on the horizon for this drug and a sign of things to come from the pipeline.
Bibliography
Canadian Agency for Drugs and Technologies in Health (CADTH), Common Drug Review (CDR). Insulin glargine submission, 2006. https://www.cadth.ca/sites/default/files/cdr/complete/cdr_complete_Lantus_Oct25-06.pdf
Canadian Agency for Drugs and Technologies in Health (CADTH), Common Drug Review (CDR). Sitagliptin Submission, 2008. https://www.cadth.ca/sites/default/files/cdr/complete/cdr_complete_Januvia_June-18-2008_e.pdf
Canadian Agency for Drugs and Technologies in Health (CADTH), Common Drug Review (CDR). Sitagliptin Resubmission, 2010. https://www.cadth.ca/sites/default/files/cdr/complete/cdr_complete_Januvia%20Resubmission_June-29-2010.pdf
Canadian Agency for Drugs and Technologies in Health (CADTH), Common Drug Review (CDR). Saxagliptin Submission, 2010. https://www.cadth.ca/sites/default/files/cdr/complete/cdr_complete_Onglyza_June-18-2010.pdf
Canadian Agency for Drugs and Technologies in Health (CADTH), Common Drug Review (CDR). Liraglutide Submission, 2011. https://www.cadth.ca/sites/default/files/cdr/complete/cdr_complete-Victoza-September-30-2011.pdf
Canadian Agency for Drugs and Technologies in Health (CADTH), Common Drug Review (CDR). Saxagliptin Resubmission, 2013. https://www.cadth.ca/sites/default/files/cdr/complete/complete_SR0329_Onglyza-preNOC_19-Nov-13_e.pdf
Canadian Agency for Drugs and Technologies in Health (CADTH), Common Drug Review (CDR). Insulin degludec submission, 2017. https://www.cadth.ca/sites/default/files/cdr/complete/SR0521_Tresiba_complete_Nov-22-17_e.pdf
Canadian Agency for Drugs and Technologies in Health (CADTH), Common Drug Review (CDR). Semaglutide submission, 2019. https://www.cadth.ca/sites/default/files/cdr/complete/SR0594%20Ozempic%20-%20CDEC%20Final%20Recommendation%20May%2017%2C%202019%20%28redacted%29_For%20posting.pdf
Canadian Agency for Drugs and Technologies in Health (CADTH). Reimbursement of Newer Drugs for Type 2 Diabetes in Canada: An Environmental Scan. Ottawa: CADTH; 2019. (Environmental scan; no. 84). Available at: https://www.cadth.ca/reimbursement-newer-drugs-type-2-diabetes-canada-environmental-scan
Canadian Institute for Health Information (CIHI). International Comparisons: A Focus on Diabetes. Ottawa, ON: CIHI; 2015. Available at: https://secure.cihi.ca/free_products/oecd-diabetes-report-2015_en.pdf
Diabetes Canada. Formulary Listings for Public Coverage of Diabetes Medications in Canada. July 2021. Available at: https://www.diabetes.ca/DiabetesCanadaWebsite/media/Advocacy-and-Policy/Provincial%20and%20Territorial%20Formulary%20Chart/PT-formulary-listings_July-2021.pdf
Government of Canada. Canada Health Act. Available at: https://www.canada.ca/en/health-canada/services/health-care-system/canada-health-care-system-medicare/canada-health-act.html
International Diabetes Federation. IDF Diabetes Atlas, 10th Edition. 2021. Available at: https://diabetesatlas.org/atlas/tenth-edition/
Mayo Clinic. Diabetes Symptoms and Causes. Available at: https://www.mayoclinic.org/diseases-conditions/diabetes/symptoms-causes/syc-20371444
Public Health Agency of Canada, Framework for Diabetes in Canada. Government of Canada, 2022. Available at : https://www.canada.ca/en/public-health/services/publications/diseases-conditions/framework-diabetes-canada.html
Telus Health. Drug Plans Decoded: Biosimilars Part 3. Available at: https://plus.telushealth.co/blogs/health-benefits/en/drug-plans-decoded-biosimilars-part-3/
LeBlanc AG, Jun Gao Y, McRae L, Pelletier C. At-a-glance - Twenty years of diabetes surveillance using the Canadian Chronic Disease Surveillance System. Health Promot Chronic Dis Prev Can. 2019 Nov;39(11):306-309. doi: 10.24095/hpcdp.39.11.03. PMID: 31729313; PMCID: PMC6876649.
Available at: https://pubmed.ncbi.nlm.nih.gov/31729313/
Lipsombe L, Booth G, Butalia S, Dasgupta K, et al. Pharmacologic Glycemic Management of Type 2 Diabetes in Adults: 2020 Update. Can J Diabetes 2020;44: 575-591. Available at: https://guidelines.diabetes.ca/cpg/chapter-13-2020-update
Punthakee Z, Goldenberg R, Katz P, Diabetes Canada 2018 Clinical Practice Guidelines for the Prevention and Management of Diabetes in Canada: Definition, Classification and Diagnosis of Diabetes, Prediabetes and Metabolic Syndrome. Can J Diabetes 2018;42(Suppl 1): S10-S15.
Available at: https://guidelines.diabetes.ca/cpg/chapter3
Rizvi AA, Rizzo M. The Emerging Role of Dual GLP-1 and GIP Receptor Agonists in Glycemic Management and Cardiovascular Risk Reduction. Diabetes Metab Syndr Obes. 2022 Apr 5;15:1023-1030. doi: 10.2147/DMSO.S351982. PMID: 35411165; PMCID: PMC8994606. Available at: https://www.ncbi.nlm.nih.gov/pmc/articles/PMC8994606/
White JR Jr. A Brief History of the Development of Diabetes Medications. Diabetes Spectr. 2014 May;27(2):82-6. doi: 10.2337/diaspect.27.2.82. PMID: 26246763; PMCID: PMC4522877.
Available at: https://www.ncbi.nlm.nih.gov/pmc/articles/PMC4522877/
Appendix A: Methodology Notes
| Topic | Figures | Methodology |
|---|---|---|
Cost per Capita |
Figure 3.3 Figure 3.4 Figure 3.5 Figure 3.6 |
Cost of antidiabetics drugs (or subclass) divided by the total population (census). It is a useful metric to compare spending in countries of varying sizes. |
Index |
Figure 3.7
Figure 3.11
Figure 3.17
|
An index is a useful way of displaying market trends when comparing markets of different sizes. In this report, the index year is 2017 which means that yearly totals, whether units or costs, are divided by the total for 2017 and resulting in a value of 1 for that year. For example, in Figure 3.7 (Chart A), total units sold in Canada were 559 million and 368 million in 2021 and 207, respectively. The index for 2021 was thus 1.521 (559 ÷ 368).
The yearly indices were calculated for a group of subclasses or drugs. Each year’s index was then divided according to the market shares for these subclasses or drugs in that year. For example, in Figure 3.7 (Chart A), the 2021 market share for each subclass in Canada was as follows: DPP-4 (56%); GLP-1 (1%); SGLT-2 (43%). These percentages were applied to the index of 1.521 (see above) resulting in a stacked column containing the following values: DPP-4 (0.852); GLP-1 (0.017); SGLT-2 (0.652).
This approach of calculating an overall index which is then subsequently allocated according to market share avoids data distortions in percent growth rates that inevitably occur in the first few years post-launch. However, some distortions may occur in smaller markets or when external administrative factors (program changes) result in large changes. |
$1 of Metformin |
Figure 3.10 |
Figure 3.10 answers the question: how much a payer spent on a subclass for every dollar spent on metformin in 2017. Metformin was selected as a reference for this calculation to provide an intuitive way to compare results that illustrate both market growth and evolving market shares. Some distortions may occur in smaller markets or when external administrative factors (program changes) result in large changes.
This calculation follows the steps outlined below and based on the Ontario Drug Benefit (ODB) program data.
|
Appendix B: Assessments, Recommendations, Negotiation Status, and Reimbursement Decisions
| Medicinal ingredient (trade name) and manufacturer | PMPRB HDAP assessment | CADTH recommendation | pCPA negotiation status | Public reimbursement |
|---|---|---|---|---|
| DPP-4 | ||||
Sitagliptin (Januvia) Merck Canada Inc. |
Category 3 (slight or no improvement) |
LWCC |
Completed |
All provinces except BC, YT and NIHB |
Sitagliptin/metformin (Janumet) Merck Canada Inc. |
Category 3 (slight or no improvement) |
LWCC |
Completed |
All provinces except BC, YT and NIHB |
Saxagliptin (Onglyza) Bristol-Myers Squibb Canada Co. |
Category 3 (slight or no improvement) |
LWCC |
Completed |
All provinces, YT and NIHB |
Saxagliptin/metformin (Komboglyze) Bristol-Myers Squibb Canada Co. |
S/N |
LWCC |
Individual by province/territory |
All provinces, YT and NIHB |
Linagliptin (Trajenta) Boehringer Ingelheim (Canada) Ltd. |
S/N |
LWCC |
Completed in combination with Jentadueto |
All provinces, YT and NIHB |
Linagliptin/metformin (Jentadueto) Boehringer Ingelheim (Canada) Ltd. |
S/N |
LWCC |
Completed in combination with Trajenta* |
All provinces, YT and NIHB |
Alogliptin (Nesina) Takeda Canada Inc. |
S/N |
DNL |
Decision not to negotiate |
Not listed |
Alogliptin/metformin (Kazano) Takeda Canada Inc. |
S/N |
DNL |
Decision not to negotiate |
Not listed |
| SGLT-2 | ||||
Canagliflozin (Invokana) Janssen Inc. |
S/N |
LWCC |
Completed |
All provinces except BC, YT and NIHB |
Canagliflozin/metformin (Invokamet) Janssen Inc. |
S/N |
LWCC |
Closed as agreements were not reached
|
Not listed |
Empagliflozin (Jardiance) Boehringer Ingelheim (Canada) Ltd. |
S/N |
LWCC |
Completed** |
All provinces except BC, YT and NIHB |
Empagliflozin/metformin (Synjardy) Boehringer Ingelheim (Canada) Ltd. |
S/N |
LWCC |
N/A |
Not listed |
Dapafliflozin (Forxiga) AstraZeneca Canada Inc. |
S/N |
LWCC***
|
Completed |
All provinces except BC, YT and NIHB |
Dapafliflozin/metformin (XigDuo) AstraZeneca Canada Inc. |
S/N |
LWCC |
Completed |
All provinces except BC, YT and NIHB |
| Combination of DPP-4 and SGLT-2 approved and cancelled post market in Canada | ||||
Empagliflozin/linagliptin (Glyxambi) *** Boehringer Ingelheim (Canada) Ltd. |
S/N |
No CDR report available |
Not listed |
N/A |
Empagliflozin (Steglatro) Merck Canada Inc |
S/N |
DNL
|
Concluded without agreement
|
Not listed |
| Combination of DPP-4 and SGLT-2 approved and not marketed in Canada | ||||
Dapagliflozin/saxagliptin (Qtern) Boehringer Ingelheim (Canada) Ltd. |
N/A |
N/A |
N/A |
N/A |
| GLP-1 | ||||
Liraglutide (Victoza) |
S/N |
DNL |
Concluded without agreement |
Not listed, restricted in QC |
Exenatide (Byetta) |
S/N |
DNL |
Concluded without agreement |
Not listed |
Exenatide (Bydureon) |
S/N |
Not available |
N/A |
Not listed |
Dulaglutide (Trulicity) |
S/N |
LWCC |
Concluded without agreement
|
Not listed, restricted in QC |
Lixisenatide (Adlyxine) |
S/N |
LWCC |
Completed |
Listed only in ON and NIHB,NU, NT restricted in AB, SK, NB |
Semaglutide (Ozempic) |
S/N |
LWCC |
Completed |
Listed in ON, NIHB, YT and restricted in all other provinces |
Semaglutide (Rybelsus) |
Not yet reviewed |
LWCC |
Active negotiation |
Not listed |
| Insulin | ||||
Insulin degludec (Tresiba) |
Not reviewed |
LWCC |
Completed |
All provinces, except BC |
Insulin degludec/liraglutide (Xultophy) |
Not reviewed |
LWCC |
Concluded without agreement
|
Not listed |
Insulin glargine/lixisenatide (Soliqua) |
Not reviewed |
LWCC |
Completed |
Listed only in ON and NIHB, restricted in SK |
Source: Formulary listings for Public Coverage of Diabetes Medications in Canada: https://www.diabetes.ca/DiabetesCanadaWebsite/media/Advocacy-and-Policy/Provincial%20and%20Territorial%20Formulary%20Chart/PT-formulary-listings_July-2021.pdf
S/N: slight or no improvement; LWCC: list with criteria or conditions; DNL: do not list.
A Category 3 drug product is a new DIN of a non-comparable dosage form of an existing medicine or the first DIN of a new chemical entity. These DINs provide moderate, little or no therapeutic advantage over comparable medicines.
* This followed an earlier decision to negotiate individually by P/F/T
** Negative recommendation for the more recent submission to be used in combination with metformin and a sulfonylurea
*** Sold in Canada, small sales for privately insured and cash paying individuals
Data sources: PMPRB, CADTH, pCPA, CIHI.