
Oncology Medicines in Canada: Trends and International Comparisons, 2010–2019
October 2020
ISBN: 978-0-660-36162-8
Cat. no.: H82-51/2020E-PDF
Table of Contents
Acknowledgements
This analysis was prepared by the Patented Medicine Prices Review Board (PMPRB) as part of the National Prescription Drug Utilization Information System (NPDUIS) and was done at the request and in consultation with members of the NPDUIS Advisory Committee.
Appreciation goes to the PMPRB staff Brian O’Shea and Caroline Peterson for leading this analytical project, as well as to Tanya Potashnik and Jeffrey Menzies for their oversight in the development of the analysis.
The PMPRB also wishes to acknowledge the contributions of Nevzeta Bosnic, Jun Yu, and Sarah Parker.
Disclaimer
NPDUIS operates independently of the regulatory activities of the Board of the PMPRB. The research priorities, data, statements, and opinions expressed or reflected in NPDUIS reports do not represent the position of the PMPRB with respect to any regulatory matter. NPDUIS reports do not contain information that is confidential or privileged under sections 87 and 88 of the Patent Act, and the mention of a medicine in a NPDUIS report is not and should not be understood as an admission or denial that the medicine is subject to filings under sections 80, 81, or 82 of the Patent Act or that its price is or is not excessive under section 85 of the Patent Act.
Although this information is based in part on data obtained from the NPDUIS Database of the Canadian Institute for Health Information (CIHI) and under license from IQVIA’s MIDAS® Database, Payer Insights database, and Private Pay Direct Drug Plan database, the statements, findings, conclusions, views, and opinions expressed in this report are exclusively those of the PMPRB and are not attributable to CIHI or IQVIA.
Contact Information
Patented Medicine Prices Review Board
Standard Life Centre
Box L40
333 Laurier Avenue West Suite 1400
Ottawa, ON K1P 1C1
Tel.: 1-877-861-2350
TTY 613-288-9654
Email: PMPRB.Information-Renseignements.CEPMB@pmprb-cepmb.gc.ca
Introduction
Oncology medicines are an increasingly important driver of Canadian pharmaceutical sales. Over the past decade, this significant segment has doubled its share of the market, now accounting for $3.9 billion in sales nationally.
Cancer is a leading cause of death around the world, responsible for 1 in 6 deaths globally and close to 1 in 3 deaths in Canada.Footnote 1,Footnote 2 In 2020 alone, Canada is estimated to have 225,800 new oncology cases and 83,300 cancer deaths.Footnote 2 With an aging population expected to increase demand for cancer therapies, and a strong pipeline of oncology medicines under development, this fast-growing market is expected to continue to be an important consideration for Canadian patients, prescribers, and payers in years to come.
This analysis provides an overview of the Canadian prescription oncology market from 2010 to 2019. The chartbook is divided into three sections: the first explores the dynamics of the international market for oncology medicines; the second takes a closer look at oncology sales, market distribution, and treatment costs in Canada; and the third examines these trends in the context of Canada’s private drug plans.
Summary of Findings
- Sales of oncology medicines in Canada have nearly tripled over the past decade, from $1.4 billion in 2010 to $3.9 billion in 2019, placing Canada fourth among the PMPRB11 countries in terms of growth in the oncology market.
- Per capita oncology sales in Canada remained below most comparator countries in 2019, though a recent rise in spending has narrowed the gap between Canadian and international levels.
- Since 2010, the share of oncology medicines as a proportion of the total Canadian market has more than doubled, from 7.1% to 14.6%. Despite this rapid increase, Canada’s oncology share of pharmaceutical sales remains the lowest among the PMPRB11.
- Recent trends show a greater international alignment in the prices of oncology medicines. Although oncology prices in Canada continue to sit above the PMPRB11 median, price levels across comparator countries have grown closer in recent years.
- Over the last decade, the Canadian oncology market has shifted significantly towards higher-cost drugs. Medicines with 28-day treatment costs over $7,500 now account for more than half of all oncology sales in Canada, a sharp increase from 16% in 2010.
- The Canadian oncology market is largely driven by new medicines. Medicines introduced after 2010 accounted for 58% of oncology sales in 2019, compared to 24% of non-oncology sales.
- Canadian availability for top-selling new oncology medicines is in line with comparator countries. Canada matched the PMPRB11 median for both the share of new medicines sold in 2019, and their respective share of total OECD new medicine sales.
- High-cost oncology medicines account for a growing share of drug costs in Canada’s private drug plans. Shares differ greatly across jurisdictions, likely due to differences in public coverage for oral therapies, which now make up half of all oncology sales in Canada.
Methods
For the purposes of this study, oncology medicines were selected based on the Anatomical Therapeutic Chemical (ATC) Classification System maintained by the World Health Organization (WHO), as well as information from the pan-Canadian Oncology Drug Review (pCODR) and Cancer Care Ontario (CCO). Medicines for supportive care were excluded from the analysis.
Reported treatment costs are based on a 28-day treatment cycle and were sourced from product monographs and pCODR reports.
New medicines were identified for analysis based on their year of first recorded sales, as reported in the IQVIA MIDAS® Database.
International markets examined include the Organisation for Economic Cooperation and Development (OECD) countries with a focus on Australia, Belgium, France, Germany, Italy, Japan, Norway, Spain, Sweden, and the United Kingdom (UK), which along with the Netherlands will comprise the PMPRB11 comparator countries. The Netherlands was excluded from this analysis due to inconsistencies in the available data. Switzerland and the United States (US) are also shown for comparison.
International analyses are reported in Canadian dollars, converted using annual exchange rates from the Bank of Canada.
Foreign-to-Canadian price ratios are calculated for oncology medicines sold in other countries with the same ATC class, medicinal ingredient, dosage form, and strength as in Canada. Ratios are weighted according to the distribution of sales in Canada.
Sales were projected for Canadian oncology medicines for which MIDAS data was not available.
Data Sources and Limitations
Data Sources
Results pertaining to the Canadian national retail and hospital markets, as well as international comparisons, are based on data captured in the IQVIA MIDAS® Database (all rights reserved).
IQVIA’s Private Pay Direct Plan Database was used in the analysis of the private drug plan market.
Population data for per capita calculations was sourced from the World Bank.
For more information on the data sources used, as well as the calculation of foreign-to-Canadian price ratios, see the Resources section of the NPDUIS Analytical Studies page of the PMPRB website.
Limitations
Canadian and international sales and list prices available in the IQVIA MIDAS® Database are estimated manufacturer factory-gate list prices and do not reflect off-invoice price rebates and allowances, managed entry agreements, or patient access schemes.
Comprehensive data on public drug plan oncology spending is not available. Many oncology medicines are reimbursed through specialty drug programs, which are not consistently captured in submissions to the NPDUIS Database.
Results for private plan spending should not be interpreted as representative of the entire payer market.
1. International Market Trends
This section examines trends in oncology spending in international markets, including the PMPRB11, Switzerland, the US, and the broader OECD, between 2010 and 2019.
International oncology markets have grown rapidly over the past decade
Total oncology sales for Canada and the PMPRB11 more than doubled from 2010 to 2019, rising from $27 billion to $64 billion. Sales in the US more than tripled over the same period.
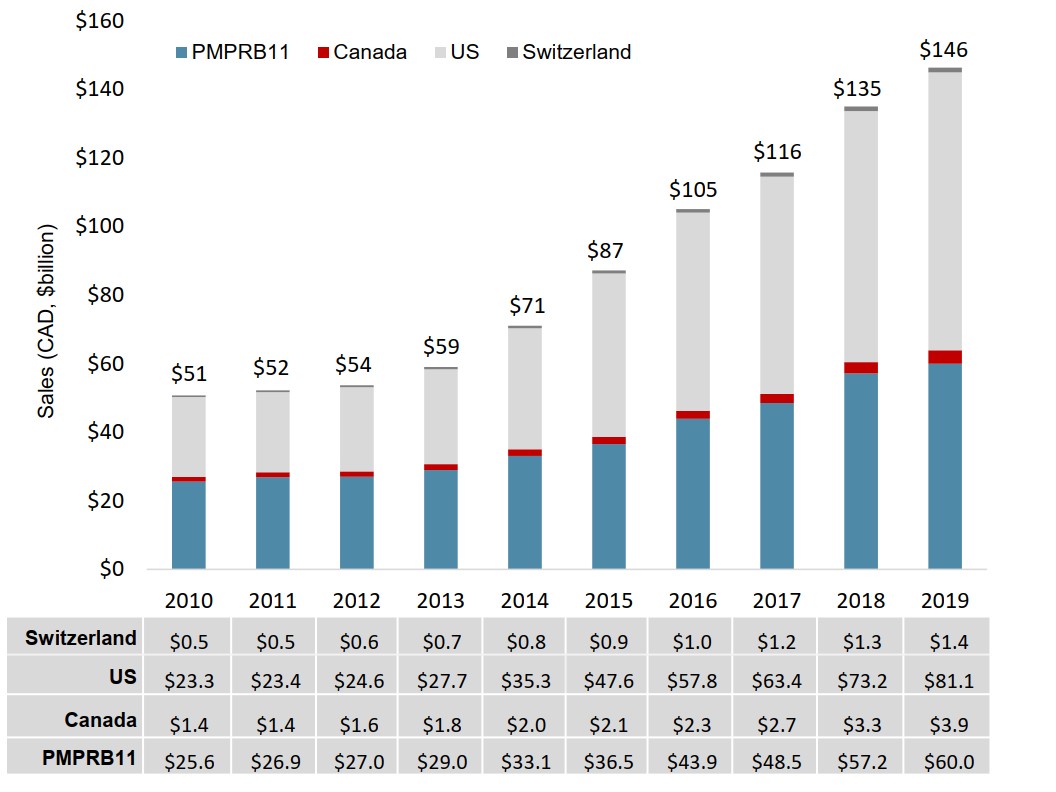
Figure description
A stacked bar graph gives the annual sales revenues for oncology medicines from 2010 to 2019 for the 11 PMPRB comparator countries, Canada, the United States, and Switzerland. Sales are given in billions of Canadian dollars.
| 2010 | 2011 | 2012 | 2013 | 2014 | 2015 | 2016 | 2017 | 2018 | 2019 | |
|---|---|---|---|---|---|---|---|---|---|---|
| PMPRB11 | $25.6 | $26.9 | $27.0 | $29.0 | $33.1 | $36.5 | $43.9 | $48.5 | $57.2 | $60.0 |
| Canada | $1.4 | $1.4 | $1.6 | $1.8 | $2.0 | $2.1 | $2.3 | $2.7 | $3.3 | $3.9 |
| United States | $23.3 | $23.4 | $24.6 | $27.7 | $35.3 | $47.6 | $57.8 | $63.4 | $73.2 | $81.1 |
| Switzerland | $0.5 | $0.5 | $0.6 | $0.7 | $0.8 | $0.9 | $1.0 | $1.2 | $1.3 | $1.4 |
| Total | $51 | $52 | $54 | $59 | $71 | $87 | $105 | $116 | $135 | $146 |
Note: The Netherlands was excluded from this analysis due to inconsistencies in the available data.
Data source: PMPRB; IQVIA MIDAS® Database, 2010 to 2019. All rights reserved.
Growth in the Canadian oncology market exceeds the international median
Canada ranked fourth in the PMPRB11 for growth in the oncology market between 2010 and 2019, behind only the UK, Belgium, and Norway.
In 2019, Canada had the highest growth of all comparator countries, including the US and Switzerland, with a 20% increase over sales in 2018.
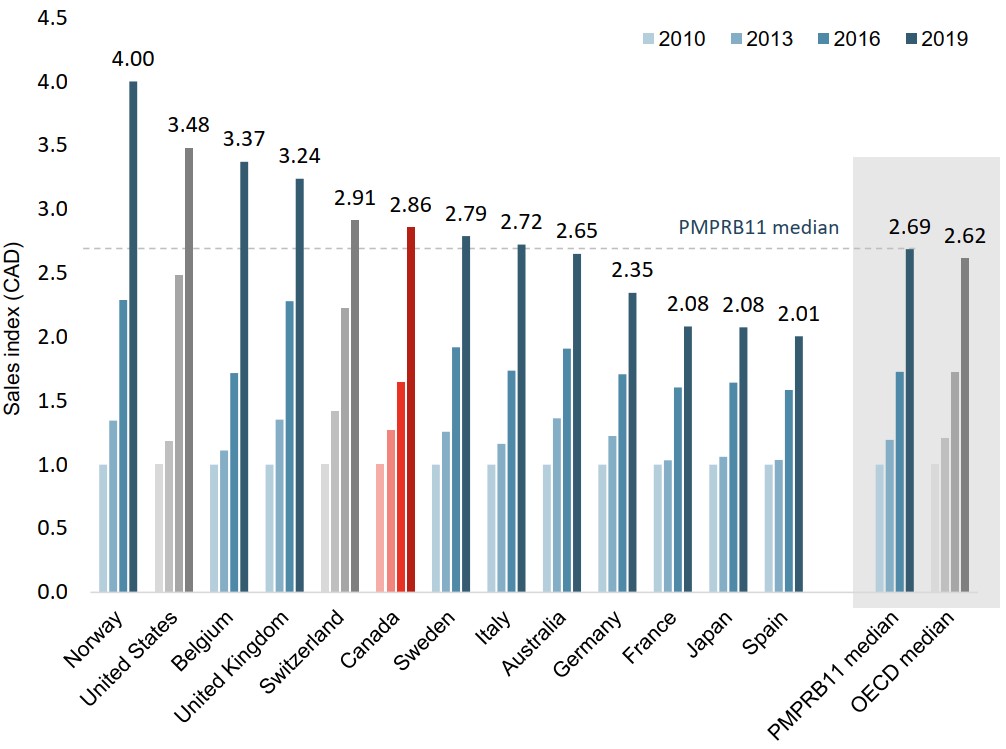
Figure description
A bar graph indexes the sales of oncology medicines in 2013, 2016, and 2019 to sales in 2010 for Canada and the 11 PMPRB comparator countries, as well as Switzerland and the United States. Median results are given for the PMPRB11 countries as well as for the Organisation for Economic Cooperation and Development members.
| 2010 | 2013 | 2016 | 2019 | |
|---|---|---|---|---|
| Norway | 1.00 | 1.35 | 2.29 | 4.00 |
| United States | 1.00 | 1.19 | 2.48 | 3.48 |
| Belgium | 1.00 | 1.11 | 1.72 | 3.37 |
| United Kingdom | 1.00 | 1.35 | 2.28 | 3.24 |
| Switzerland | 1.00 | 1.42 | 2.22 | 2.91 |
| Canada | 1.00 | 1.27 | 1.65 | 2.86 |
| Sweden | 1.00 | 1.26 | 1.92 | 2.79 |
| Italy | 1.00 | 1.16 | 1.74 | 2.72 |
| Australia | 1.00 | 1.36 | 1.91 | 2.65 |
| Germany | 1.00 | 1.22 | 1.71 | 2.35 |
| France | 1.00 | 1.03 | 1.60 | 2.08 |
| Japan | 1.00 | 1.06 | 1.64 | 2.08 |
| Spain | 1.00 | 1.04 | 1.58 | 2.01 |
| PMPRB11 median | 1.00 | 1.19 | 1.73 | 2.69 |
| OECD median | 1.00 | 1.21 | 1.73 | 2.62 |
Note: Indexed figures are reported in Canadian currency with sales in 2010 set to a value of 1.00.
Data source: PMPRB; IQVIA MIDAS® Database, 2010 to 2019. All rights reserved.
Despite recent growth, oncology per capita spending in Canada remains below the PMPRB11 median
Between 2010 and 2019, Canadian per capita sales for oncology medicines grew from $40 to $105, though Canada continued to rank below most PMPRB11 countries.
Proportionately, Canada’s per capita spending has moved closer to the PMPRB11 median, which was 27% higher in 2010 and 15% higher in 2019.
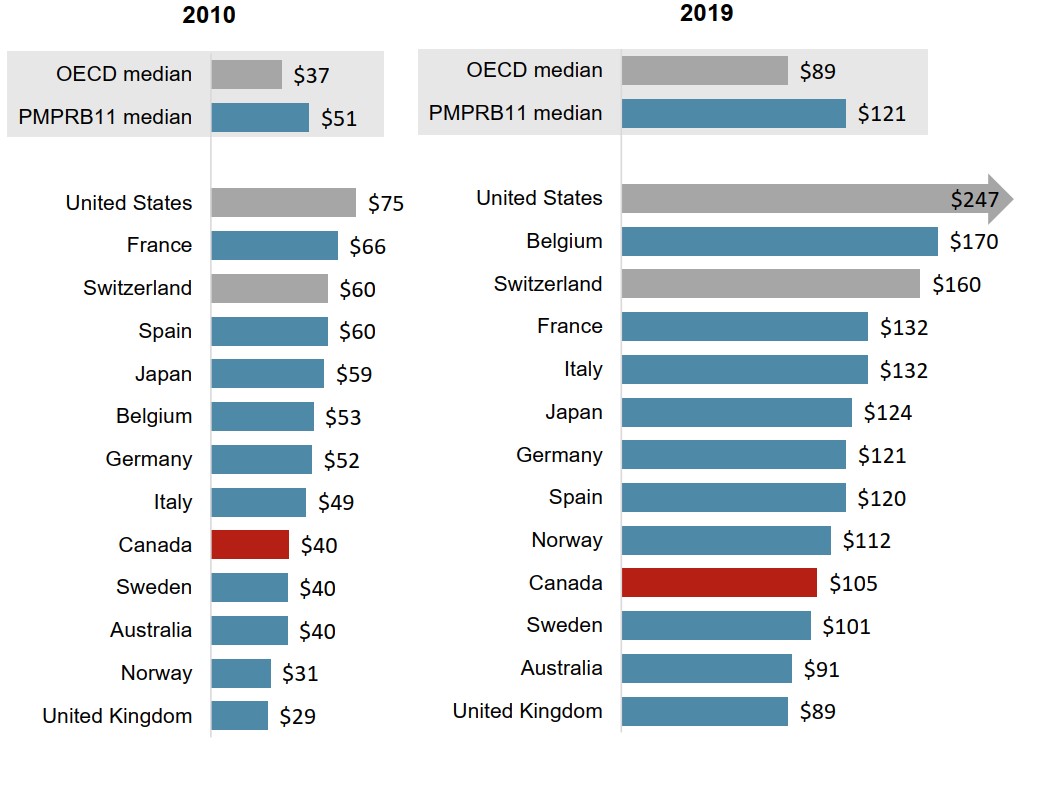
Figure description
Two bar graphs compare the sales per capita for oncology medicines in 2010 and 2019 for each of the 11 PMPRB comparator countries, as well as Switzerland and the United States. Median results are given for the PMPRB11 countries as well as for the Organisation for Economic Cooperation and Development members.
| 2010 | 2019 | |
|---|---|---|
| United States | $75 | $247 |
| France | $66 | $132 |
| Switzerland | $60 | $160 |
| Spain | $60 | $120 |
| Japan | $59 | $124 |
| Belgium | $53 | $170 |
| Germany | $52 | $121 |
| Italy | $49 | $132 |
| Canada | $40 | $105 |
| Sweden | $40 | $101 |
| Australia | $40 | $91 |
| Norway | $31 | $112 |
| United Kingdom | $29 | $89 |
| PMPRB11 median | $51 | $121 |
| OECD median | $37 | $89 |
Data source: PMPRB; IQVIA MIDAS® Database, 2010 and 2019. All rights reserved. Population data from World Bank.
Canada’s per capita spending on non-oncology medicines continues to be among the highest in the PMPRB11
For non-oncology treatments, Canadian per capita sales have remained well above international medians, ranking second in the PMPRB11 in both 2010 and 2019.
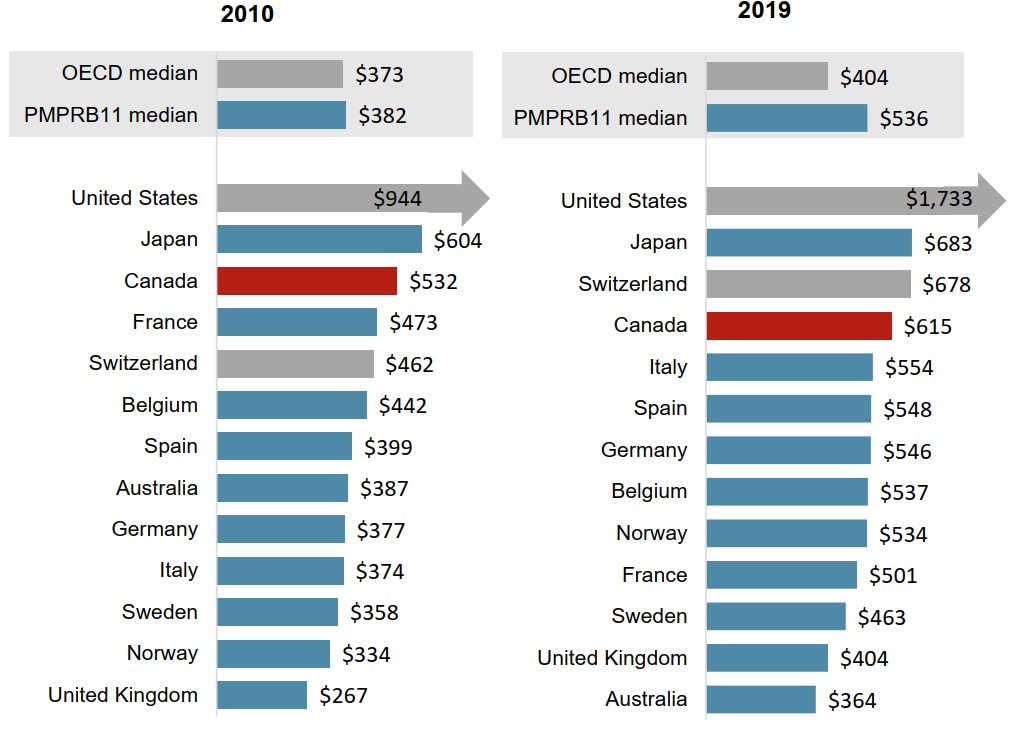
Figure description
Two bar graphs compare the sales per capita for non-oncology medicines in 2010 and 2019 for each of the 11 PMPRB comparator countries, as well as Switzerland and the United States. Median results are given for the PMPRB11 countries as well as for the Organisation for Economic Cooperation and Development members.
| 2010 | 2019 | |
|---|---|---|
| United States | $944 | $1,733 |
| Japan | $604 | $683 |
| Canada | $532 | $615 |
| France | $473 | $501 |
| Switzerland | $462 | $678 |
| Belgium | $442 | $537 |
| Spain | $399 | $548 |
| Australia | $387 | $364 |
| Germany | $377 | $546 |
| Italy | $374 | $554 |
| Sweden | $358 | $463 |
| Norway | $334 | $534 |
| United Kingdom | $267 | $404 |
| PMPRB11 median | $382 | $536 |
| OECD median | $373 | $404 |
Data source: PMPRB; IQVIA MIDAS® Database, 2010 and 2019. All rights reserved. Population data from World Bank.
Oncology medicines represent a larger share of pharmaceutical spending in all PMPRB11 countries
In 2019, Canadian oncology sales accounted for 14.6% of total prescription pharmaceutical sales. Although this represents a two-fold increase over 2010, Canada’s share was the smallest of of any PMPRB11 country and well below the international median.

Figure description
Two bar graphs compare the oncology share of total pharmaceutical sales in 2010 and 2019 for each of the 11 PMPRB comparator countries, as well as Switzerland and the United States. Median results are given for the PMPRB11 countries as well as for the Organisation for Economic Cooperation and Development members.
| 2010 | 2019 | |
|---|---|---|
| Spain | 13.1% | 18.0% |
| Germany | 12.2% | 18.1% |
| France | 12.2% | 20.9% |
| Italy | 11.6% | 19.3% |
| Switzerland | 11.6% | 19.1% |
| Belgium | 10.7% | 24.0% |
| Sweden | 10.0% | 18.0% |
| United Kingdom | 9.9% | 18.1% |
| Australia | 9.3% | 20.1% |
| Japan | 8.9% | 15.3% |
| Norway | 8.4% | 17.4% |
| United States | 7.4% | 12.5% |
| Canada | 7.1% | 14.6% |
| PMPRB11 median | 10.3% | 18.1% |
| OECD median | 9.9% | 17.4% |
Data source: PMPRB; IQVIA MIDAS® Database, 2010 and 2019. All rights reserved.
Recent trends show greater international alignment in the pricing of cancer treatments
Figure 1.6 presents the foreign-to-Canadian price ratios for all oncology medicines in 2010 and 2019.
Although Canadian oncology prices have remained above the median level for the OECD and the PMPRB11, foreign-to-Canadian price ratios in 2019 indicate a closer proximity of price levels for these medicines across comparator countries.
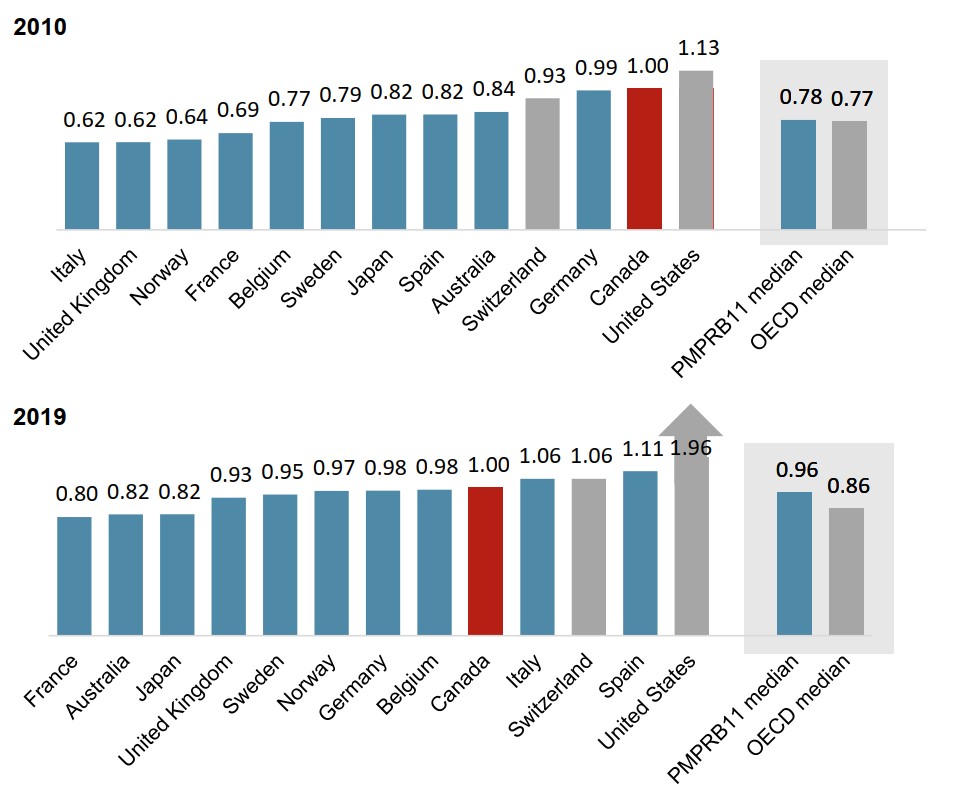
Figure description
Two bar graphs compare the foreign-to-Canadian price ratios for oncology medicines in 2010 and 2019 for each of 11 PMPRB comparator countries, as well as Switzerland and the United States. Median results are given for the PMPRB11 countries as well as for the Organisation for Economic Cooperation and Development members.
| 2010 | 2019 | |
|---|---|---|
| Italy | 0.62 | 1.06 |
| United Kingdom | 0.62 | 0.93 |
| Norway | 0.64 | 0.97 |
| France | 0.69 | 0.80 |
| Belgium | 0.77 | 0.98 |
| Sweden | 0.79 | 0.95 |
| Japan | 0.82 | 0.82 |
| Spain | 0.82 | 1.11 |
| Australia | 0.84 | 0.82 |
| Switzerland | 0.93 | 1.06 |
| Germany | 0.99 | 0.98 |
| Canada | 1.00 | 1.00 |
| United States | 1.13 | 1.96 |
| PMPRB11 median | 0.78 | 0.96 |
| OECD median | 0.77 | 0.86 |
Data source: PMPRB; IQVIA MIDAS® Database, 2010 and 2019. All rights reserved.
Canadian prices for newer oncology medicines are more closely aligned with international levels
Figure 1.7 compares the 2019 foreign-to-Canadian price ratios for medicines with first sales in 2010 or earlier to those for medicines first sold between 2011 and 2019.
Whereas Canadian prices for medicines first sold in 2010 or earlier were second highest in the PMPRB11 in 2019, prices for medicines introduced since 2011 were in line with the PMPRB11 median.
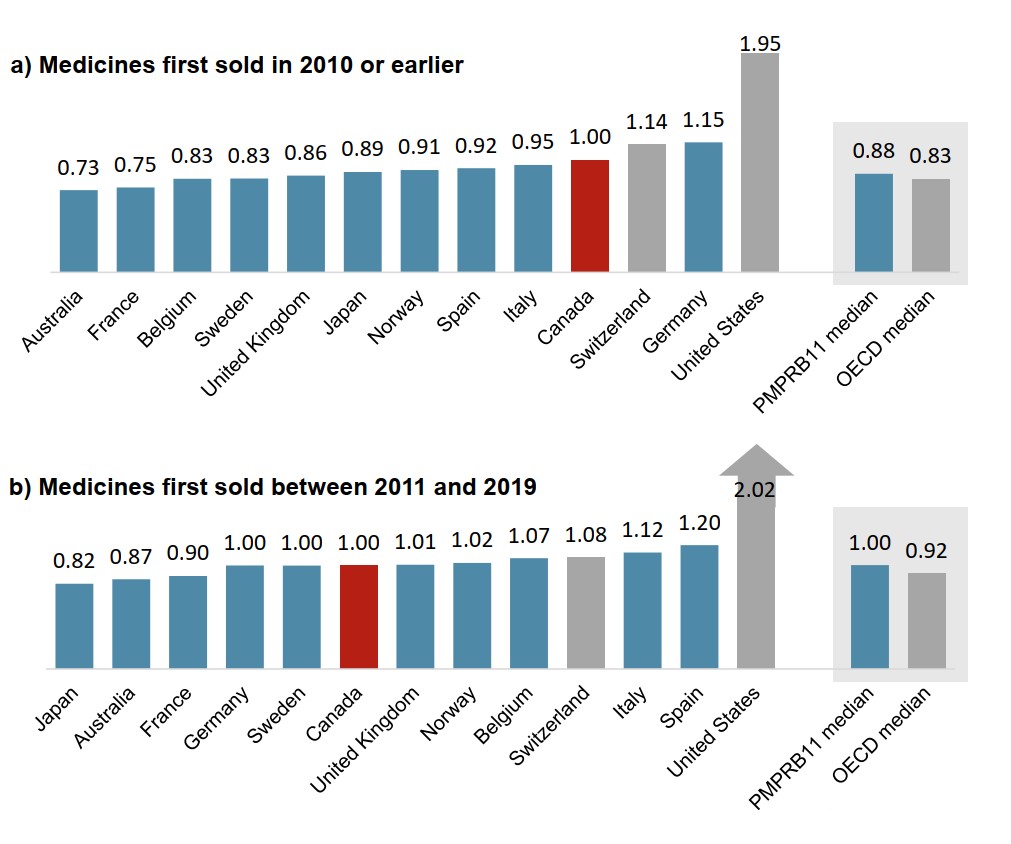
Figure description
Two bar graphs compare the average foreign-to-Canadian price ratios in 2019 for oncology medicines with first sales in 2010 and earlier versus those with first sales between 2011 and 2019. Results are given for each of the 11 PMPRB comparator countries as well as Switzerland and the United States, and medians are presented for all PMPRB11 countries as well as for the Organisation for Economic Cooperation and Development members.
| 2019 price ratio for medicines with first sale in 2010 or earlier | 2019 price ratio for medicines with first sale between 2011 and 2019 | |
|---|---|---|
| Australia | 0.73 | 0.87 |
| France | 0.75 | 0.90 |
| Belgium | 0.83 | 1.07 |
| Sweden | 0.83 | 1.00 |
| United Kingdom | 0.86 | 1.01 |
| Japan | 0.89 | 0.82 |
| Norway | 0.91 | 1.02 |
| Spain | 0.92 | 1.20 |
| Italy | 0.95 | 1.12 |
| Canada | 1.00 | 1.00 |
| Switzerland | 1.14 | 1.08 |
| Germany | 1.15 | 1.00 |
| United States | 1.95 | 2.02 |
| PMPRB11 median | 0.88 | 1.00 |
| OECD median | 0.83 | 0.92 |
Data source: PMPRB; IQVIA MIDAS® Database, 2019. All rights reserved.
Canadian oncology sales are slightly more concentrated in the top-selling medicines
The 20 top-selling oncology medicines in the OECD accounted for a similar share of sales across international markets in 2019.
In Canada, these medicines represented 68% of sales, ranking above all PMPRB11 countries except Belgium.
Foreign-to-Canada price ratios for the 20 top-selling medicines were similar to those observed in the overall oncology market in 2019.
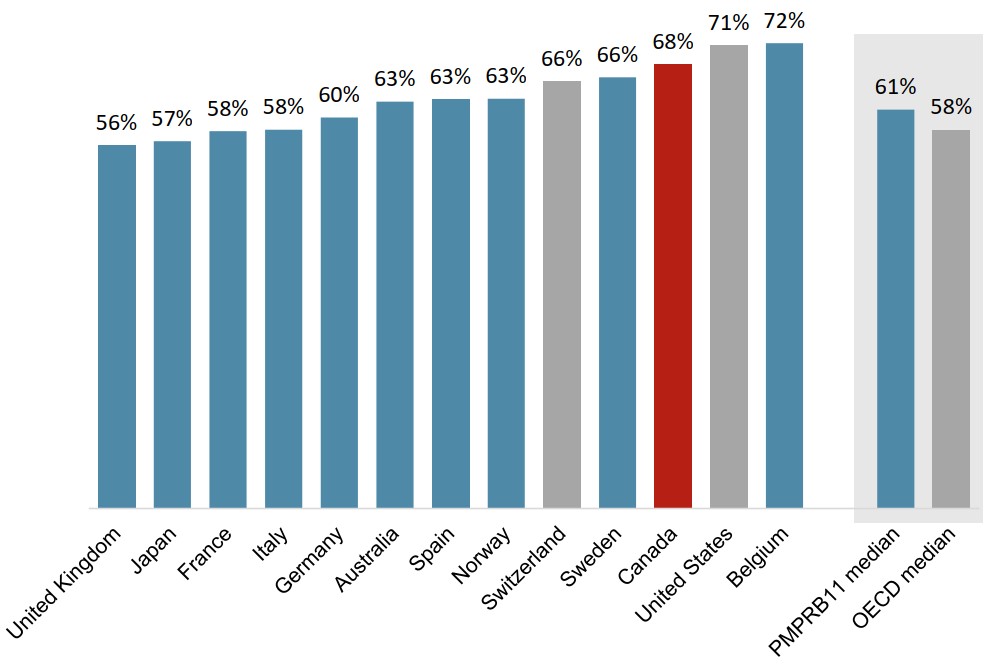
Figure description
A bar graph gives the share of oncology sales held by the 20 top-selling medicines in the Organisation for Economic Cooperation and Development in 2019. Results are given for each of the 11 PMPRB comparator countries as well as Switzerland and the United States, and medians are presented for all PMPRB11 countries as well as for the Organisation for Economic Cooperation and Development members.
| Top 20 share of oncology sales | |
|---|---|
| United Kingdom | 56% |
| Japan | 57% |
| France | 58% |
| Italy | 58% |
| Germany | 60% |
| Australia | 63% |
| Spain | 63% |
| Norway | 63% |
| Switzerland | 66% |
| Sweden | 66% |
| Canada | 68% |
| United States | 71% |
| Belgium | 72% |
| PMPRB11 median | 61% |
| OECD median | 58% |
Data source: PMPRB; IQVIA MIDAS® Database, 2019. All rights reserved.
New oncology medicines with sales in Canada represent the bulk of OECD sales
Of the 111 oncology medicines that first recorded sales in the OECD between 2011 and 2019, half (56) were on the market in Canada by 2019.
These 56 medicines represented 96% of OECD sales for new medicines in 2019, which placed Canada in line with the international median for the market availability of the top-selling oncology treatments.
These results are similar to those observed in the overall pharmaceutical market.
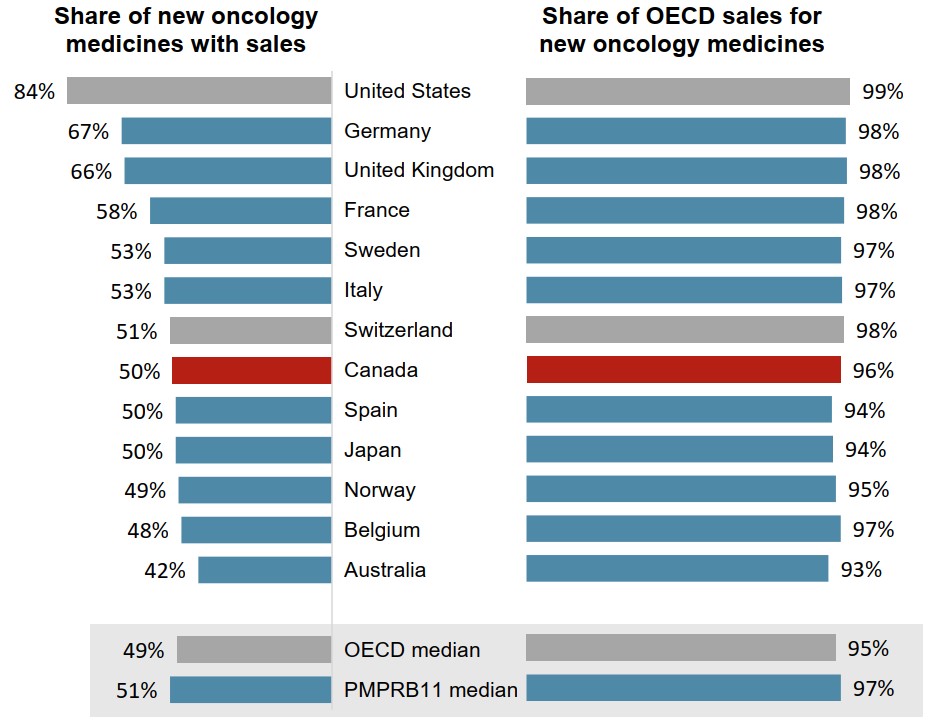
Figure description
A split bar graph gives a) the share of 111 new oncology medicines with sales in 2019 and b) the share of international new oncology sales that these medicines represent. Results are given for each of the 11 PMPRB comparator countries as well as Switzerland and the United States, and medians are presented for all PMPRB11 countries as well as for the Organisation for Economic Cooperation and Development (OECD) members.
| Share of new oncology medicines with sales | Share of OECD sales for new oncology medicines | |
|---|---|---|
| United States | 84% | 99% |
| Germany | 67% | 98% |
| United Kingdom | 66% | 98% |
| France | 58% | 98% |
| Sweden | 53% | 97% |
| Italy | 53% | 97% |
| Switzerland | 51% | 98% |
| Canada | 50% | 96% |
| Spain | 50% | 94% |
| Japan | 50% | 94% |
| Norway | 49% | 95% |
| Belgium | 48% | 97% |
| Australia | 42% | 93% |
| PMPRB11 median | 51% | 97% |
| OECD median | 49% | 95% |
Data source: PMPRB; IQVIA MIDAS® Database, 2019. All rights reserved.
2. Oncology Sales in Canada
This section more closely observes the dynamics of the oncology market in Canada over the past decade, examining trends in the market distribution and treatment costs of oncology medicines since 2010.
Sales of oncology medicines in Canada have nearly tripled over the past decade
The Canadian oncology market grew from $1.4 billion in annual sales in 2010 to $3.9 billion in 2019. Annual growth was over 20% in 2018 and 2019.
The oncology share of total prescription pharmaceutical sales more than doubled over the same period, rising from 7.1% to 14.6%.
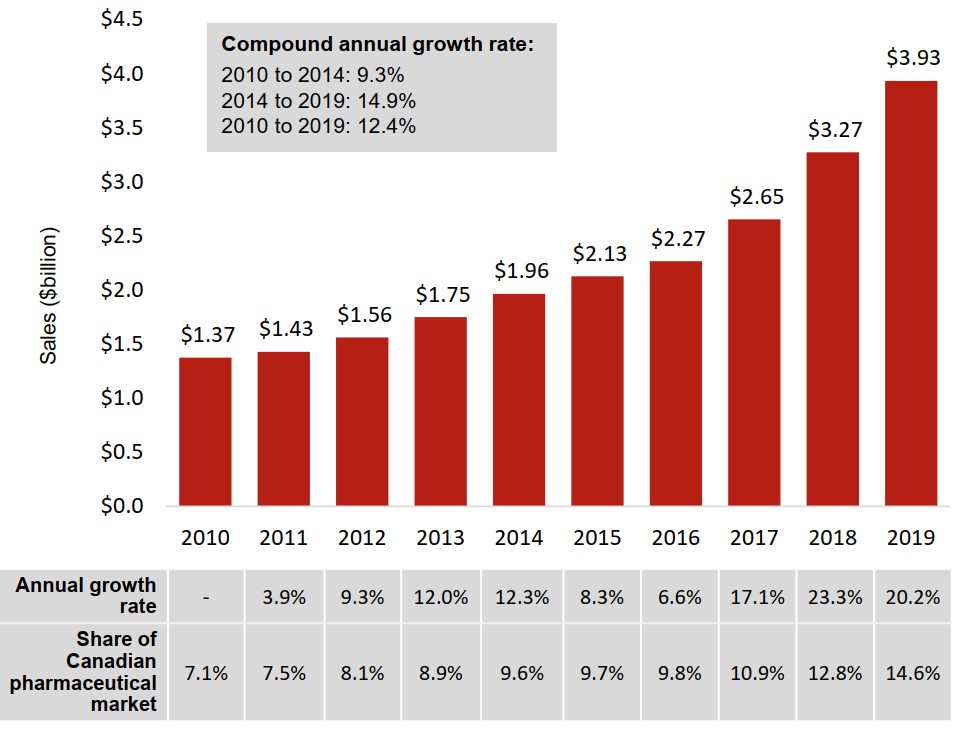
Figure description
A bar graph gives the annual sales revenues for oncology medicines from 2010 to 2019 in billions of dollars. An accompanying table gives the annual growth rate and oncology share of the Canadian pharmaceutical market for each year. The compound annual growth rate from 2010 to 2014 was 9.3%, while the rate for 2014 to 2019 was 14.9% and the overall growth rate from 2010 to 2019 was 12.4%.
| 2010 | 2011 | 2012 | 2013 | 2014 | 2015 | 2016 | 2017 | 2018 | 2019 | |
|---|---|---|---|---|---|---|---|---|---|---|
| Sales of oncology medicines, in billions of dollars | $1.37 | $1.43 | $1.56 | $1.75 | $1.96 | $2.13 | $2.27 | $2.65 | $3.27 | $3.93 |
| Annual growth rate | - | 3.9% | 9.3% | 12.0% | 12.3% | 8.3% | 6.6% | 17.1% | 23.3% | 20.2% |
| Share of Canadian pharmaceutical market | 7.1% | 7.5% | 8.1% | 8.9% | 9.6% | 9.7% | 9.8% | 10.9% | 12.8% | 14.6% |
Data source: PMPRB; IQVIA MIDAS® Database, 2010 to 2019. All rights reserved.
The hospital sector accounts for more than half of oncology sales
In 2019, hospital sales accounted for 59% of Canada’s $3.9 billion oncology market, representing an increase of $1.4 billion in sales over 2010.
Retail sales climbed by $1.1 billion over the same period, accounting for 41% of total oncology spending in 2019.
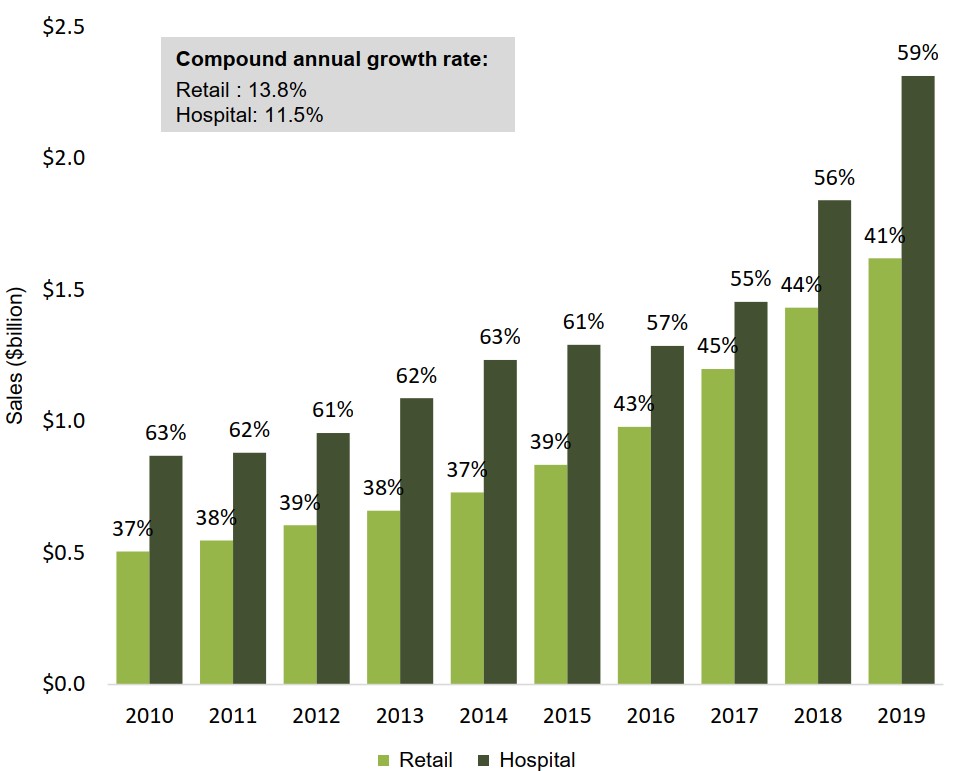
Figure description
A bar graph illustrates the shares of Canadian oncology sales held by the retail and hospital sectors from 2010 to 2019. Results are given as a percentage share as well as in billions of dollars. The compound annual growth rate for the period was 11.5% for hospital sales and 13.8% for retail sales.
| 2010 | 2011 | 2012 | 2013 | 2014 | 2015 | 2016 | 2017 | 2018 | 2019 | |
|---|---|---|---|---|---|---|---|---|---|---|
| Retail share of oncology sales | 37% | 38% | 39% | 38% | 37% | 39% | 43% | 45% | 44% | 41% |
| Retail oncology sales, in billions of dollars | $0.5 | $0.5 | $0.6 | $0.7 | $0.7 | $0.8 | $1.0 | $1.2 | $1.4 | $1.6 |
| Hospital share of oncology sales | 63% | 62% | 61% | 62% | 63% | 61% | 57% | 55% | 56% | 59% |
| Hospital oncology sales, in billions of dollars | $0.9 | $0.9 | $1.0 | $1.0 | $1.2 | $1.3 | $1.3 | $1.5 | $1.8 | $2.3 |
Data source: PMPRB; IQVIA MIDAS® Database, 2010 to 2019. All rights reserved.
Oncology sales are divided evenly between oral and non-oral medicines
Oral medicines now account for 50% of oncology sales in Canada. This represents a notable shift since the start of the decade, driven in part by strong growth from new oral medicines that entered the market between 2014 and 2016.
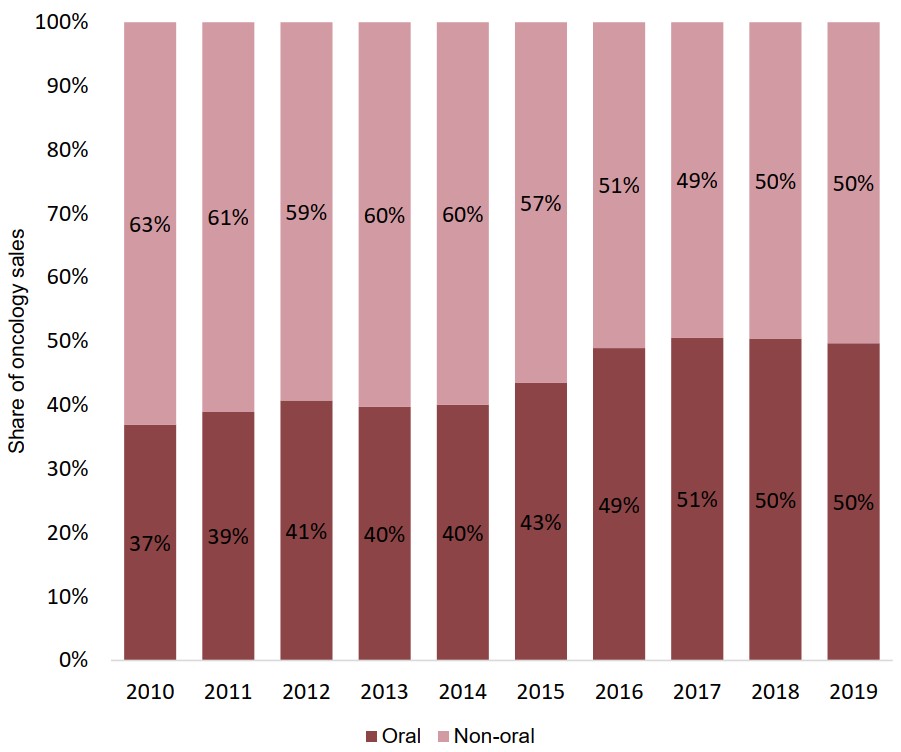
Figure description
A stacked bar graph illustrates the shares of total oncology sales held by oral and non-oral medicines from 2010 to 2019.
| 2010 | 2011 | 2012 | 2013 | 2014 | 2015 | 2016 | 2017 | 2018 | 2019 | |
|---|---|---|---|---|---|---|---|---|---|---|
| Oral share of oncology sales | 37% | 39% | 41% | 40% | 40% | 43% | 49% | 51% | 50% | 50% |
| Non-oral share of oncology sales | 63% | 61% | 59% | 60% | 60% | 57% | 51% | 49% | 50% | 50% |
Data source: PMPRB; IQVIA MIDAS® Database, 2010 to 2019. All rights reserved.
Biologics represent an increasing share of the oncology market
From 2010 to 2016, sales of biologic medicines consistently accounted for just under one third of the oncology market. This share has grown in recent years, reaching 41% in 2019.
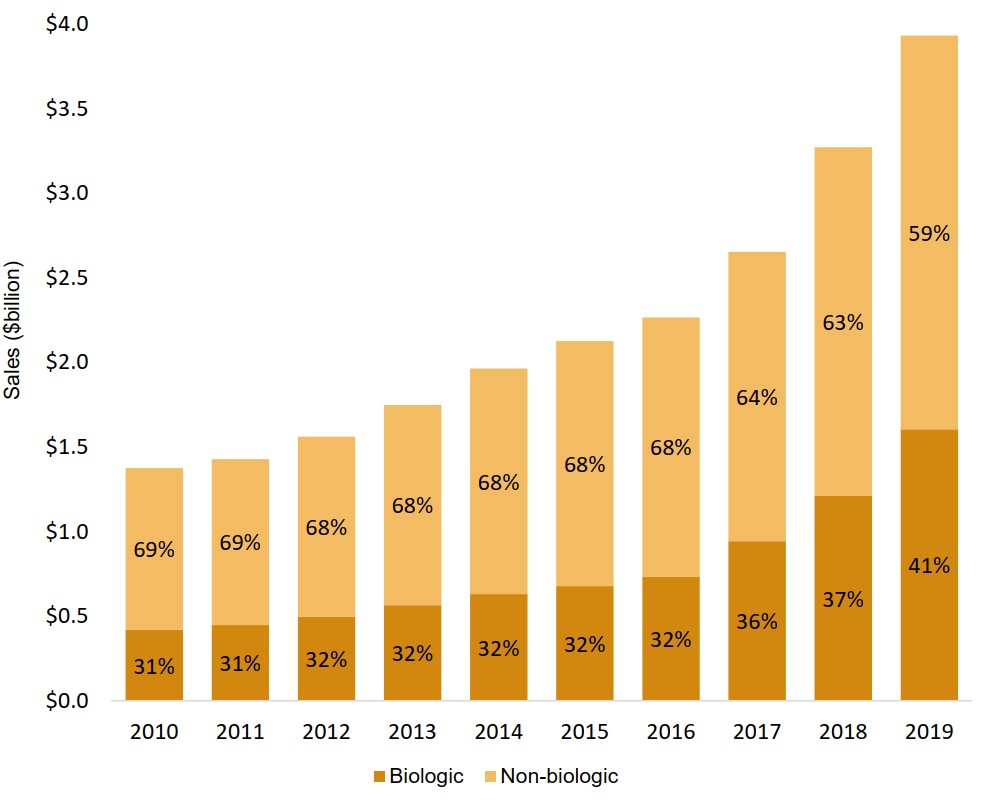
Figure description
A stacked bar graph illustrates the biologic and non-biologic shares of total oncology sales from 2010 to 2019. Results are given as a percentage share as well as in billions of dollars.
| 2010 | 2011 | 2012 | 2013 | 2014 | 2015 | 2016 | 2017 | 2018 | 2019 | |
|---|---|---|---|---|---|---|---|---|---|---|
| Biologic share of oncology sales | 31% | 31% | 32% | 32% | 32% | 32% | 32% | 36% | 37% | 41% |
| Biologic oncology sales, in billions of dollars | $0.4 | $ 0.5 | $0.5 | $0.6 | $0.6 | $0.7 | $0.7 | $0.9 | $1.2 | $1.6 |
| Non-biologic share of oncology sales | 69% | 69% | 68% | 68% | 68% | 68% | 68% | 64% | 63% | 59% |
| Non-biologic oncology sales, in billions of dollars | $1.0 | $1.0 | $1.1 | $1.2 | $1.3 | $1.5 | $1.5 | $1.7 | $2.1 | $2.3 |
| Total oncology sales, in billions of dollars | $1.4 | $1.4 | $1.6 | $1.8 | $2.0 | $2.1 | $2.3 | $2.75 | $3.3 | $3.9 |
Data source: PMPRB; IQVIA MIDAS® Database, 2010 to 2019. All rights reserved.
The oncology market has shifted towards drugs with higher treatment costs
Medicines with 28-day treatment costs over $7,500 represented 55% of Canadian oncology sales in 2019, a sharp increase from 16% in 2010.
The trend toward higher-cost medicines accelerated after 2016, contributing to the pace of growth in the overall oncology market.
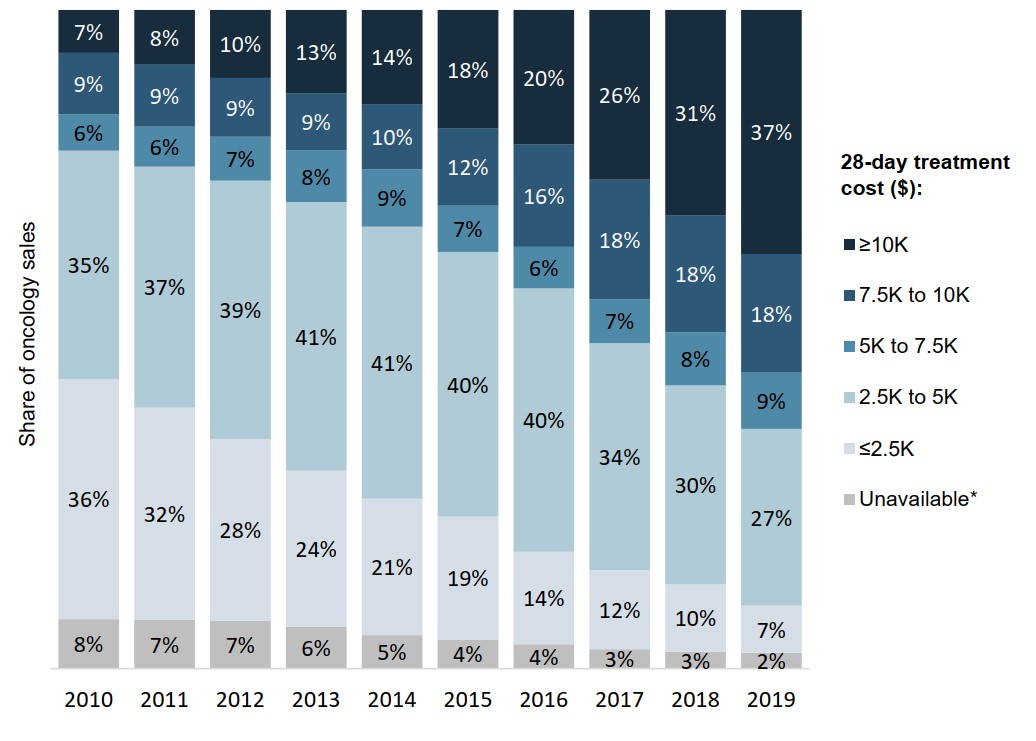
Figure description
A stacked bar graph gives the distribution of oncology sales by 28-day treatment cost from 2010 to 2019. Treatment costs are grouped into the following ranges: less than $2,500; $2,500 to $5,000; $5,000 to $7,500; $7,500 to $10,000; and greater than $10,000. A share is also given for medicines for which a treatment cost was unavailable.
| 2010 | 2011 | 2012 | 2013 | 2014 | 2015 | 2016 | 2017 | 2018 | 2019 | |
|---|---|---|---|---|---|---|---|---|---|---|
| Less than $2,500 | 36% | 32% | 28% | 24% | 21% | 19% | 14% | 12% | 10% | 7% |
| $2,500 to $5,000 | 35% | 37% | 39% | 41% | 41% | 40% | 40% | 34% | 30% | 27% |
| $5,000 to $7,500 | 6% | 6% | 7% | 8% | 9% | 7% | 6% | 7% | 8% | 9% |
| $7,500 to $10,000 | 9% | 9% | 9% | 9% | 10% | 12% | 16% | 18% | 18% | 18% |
| Greater than $10,000 | 7% | 8% | 10% | 13% | 14% | 18% | 20% | 26% | 31% | 37% |
| Treatment cost unavailable | 8% | 7% | 7% | 6% | 5% | 4% | 4% | 3% | 3% | 2% |
* Medicines for which a 28-day treatment cost was unavailable.
Data source: PMPRB; IQVIA MIDAS® Database, 2010 to 2019. All rights reserved.
Higher-cost medicines now make up the majority of top-selling oncology treatments
More than half of the highest-selling oncology medicines in 2019 had 28-day treatment costs over $7,500. By comparison, eight of the ten top-sellers in 2010 had treatment costs under $5,000.
The sales-weighted average treatment cost for the 10 highest-selling medicines rose from $3,715 in 2010 to $8,365 in 2019.
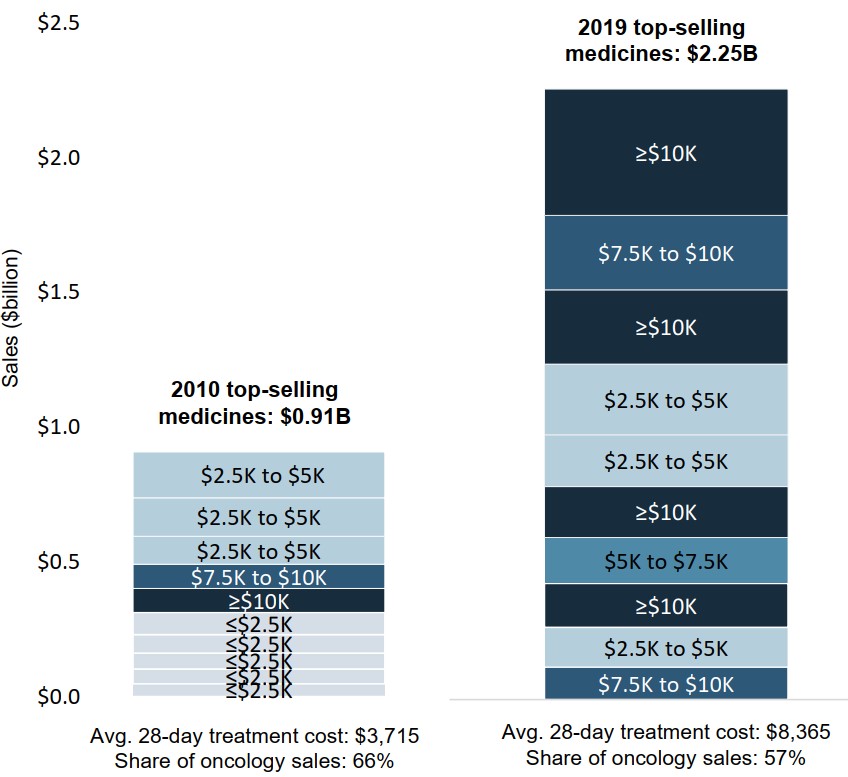
Figure description
A stacked bar graph compares the treatment costs of the top 10 oncology medicines in 2010 and 2019. Sales are also given in billions of dollars for each of the top-selling medicines. In 2010, the 10 top-selling medicines accounted for $0.91 billion or 66% of oncology sales, and the sales-weighted average 28-day treatment cost for these medicines was $3,715. In 2019, the top 10 medicines made up $2.25 billion or 57% of sales, and the sales-weighted average treatment cost was $8,365.
| Rank (by sales) | 2010 | 2019 | |
|---|---|---|---|
1 |
Cost |
$2,500 to $5,000 |
Greater than $10,000 |
Sales (billions) |
$0.17 |
$0.47 |
|
2 |
Cost |
$2,500 to $5,000 |
$7,500 to $10,000 |
Sales (billions) |
$0.14 |
$0.27 |
|
3 |
Cost |
$2,500 to $5,000 |
Greater than $10,000 |
Sales (billions) |
$0.10 |
$0.27 |
|
4 |
Cost |
$7,500 to $10,000 |
$2,500 to $5,000 |
Sales (billions) |
$0.09 |
$0.26 |
|
5 |
Cost |
Greater than $10,000 |
$2,500 to $5,000 |
Sales (billions) |
$0.09 |
$0.19 |
|
6 |
Cost |
Less than $2,500 |
Greater than $10,000 |
Sales (billions) |
$0.08 |
$0.19 |
|
7 |
Cost |
Less than $2,500 |
$5,000 to $7,500 |
Sales (billions) |
$0.07 |
$0.17 |
|
8 |
Cost |
Less than $2,500 |
Greater than $10,000 |
Sales (billions) |
$0.06 |
$0.16 |
|
9 |
Cost |
Less than $2,500 |
$2,500 to $5,000 |
Sales (billions) |
$0.06 |
$0.15 |
|
10 |
Cost |
Less than $2,500 |
$7,500 to $10,000 |
Sales (billions) |
$0.05 |
$0.12 |
|
Data source: PMPRB; IQVIA MIDAS® Database, 2010 and 2019. All rights reserved.
The oncology market is largely driven by new medicines, many of which are high-cost
Nearly 40% of overall sales for oncology medicines in 2019 were new medicines with treatment costs over $7,500.
Medicines introduced since 2011 accounted for 58% of sales in the oncology market in 2019. By comparison, the same period of launches accounted for only 24% of non-oncology sales.
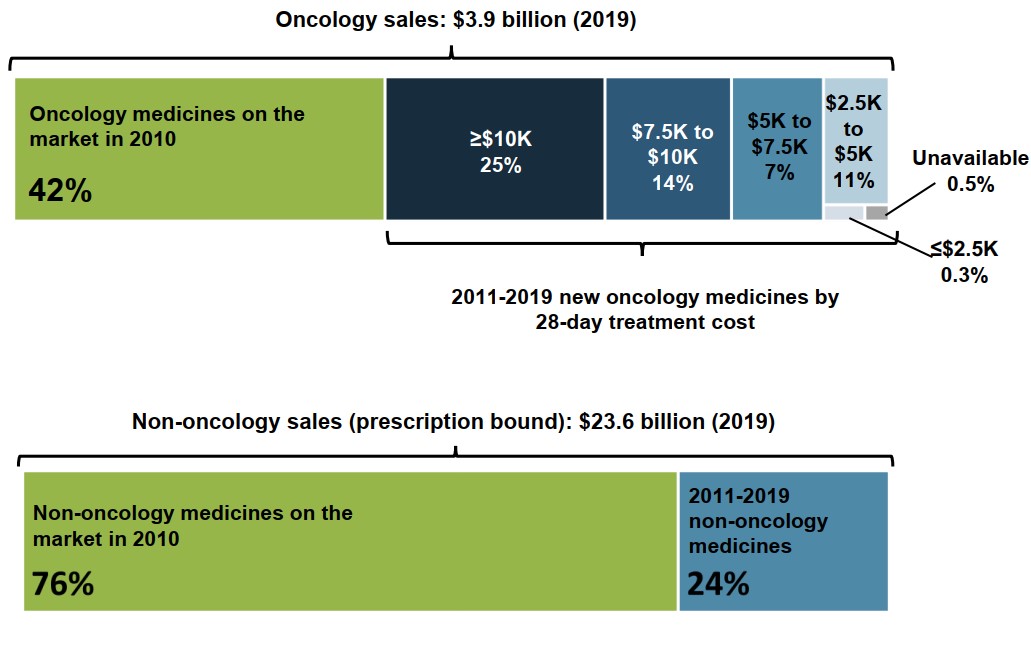
Figure description
A treemap chart illustrates the distribution of 2019 oncology sales by year of first sale and 28-day treatment cost. Oncology sales in 2019 totalled $3.9 billion.
| Share of 2019 sales | ||
|---|---|---|
| Oncology medicines on the market in 2010 | 42% | |
| Oncology medicines with first sales between 2011 and 2019 | Treatment cost: greater than $10,000 | 25% |
| Treatment cost: $7,500 to $10,000 | 14% | |
| Treatment cost: $5,000 to $7,500 | 7% | |
| Treatment cost: $2,500 to $5,000 | 11% | |
| Treatment cost: less than $2,500 | 0.3% | |
| Treatment cost unavailable | 0.5% | |
A second treemap gives the distribution of prescription non-oncology sales by launch year. Sales for these medicines totalled $23.6 billion in 2019.
| Share of 2019 non-oncology sales | |
|---|---|
| Non-oncology medicines on the market in 2010 | 76% |
| Non-oncology medicines with first sales between 2011 and 2019 | 24% |
Note: Launch is based on year of first sale, subject to availability of data.
Data source: PMPRB; IQVIA MIDAS® Database, 2019. All rights reserved.
3. Private Drug Plan Spending in Canada
This section considers how trends observed in the national market are reflected in Canadian private drug plan claims, including the increasing share of oncology medicines as a portion of total drug costs and the shift toward more expensive therapies.
While intravenous chemotherapy is publicly funded in all provinces, reimbursement of oral oncology medicines differs across jurisdictions.
As a result, private plan claims for oncology medicines are heavily skewed toward oral dosage forms and vary from province to province as a share of total private plan drug costs.
Cost per claim growth for oncology medicines has outpaced other areas
The average drug cost per claim for oncology medicines in private plans almost doubled between 2010 and 2019. Non-oncology costs per claim grew by 5% over the same period.
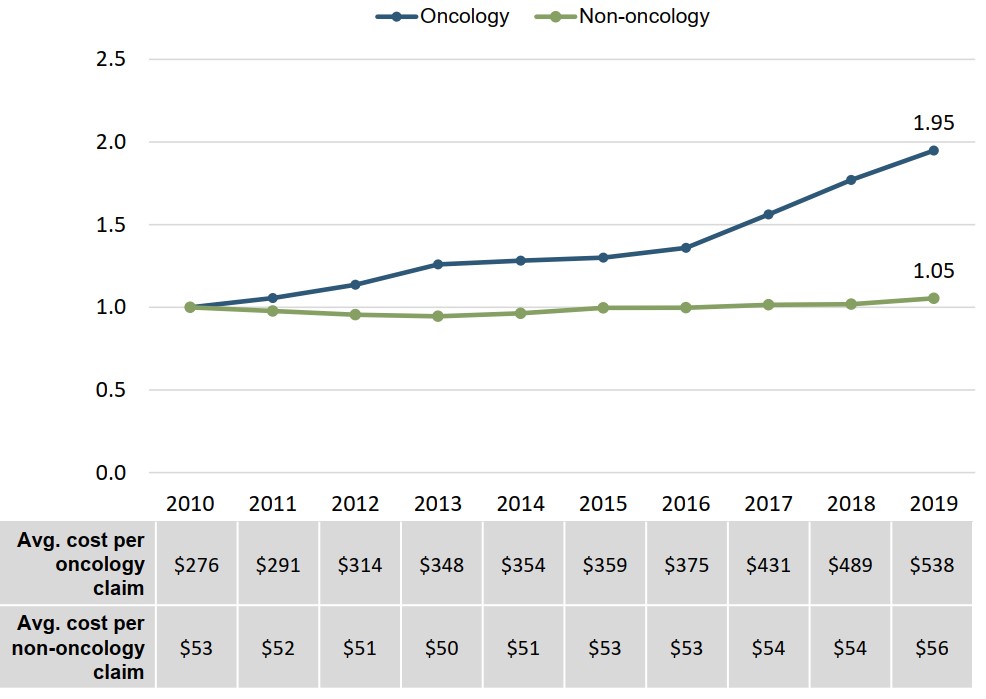
Figure description
A line graph shows the trends in the average drug cost per claim in Canada’s private drug plans for oncology and non-oncology medicines from 2010 to 2019, indexed to the cost in 2010. A table below the graph gives the average cost per claim for each year.
| 2010 | 2011 | 2012 | 2013 | 2014 | 2015 | 2016 | 2017 | 2018 | 2019 | |
|---|---|---|---|---|---|---|---|---|---|---|
| Oncology: cost ratio | 1.00 | 1.06 | 1.14 | 1.26 | 1.28 | 1.30 | 1.36 | 1.56 | 1.77 | 1.95 |
| Oncology: cost per claim | $276 | $291 | $314 | $348 | $354 | $359 | $375 | $431 | $489 | $538 |
| Non-oncology: cost ratio | 1.00 | 0.98 | 0.96 | 0.95 | 0.96 | 1.00 | 1.00 | 1.02 | 1.02 | 1.05 |
| Non-oncology: cost per claim | $53 | $52 | $51 | $50 | $51 | $53 | $53 | $54 | $54 | $56 |
Note: Indexed figures are reported with the cost per claim in 2010 set to a value of 1.00.
Data source: IQVIA Private Pay Direct Drug Plan Database, 2010 to 2019.
Biologic and oral oncology medicines represent a consistent share of drug costs
Whereas national trends indicate a notable rise in the share of biologic and oral oncology medicines, private plan results have remained relatively stable over the past decade.
Biologic medicines accounted for 13% of oncology drug costs in private plans in 2019, compared to 41% of the overall Canadian oncology market. Oral medicines continued to account for approximately 80% of costs.
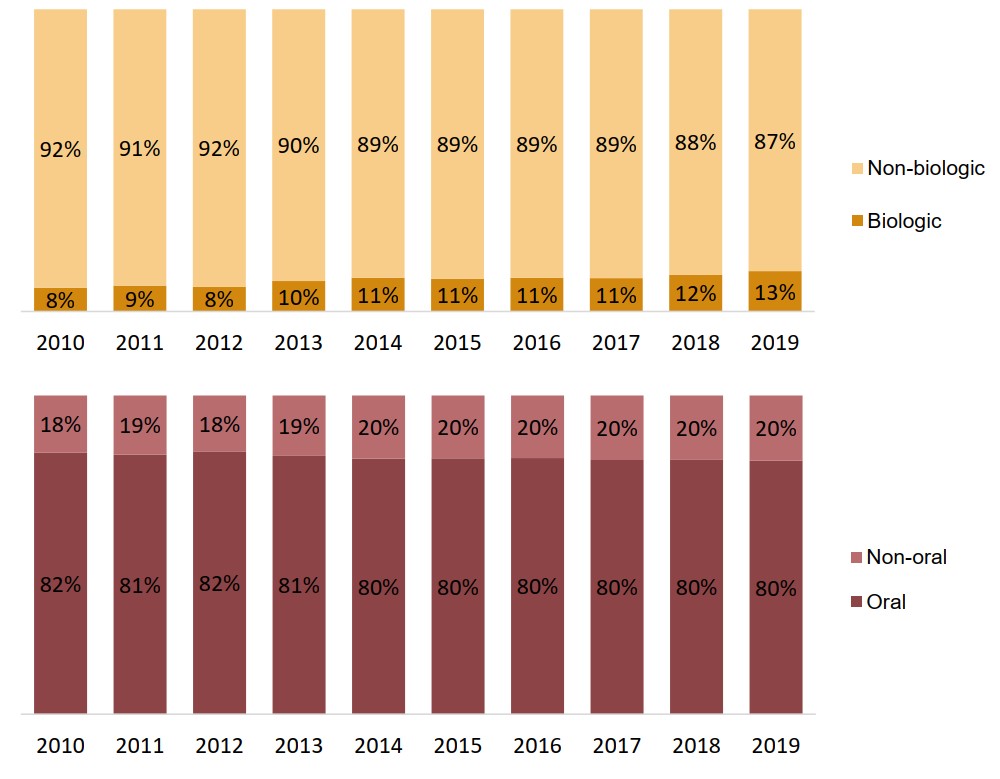
Figure description
Two stacked bar graphs illustrate the distribution of oncology drug costs in Canadian private drug plans by a) biologic and non-biologic medicines and b) oral and non-oral medicines. Results are given annually from 2010 to 2019.
a) Biologic share of oncology drug costs
| 2010 | 2011 | 2012 | 2013 | 2014 | 2015 | 2016 | 2017 | 2018 | 2019 | |
|---|---|---|---|---|---|---|---|---|---|---|
| Biologic | 8% | 9% | 8% | 10% | 11% | 11% | 11% | 11% | 12% | 13% |
| Non-biologic | 92% | 91% | 92% | 90% | 89% | 89% | 89% | 89% | 88% | 87% |
b) Oral share of oncology drug costs
| 2010 | 2011 | 2012 | 2013 | 2014 | 2015 | 2016 | 2017 | 2018 | 2019 | |
|---|---|---|---|---|---|---|---|---|---|---|
| Oral | 82% | 81% | 82% | 81% | 80% | 80% | 80% | 80% | 80% | 80% |
| Non-oral | 18% | 19% | 18% | 19% | 20% | 20% | 20% | 20% | 20% | 20% |
Data source: IQVIA Private Pay Direct Drug Plan Database, 2010 to 2019.
The oncology share of private plan drug costs has doubled over the past decade
At the national level, oncology medicines accounted for 4.7% of private plan drug costs in 2019, up from 2.2% in 2010. With the exception of Manitoba, the oncology share increased in every province and territory.
Private plan oncology shares are lower in the western provinces, likely due to the level of public coverage of oral chemotherapy medicines in these jurisdictions.
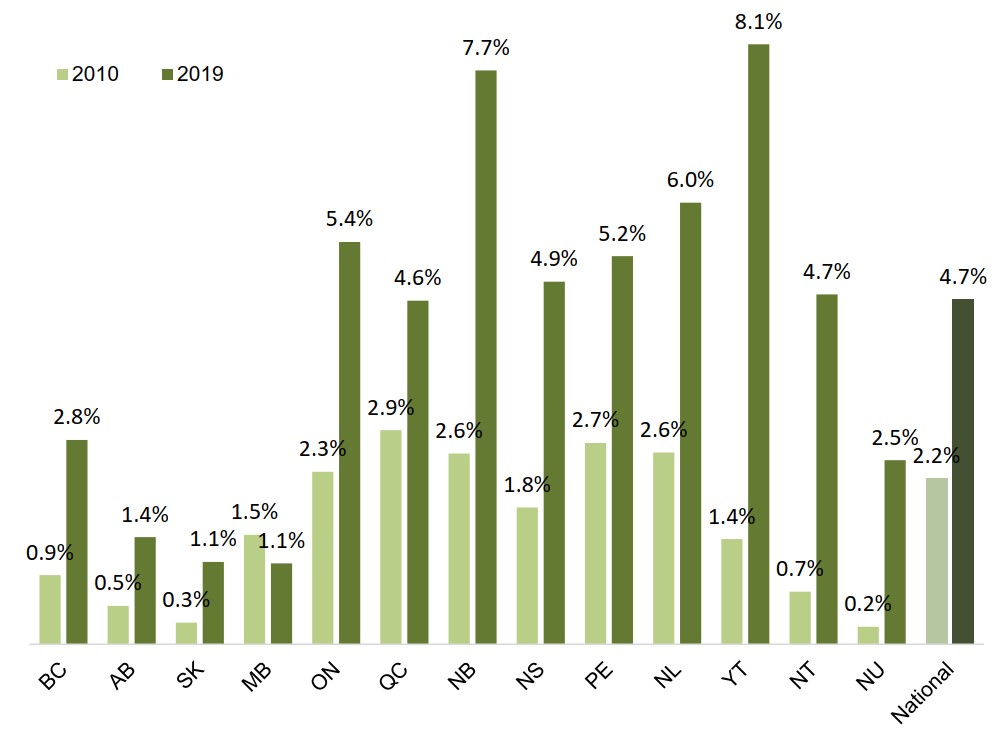
Figure description
A bar graph compares the oncology share of total drug costs for Canadian private drug plans in 2010 and 2019. Results are given by province or territory as well as a national total.
| 2010 | 2019 | |
|---|---|---|
| British Columbia | 0.9% | 2.8% |
| Alberta | 0.5% | 1.4% |
| Saskatchewan | 0.3% | 1.1% |
| Manitoba | 1.5% | 1.1% |
| Ontario | 2.3% | 5.4% |
| Quebec | 2.9% | 4.6% |
| New Brunswick | 2.6% | 7.7% |
| Nova Scotia | 1.8% | 4.9% |
| Prince Edward Island | 2.7% | 5.2% |
| Newfoundland and Labrador | 2.6% | 6.0% |
| Yukon | 1.4% | 8.1% |
| Northwest Territories | 0.7% | 4.7% |
| Nunavut | 0.2% | 2.5% |
| National | 2.2% | 4.7% |
Data source: IQVIA Private Pay Direct Drug Plan Database, 2010 to 2019.
Higher-cost oncology medicines command a growing share of private plan costs
Mirroring the trends observed in the national market, oncology medicines with higher treatment costs account for an increasing share of drug costs in private plans.
In 2019, medicines with 28-day treatment costs exceeding $7,500 made up 43% of private plan oncology drug costs, compared to 17% in 2010.
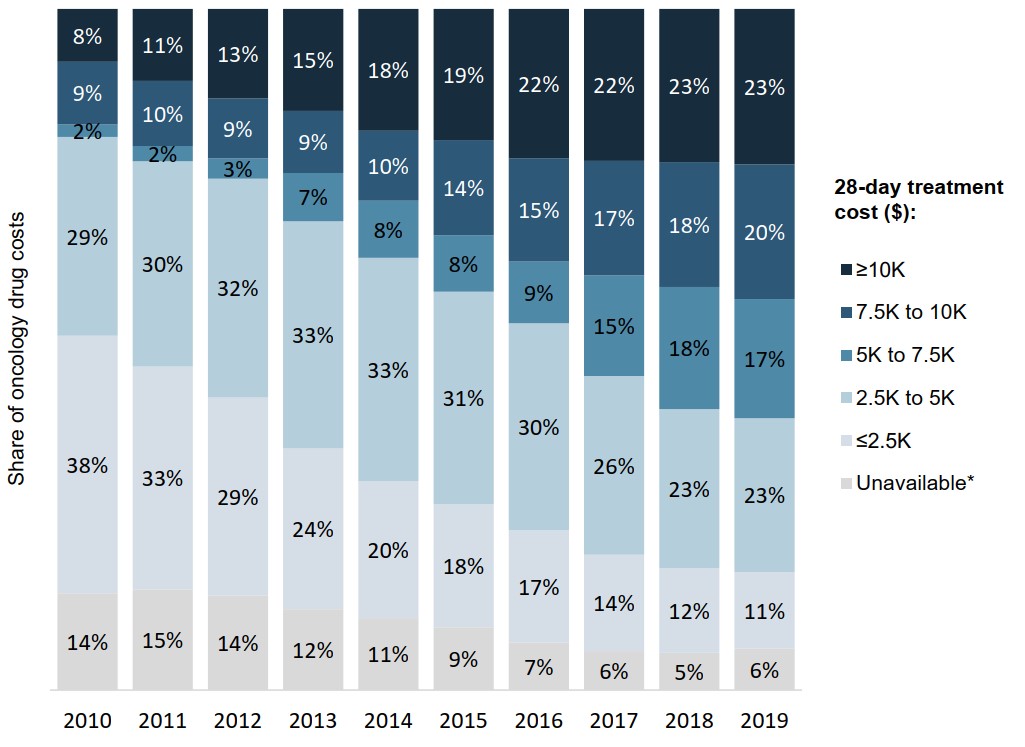
Figure description
A stacked bar graph depicts the distribution of total oncology medicine sales in Canadian private drug plans by 28-day treatment cost from 2010 to 2019.Treatment costs are grouped into the following ranges: less than $2,500; $2,500 to $5,000; $5,000 to $7,500; $7,500 to $10,000; and greater than $10,000. A share is also given for medicines for which a treatment cost was unavailable.
| 2010 | 2011 | 2012 | 2013 | 2014 | 2015 | 2016 | 2017 | 2018 | 2019 | |
|---|---|---|---|---|---|---|---|---|---|---|
| Less than $2,500 | 38% | 33% | 29% | 24% | 20% | 18% | 17% | 14% | 12% | 11% |
| $2,500 to $5,000 | 29% | 30% | 32% | 33% | 33% | 31% | 30% | 26% | 23% | 23% |
| $5,000 to $7,500 | 2% | 2% | 3% | 7% | 8% | 8% | 9% | 15% | 18% | 17% |
| $7,500 to $10,000 | 9% | 10% | 9% | 9% | 10% | 14% | 15% | 17% | 18% | 20% |
| Greater than $10,000 | 8% | 11% | 13% | 15% | 18% | 19% | 22% | 22% | 23% | 23% |
| Treatment cost unavailable | 14% | 15% | 14% | 12% | 11% | 9% | 7% | 6% | 5% | 6% |
* Medicines for which a 28-day treatment cost was unavailable.
Data source: IQVIA Private Pay Direct Drug Plan Database, 2010 to 2019.